RISULTATI AL 31 DICEMBRE 2007 - BNP Paribas
RISULTATI AL 31 DICEMBRE 2007 - BNP Paribas
RISULTATI AL 31 DICEMBRE 2007 - BNP Paribas

Create successful ePaper yourself
Turn your PDF publications into a flip-book with our unique Google optimized e-Paper software.
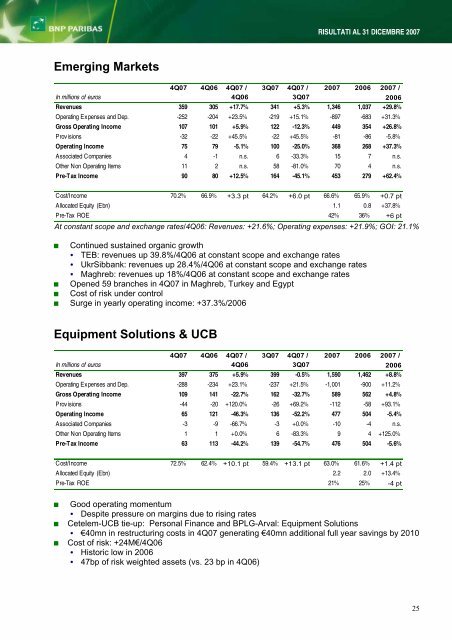
Emerging Markets<br />
<strong>RISULTATI</strong> <strong>AL</strong> <strong>31</strong> <strong>DICEMBRE</strong> <strong>2007</strong><br />
4Q07 4Q06 4Q07 / 3Q07 4Q07 / <strong>2007</strong> 2006 <strong>2007</strong> /<br />
In millions of euros 4Q06 3Q07 2006<br />
Revenues 359 305 +17.7% 341 +5.3% 1,346 1,037 +29.8%<br />
Operating Expenses and Dep. -252 -204 +23.5% -219 +15.1% -897 -683 +<strong>31</strong>.3%<br />
Gross Operating Income 107 101 +5.9% 122 -12.3% 449 354 +26.8%<br />
Provisions -32 -22 +45.5% -22 +45.5% -81 -86 -5.8%<br />
Operating Income 75 79 -5.1% 100 -25.0% 368 268 +37.3%<br />
Associated Companies 4 -1 n.s. 6 -33.3% 15 7 n.s.<br />
Other Non Operating Items 11 2 n.s. 58 -81.0% 70 4 n.s.<br />
Pre-Tax Income 90 80 +12.5% 164 -45.1% 453 279 +62.4%<br />
Cost/Income 70.2% 66.9% +3.3 pt 64.2% +6.0 pt 66.6% 65.9% +0.7 pt<br />
Allocated Equity (Ebn) 1.1 0.8 +37.8%<br />
Pre-Tax ROE 42% 36% +6 pt<br />
At constant scope and exchange rates/4Q06: Revenues: +21.6%; Operating expenses: +21.9%; GOI: 21.1%<br />
Continued sustained organic growth<br />
TEB: revenues up 39.8%/4Q06 at constant scope and exchange rates<br />
UkrSibbank: revenues up 28.4%/4Q06 at constant scope and exchange rates<br />
Maghreb: revenues up 18%/4Q06 at constant scope and exchange rates<br />
Opened 59 branches in 4Q07 in Maghreb, Turkey and Egypt<br />
Cost of risk under control<br />
Surge in yearly operating income: +37.3%/2006<br />
Equipment Solutions & UCB<br />
4Q07 4Q06 4Q07 / 3Q07 4Q07 / <strong>2007</strong> 2006 <strong>2007</strong> /<br />
In millions of euros 4Q06 3Q07 2006<br />
Revenues 397 375 +5.9% 399 -0.5% 1,590 1,462 +8.8%<br />
Operating Expenses and Dep. -288 -234 +23.1% -237 +21.5% -1,001 -900 +11.2%<br />
Gross Operating Income 109 141 -22.7% 162 -32.7% 589 562 +4.8%<br />
Provisions -44 -20 +120.0% -26 +69.2% -112 -58 +93.1%<br />
Operating Income 65 121 -46.3% 136 -52.2% 477 504 -5.4%<br />
Associated Companies -3 -9 -66.7% -3 +0.0% -10 -4 n.s.<br />
Other Non Operating Items 1 1 +0.0% 6 -83.3% 9 4 +125.0%<br />
Pre-Tax Income 63 113 -44.2% 139 -54.7% 476 504 -5.6%<br />
Cost/Income 72.5% 62.4% +10.1 pt 59.4% +13.1 pt 63.0% 61.6% +1.4 pt<br />
Allocated Equity (Ebn) 2.2 2.0 +13.4%<br />
Pre-Tax ROE 21% 25% -4 pt<br />
Good operating momentum<br />
Despite pressure on margins due to rising rates<br />
Cetelem-UCB tie-up: Personal Finance and BPLG-Arval: Equipment Solutions<br />
€40mn in restructuring costs in 4Q07 generating €40mn additional full year savings by 2010<br />
Cost of risk: +24M€/4Q06<br />
Historic low in 2006<br />
47bp of risk weighted assets (vs. 23 bp in 4Q06)<br />
25