Statistical Yearbook of Georgia: 2011 - GeoStat.Ge
Statistical Yearbook of Georgia: 2011 - GeoStat.Ge
Statistical Yearbook of Georgia: 2011 - GeoStat.Ge

Create successful ePaper yourself
Turn your PDF publications into a flip-book with our unique Google optimized e-Paper software.
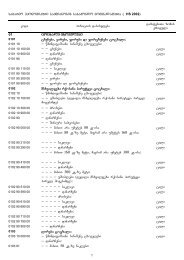
9<br />
erovnuli angariSebi — NATIONAL ACCOUNTS<br />
9.10. mTliani Sida produqti danaxarjebis mixedviT<br />
(mimdinare fasebSi; mln. lari)<br />
USE OF GROSS DOMESTIC PRODUCT<br />
(at current prices; mln. GEL)<br />
2005 2006 2007 2008 2009<br />
mTliani damatebuli Rirebuleba sabaziso<br />
fasebSi<br />
10 284.5 12 046.9 14 611.1 16 521.8 15 546.3<br />
Gross value added at basic prices<br />
gadasaxadebi produqciaze<br />
Taxes on products<br />
1 397.3 1 800.6 2 454.3 2 639.3 2 530.9<br />
subsidiebi produqciaze(-)<br />
Subsidies on products(-)<br />
60.8 57.6 71.6 86.3 91.3<br />
mTliani Sida produqti sabazro fasebSi<br />
Gross domestic product at market prices<br />
11 620.9 13 789.9 16 993.8 19 074.9 17 986.0<br />
mTliani Sida produqtis gamoyeneba<br />
Use <strong>of</strong> gross domestic product<br />
saboloo moxmarebis xarjebi<br />
Final consumption expenditures<br />
9794.1 12972.0 15 731.9 19 595.8 19 075.2<br />
Sinameurneobebis<br />
Households<br />
7719.7 10803.5 11 952.7 14 582.3 14 600.4<br />
Sinameurneobebis momsaxure arakomerciuli<br />
organizaciebis<br />
60.5 52.4 61.3 77.2 75.4<br />
Non-pr<strong>of</strong>it institutions serving households<br />
saxelmwifo marTvis organoebis<br />
<strong>Ge</strong>neral government<br />
2014.0 2116.0 3 717.9 4 936.3 4 399.5<br />
individualur saqonelsa da momsaxurebaze<br />
For Individual goods and services<br />
978.6 640.0 714.7 866.0 900.5<br />
koleqtiur momsaxurebaze<br />
For collective services<br />
1035.3 1476.0 3 003.2 4 070.2 3 499.0<br />
mTliani kapitalis formireba<br />
Gross capital formation<br />
3891.5 4255.3 5 447.5 4 951.6 2 342.9<br />
ZiriTadi kapitalis mTliani formireba<br />
Gross fixed capital formation<br />
3261.4 3524.2 4 370.5 4 098.5 2 755.4<br />
maragebis cvlileba<br />
Changes in inventories<br />
630.1 731.1 1 077.0 853.1 -412.5<br />
saqonlisa da momsaxurebis eqsporti<br />
Exports <strong>of</strong> goods and services<br />
3921.9 4532.1 5 303.0 5 459.2 5 348.9<br />
saqonlis eqsporti<br />
Exports <strong>of</strong> goods<br />
2665.7 2956.2 3 479.5 3 586.5 3 163.5<br />
momsaxurebis eqsporti<br />
Exports <strong>of</strong> services<br />
1256.2 1576.0 1 823.6 1 872.7 2 185.5<br />
saqonlisa da momsaxurebis importi<br />
Imports <strong>of</strong> goods and services<br />
5992.7 7862.6 9 848.0 11 140.4 8 801.3<br />
saqonlis importi<br />
Imports <strong>of</strong> goods<br />
4861.2 6573.8 8 295.2 9 303.7 7 172.9<br />
momsaxurebis importi<br />
Imports <strong>of</strong> services<br />
1131.4 1288.7 1 552.8 1 836.7 1 628.4<br />
statistikuri gansxvaveba<br />
<strong>Statistical</strong> discrepancy<br />
6.0 -106.9 359.3 208.6 20.2<br />
mTliani Sida produqti sabazro fasebSi<br />
Gross domestic product at market prices<br />
11 620.9 13 789.9 16 993.8 19 074.9 17 986.0<br />
2010<br />
18 014.4<br />
2 834.3<br />
105.3<br />
20 743.4<br />
19 898.2<br />
15 418.0<br />
109.2<br />
4 371.0<br />
1 066.5<br />
3 304.5<br />
4 477.7<br />
4 009.0<br />
468.7<br />
7 250.0<br />
4 389.5<br />
2 860.5<br />
10 945.1<br />
9 007.0<br />
1 938.1<br />
62.6<br />
20 743.4<br />
124