listino mensile dei prezzi - Camera di Commercio di Ravenna
listino mensile dei prezzi - Camera di Commercio di Ravenna
listino mensile dei prezzi - Camera di Commercio di Ravenna

You also want an ePaper? Increase the reach of your titles
YUMPU automatically turns print PDFs into web optimized ePapers that Google loves.
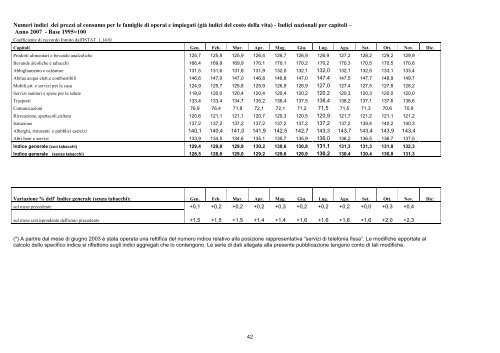
Numeri in<strong>di</strong>ci <strong>dei</strong> <strong>prezzi</strong> al consumo per le famiglie <strong>di</strong> operai e impiegati (già in<strong>di</strong>ci del costo della vita) - In<strong>di</strong>ci nazionali per capitoli –<br />
Anno 2007 - Base 1995=100<br />
Coefficiente <strong>di</strong> raccordo fornito dall'ISTAT 1,1410<br />
Capitoli Gen. Feb. Mar. Apr. Mag. Giu. Lug. Ago. Set. Ott. Nov. Dic.<br />
Prodotti alimentari e bevande analcoliche 125,7 125,8 125,9 126,4 126,7 126,9 126,9 127,2 128,2 129,2 129,9<br />
Bevande alcoliche e tabacchi 166,4 169,8 169,9 170,1 170,1 170,2 170,2 170,3 170,5 170,5 170,6<br />
Abbigliamento e calzature 131,5 131,6 131,8 131,9 132,0 132,1 132,0 132,1 132,5 133,1 133,4<br />
Abitaz.acqua elett.e combustibili 146,6 147,0 147,0 146,8 146,8 147,0 147,4 147,5 147,7 148,9 149,7<br />
Mobili,art. e servizi per la casa 124,9 125,7 125,8 125,9 126,9 126,9 127,0 127,4 127,5 127,6 128,2<br />
Servizi sanitari e spese per la salute 118,9 120,0 120,4 120,4 120,4 120,2 120,2 120,3 120,3 120,0 120,0<br />
Trasporti 133,4 133,4 134,7 135,2 136,4 137,5 138,4 138,2 137,1 137,6 138,6<br />
Comunicazioni 76,9 76,4 71,8 72,1 72,1 71,2 71,5 71,5 71,3 70,6 70,9<br />
Ricreazione, spettacoli,cultura 120,6 121,1 121,1 120,7 120,3 120,5 120,9 121,7 121,2 121,1 121,2<br />
Istruzione 137,2 137,2 137,2 137,2 137,2 137,2 137,2 137,2 139,4 140,2 140,3<br />
Alberghi, ristoranti e pubblici esercizi 140,1 140,4 141,0 141,9 142,5 142,7 143,3 143,7 143,4 143,9 143,4<br />
Altri beni e servizi 133,9 134,5 134,6 135,1 135,7 135,9 136,0 136,2 136,5 136,7 137,5<br />
In<strong>di</strong>ce generale (con tabacchi) 129,4 129,8 129,9 130,2 130,6 130,8 131,1 131,3 131,3 131,8 132,3<br />
In<strong>di</strong>ce generale (senza tabacchi) 128,5 128,8 129,0 129,2 129,6 129,9 130,2 130,4 130,4 130,8 131,3<br />
Variazione % dell' In<strong>di</strong>ce generale (senza tabacchi): Gen. Feb. Mar. Apr. Mag. Giu. Lug. Ago. Set. Ott. Nov. Dic.<br />
sul mese precedente +0,1 +0,2 +0,2 +0,2 +0,3 +0,2 +0,2 +0,2 +0,0 +0,3 +0,4<br />
sul mese corrispondente dell'anno precedente +1,5 +1,5 +1,5 +1,4 +1,4 +1,6 +1,6 +1,6 +1,6 +2,0 +2,3<br />
(*) A partire dal mese <strong>di</strong> giugno 2003 è stata operata una rettifica del numero in<strong>di</strong>ce relativo alla posizione rappresentativa “servizi <strong>di</strong> telefonia fissa”. Le mo<strong>di</strong>fiche apportate al<br />
calcolo dello specifico in<strong>di</strong>ce si riflettono sugli in<strong>di</strong>ci aggregati che lo contengono. Le serie <strong>di</strong> dati allegate alla presente pubblicazione tengono conto <strong>di</strong> tali mo<strong>di</strong>fiche.<br />
42