Piano di Zona Del Distretto di Broni Triennio 2009/2011 - Fnp – Cisl ...
Piano di Zona Del Distretto di Broni Triennio 2009/2011 - Fnp – Cisl ...
Piano di Zona Del Distretto di Broni Triennio 2009/2011 - Fnp – Cisl ...

Create successful ePaper yourself
Turn your PDF publications into a flip-book with our unique Google optimized e-Paper software.
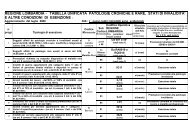
PopolazioneComunaleFemmine e maschi.Co<strong>di</strong>ce Comuni CLASSI DI ETA'Istat 0-5 6-10 11-14 15-19 20-24 25-29 30-59 60-64 65 e + Totale18002 Albaredo Arnabol<strong>di</strong> 10 8 4 9 6 10 99 13 47 20618005 Arena Po 69 62 51 80 83 83 715 81 422 1.64618020 Bosnasco 19 22 19 21 26 29 274 52 157 61918024 <strong>Broni</strong> 441 290 277 343 382 540 4.100 559 2.607 9.53918026 Campospinoso 31 23 28 25 33 35 383 50 258 86618028 Canevino 5 2 2 0 5 5 49 14 46 12818029 Canneto Pavese 58 48 41 55 53 68 636 81 393 1.43318036 Castana 20 28 24 20 26 31 322 59 221 75118049 Cigognola 38 41 46 45 46 80 617 88 387 1.38818074 Golferenzo 3 7 7 8 5 10 88 20 79 22718082 Lirio 7 1 3 6 9 6 61 6 49 14818096 Montecalvo Versiggia 28 23 20 14 22 31 246 28 168 58018097 Montescano 15 10 7 21 16 21 191 21 105 40718100 Montu' Beccaria 92 68 44 67 78 76 789 103 498 1.81518111 Pietra de' Giorgi 40 38 24 44 28 35 412 49 233 90318118 Portalbera 82 80 54 74 56 77 704 76 310 1.51318120 Redavalle 47 28 30 24 50 60 440 76 294 1.04918125 Rocca de' Giorgi 5 2 2 4 6 4 44 9 11 8718131 Rovescala 41 38 17 23 39 57 356 61 316 94818132 Ruino 19 25 15 19 22 33 288 59 284 76418133 San Cipriano Po 26 13 19 17 31 42 223 19 103 49318134 San Damiano al Colle 15 25 25 17 37 43 305 47 236 75018143 Santa Maria della Versa 117 100 68 92 116 139 1.144 129 703 2.60818153 Stradella 510 404 351 433 507 617 5.100 661 2.842 11.42518183 Volpara 4 7 2 4 2 10 52 7 41 12918187 Zenevredo 26 24 20 16 16 25 213 27 105 472Totale comuni selezionati 1.768 1.417 1.200 1.481 1.700 2.167 17.851 2.395 10.915 40.894Totale Lombar<strong>di</strong>a 561.132 442.448 334.624 424.861 445.363 557.542 4.395.027 566.528 1.914.881 9.642.406Nella tabella che segue si comparano i dati dell’intera popolazione nelle tre annualità, sud<strong>di</strong>viseper fasce <strong>di</strong> età:CLASSI DI ETA'ANNO Comuni 0-5 6-10 11-14 15-19 20-24 25-29 30-59 60-64 65 e + Totale2006 <strong>Distretto</strong> <strong>di</strong> <strong>Broni</strong> 1.607 1.329 1.102 1.434 1.612 2.216 17.373 2.312 10.899 39.8842007 <strong>Distretto</strong> <strong>di</strong> <strong>Broni</strong> 1.649 1.350 1.144 1.443 1.589 2.135 17.478 2.317 10.973 40.0782008 <strong>Distretto</strong> <strong>di</strong> <strong>Broni</strong> 1.768 1.417 1.200 1.481 1.700 2.167 17.851 2.395 10.915 40.894In tutte le fasce <strong>di</strong> età, ed in ciascun anno, l’aumento è abbastanza contenuto ed in linea con il datototale della popolazione <strong>di</strong>strettuale.Se poi accorpiamo ulteriormente le fasce <strong>di</strong> età, emerge questo dato:<strong>Piano</strong> <strong>di</strong> <strong>Zona</strong> <strong>2009</strong> - <strong>2011</strong>10<strong>Distretto</strong> <strong>di</strong> <strong>Broni</strong>