c - participação do iefp na política global de
c - participação do iefp na política global de
c - participação do iefp na política global de

You also want an ePaper? Increase the reach of your titles
YUMPU automatically turns print PDFs into web optimized ePapers that Google loves.
INSTITUTO DO EMPREGO E FORMAÇÃO PROFISSIONAL, I.P.<br />
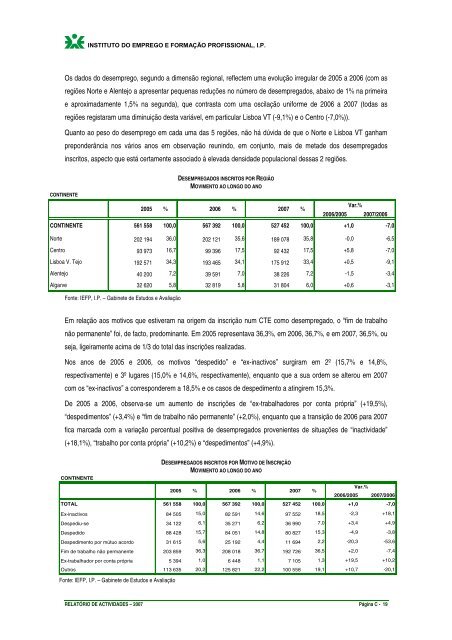
Os da<strong>do</strong>s <strong>do</strong> <strong>de</strong>semprego, segun<strong>do</strong> a dimensão regio<strong>na</strong>l, reflectem uma evolução irregular <strong>de</strong> 2005 a 2006 (com as<br />
regiões Norte e Alentejo a apresentar peque<strong>na</strong>s reduções no número <strong>de</strong> <strong>de</strong>semprega<strong>do</strong>s, abaixo <strong>de</strong> 1% <strong>na</strong> primeira<br />
e aproximadamente 1,5% <strong>na</strong> segunda), que contrasta com uma oscilação uniforme <strong>de</strong> 2006 a 2007 (todas as<br />
regiões registaram uma diminuição <strong>de</strong>sta variável, em particular Lisboa VT (-9,1%) e o Centro (-7,0%)).<br />
Quanto ao peso <strong>do</strong> <strong>de</strong>semprego em cada uma das 5 regiões, não há dúvida <strong>de</strong> que o Norte e Lisboa VT ganham<br />
prepon<strong>de</strong>rância nos vários anos em observação reunin<strong>do</strong>, em conjunto, mais <strong>de</strong> meta<strong>de</strong> <strong>do</strong>s <strong>de</strong>semprega<strong>do</strong>s<br />
inscritos, aspecto que está certamente associa<strong>do</strong> à elevada <strong>de</strong>nsida<strong>de</strong> populacio<strong>na</strong>l <strong>de</strong>ssas 2 regiões.<br />
CONTINENTE<br />
DESEMPREGADOS INSCRITOS POR REGIÃO<br />
MOVIMENTO AO LONGO DO ANO<br />
2005 % 2006 % 2007 %<br />
Var.%<br />
2006/2005 2007/2006<br />
CONTINENTE 561 558 100,0 567 392 100,0 527 452 100,0 +1,0 -7,0<br />
Norte 202 194 36,0 202 121 35,6 189 078 35,8 -0,0 -6,5<br />
Centro 93 973 16,7 99 396 17,5 92 432 17,5 +5,8 -7,0<br />
Lisboa V. Tejo 192 571 34,3 193 465 34,1 175 912 33,4 +0,5 -9,1<br />
Alentejo 40 200 7,2 39 591 7,0 38 226 7,2 -1,5 -3,4<br />
Algarve 32 620 5,8 32 819 5,8 31 804 6,0 +0,6 -3,1<br />
Fonte: IEFP, I.P. – Gabinete <strong>de</strong> Estu<strong>do</strong>s e Avaliação<br />
Em relação aos motivos que estiveram <strong>na</strong> origem da inscrição num CTE como <strong>de</strong>semprega<strong>do</strong>, o “fim <strong>de</strong> trabalho<br />
não permanente” foi, <strong>de</strong> facto, pre<strong>do</strong>mi<strong>na</strong>nte. Em 2005 representava 36,3%, em 2006, 36,7%, e em 2007, 36,5%, ou<br />
seja, ligeiramente acima <strong>de</strong> 1/3 <strong>do</strong> total das inscrições realizadas.<br />
Nos anos <strong>de</strong> 2005 e 2006, os motivos “<strong>de</strong>spedi<strong>do</strong>” e “ex-i<strong>na</strong>ctivos” surgiram em 2º (15,7% e 14,8%,<br />
respectivamente) e 3º lugares (15,0% e 14,6%, respectivamente), enquanto que a sua or<strong>de</strong>m se alterou em 2007<br />
com os “ex-i<strong>na</strong>ctivos” a correspon<strong>de</strong>rem a 18,5% e os casos <strong>de</strong> <strong>de</strong>spedimento a atingirem 15,3%.<br />
De 2005 a 2006, observa-se um aumento <strong>de</strong> inscrições <strong>de</strong> “ex-trabalha<strong>do</strong>res por conta própria” (+19,5%),<br />
“<strong>de</strong>spedimentos” (+3,4%) e “fim <strong>de</strong> trabalho não permanente” (+2,0%), enquanto que a transição <strong>de</strong> 2006 para 2007<br />
fica marcada com a variação percentual positiva <strong>de</strong> <strong>de</strong>semprega<strong>do</strong>s provenientes <strong>de</strong> situações <strong>de</strong> “i<strong>na</strong>ctivida<strong>de</strong>”<br />
(+18,1%), “trabalho por conta própria” (+10,2%) e “<strong>de</strong>spedimentos” (+4,9%).<br />
CONTINENTE<br />
DESEMPREGADOS INSCRITOS POR MOTIVO DE INSCRIÇÃO<br />
MOVIMENTO AO LONGO DO ANO<br />
2005 % 2006 % 2007 %<br />
Var.%<br />
2006/2005 2007/2006<br />
TOTAL 561 558 100,0 567 392 100,0 527 452 100,0 +1,0 -7,0<br />
Ex-i<strong>na</strong>ctivos 84 505 15,0 82 591 14,6 97 552 18,5 -2,3 +18,1<br />
Despediu-se 34 122 6,1 35 271 6,2 36 990 7,0 +3,4 +4,9<br />
Despedi<strong>do</strong> 88 428 15,7 84 051 14,8 80 827 15,3 -4,9 -3,8<br />
Despedimento por mútuo acor<strong>do</strong> 31 615 5,6 25 192 4,4 11 694 2,2 -20,3 -53,6<br />
Fim <strong>de</strong> trabalho não permanente 203 859 36,3 208 018 36,7 192 726 36,5 +2,0 -7,4<br />
Ex-trabalha<strong>do</strong>r por conta própria 5 394 1,0 6 448 1,1 7 105 1,3 +19,5 +10,2<br />
Outros 113 635 20,2 125 821 22,2 100 558 19,1 +10,7 -20,1<br />
Fonte: IEFP, I.P. – Gabinete <strong>de</strong> Estu<strong>do</strong>s e Avaliação<br />
RELATÓRIO DE ACTIVIDADES – 2007 Pági<strong>na</strong> C - 19