
You also want an ePaper? Increase the reach of your titles
YUMPU automatically turns print PDFs into web optimized ePapers that Google loves.
60,00%<br />
50,00%<br />
40,00%<br />
30,00%<br />
20,00%<br />
10,00%<br />
0,00%<br />
até 40 de 41 a<br />
60<br />
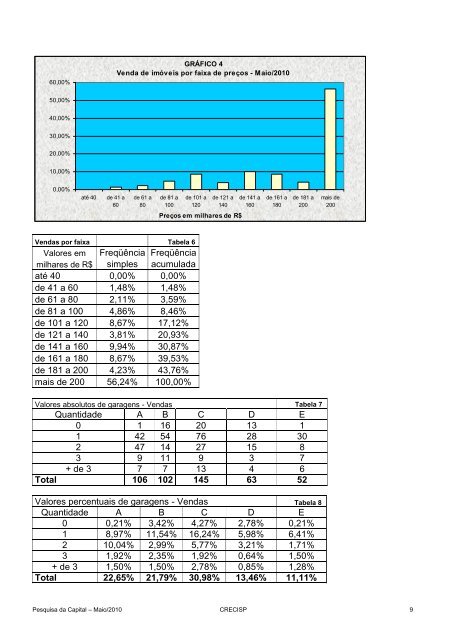
GRÁFICO 4<br />
Ven<strong>da</strong> de imóveis por faixa de preços - <strong>Maio</strong>/2010<br />
de 61 a<br />
80<br />
de 81 a<br />
100<br />
de 101 a<br />
120<br />
Ven<strong>da</strong>s por faixa Tabela 6<br />
Valores em Freqüência Freqüência<br />
milhares de R$ simples acumula<strong>da</strong><br />
até 40 0,00% 0,00%<br />
de 41 a 60 1,48% 1,48%<br />
de 61 a 80 2,11% 3,59%<br />
de 81 a 100 4,86% 8,46%<br />
de 101 a 120 8,67% 17,12%<br />
de 121 a 140 3,81% 20,93%<br />
de 141 a 160 9,94% 30,87%<br />
de 161 a 180 8,67% 39,53%<br />
de 181 a 200 4,23% 43,76%<br />
mais de 200 56,24% 100,00%<br />
de 121 a<br />
140<br />
Preços em milhares de R$<br />
de 141 a<br />
160<br />
de 161 a<br />
180<br />
de 181 a<br />
200<br />
Valores absolutos de garagens - Ven<strong>da</strong>s Tabela 7<br />
Quanti<strong>da</strong>de A B C D E<br />
0 1 16 20 13 1<br />
1 42 54 76 28 30<br />
2 47 14 27 15 8<br />
3 9 11 9 3 7<br />
+ de 3 7 7 13 4 6<br />
Total 106 102 145 63 52<br />
Valores percentuais de garagens - Ven<strong>da</strong>s Tabela 8<br />
Quanti<strong>da</strong>de A B C D E<br />
0 0,21% 3,42% 4,27% 2,78% 0,21%<br />
1 8,97% 11,54% 16,24% 5,98% 6,41%<br />
2 10,04% 2,99% 5,77% 3,21% 1,71%<br />
3 1,92% 2,35% 1,92% 0,64% 1,50%<br />
+ de 3 1,50% 1,50% 2,78% 0,85% 1,28%<br />
Total 22,65% 21,79% 30,98% 13,46% 11,11%<br />
<strong>Pesquisa</strong> <strong>da</strong> <strong>Capital</strong> <strong>–</strong> <strong>Maio</strong>/2010 CRECI<strong>SP</strong> 9<br />
mais de<br />
200