Censo industrial do arranjo produtivo local de confecções - Ipardes
Censo industrial do arranjo produtivo local de confecções - Ipardes
Censo industrial do arranjo produtivo local de confecções - Ipardes

You also want an ePaper? Increase the reach of your titles
YUMPU automatically turns print PDFs into web optimized ePapers that Google loves.
pesquisadas. Cabe lembrar que no item ‘boné político’ as informações referemse<br />
a da<strong>do</strong>s <strong>de</strong> 2004 (data da última eleição no Brasil). No comparativo entre<br />
empresas, a menor produção individual <strong>do</strong>s bonés promocionais é <strong>de</strong> 6 mil peças/<br />
ano, e a maior é <strong>de</strong> 1,2 milhão <strong>de</strong> peças/ano (tabela 7).<br />
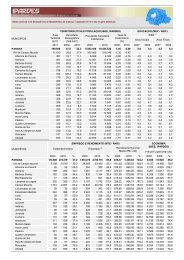
TABELA 6 - NÚMERO DE EMPRESAS RESPONDENTES E QUANTIDADE ANUAL DE PRODUTOS DAS EMPRESAS CONFECCIONISTAS<br />
DOAPLDE BONÉS DEAPUCARANA- 2005<br />
NÚMERO DE EMPRESAS<br />
QUANTIDADE PRODUZIDA<br />
PRODUTO<br />
RESPONDENTES Abs. %<br />
Bonés promocionais 97 25.535.015 47,9<br />
Bonés <strong>de</strong> magazine (re<strong>de</strong> <strong>de</strong> lojas) 40 9.790.000 18,4<br />
Bonés <strong>de</strong> marca própria 38 5.984.490 11,2<br />
Bonés <strong>de</strong> grife 15 1.954.800 3,7<br />
Bonés políticos 13 938.400 1,8<br />
Total Categoria Bonés 44.202.705 83,0<br />
Camisetas 61 3.988.875 7,5<br />
Chapéus 54 1.426.248 2,7<br />
Tocas e gorros 29 1.134.600 2,1<br />
Porta-CDs 24 1.082.100 2,0<br />
Aventais / Uniformes 33 624.034 1,2<br />
Mochilas e bolsas 14 435.200 0,8<br />
Bandanas 19 305.400 0,6<br />
Tiaras 4 67.100 0,1<br />
TOTAL - 53.266.262 100,0<br />
FONTE: Pesquisa <strong>de</strong> campo<br />
TABELA 7 - NÚMERO DE ESTABELECIMENTOS RESPONDENTES, PRODUÇÃO MÉDIA E PERCENTUAL DO FATURAMENTO MÉDIO<br />
SEGUNDO PRODUTOS DAS EMPRESAS CONFECCIONISTAS DOAPLDE BONÉS DEAPUCARANA<br />
PRODUTO<br />
ESTABELECIMENTOS<br />
RESPONDENTES<br />
PRODUÇÃO MÉDIA<br />
PERCENTUAL DO<br />
FATURAMENTO MÉDIO<br />
Bonés promocionais 97 263.248 71<br />
Bonés políticos 13 72.185 19<br />
Bonés <strong>de</strong> grife 15 130.320 33<br />
Bonés <strong>de</strong> magazine (re<strong>de</strong> <strong>de</strong> lojas) 40 244.750 53<br />
Bonés <strong>de</strong> marca própria 38 157.487 50<br />
Chapéus 54 26.412 9<br />
Tocas e gorros 29 39.124 5<br />
Bandanas 19 16.074 2<br />
Mochilas e bolsas 14 31.086 8<br />
Camisetas 61 65.391 20<br />
Porta-CDs 24 45.088 14<br />
Tiaras 4 16.775 3<br />
Aventais/Uniformes 34 18.910 9<br />
FONTE: Pesquisa <strong>de</strong> campo<br />
O boné <strong>de</strong> magazine e o boné <strong>de</strong> marca própria vêm na segunda e terceira<br />
posições em termos <strong>de</strong> quantida<strong>de</strong> e representam, respectivamente, 22% e 14%<br />
<strong>do</strong> total <strong>de</strong> bonés produzi<strong>do</strong>s pelas empresas pesquisadas (gráfico 4).<br />
39