Download full issue - PanamJAS
Download full issue - PanamJAS
Download full issue - PanamJAS

Create successful ePaper yourself
Turn your PDF publications into a flip-book with our unique Google optimized e-Paper software.
Identification of areas for unballasting by geoprocessing - case study in Todos os Santos Bay, Brazil<br />
287<br />
0.5 m/s and the maximum spread of a contaminant<br />
during a complete cycle of spring tide with cold<br />
front winds was defined as 11,430 meters. This<br />
value was divided into three equal parts of 3,810<br />
meters, to establish the areas of high, medium, and<br />
low risk potential in each proximity map: proximity<br />
to urban areas, to mangrove swamps, and to NCU.<br />
Farther than 11,430 meters, the potential risk would<br />
be null.<br />
The quantitative results — in terms of<br />
territorial extension of each proximity zone on each<br />
map — are consolidated on Table II. So, after<br />
having started based on secondary governmental<br />
data, it was possible to proceed with the<br />
manipulation of the database in order to generate<br />
intermediary maps in the analysis structure<br />
presented in Figure 1. Those three maps overlaid,<br />
each given equal importance and analyzed according<br />
to the Boolean method, yielded a map of areas<br />
susceptible to contamination (Fig. 2).<br />
Table II. Territorial extension of each proximity zone on the resulting maps of proximity (to urban areas,<br />
mangrove swamps, and nature conservation units) in the interior of Todos os Santos bay (Bahia state,<br />
Brazil).<br />
Maps of proximity<br />
Area from<br />
0 km to 3.81 km (km 2 )<br />
Area between<br />
3.81 km and 7.61 km<br />
(km 2 )<br />
Area between<br />
7.61 km and 11.43<br />
km (km 2 )<br />
To urban areas 761.2 714.2 419.8<br />
To mangrove swamps 457.5 364.4 143.1<br />
To nature conservation units 891.1 486.6 406.2<br />
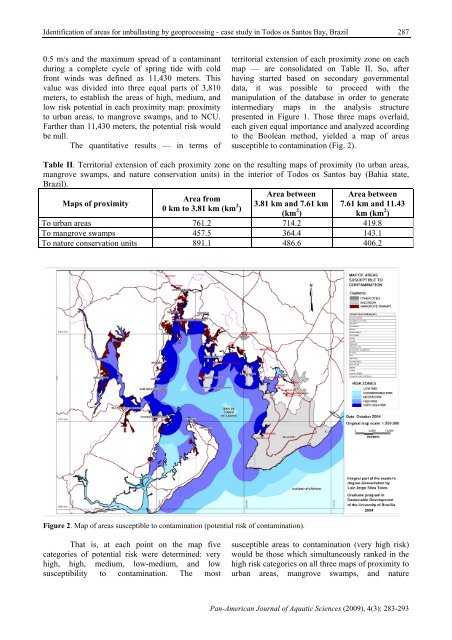
Figure 2. Map of areas susceptible to contamination (potential risk of contamination).<br />
That is, at each point on the map five<br />
categories of potential risk were determined: very<br />
high, high, medium, low-medium, and low<br />
susceptibility to contamination. The most<br />
susceptible areas to contamination (very high risk)<br />
would be those which simultaneously ranked in the<br />
high risk categories on all three maps of proximity to<br />
urban areas, mangrove swamps, and nature<br />
Pan-American Journal of Aquatic Sciences (2009), 4(3): 283-293