Edição 46 RBCIAMB

You also want an ePaper? Increase the reach of your titles
YUMPU automatically turns print PDFs into web optimized ePapers that Google loves.
Lutinski, J.A. et al.<br />
was observed at site 2 (H’= 2.86), whereas the lowest,<br />
at site 4 (H’= 1.39). The same pattern was observed for<br />
the evenness, with the highest value recorded at site 2<br />
(J’= 0.89) and the lowest, at site 4 (J’ = 0.56) (Table 2).<br />
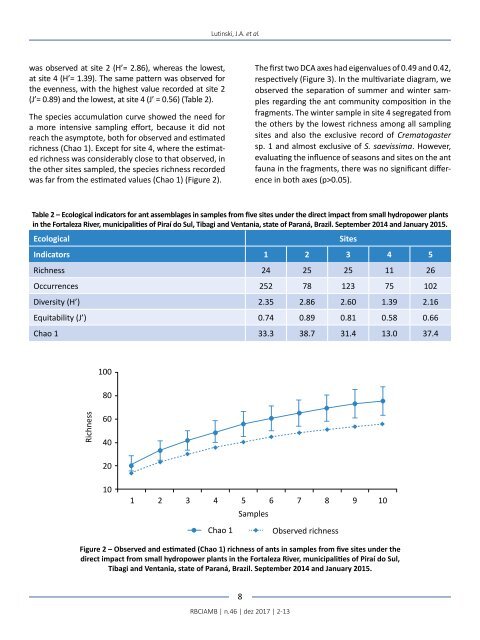
The species accumulation curve showed the need for<br />
a more intensive sampling effort, because it did not<br />
reach the asymptote, both for observed and estimated<br />
richness (Chao 1). Except for site 4, where the estimated<br />
richness was considerably close to that observed, in<br />
the other sites sampled, the species richness recorded<br />
was far from the estimated values (Chao 1) (Figure 2).<br />
The first two DCA axes had eigenvalues of 0.49 and 0.42,<br />
respectively (Figure 3). In the multivariate diagram, we<br />
observed the separation of summer and winter samples<br />
regarding the ant community composition in the<br />
fragments. The winter sample in site 4 segregated from<br />
the others by the lowest richness among all sampling<br />
sites and also the exclusive record of Crematogaster<br />
sp. 1 and almost exclusive of S. saevissima. However,<br />
evaluating the influence of seasons and sites on the ant<br />
fauna in the fragments, there was no significant difference<br />
in both axes (p>0.05).<br />
Table 2 – Ecological indicators for ant assemblages in samples from five sites under the direct impact from small hydropower plants<br />
in the Fortaleza River, municipalities of Piraí do Sul, Tibagi and Ventania, state of Paraná, Brazil. September 2014 and January 2015.<br />
Ecological<br />
Indicators 1 2 3 4 5<br />
Richness 24 25 25 11 26<br />
Occurrences 252 78 123 75 102<br />
Diversity (H’) 2.35 2.86 2.60 1.39 2.16<br />
Equitability (J’) 0.74 0.89 0.81 0.58 0.66<br />
Chao 1 33.3 38.7 31.4 13.0 37.4<br />
Sites<br />
100<br />
80<br />
Richness<br />
60<br />
40<br />
20<br />
10<br />
1<br />
2<br />
3<br />
4<br />
5 6<br />
7 8<br />
9 10<br />
Samples<br />
Chao 1<br />
Observed richness<br />
Figure 2 – Observed and estimated (Chao 1) richness of ants in samples from five sites under the<br />
direct impact from small hydropower plants in the Fortaleza River, municipalities of Piraí do Sul,<br />
Tibagi and Ventania, state of Paraná, Brazil. September 2014 and January 2015.<br />
8<br />
<strong>RBCIAMB</strong> | n.<strong>46</strong> | dez 2017 | 2-13