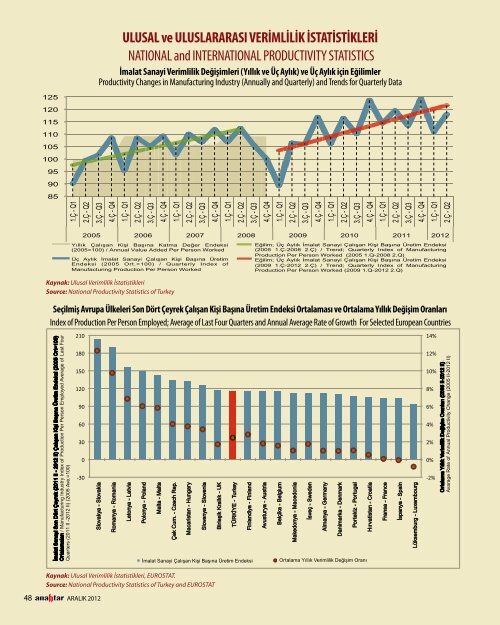
ULUSAL <strong>ve</strong> ULUSLARARASI VERİMLİLİK İSTATİSTİKLERİNATIONAL and INTERNATIONAL PRODUCTIVITY STATISTICSProductivity Changes in Manufacturing Industry (Annually and Quarterly) and Trends for Quarterly Data1251201151101051009590851.Ç - Q12.Ç - Q23.Ç - Q34.Ç - Q41.Ç - Q12.Ç - Q23.Ç - Q34.Ç - Q41.Ç - Q12.Ç - Q23.Ç - Q34.Ç - Q41.Ç - Q12.Ç - Q23.Ç - Q34.Ç - Q41.Ç - Q12.Ç - Q23.Ç - Q34.Ç - Q41.Ç - Q12.Ç - Q23.Ç - Q34.Ç - Q41.Ç - Q12.Ç - Q23.Ç - Q34.Ç - Q41.Ç - Q12.Ç - Q22005 2006 2007 2008 2009 2010 2011 2012Yıllık Çalı an Ki i Ba ına Katma De er Endeksi(2005=100) / Annual Value Added Per Person WorkedÜç Aylık malat <strong>Sanayi</strong> Çalı an Ki i Ba ına ÜretimEndeksi (2005 Ort.=100) / Quarterly Index ofManufacturing Production Per Person WorkedE ilim; Üç Aylık malat <strong>Sanayi</strong> Çalı an Ki i Ba ına Üretim Endeksi(2005 1.Ç-2008 2.Ç) / Trend; Quarterly Index of ManufacturingProduction Per Person Worked (2005 1.Q-2008 2.Q)E ilim; Üç Aylık malat <strong>Sanayi</strong> Çalı an Ki i Ba ına Üretim Endeksi(2009 1.Ç-2012 2.Ç) / Trend; Quarterly Index of ManufacturingProduction Per Person Worked (2009 1.Q-2012 2.Q)Kaynak: Ulusal Verimlilik U L İstatistikleri U S L A R A R A S I V E R İ M L İ L İ K İ S T A T İ S T İ K L E R İ / INTERNATIONALSeçilmiş Source: Avrupa National Ülkeleri Productivity Son Statistics Dört of Çeyrek Turkey Çalışan PRODUCTIVITY Kişi Başına Üretim STATISTICSEndeksi Ortalaması <strong>ve</strong> Ortalama Yıllık Değişim Oranları /Index of Production Per Person Employed; A<strong>ve</strong>rage of Last Four Quarters and Annual A<strong>ve</strong>rage Rate of Growth For Selected European CountriesIndex of Production Per Person Employed; A<strong>ve</strong>rage of Last Four Quarters and Annual A<strong>ve</strong>rage Rate of Growth For Selected European Countriesİmalat <strong>Sanayi</strong> Son Dört malat Çeyrek <strong>Sanayi</strong> (2011 Son D II - rt 2012 Çeyrek II) (2011 Çalışan II -2012 Kişi Başına II) Çalışan Üretim Kişi Endeksi Başına (2005 retim Endeksi Ort=100)Ortalamaları / Manufacturing (2005 Ort.=100) Industry Ortalamaları Index of / Production Manufacturing Per Person Industry Employed Index of Production A<strong>ve</strong>rage of Per Last Person FourQuarters (2011 II -2012 Employed II) (2005 A<strong>ve</strong>.=100) A<strong>ve</strong>rage of Last Four Quarters (2011 II -2012 II) (2005 A<strong>ve</strong>.=100)Slovakya-Slovakia- SlovakiaRomanya-Romania- RomaniaLetonya-Latvia - LatviaPolonya-Poland- PolandMalta-Malta - Çek Cum.-Czech - Czech Rep.Macaristan-Hungary- Slo<strong>ve</strong>nya-Slo<strong>ve</strong>nia- Slo<strong>ve</strong>niaBirleşik Krallık-UK - TÜRKİYE YE-Turkey - Finlandiya-,Finland- İmalat <strong>Sanayi</strong> Çalışan Kişi Başına Üretim EndeksiAvusturya-Austria- AustriaBelçika-Belgium- BelgiumMakedonya-Macedonia- Macedoniaİs<strong>ve</strong>ç s<strong>ve</strong>ç-Sweden - Almanya-Germany- Danimarka-Denmark- DenmarkPortekiz-Portugal- PortugalHırvatistan-Croatia- Ortalama Yıllık Verimlilik Değişim işim Oranı OranıFransa-France- Franceİspanya spanya-Spain - Lüksemburg - LuxembourgOrtalama Yıllık Ortalama Verimlilik Yıllık Verimlilik Değişim De Oranları işim Oranları (2005 II-2012 (2005 II-2012 II) / II) /Avarage Rate A<strong>ve</strong>rage of Annual Rate of Productivity Annual Productivity Change Change (2005 II-2012 (2005 II-2012 II) II)Kaynak: Ulusal Verimlilik İstatistikleri, EUROSTAT.Source: National Productivity Statistics of Turkey and EUROSTAT48 ARALIK 2012
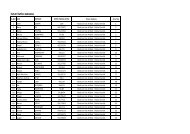
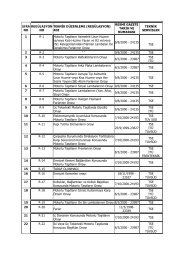
Çalışan Kişi Başına Üretim Endeksi (2005 Ort.=100) / Index of Production Per Person Employed (2005 A<strong>ve</strong>.=100)2006 2007 2008 2009 2010 2011Toplam <strong>Sanayi</strong> / Total Industry 104,5 107,7 107,4 107,0 115,8 119,8 114,4 119,3<strong>Sanayi</strong>nin KısımlarıSections of IndustryMadencilik <strong>ve</strong> Taşocakçılığı / Mining and Quarrying 97,0 95,0 101,3 105,7 102,7 94,4 94,4 100,1İmalat / Manufacturing 104,5 107,6 106,3 104,6 117,9 110,9 110,9 118,0Elektrik, Gaz, Buhar <strong>ve</strong> İklimlendirme/ Electricity, Gas, Steam And Air Conditioning Supply 119,0 128,4 136,5 136,5 130,8 156,9 156,9 140,7ARM - Aramalı / IG - Intermediate Goods 104,6 106,2 104,3 104,8 117,2 110,5 110,5 119,6Ana <strong>Sanayi</strong> Grupları DLT - Dayanıklı Tüketim / DCG - Durable Consumer Goods 101,4 106,0 110,7 116,1 130,1 119,1 119,1 126,4Main Industrial DZT - Dayanıksız Tüketim / UCG - Non-Durable Consumer Goods 104,9 106,7 105,7 111,0 114,7 109,1 109,1 112,8Groups (MIGs) ENJ – Enerji / E- Energy 102,9 107,0 112,7 112,9 135,3 141,5 141,5 130,2SEM - Sermaye Malı / CG - Capital Goods 102,1 108,5 106,2 90,6 116,6 106,7 106,7 116,2Gıda ürünlerinin imalatı / Manufacture of food products 101,0 98,5 97,5 95,1 97,5 99,6 91,0 84,2İçeceklerin imalatı / Manufacture of be<strong>ve</strong>rages 102,0 109,2 117,1 116,1 103,1 99,9 86,8 119,9Tütün ürünleri imalatı / Manufacture of tobacco products 117,4 127,2 155,9 137,3 146,2 137,0 152,2 161,0Tekstil ürünlerinin imalatı / Manufacture of textiles 103,9 98,8 94,5 97,1 102,9 98,8 95,0 100,3Giyim eşyalarının imalatı / Manufacture of wearing apparel 101,3 107,1 99,0 105,4 111,9 108,6 103,6 109,3Deri <strong>ve</strong> ilgili ürünlerin imalatı / Manufacture of leather and related products 109,3 95,1 92,7 95,8 104,7 104,1 100,8 101,5Ağaç, ağaç ürünleri <strong>ve</strong> mantar ürünleri imalatı …Manufacture of wood and of products of wood and cork…115,6 131,2 153,7 184,7 212,7 247,3 230,3 284,9Kağıt <strong>ve</strong> kağıt ürünlerinin imalatı / Manufacture of paper and paper products 105,7 106,7 105,6 114,7 117,2 121,9 122,5 128,7Kayıtlı medyanın basılması <strong>ve</strong> çoğaltılması / Printing and reproduction of recorded media 107,2 114,3 116,0 127,4 126,8 139,9 124,2 134,3Kok kömürü <strong>ve</strong> rafine edilmiş petrol ürünleri imalatı / Manufacture of coke and refined petroleum products 107,4 106,2 99,4 82,3 85,9 95,8 86,5 87,5Kimyasalların <strong>ve</strong> kimyasal ürünlerin imalatı / Manufacture of chemicals and chemical products 112,6 116,6 109,3 112,9 122,9 123,7 119,8 125,3Temel eczacılık ürünlerinin <strong>ve</strong> eczacılığa ilişkin malzemelerin imalatıManufacture of basic pharmaceutical products and pharmaceutical preparations109,3 119,4 123,5 129,1 127,9 131,1 136,6 161,1Kauçuk <strong>ve</strong> plastik ürünlerin imalatı / Manufacture of rubber and plastic products 98,4 100,6 95,6 94,8 104,0 108,2 98,8 102,1Diğer metalik olmayan mineral ürünlerin imalatı / Manufacture of other non-metallic mineral products 103,1 102,2 103,0 104,0 113,4 116,8 96,9 121,1Ana metal sanayi / Manufacture of basic metals 109,8 113,5 107,3 100,1 105,7 104,0 105,8 108,5Fabrikasyon metal ürünleri imalatı (makine <strong>ve</strong> teçhizat hariç)Manufacture of fabricated metal products, except machinery and equipment102,4 108,5 100,5 91,9 103,7 112,5 110,5 118,2Bilgisayarların, elektronik <strong>ve</strong> optik ürünlerin imalatıManufacture of computer, electronic and optical products20121. Ç.1st. Q.20122. Ç.2nd Q.80,1 74,3 69,9 64,7 84,7 91,5 78,0 90,4Elektrikli teçhizat imalatı / Manufacture of electrical equipment 107,2 107,2 100,0 102,9 119,9 130,6 122,0 125,7Başka yerde sınıflandırılmamış makine <strong>ve</strong> ekipman imalatı / Manufacture of machinery and equipment n.e.c. 104,8 105,2 95,6 85,4 107,2 114,5 112,6 119,6Motorlu kara taşıtı, treyler (römork) <strong>ve</strong> yarı treyler (yarı römork) imalatı102,4 103,7 102,8 90,4 113,3 117,8 109,4 113,3Manufacture of motor <strong>ve</strong>hicles, trailers and semi-trailersDiğer ulaşım araçlarının imalatı / Manufacture of other transport equipment 110,1 188,5 197,7 122,5 126,1 162,3 125,5 221,0Mobilya imalatı / Manufacture of furniture 92,4 116,0 133,6 137,0 136,4 154,1 130,4 141,2Diğer imalatlar / Other manufacturing 126,6 119,4 141,8 149,2 171,1 174,3 159,2 182,5Makine <strong>ve</strong> ekipmanların kurulumu <strong>ve</strong> onarımı / Repair and installation of machinery and equipment 91,4 128,8 95,0 91,8 99,1 89,5 85,9 90,4Kaynak: Ulusal Verimlilik İstatistikleriSource: National Productivity Statistics of Turkey