

OITA
eiyakuallpage
eiyakuallpage

You also want an ePaper? Increase the reach of your titles
YUMPU automatically turns print PDFs into web optimized ePapers that Google loves.
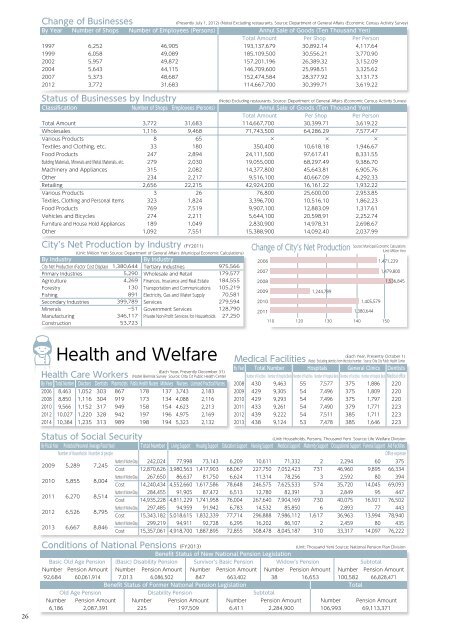
Change of Businesses<br />
By Year<br />
1997<br />
1999<br />
2002<br />
2004<br />
2007<br />
2012<br />
Number of Shops<br />
6,252<br />
6,058<br />
5,957<br />
5,643<br />
5,373<br />
3,772<br />
Number of Employees (Persons)<br />
46,905<br />
49,089<br />
49,872<br />
44,115<br />
48,687<br />
31,683<br />
Status of Businesses by Industry<br />
(Presently July 1, 2012) (Note) Excluding restaurants. Source: Department of General Affairs (Economic Census Activity Survey)<br />
Annul Sale of Goods (Ten Thousand Yen)<br />
Total Amount<br />
Per Shop<br />
Per Person<br />
193,137,679<br />
185,109,500<br />
157,201,196<br />
146,709,600<br />
152,474,584<br />
114,667,700<br />
30,892.14<br />
30,556.21<br />
26,389.32<br />
25,998.51<br />
28,377.92<br />
30,399.71<br />
4,117.64<br />
3,770.90<br />
3,152.09<br />
3,325.62<br />
3,131.73<br />
3,619.22<br />
(Note) Excluding restaurants. Source: Department of General Affairs (Economic Census Activity Survey)<br />
Classification Number of Shops Employees (Persons) Annul Sale of Goods (Ten Thousand Yen)<br />
Total Amount<br />
Per Shop<br />
Per Person<br />
Total Amount<br />
Wholesales<br />
Various Products<br />
Textiles and Clothing, etc.<br />
Food Products<br />
Building Materials, Minerals and Metal Materials, etc.<br />
Machinery and Appliances<br />
Other<br />
Retailing<br />
Various Products<br />
Textiles, Clothing and Personal Items<br />
Food Products<br />
Vehicles and Bicycles<br />
Furniture and House Hold Appliances<br />
Other<br />
3,772<br />
1,116<br />
8<br />
33<br />
247<br />
279<br />
315<br />
234<br />
2,656<br />
3<br />
323<br />
769<br />
274<br />
189<br />
1,092<br />
31,683<br />
9,468<br />
65<br />
180<br />
2,894<br />
2,030<br />
2,082<br />
2,217<br />
22,215<br />
26<br />
1,824<br />
7,519<br />
2,211<br />
1,049<br />
7,551<br />
114,667,700<br />
71,743,500<br />
×<br />
350,400<br />
24,111,500<br />
19,055,000<br />
14,377,800<br />
9,516,100<br />
42,924,200<br />
76,800<br />
3,396,700<br />
9,907,100<br />
5,644,100<br />
2,830,900<br />
15,388,900<br />
30,399.71<br />
64,286.29<br />
×<br />
10,618.18<br />
97,617.41<br />
68,297.49<br />
45,643.81<br />
40,667.09<br />
16,161.22<br />
25,600.00<br />
10,516.10<br />
12,883.09<br />
20,598.91<br />
14,978.31<br />
14,092.40<br />
3,619.22<br />
7,577.47<br />
×<br />
1,946.67<br />
8,331.55<br />
9,386.70<br />
6,905.76<br />
4,292.33<br />
1,932.22<br />
2,953.85<br />
1,862.23<br />
1,317.61<br />
2,252.74<br />
2,698.67<br />
2,037.99<br />
Conditions of National Health Insurance and the Latter Elderly Health Care System (FY2013)<br />
Total Number<br />
Medical Benefits Costs<br />
Hospitalization<br />
Non-Hospitalized<br />
Dentists<br />
Pharmacies<br />
Medical Expenses<br />
General Condition of Daycare Centers (Public) (Presently April 1, 2015)<br />
(Unit: Cases, Thousand Yen)<br />
National Health Care Insurance Latter Elderly Health Care System<br />
Number<br />
915,622<br />
873,404<br />
34,791<br />
89,764<br />
152,755<br />
596,094<br />
42,218<br />
Cost frame<br />
39,330,910<br />
38,988,379<br />
16,207,728<br />
13,472,593<br />
2,307,307<br />
7,000,751<br />
342,531<br />
Number<br />
1,527,571<br />
1,499,605<br />
-<br />
-<br />
-<br />
-<br />
27,966<br />
Cost frame<br />
52,859,741<br />
52,502,185<br />
-<br />
-<br />
-<br />
-<br />
357,556<br />
(Note) From 2008 the Latter Elderly Health Care System was launched in place of the Elderly Health System. Source: National Health Insurance and Pension Division<br />
Number of Schools Caregivers Other Staff Admission Status<br />
Capacity Total Number<br />
14<br />
123<br />
31 1,106 1,204<br />
*Not including part time and temporary staff with caregivers and other staff. Source: Childcare Division<br />
Environment<br />
Conditions of Waste Management (FY2014)<br />
(Unit: t) *Including the large region in the total number and disposal. Source: Cleaning Management Division<br />
Total Number Delivery<br />
Disposal<br />
Direct Management Collection Direct Delivery Incineration Landfills<br />
Plastic Cans, Bottles, PET Paper, Fabrics Fluorescent Tubes, etc.<br />
Containers and Packaging Bottles<br />
172,366.62 92,077.95 51,755.8 167,912.85 13,999.21 2,810.08 5,610.23 12,597.77 241.56<br />
Status of Nursing Care Insurance<br />
(Unit: Persons, Thousand Yen) Source: The Longevity Welfare Division<br />
Classification<br />
Number of First Insured Persons<br />
Total Number<br />
Over 65 Years Old and Under 75 Years Old<br />
Over 75 Years Old<br />
Service Recipients<br />
Qualified Persons Needing Support<br />
Qualified Persons Needing Nursing Care<br />
Insurance Fees Received<br />
Insurance Benefits<br />
2014<br />
113,965<br />
61,449<br />
52,516<br />
19,386<br />
7,321<br />
14,696<br />
6,824,069<br />
31,561,806<br />
(Note) The numbers of the first insured persons, service recipients,<br />
qualified persons needing support and qualified persons needing<br />
nursing care are according to (each fiscal year’s) nursing care<br />
insurance business status report.<br />
Conditions of Sewage Disposal (FY2014)<br />
(Unit: kl) Source: Cleaning Management Division<br />
Authorized Collection<br />
Total Number<br />
Sewage Collection<br />
of Septic Tank Sludge Average per Day<br />
Direct Management Contract (Authorized Traders) Authorized Traders Throughput<br />
117,894.18 1,054.01 13,810.20 103,029.97 323.00<br />
City’s Net Production by Industry (FY2011)<br />
(Unit: Million Yen) Source: Department of General Affairs (Municipal Economic Calculations)<br />
By Industry<br />
By Industry<br />
City Net Production (Factor Cost Display) 1,380,644 Tertiary Industries<br />
975,566<br />
Primary Industries<br />
5,290 Wholesale and Retail<br />
179,577<br />
Agriculture<br />
4,269 Finances, Insurance and Real Estate 184,555<br />
Forestry<br />
130 Transportation and Communications 105,219<br />
Fishing<br />
891 Electricity, Gas and Water Supply 70,581<br />
Secondary Industries<br />
399,789 Services<br />
279,594<br />
Minerals<br />
-51 Government Services<br />
128,790<br />
Manufacturing<br />
346,117 Private Non-Profit Services for Households 27,250<br />
Construction<br />
53,723<br />
Change of City’s Net Production<br />
2006<br />
2007<br />
2008<br />
2009<br />
2010<br />
2011<br />
1,244,789<br />
Source: Municipal Economic Calculations<br />
(Unit: Million Yen)<br />
1,405,579<br />
1,380,644<br />
1,471,229<br />
110 120 130<br />
140<br />
150<br />
1,479,800<br />
1,536,845<br />
Changes of Total Number of Waste Disposal<br />
2009 161,309.40<br />
2010 160,285.51<br />
2011 163,126.03<br />
2012 170,725.76<br />
2013 169,982.36<br />
2014 172,366.62<br />
10.00<br />
15.00<br />
20.00(Ten thousand t)<br />
Changes of Total Number of Sewage Disposal<br />
2009 124,611.49<br />
2010 127,320.45<br />
2011 126,152.61<br />
2012 122,989.35<br />
2013 120,536.06<br />
2014 117,894.18<br />
117.00 118.00 119.00 120.00 121.00 122.00 123.00<br />
124.00 125.00 126.00 127.00<br />
(thousand kl)<br />
Health and Welfare<br />
Medical Facilities<br />
(Each Year, Presently October 1)<br />
(Note) Excluding dentists from the total number. Source: Oita City Public Health Center<br />
Education<br />
By Year Total Number<br />
Hospitals General Clinics Dentists<br />
(Each Year, Presently December 31)<br />
Health Care Workers (Note) Biennial Survey Source: Oita Cit Public Health Center<br />
Number of Facilities Number of Hospital Beds Number of Facilities Number of Hospital Beds Number of Facilities Number of Hospital Beds Medical office<br />
Conditions of Schools Resources: Education Planning Division (Kindergartens, Elementary & Junior High School (Presently May 1, 2015)), Basic School Survey FY2014<br />
By Year Total Number Doctors Dentists Pharmacists Public Health Nurses Midwives Nurses Licensed Practical Nurses 2008 430 9,463 55 7,577 375 1,886 220<br />
Classifications<br />
National<br />
Prefectural<br />
Municipal<br />
Private<br />
2006 8,463 1,052 303 867 178 137 3,743 2,183 2009 429 9,305 54 7,496 375 1,809 220<br />
School Numbers Number of Students Enrolled School Numbers Number of Students Enrolled School Numbers Number of Students Enrolled School Numbers Number of Students Enrolled School Numbers Number of Students Enrolled<br />
2008 8,850 1,116 304 919 173 134 4,088 2,116 2010 429 9,293 54 7,496 375 1,797 220<br />
Kindergartens 50 4,466 1<br />
156<br />
-<br />
- 29<br />
950 20 3,360<br />
2010 9,566 1,152 317 949 158 154 4,623 2,213 2011 433 9,261 54 7,490 379 1,771 223<br />
Elementary Schools 62 27,028 1<br />
649<br />
-<br />
- 61 26,379 -<br />
-<br />
2012 10,027 1,220 328 942 197 196 4,975 2,169 2012 439 9,222 54 7,511 385 1,711 223<br />
Junior High Schools 34 14,107 1<br />
478<br />
1<br />
358 29 12,639<br />
3<br />
632<br />
2014 10,384 1,235 313 989 198 194 5,323 2,132 2013 438 9,124 53 7,478 385 1,646 223<br />
High Schools<br />
20 15,160 -<br />
- 14 10,135<br />
-<br />
- 6 5,025<br />
Vocational High Schools 1<br />
870 1<br />
870<br />
-<br />
-<br />
-<br />
- -<br />
-<br />
Status of Social Security<br />
(Unit: Households, Persons, Thousand Yen) Source: Life Welfare Division<br />
Universities<br />
5 15,549 1 5,827<br />
1<br />
397<br />
-<br />
- 3 9,325<br />
By Fiscal Year Protected Personnel (Average Fiscal Year)<br />
Total Number Living Support Housing Support Education Support Nursing Support Medical Support Maternity Support Occupational Support Funeral Support Aid Facilities<br />
Junior Collages 5 2,139 -<br />
-<br />
1<br />
907<br />
-<br />
- 4 1,232<br />
Number of Households Nnumber of people<br />
Office expense<br />
Special Support Schools 5<br />
497 1<br />
…<br />
4<br />
…<br />
-<br />
- -<br />
-<br />
2009 5,289 7,245<br />
Number of Worker-Days 242,024 77,998 73,143 6,209 10,611 71,332 2 2,294 60 375<br />
Advanced Vocational School 31 3,322 -<br />
-<br />
-<br />
-<br />
-<br />
- 31 3,322<br />
Cost 12,870,626 3,980,563 1,417,903 68,067 227,750 7,052,423 731 46,960 9,895 66,334<br />
Various Schools 9 1,471 -<br />
-<br />
-<br />
-<br />
1<br />
323<br />
8 1,148<br />
Number of Worker-Days 267,650 86,637 81,750 6,624 11,314 78,256 3 2,592 80 394<br />
*Universities and Junior Collages are within Oita prefecture<br />
2010 5,855 8,004<br />
Cost 14,240,434 4,552,660 1,617,586 78,648 246,575 7,625,533 574 35,720 14,045 69,093<br />
284,455<br />
Condition of Parks<br />
Number of Worker-Days<br />
91,905 87,472 6,513 12,780 82,391 3 2,849 95 447<br />
(Presently March 31, 2015) Source: Parkland Division<br />
2011 6,270 8,514<br />
Cost 14,935,228 4,811,229 1,741,958 76,004 267,640 7,904,169 730 40,075 16,921 76,502<br />
Total Number City Block Parks Neighborhood Parks District Parks Comprehensive Parks Sports Parks Other Parks<br />
Number of Worker-Days 297,485 94,959 91,942 6,783 14,532 85,850 6 2,893 77 443<br />
Construction<br />
759 532<br />
23<br />
4<br />
7<br />
3 190<br />
2012 6,526 8,795<br />
Cost 15,343,182 5,018,615 1,832,339 77,714 296,888 7,986,112 1,617 36,963 13,994 78,940<br />
Number of Worker-Days 299,219 94,911 92,728 6,295 16,202 86,107 2 2,459 80 435<br />
Changes of Housing Constructions Changes of Park Numbers<br />
2013 6,667 8,846<br />
Cost 15,357,061 4,918,700 1,887,895 72,855 308,478 8,045,187 310 33,317 14,097 76,222<br />
5,000 4,879<br />
2009 723<br />
4,337<br />
Conditions of National Pensions (FY2013)<br />
(Unit: Thousand Yen) Source: National Pension Plan Division<br />
Number of Housing 4,000<br />
3,674<br />
2010<br />
3,661<br />
728<br />
Benefit Status of New National Pension Legislation<br />
Constructions (Unit: ko)<br />
Basic Old Age Pension (Basic) Disability Pension Survivor’s Basic Pension Widow’s Pension<br />
Subtotal<br />
Classification 2013<br />
3,000<br />
2,919<br />
2011 730<br />
2,640 2,832<br />
Number Pension Amount Number Pension Amount Number Pension Amount Number Pension Amount Number Pension Amount<br />
Total Number 3,661<br />
92,684 60,061,914 7,013 6,086,502 847 663,402<br />
38 16,653 100,582 66,828,471<br />
Home Ownerships 1,430<br />
2,000<br />
2012 739<br />
Benefit Status of Former National Pension Legislation<br />
Total<br />
Rental Homes 1,712<br />
2013 746<br />
Old Age Pension<br />
Disability Pension<br />
Subtotal<br />
Salary Housing 3<br />
1,000<br />
Number Pension Amount Number Pension Amount Number Pension Amount Number Pension Amount<br />
Houses Built for Sale 516<br />
2014<br />
759<br />
6,186 2,087,391<br />
225<br />
197,509<br />
6,411<br />
2,284,900<br />
106,993 69,113,371<br />
Source: Development Building Guidance Division<br />
0<br />
“ Architect Administrative Annual Report”<br />
2007 2008 2009 2010 2011 2012 2013<br />
600 620 640 660 680 700 720 740 760<br />
26 27