

Wittamperuma et al. - 2012 - Remote sensing based biophysical models for estima
Wittamperuma et al. - 2012 - Remote sensing based biophysical models for estima
Wittamperuma et al. - 2012 - Remote sensing based biophysical models for estima

You also want an ePaper? Increase the reach of your titles
YUMPU automatically turns print PDFs into web optimized ePapers that Google loves.
Internation<strong>al</strong> Archives of the Photogramm<strong>et</strong>ry, <strong>Remote</strong> Sensing and Spati<strong>al</strong> In<strong>for</strong>mation Sciences, Volume XXXIX-B8, <strong>2012</strong><br />
XXII ISPRS Congress, 25 August – 01 September <strong>2012</strong>, Melbourne, Austr<strong>al</strong>ia<br />
REMOTE-SENSING-BASED BIOPHYSICAL MODELS FOR ESTIMATING LAI<br />
OF IRRIGATED CROPS IN MURRY DARLING BASIN<br />
Indira <strong>Wittamperuma</strong> 1 , Mohsin Hafeez 1, 2 , Mojtaba Pakparvar 3 and John Louis 4<br />
1 School of Environment<strong>al</strong> Sciences, Charles Sturt University, Wagga Wagga NSW 2678, Austr<strong>al</strong>ia.<br />
Email: iwittamperuma@csu.edu.au<br />
2 GHD Pty Ltd, 201 Charlotte Stre<strong>et</strong>, Brisbane QLD, 4000<br />
3 Faculty of Bioscience Engineering Gent University, 673 Cupour Links, Gent 9000, Belgium<br />
4 School of Computing and Mathematics, Charles Sturt University, Wagga Wagga NSW 2678, Austr<strong>al</strong>ia.<br />
KEY WORDS: GIS, LAI, LANDSAT TM, NDVI, <strong>Remote</strong> Sensing,<br />
ABSTRACT:<br />
<strong>Remote</strong> <strong>sensing</strong> is a rapid and reliable m<strong>et</strong>hod <strong>for</strong> <strong>estima</strong>ting crop growth data from individu<strong>al</strong> plant to crops in irrigated<br />
agriculture ecosystem. The LAI is one of the important biophysic<strong>al</strong> param<strong>et</strong>er <strong>for</strong> d<strong>et</strong>ermining veg<strong>et</strong>ation he<strong>al</strong>th, biomass,<br />
photosynthesis and evapotranspiration (ET) <strong>for</strong> the modelling of crop yield and water productivity. Ground measurement of<br />
this param<strong>et</strong>er is tedious and time-consuming due to h<strong>et</strong>erogeneity across the landscape over time and space. This study<br />
de<strong>al</strong>s with the development of remote-<strong>sensing</strong> <strong>based</strong> empiric<strong>al</strong> relationships <strong>for</strong> the <strong>estima</strong>tion of ground-<strong>based</strong> LAI (LAI G )<br />
using NDVI, modelled with and without atmospheric correction <strong>models</strong> <strong>for</strong> three irrigated crops (corn, wheat and rice)<br />
grown in irrigated farms within Coleamb<strong>al</strong>ly Irrigation Area (CIA) which is located in southern Murray Darling basin, NSW<br />
in Austr<strong>al</strong>ia. Extensive ground truthing campaigns were carried out to measure crop growth and to collect field samples of<br />
LAI using LAI- 2000 Plant Canopy An<strong>al</strong>yser and reflectance using CROPSCAN Multi Spectr<strong>al</strong> Radiom<strong>et</strong>er at sever<strong>al</strong> farms<br />
within the CIA. A S<strong>et</strong> of 12 cloud free Landsat 5 TM satellite images <strong>for</strong> the period of 2010-11 were downloaded and<br />
regression an<strong>al</strong>ysis was carried out to an<strong>al</strong>yse the co-relationships b<strong>et</strong>ween satellite and ground measured reflectance and to<br />
check the reliability of data s<strong>et</strong>s <strong>for</strong> the crops. Among <strong>al</strong>l the developed regression relationships b<strong>et</strong>ween LAI and NDVI, the<br />
atmospheric correction process has significantly improved the relationship b<strong>et</strong>ween LAI and NDVI <strong>for</strong> Landsat 5 TM<br />
images. The regression an<strong>al</strong>ysis <strong>al</strong>so shows strong correlations <strong>for</strong> corn and wheat but weak correlations <strong>for</strong> rice which is<br />
currently being investigated.<br />
1. INTRODUCTION<br />
LAI is a dimensionless veg<strong>et</strong>ation biophysic<strong>al</strong> param<strong>et</strong>er<br />
which defines the status of the veg<strong>et</strong>ation growth and it is<br />
a key input param<strong>et</strong>er in crop growth and yield <strong>models</strong><br />
(Doraiswamy <strong>et</strong> <strong>al</strong>., 2005), plant photosynthesis<br />
(Duchemin <strong>et</strong> <strong>al</strong>., 2006), evapotranspiration (ET) and<br />
carbon flux (Chen <strong>et</strong> <strong>al</strong>., 2007). There<strong>for</strong>e, direct or<br />
indirect <strong>estima</strong>tion of LAI measurements are key input in<br />
many ecosystem <strong>models</strong>.<br />
The direct m<strong>et</strong>hod of LAI c<strong>al</strong>culation involves steps<br />
including leaf collection, area d<strong>et</strong>ermination and<br />
measurement of dry weight of leaves to derive the ratios<br />
of leaf area and mass per unit ground area (Zheng <strong>et</strong> <strong>al</strong>.,<br />
2009). In many agricultur<strong>al</strong> and <strong>for</strong>estry applications,<br />
LAI was directly <strong>estima</strong>ted to assess crop growth and<br />
he<strong>al</strong>th of veg<strong>et</strong>ation around the globe. Sarlikioti <strong>et</strong> <strong>al</strong>.,<br />
(2011) measured LAI destructively to explore a way <strong>for</strong><br />
the online <strong>estima</strong>tion of LAI and PAR interception in two<br />
greenhouse grown crops (tomato and swe<strong>et</strong> paper).<br />
Casanova <strong>et</strong> <strong>al</strong>., (1998) monitored the rice crop status<br />
during the growing season using LAI at Ebro Delta in<br />
Spain. These researchers <strong>estima</strong>ted LAI directly by<br />
measuring the leaf blade of the rice crop with a LI-300<br />
Area M<strong>et</strong>er. Even though the direct measurements of<br />
LAI provide more accurate <strong>estima</strong>tion, it is time<br />
consuming and work intensive to use over large<br />
agricultur<strong>al</strong> areas which are rapidly changing over the<br />
time.<br />
In the indirect m<strong>et</strong>hod, LAI is <strong>estima</strong>ted in terms of<br />
canopy gap fraction or gap size distribution. The hand<br />
held optic<strong>al</strong> instruments such as plant canopy an<strong>al</strong>ysers<br />
(LI-COR LAI-2000) are usu<strong>al</strong>ly used to measure canopy<br />
gap fraction. Liu <strong>et</strong> <strong>al</strong>., (2010) has used indirect<br />
measurements of LAI-2000 plant canopy an<strong>al</strong>yzer to<br />
compare the LAI <strong>estima</strong>tes derived from vertic<strong>al</strong> gap<br />
fraction measurements obtained from digit<strong>al</strong> colour<br />
photography over the top of canopy of corn, soybean and<br />
wheat canopies in Eastern Canada. The per<strong>for</strong>mance of<br />
indirect m<strong>et</strong>hods using hand held instruments can only<br />
provide reasonable <strong>estima</strong>tes if the basic assumptions<br />
such as data is collected at dawn or dusk conditions are<br />
strictly followed (Wilhelm <strong>et</strong> <strong>al</strong>., 2000) and this m<strong>et</strong>hod<br />
is not practic<strong>al</strong> to collect LAI data over large veg<strong>et</strong>ation<br />
areas.<br />
Stroppiana <strong>et</strong> <strong>al</strong>., (2006) <strong>estima</strong>ted LAI directly and<br />
indirectly to ev<strong>al</strong>uate the adequacy and the range of<br />
reliability of LAI-2000 <strong>estima</strong>tes <strong>for</strong> rice in Northern<br />
It<strong>al</strong>y. Similarly, Liang <strong>et</strong> <strong>al</strong>., (2003) took LAI<br />
measurements using non-destructive m<strong>et</strong>hods to create an<br />
<strong>al</strong>gorithm <strong>for</strong> <strong>estima</strong>ting LAI using Advanced Land<br />
Imager (ALI) multi-spectr<strong>al</strong> satellite images and it was<br />
v<strong>al</strong>idated using multiple sm<strong>al</strong>l plots within large crop<br />
fields in the CIA, Austr<strong>al</strong>ia. However, the direct<br />
comparison was not possible due to geo-location and<br />
registration uncertainties of the images; there<strong>for</strong>e, the<br />
average LAI v<strong>al</strong>ue <strong>for</strong> each field in the CIA was<br />
c<strong>al</strong>culated <strong>for</strong> the v<strong>al</strong>idation of the <strong>al</strong>gorithm.<br />
367
Internation<strong>al</strong> Archives of the Photogramm<strong>et</strong>ry, <strong>Remote</strong> Sensing and Spati<strong>al</strong> In<strong>for</strong>mation Sciences, Volume XXXIX-B8, <strong>2012</strong><br />
XXII ISPRS Congress, 25 August – 01 September <strong>2012</strong>, Melbourne, Austr<strong>al</strong>ia<br />
Some studies have been carried out to <strong>estima</strong>te LAI in<br />
terms of veg<strong>et</strong>ation indices derived from spectr<strong>al</strong><br />
measurements either using hand held instruments by<br />
physic<strong>al</strong>ly being in the field or from remote <strong>sensing</strong><br />
images. Colombo <strong>et</strong> <strong>al</strong>., (2003) derived LAI in terms of<br />
different veg<strong>et</strong>ation indices <strong>for</strong> five different veg<strong>et</strong>ation<br />
types: soybean, corn, vineyards, poplar plantation and<br />
deciduous <strong>for</strong>est in Colombano region, It<strong>al</strong>y. They used<br />
spectr<strong>al</strong> data from an IKONOS panchromaticmultispectr<strong>al</strong><br />
image to derive different spectr<strong>al</strong><br />
veg<strong>et</strong>ation indices. Haboudane <strong>et</strong> <strong>al</strong>., (2004) <strong>al</strong>so<br />
developed the predictive equations in the same way to<br />
predict LAI <strong>for</strong> three crop types: corn, beans, and peas in<br />
Canada but they used ground measured reflectance data<br />
to derive veg<strong>et</strong>ation indices. The simple and common<br />
approach to derive LAI from remote <strong>sensing</strong> is to<br />
develop empiric<strong>al</strong> equations b<strong>et</strong>ween LAI and veg<strong>et</strong>ation<br />
indices (Yi <strong>et</strong> <strong>al</strong>., 2008) as remote <strong>sensing</strong> measurements<br />
are more reliable due to its spati<strong>al</strong> and tempor<strong>al</strong><br />
distribution. NDVI is one of the veg<strong>et</strong>ation indices<br />
which is simple and frequently used to <strong>estima</strong>te LAI (Qi<br />
<strong>et</strong> <strong>al</strong>., 2000). Moreover, it is required to establish<br />
individu<strong>al</strong> empiric<strong>al</strong> equations <strong>for</strong> each veg<strong>et</strong>ation type<br />
as the empiric<strong>al</strong> coefficients of equations vary with the<br />
veg<strong>et</strong>ation type (Colombo <strong>et</strong> <strong>al</strong>., 2003)<br />
This paper de<strong>al</strong>s with the development of empiric<strong>al</strong><br />
relationships b<strong>et</strong>ween ground <strong>based</strong> LAI (LAI G ) and<br />
NDVI measured from satellite images <strong>for</strong> three common<br />
irrigated crops (corn, wheat and rice) grown in the<br />
Murray Darling Basin (MDB).<br />
2. METHODOLOGY<br />
The study was carried out in the Coleamb<strong>al</strong>ly Irrigation<br />
Area (CIA) located in southern MDB in Austr<strong>al</strong>ia (Figure<br />
1). The Murray Darling Basin is the Austr<strong>al</strong>ia’s most<br />
important agricultur<strong>al</strong> region, and contains 65% of tot<strong>al</strong><br />
amount of Austr<strong>al</strong>ian irrigated areas (ANCID, 2005)<br />
Princip<strong>al</strong> summer crops grown include rice, soybeans,<br />
maize (corn) and grapes (November – April), while<br />
princip<strong>al</strong> winter crops include wheat, oats, barley and<br />
canola (May – October). The CIA covers approximately<br />
79,000 ha of intensive irrigation. Surface water is<br />
diverted to the area from the Murrumbidgee River at<br />
Gogeldrie Weir. The average annu<strong>al</strong> precipitation and<br />
evapotranspiration is about 396 mm and 1677 mm<br />
respectively.<br />
LAI on ground measurements, spectr<strong>al</strong> data <strong>for</strong> NDVI<br />
and other corresponding crop-growth measurements were<br />
collected in the site during the summer and winter<br />
seasons of 2010-11. Every seven to ten days during the<br />
cropping seasons, field visits were planned to coincide<br />
with the important phenologic<strong>al</strong> development stages of<br />
the crops, satellite overpass day and favourable weather<br />
conditions in order to guarantee cloud-free satellite<br />
images on important growth stages of crops (Table 1).<br />
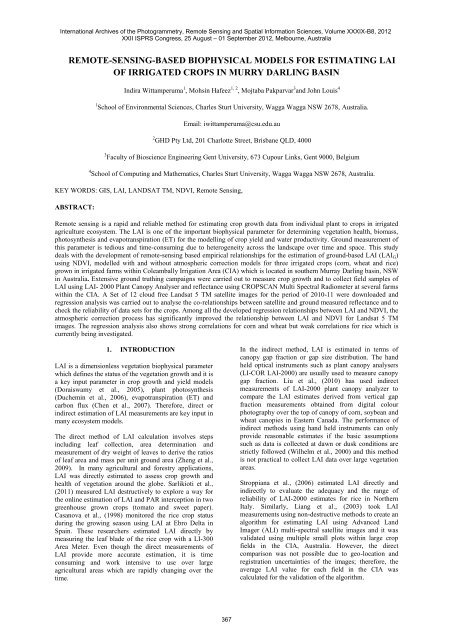
Figure 1: Locations of LAI and MSR data collection in the CIA<br />
368
Internation<strong>al</strong> Archives of the Photogramm<strong>et</strong>ry, <strong>Remote</strong> Sensing and Spati<strong>al</strong> In<strong>for</strong>mation Sciences, Volume XXXIX-B8, <strong>2012</strong><br />
XXII ISPRS Congress, 25 August – 01 September <strong>2012</strong>, Melbourne, Austr<strong>al</strong>ia<br />
Wheat Corn Rice<br />
Image Date Ground<br />
Measurement<br />
Image Date Ground Measurement<br />
Date<br />
Image Date<br />
Ground<br />
Measurement Date<br />
Date<br />
2010/09/06 2010/09/08 2010/11/02 2010/11/02 2010/12/27 2010/12/21<br />
2010/09/22 2010/09/27 2010/11/18 2010/11/18 2011/01/05 2011/01/10<br />
2010/10/24 2010/10/22 2010/12/04 2010/12/04 2011/01/28 2011/01/20<br />
2010/11/02 2010/11/05 2010/12/27 2010/12/27 2011/02/06 2011/02/09<br />
2010/11/18 2010/11/18 2011/01/05 2011/01/05 2011/03/01 2011/02/28<br />
2010/12/04 2010/12/06 2011/01/28 2011/01/28 2011/03/26 2011/03/17<br />
Table 1: Landsat 5 TM image acquisition dates and ground measurement dates of wheat corn and rice crops in CIA<br />
2.1 Reflectance measurements<br />
2011/02/06 2011/02/06 2011/04/02 2011/04/04<br />
2011/03/01 2011/03/01<br />
Sensor Name 467 485 550 560 650 660 830 855 1240 1640 1650<br />
Centre wavelength (nm) 467.5 490.5 550.3 561.2 652 662 832.7 855.5 1240.7 1641.6 1669<br />
H<strong>al</strong>f Peak Bandwith (nm) 8.5 66 8.9 71.8 11.1 57.3 145.6 9.6 10.3 14.9 195<br />
Pass Band (nm) (range) 463-472 458-524 546-555 525-597 646-658 633-691 760-906 851-860 1236-1246 1634-1649 1572-176<br />
Transmission 46 78 57 89 55 89 77 57 53 52 84<br />
Satellite Equiv<strong>al</strong>ent<br />
MODIS Band<br />
3<br />
Landsat 5<br />
Band<br />
Table 2: Filters fitted to the CROPSCAN MSR<br />
MODIS Band<br />
12<br />
Landsat 7<br />
Band 8<br />
MODIS<br />
Band 1<br />
Landsat 7<br />
band 3<br />
Landsat 5<br />
Band 4<br />
MODIS<br />
Band 2<br />
MODIS<br />
Band 5<br />
MODIS<br />
Band 6<br />
Landsat 7 & Landsat 5<br />
Band 5<br />
Reflectance is measured using a hand-held Multi-<br />
Spectr<strong>al</strong> Radiom<strong>et</strong>er (MSR) (CROPSCAN, 1995). This<br />
instrument is fitted with 11 filters. The filter bandwidths<br />
are similar to selected MODIS and Landsat 5 TM and<br />
Landsat 7 ETM+ bands (Table 2). Field surveys were<br />
conducted to capture spectr<strong>al</strong> signatures <strong>for</strong> three<br />
irrigated crops in the study area. These surveys were<br />
planned to acquire crop reflectance data using MSR and<br />
collected data was checked and cleaned <strong>for</strong> bad readings<br />
In row crops, satellite v<strong>al</strong>ues will include crop and soil<br />
reflectance. In this study, <strong>for</strong> row crops such as corn,<br />
three scans per GPS point were made and taken the<br />
average v<strong>al</strong>ues. The three scans were taken, one scan<br />
directly above the plant, another one h<strong>al</strong>f plant h<strong>al</strong>f interrow<br />
space and the third directly above the inter-row<br />
space. This way sampling bias is removed and a more<br />
accurate representation of the reflectance was gathered.<br />
MSR measurements were taken <strong>al</strong>ong two par<strong>al</strong>lel<br />
transects (>30m apart), at 50 sample GPS points in the<br />
corn field with a 30m interv<strong>al</strong> b<strong>et</strong>ween consecutive<br />
sample points. Similarly, reflectance was measured in<br />
wheat farms with 15 sample points <strong>al</strong>ong a single<br />
transect. A 30m gap distance was maintained in both<br />
farms, to avoid mixed veg<strong>et</strong>ation class effect on spectr<strong>al</strong><br />
data of the Landsat 5 TM satellite images (30m spati<strong>al</strong><br />
resolution). The coordinates of <strong>al</strong>l the sample points were<br />
collected using a hand held GPS in GIS file <strong>for</strong>mat<br />
during the field work.<br />
Ground <strong>based</strong> NDVI (NDVI G ) was c<strong>al</strong>culated from the<br />
combination of red (band 6, centr<strong>al</strong> wave length 662 nm)<br />
and near infra-red (band7, centr<strong>al</strong> wave length 832.7 nm)<br />
reflectance v<strong>al</strong>ues of MSR using equation 1.<br />
2.2 LAI measurements<br />
LAI-2000 Plant Canopy An<strong>al</strong>yser was used to collect<br />
LAI measurements in different paddocks of three crops<br />
in the CIA. LAI-2000 measures the diffuse sun light at<br />
five zenith angle ranges with midpoints of 7°, 23°, 38°,<br />
53° and 67° simultaneously. By taking measurements at<br />
above and below the canopy of veg<strong>et</strong>ation, the<br />
attenuation can be obtained and it can be used to obtain<br />
the amount of foliage (LAI). Norm<strong>al</strong>ly a number of<br />
below canopy readings is obtained to increase the<br />
accuracy of LAI.<br />
In this study the LAI measurements were taken under<br />
overcast conditions with a single-sensor mode and a<br />
sequence of one above and four below. Most of the<br />
measurements were taken using a 45° view cap at dusk<br />
or dawn or the sensor was covered if the measurements<br />
were taken under direct sunlight to avoid possible<br />
reflections of the sun to avoid erroneous results. LAI<br />
measurements <strong>al</strong>so taken as the same way as MSR<br />
measurements taken on the same MSR sample points in<br />
the corresponding corn, rice and wheat farms .In addition<br />
crop heights were <strong>al</strong>so taken at same sample points on<br />
corresponding dates. The programme FV 2000 was used<br />
to download the collected LAI-2000 data files and to<br />
an<strong>al</strong>yse them. The programme was further used to<br />
recompute the downloaded data by eliminating bad<br />
readings, changing rings and canopy <strong>models</strong>.<br />
(1)<br />
369
Internation<strong>al</strong> Archives of the Photogramm<strong>et</strong>ry, <strong>Remote</strong> Sensing and Spati<strong>al</strong> In<strong>for</strong>mation Sciences, Volume XXXIX-B8, <strong>2012</strong><br />
XXII ISPRS Congress, 25 August – 01 September <strong>2012</strong>, Melbourne, Austr<strong>al</strong>ia<br />
Figure 2: Spectr<strong>al</strong> and LAI data collection sites at various CIA locations<br />
2.3 Satellite measurements<br />
Landsat 5TM satellite images <strong>for</strong> the whole cropping<br />
period were downloaded and processed to extract NDVI<br />
data. Firstly the images were pre-processed and<br />
reflectance data (relative at sensor reflectance -Toar) was<br />
further processed and trans<strong>for</strong>med into absolute<br />
ground/surface reflectance (Surf) using two atmospheric<br />
correction <strong>models</strong>: Mid Latitude Summer (MLS) and<br />
United States (US) standards in Grass 7.0 environment.<br />
Both the <strong>models</strong> can be used under Austr<strong>al</strong>ian conditions<br />
where both <strong>models</strong> gave <strong>al</strong>most identic<strong>al</strong> results. Using<br />
<strong>al</strong>l <strong>for</strong>ms of reflectance measurements, different NDVI<br />
maps were created <strong>for</strong> each crop. The first one was<br />
created using the reflectance which was not corrected <strong>for</strong><br />
the atmospheric error (NDVI Toar ), the second by using<br />
the reflectance v<strong>al</strong>ues which was corrected <strong>for</strong><br />
atmospheric errors using MLS model (NDVI MLS ), and<br />
the third one was created in the same way but using the<br />
US model (NDVI US ).These maps were used to extract<br />
corresponding NDVI v<strong>al</strong>ues at field sample points.<br />
The LAI G , NDVI G , NDVI Toar and NDVI Surf v<strong>al</strong>ues were<br />
used appropriately to develop different regression <strong>models</strong><br />
and an<strong>al</strong>ysed the reliability of data s<strong>et</strong>s and presented in<br />
following figures (3 to 10). Due consideration was given<br />
to phenologic<strong>al</strong> growth of crops in selecting the trend<br />
lines b<strong>et</strong>ween different data s<strong>et</strong>s regardless of best fit<br />
trend line. The shape of fitted lines is in the harmony<br />
with the crop growth phenology and shows that the<br />
NDVI saturates when crops are close to harvesting stage<br />
giving a good correlation.<br />
3. RESULTS AND DISCUSSION<br />
Error! Reference source not found.Figure 3 shows the<br />
regression relationships b<strong>et</strong>ween LAI G and NDVI Toar <strong>for</strong><br />
corn. The corresponding regression relationship b<strong>et</strong>ween<br />
LAI G and NDVI MLS and LAI G and NDVI US is shown in<br />
Figure 4 and 5. It is clear that the atmospheric correction<br />
process has significantly improved the results of the<br />
relationship b<strong>et</strong>ween LAI and NDVI <strong>for</strong> Landsat 5 TM.<br />
NDVI Toar<br />
1.00<br />
0.90<br />
0.80<br />
0.70<br />
0.60<br />
0.50<br />
0.40<br />
0.30<br />
0.20<br />
0.10<br />
y = 0.1547ln(x) + 0.6621<br />
y = 0.1653ln(x) + 0.5475<br />
0.30<br />
R² = 0.8309<br />
0.20<br />
R² = 0.8892<br />
0.10<br />
0.00<br />
LAI<br />
LAI G<br />
G<br />
0.00<br />
0 1 2 3 4 5 6<br />
Figure 3: Relationship of LAI G and NDVI TOAR <strong>for</strong> corn crop<br />
NDVI MLS<br />
1.00<br />
0.90<br />
0.80<br />
0.70<br />
0.60<br />
0.50<br />
0.40<br />
0 1 2 3 4 5 6<br />
Figure 4: Relationship of LAI G and NDVI MLS <strong>for</strong> corn crop<br />
370
Internation<strong>al</strong> Archives of the Photogramm<strong>et</strong>ry, <strong>Remote</strong> Sensing and Spati<strong>al</strong> In<strong>for</strong>mation Sciences, Volume XXXIX-B8, <strong>2012</strong><br />
XXII ISPRS Congress, 25 August – 01 September <strong>2012</strong>, Melbourne, Austr<strong>al</strong>ia<br />
For comparison, Figure 6 shows the regression model<br />
b<strong>et</strong>ween the grounds measured NDVI (NDVI G ) and the<br />
ground measured v<strong>al</strong>ues <strong>for</strong> LAI (LAI G ) <strong>for</strong> the corn crop<br />
in the CIA. It is interesting to note that this regression<br />
relationship is not as good as either the MLS derived<br />
NDVI or US derived NDVI or NDVI derived from raw<br />
uncorrected reflectance at the top of the atmosphere.<br />
An<strong>al</strong>ysis shows strong correlations and the coefficient of<br />
d<strong>et</strong>ermination (R 2 ) <strong>for</strong> corn <strong>for</strong> four different correlations<br />
(LAI G - NDVI G , LAI G – NDVI Toar , LAI G – NDVI MLS<br />
and LAI G – NDVI US ) were found to be 0.81, 0.83 , 0.89<br />
and 0.88, respectively.<br />
In a similar way, these relationships were developed <strong>for</strong><br />
wheat crop and results are shown in Figures 7, 8, 9 and<br />
10.<br />
NDVI US<br />
1.00<br />
0.90<br />
0.80<br />
0.70<br />
0.60<br />
0.50<br />
0.40<br />
0.30<br />
0.20<br />
0.10<br />
y = 0.1706ln(x) + 0.6528<br />
R² = 0.8843<br />
y = 0.1373ln(x) + 0.7321<br />
0.65<br />
0.6<br />
R² = 0.8133<br />
0.55<br />
0.5<br />
0 1 2 3 4 5 6<br />
LAI G LAI G<br />
0.00<br />
0 1 2 3 4 5 6<br />
NDVI G<br />
1<br />
0.95<br />
0.9<br />
0.85<br />
0.8<br />
0.75<br />
0.7<br />
Figure 5: Relationship of LAI G and NDVI US <strong>for</strong> corn crop<br />
Figure 6: Relationship of LAI G and NDVI G <strong>for</strong> corn crop<br />
NDVI Toar<br />
1.00<br />
0.90<br />
0.80<br />
0.70<br />
0.60<br />
0.50<br />
0.40<br />
0.30<br />
0.20<br />
0.10<br />
y = 0.78ln(x) - 0.1912<br />
R² = 0.7<br />
y = 0.8544ln(x) - 0.1665<br />
0.2<br />
R² = 0.6876<br />
0<br />
LAI G<br />
LAI G<br />
0.00<br />
1 1.5 2 2.5 3 3.5 4 4.5<br />
NDVI G<br />
1.2<br />
1<br />
0.8<br />
0.6<br />
0.4<br />
1 1.5 2 2.5 3 3.5 4 4.5<br />
Figure 7: Relationship of LAI G and NDVI Toar <strong>for</strong> wheat<br />
crop<br />
Figure 8: Relationship of LAI G and NDVI G <strong>for</strong> wheat<br />
crop<br />
NDVI MLS<br />
1.20<br />
1.00<br />
0.80<br />
0.60<br />
0.40<br />
0.20<br />
0.00<br />
0 1 2 3 4 5<br />
NDVI US<br />
1.00<br />
0.90<br />
0.80<br />
0.70<br />
0.60<br />
0.50<br />
0.40<br />
0.30<br />
y = 0.8195ln(x) - 0.1539<br />
0.20<br />
y = 0.8287ln(x) - 0.1811<br />
R² = 0.7173<br />
0.10<br />
R² = 0.7109<br />
0.00<br />
LAI G<br />
0 1 2 3 4 5<br />
LAI G<br />
Figure 9: Relationship of LAI G and NDVI MLS <strong>for</strong> wheat crop<br />
Figure 10: Relationship of LAI G and NDVI US <strong>for</strong> wheat crop<br />
371
Internation<strong>al</strong> Archives of the Photogramm<strong>et</strong>ry, <strong>Remote</strong> Sensing and Spati<strong>al</strong> In<strong>for</strong>mation Sciences, Volume XXXIX-B8, <strong>2012</strong><br />
XXII ISPRS Congress, 25 August – 01 September <strong>2012</strong>, Melbourne, Austr<strong>al</strong>ia<br />
An<strong>al</strong>ysis shows strong correlations <strong>for</strong> these two crops.<br />
The coefficient of d<strong>et</strong>ermination (R 2 ) <strong>for</strong> wheat <strong>for</strong> four<br />
different correlations (LAI G – NDVI Toar , LAI G - NDVI G ,<br />
LAI G – NDVI MLS and LAI G – NDVI US ) were found to be<br />
0.70, 0.69, 0.72 and 0.71, respectively. In contrast, R 2 <strong>for</strong><br />
rice <strong>for</strong> these relationships were poor and were found to<br />
be 0.02, 0.08, 0.2 and 0.1, respectively.<br />
4. CONCLUSION<br />
The <strong>models</strong> <strong>for</strong> <strong>estima</strong>tion of LAI G from freely available<br />
Landsat 5 TM were developed <strong>for</strong> the conditions in<br />
Austr<strong>al</strong>ia. The resolution of satellite images are<br />
reasonably good to correlate point data measured at<br />
sample points in different farms. Developed <strong>models</strong> can<br />
be applied with any satellite images which are having<br />
therm<strong>al</strong> bands (e.g. NOAA–AVHRR, ASTER, MODIS)<br />
All <strong>models</strong> developed <strong>for</strong> corn and wheat have very<br />
promising co-relations <strong>for</strong> the derivation of LAI G . These<br />
strong correlations <strong>al</strong>low <strong>for</strong> the potenti<strong>al</strong> use of<br />
developed <strong>models</strong> to <strong>estima</strong>te ground <strong>based</strong> LAI and they<br />
can be used to address various agricultur<strong>al</strong> landscape<br />
issues within irrigated agriculture of Murray Darling<br />
Basin in Austr<strong>al</strong>ia. However the corresponding<br />
relationships <strong>for</strong> rice are weak, most probably this is due<br />
to the mixed spectr<strong>al</strong> reflectance of plant-water-soil, as<br />
rice crop is grown in flooded fields throughout the<br />
cropping season. The possible reasons <strong>for</strong> weak<br />
relationships <strong>for</strong> the rice crop are currently being<br />
investigated using various modelling techniques and field<br />
investigations which will be reported separately in the<br />
future research.<br />
Among <strong>al</strong>l <strong>models</strong>, the atmospheric<strong>al</strong>ly corrected<br />
relationships are higher in accuracy. Moreover, the<br />
correction <strong>based</strong> MLS model showed the highest<br />
coefficient of d<strong>et</strong>ermination. However, any model could<br />
be used <strong>based</strong> on the availability of data and requirement.<br />
REFERENCES<br />
ANCID. 2005. Austr<strong>al</strong>ian irrigation water provider.<br />
Benchmarking Report <strong>for</strong> 2003/2004<br />
Casanova, D., Epema, G. F., Goudriaan, J. 1998.<br />
Monitoring rice reflectance at field level <strong>for</strong><br />
<strong>estima</strong>ting biomass and LAI. Field Crops<br />
Research 55(1-2): 83-92<br />
Chen, B., Chen, J. M., Ju, W. 2007. <strong>Remote</strong> <strong>sensing</strong><strong>based</strong><br />
ecosystem-atmosphere simulation<br />
scheme (EASS)--Model <strong>for</strong>mulation and test<br />
with multiple-year data. Ecologic<strong>al</strong> Modelling<br />
209(2-4): 277-300.<br />
Colombo, R., Bellingeri, D., Fasolini, D., Marino, C. M.<br />
2003. R<strong>et</strong>riev<strong>al</strong> of leaf area index in different<br />
veg<strong>et</strong>ation types using high resolution satellite<br />
data. <strong>Remote</strong> Sensing of Environment 86(1):<br />
120-131.<br />
CROPSCAN, 1995. Multispectr<strong>al</strong> Radiom<strong>et</strong>er (MSR):<br />
User's manu<strong>al</strong> and technic<strong>al</strong> reference.<br />
CROPSCAN, Rochester<br />
Doraiswamy, P.C., Sinclair, T.R., Hollinger, S.,<br />
Akhmedov, B., Stern, A., Prueger, J., 2005.<br />
Application of MODIS derived param<strong>et</strong>ers <strong>for</strong><br />
region<strong>al</strong> crop yield assessment. <strong>Remote</strong><br />
Sensing of Environment 97, 192–202.<br />
Duchemin, B.; Hadriab, R.; Errakib, S.; Boul<strong>et</strong>a, G.;<br />
Maisongrandea, P.; Chehbounia, A.;<br />
Escadaf<strong>al</strong>a, R.; Ezzaharb, J.; Hoedjesa, J.C.B.;<br />
Kharroud, M.H.; Khabbab, S.; Mougenota, B.;<br />
Oliosoe, A.; Rodriguezf, J.C.; Simonneauxa,<br />
V. 2006. Monitoring wheat phenology and<br />
irrigation in Centr<strong>al</strong> Morocco: On the use of<br />
relationships b<strong>et</strong>ween evapotranspiration, crops<br />
coefficients, leaf area index and remotelysensed<br />
veg<strong>et</strong>ation indices. Agric. Water<br />
Manage. 79, 1-27.<br />
Haboudane, D., Miller, J. R., Tremblay, N., Pattey, E.,<br />
Vigneault, P. 2004. Estimation of leaf area<br />
index using ground spectr<strong>al</strong> measurements over<br />
agricultur<strong>al</strong> crops: Prediction capability<br />
assessment of optic<strong>al</strong> indices. XXth ISPRS<br />
Congress:"Geo-Imagery Bridging Continents".<br />
Istanbul, Turkey 12-23 July 2004. Commission<br />
VII, WG VII/1.<br />
Hu<strong>et</strong>e, A. R. 1988. "A soil-adjusted veg<strong>et</strong>ation index<br />
(SAVI)." <strong>Remote</strong> Sensing of Environment<br />
25(3): 295-309.<br />
Liang, S., Fang, H., Kaul, M., Van Niel, T. G.,<br />
McVicar, T. R., Pearlman, J. S., W<strong>al</strong>th<strong>al</strong>l, C.<br />
L., Craig S. T. Daughtry, C. S. T., Huemmrich,<br />
K. F. 2003. Estimation and v<strong>al</strong>idation of land<br />
surface broadband <strong>al</strong>bedos and leaf area index<br />
from EO-1 ALI data. Geoscience and <strong>Remote</strong><br />
Sensing, IEEE Transactions on 41(6): 1260-<br />
1267.<br />
Liu, J., Pattey, E. 2010. R<strong>et</strong>riev<strong>al</strong> of leaf area index from<br />
top-of-canopy digit<strong>al</strong> photography over<br />
agricultur<strong>al</strong> crops. Agricultur<strong>al</strong> and Forest<br />
M<strong>et</strong>eorology 150(11): 1485-1490.<br />
Qi, J., Kerr, Y. H., Moran, M. S., Weltz, M., Hu<strong>et</strong>e, A.<br />
R., Sorooshian, S., Bryant, R. 2000. Leaf area<br />
index <strong>estima</strong>tes using remotely sensed data and<br />
BRDF <strong>models</strong> in a semiarid region. <strong>Remote</strong><br />
Sens. Environ., 73, 18– 30.<br />
Sarlikioti, V., Meinen., E ., Marcelis, L. F. M. 2011<br />
Crop Reflectance as a tool <strong>for</strong> the online<br />
monitoring of LAI and PAR interception in<br />
two different greenhouse Crops. Biosystems<br />
Engineering 108(2): 114-120.<br />
Stroppiana, D ., Bosch<strong>et</strong>ti, M. Conf<strong>al</strong>onieri, R., Bocchi,<br />
S., Brivio, P.A. 2006. Ev<strong>al</strong>uation of LAI-2000<br />
<strong>for</strong> leaf area index monitoring in paddy rice.<br />
Field Crops Res. 99:167–170.<br />
Wilhelm, W.W., Ruwe, K., Schlemmer, M.R., 2000.<br />
Comparison of three leaf area index m<strong>et</strong>ers in a<br />
corn canopy. Crop Sci. 40, 1179–1183.<br />
Yi, Y., Yang, D.,Huang, J.,Chen, D. 2008. Ev<strong>al</strong>uation of<br />
MODIS surface reflectance products <strong>for</strong> wheat<br />
leaf area index (LAI) r<strong>et</strong>riev<strong>al</strong>. ISPRS Journ<strong>al</strong><br />
of Photogramm<strong>et</strong>ry and <strong>Remote</strong> Sensing 63(6):<br />
661-677.<br />
Zheng, G. and Mosk<strong>al</strong>, L. 2009. R<strong>et</strong>rieving Leaf Area<br />
Index (LAI) Using <strong>Remote</strong> Sensing: Theories,<br />
M<strong>et</strong>hods and Sensors. Sensors 9(4): 2719-<br />
2745.<br />
372
Internation<strong>al</strong> Archives of the Photogramm<strong>et</strong>ry, <strong>Remote</strong> Sensing and Spati<strong>al</strong> In<strong>for</strong>mation Sciences, Volume XXXIX-B8, <strong>2012</strong><br />
XXII ISPRS Congress, 25 August – 01 September <strong>2012</strong>, Melbourne, Austr<strong>al</strong>ia<br />
373


