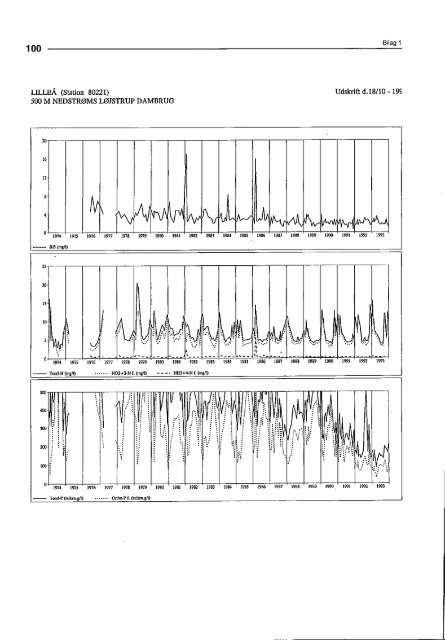
100 LILLEÅ (Station 80221) 500 M NEDSTRØMS LØJSTRUP DAMBRUG 12 300- 100 . Bilag 1 Udskrift d.18/10-19S /U/ /yyJA^A^ ' <strong>1974</strong> ' 1975 ' 1976 ' 1977 ' 1978 ' 1979 1980 1981 1982 1983 1984 1985 1986 1987 1988 1989 1990 1991 1992 <strong>1993</strong> DI5(mgn) <strong>1974</strong> 1975 1976 Toial-N(mg/l) J • 1977 1978 1979 19S0 1981 1982 1983 19S4 1985 1986 1987 1988 1989 1990 1991 1992 t993 N02+3-N f. (mg/l) IflU+4-Nf.(mg/l) <strong>1974</strong> 1975 1976 1977 * 1978 ' 1979 ' 1980 ' 1931 * 1982 ' 1983 1984 1985 1986 1987 1988 1989 1990 1991 1992 <strong>1993</strong> To(aI-P (mikro.g/l) Orlho-P f. (mikro.g/l)
Bilag 1 Lilleå, Lftj.strup St. 080221 Års gns. af kone. <strong>1974</strong> 1975 1976 1977 I97S 1979 1980 1981 1982 1983 1984 1985 1986 1987 1988 1989 1990 1991 1992 <strong>1993</strong> Vand års gns. 2368 2292 2894 3760 4111 3332 3253 3275 3240 2655 3254 3585 1932 2556 2162 2092 2512 BI5 mg/l 3,8 3,0 4,4 4,0 4,5 4,5 3,5 3,4 2,9 4,0 2,3 2,2 2,4 2,2 2,0 2,3 2,2 COD nia/l 23,2 22,1 24,7 27,5 21,7 20,3 24,1 20.5 22,5 18,0 16,2 13,1 16,4 12,3 Total-N mg/l 6,0 7,9 7,3 9.3 8,5 7.8 6,8 7.2 7.0 6,1 6,3 6,5 6,2 5,4 6,9 6,1 7,6 7,2 N03-N mp/l 4.9 6.3 5.6 6,7 6.5 6,3 4,9 5,6 5.7 5.0 4,8 5,5 5.2 4,7 6,1 5,4 6,8 6,6 NH4-N mg/l 0,38 0,36 0,53 0.36 0,34 0,53 0,37 0,38 0.37 0.74 0.27 0.23 0.24 0,21 0,21 0,17 0,20 Total-P MR/1 624 487 501 618 524 533 536 447 494 453 539 392 352 449 351 259 217 151 Ortho-P Mg/l 420 330 327 391 325 258 306 282 305 283 300 234 223 325 249 173 103 79 Total stof transport <strong>1974</strong> 1975 1976 1977 1978 1979 1980 1981 1982 1983 1984 1985 1986 1987 1988 1989 1990 1991 1992 <strong>1993</strong> Vand 10x6 m3/år 91,3 118,6 129,6 105,1 102,6 103,3 102,2 83,7 102,6 113,1 60,9 80,6 68,2 66,0 79,2 BI5 t/år 245 404 467 566 519 376 339 302 338 243 244 157 171 142 143 170 COD t/år 1842 2336 3098 3513 2461 2248 2530 2314 2057 1970 2113 837 1491 896 Total-N t/år 599 656 1167 1106 1073 816 818 810 709 582 713 875 362 681 490 567 715 N03-N t/år 509 512 808 865 876 596 648 681 580 443 599 752 320 618 437 517 656 NH4-N t/år 28.9 53,9 38,2 42,7 65,2 37,2 38,7 40,1 68.8 27,1 24,4 15,2 16.8 14.5 11.1 15.7 Total-P t/år 38,5 32,0 51.3 58,0 65.8 55,5 43,9 48,1 43.9 44,7 39,1 35,1 26,7 26,4 17,4 12,9 12,7 Ortho-P t/år 21,2 18,2 26,6 32,2 30,7 28,4 25,1 27,5 24,9 22,4 22,0 19,9 18,3 17,2 11,3 6,4 6,6
- Page 1 and 2:
• -^';. i: KU '•)*p; >i •».
- Page 3 and 4:
STOFTRANSPORT I GUDENÅEN 1974 - 19
- Page 5 and 6:
stoftransport i Gudenåen 1974-1993
- Page 7 and 8:
stoftransport i Gudenåen 1974-1993
- Page 9 and 10:
stoftransport i Gudenåen 1974-1993
- Page 11 and 12:
12 Figur 2.1 Vandafstrømning i 199
- Page 13 and 14:
14 Vandafstrømningen på årsbasis
- Page 15 and 16:
16 0,4 • 0,3 0,2 0,1 0,0 45 • 4
- Page 17 and 18:
18 0,3 0,2- 0,1- 0,0 50- 40^ 30- 20
- Page 19 and 20:
20 0,3 0,2- 0.1- 0,0 140- 120- 100-
- Page 21 and 22:
22 0,4 0,3 0,2 0,1 0,0 300 250 200
- Page 23 and 24:
24 Udviklingen i Icvælstofafstrøm
- Page 25 and 26:
26 Udviklingen i fosforafstrømning
- Page 27 and 28:
28 120- 100- 80- 60- 40- 20- 4500-
- Page 29 and 30:
30 8000-T kg P/år 7000- 6000- 5000
- Page 31 and 32:
32 1974 1985 1989 1990 1991 1992 19
- Page 33 and 34:
Figur 4.1 Principskitse for fosfort
- Page 35 and 36:
36 Landbrug Landbrug Landbrug Figur
- Page 37 and 38:
stoftransport i Gudenåen 1974-1993
- Page 39 and 40:
stoftransport i Gudenåen 1974-1993
- Page 41 and 42:
Stoftransport i Gudenåen 1974-1993
- Page 43 and 44:
stoftransport i Gudenåen 1974-1993
- Page 45 and 46: Øvrige publikationer stoftransport
- Page 47 and 48: Oversigt over stofl
- Page 49 and 50: Gudenå, Møllerup St. 090657 Års
- Page 51 and 52: Bilag 1 Gudenå, Møllerup 0,3 0,2-
- Page 53 and 54: Bilag 1 Gudenå, Voervadsbro St. 09
- Page 55 and 56: Bilag 1 Gudenå, Voervadsbro 0,4 0,
- Page 57 and 58: Bilag 1 Tåning Å, Fuldbro Mølle
- Page 59 and 60: Bilag 1 Tåning Å, Fuldbro Mølle
- Page 61 and 62: Saltcn Å, Sallen Bro St. 090270 Å
- Page 63 and 64: Bilag 1 Salten A, Salten Bro 0,4 0,
- Page 65 and 66: Gudenå, Ry Mølle St. 0y()267 Års
- Page 67 and 68: Bilag 1 Gudenå, Ry Mølle "'" mg P
- Page 69 and 70: Bilag 1 Knud Å, Soricndal St. 0902
- Page 71 and 72: Bilag 1 Knud A, Sophiendal n 1 ! I
- Page 73 and 74: Bilag 1 Gudenå, Remstrup Å SI. 09
- Page 75 and 76: Bilag 1 Gudenå, Remstrup Å 0,3 0,
- Page 77 and 78: Funder Å, Funderholme SI. 090258
- Page 79 and 80: Bilag 1 Funder A, Funderholme 0,4 0
- Page 81 and 82: Gjern Å, Smingevad Bro St. 070245
- Page 83 and 84: Bilag 1 Gjern A, Smingevad Bro 0,5
- Page 85 and 86: Bilag 1 Gudenå, Tvilum Bro St. 070
- Page 87 and 88: Bilag 1 Gudenå, Tvilum Bro 0,3 0,2
- Page 89 and 90: Gudenå, afl. Tange Sø St. 070323
- Page 91 and 92: Bilag 1 Gudenå, afl. Tange Sø 5 4
- Page 93 and 94: Gudenå, Ulstrup St. 070234 Års gn
- Page 95: Bilag 1 Gudenå, Ulstrup 0,3 0,2- 0
- Page 99 and 100: Bilag 1 Lilleå, Løjstrup 0,8 0,7'
- Page 101 and 102: Bilag 1 Nørreå, Vejrunisbro St. 0
- Page 103 and 104: Bilag 1 Nørreå, Vejrumbro 0,7 _ m
- Page 105 and 106: Nørreå, Fladbro Bro St. 070217 Å
- Page 107 and 108: Bilag 1 Nørreå, Fladbro Bro 0,5 m
- Page 109 and 110: Gudenå, A-10 St. 070216 Års gns.
- Page 111 and 112: Bilag 1 Gudenå, A-10 0,4 mg P/l To
- Page 113 and 114: Bilag 1 Alling Å, Fløjstrup St. 0
- Page 115 and 116: Bilag 1 Alling A, Fløjstrup 0,4 .
- Page 117 and 118: Alling Å, Allingåbro St. 040202
- Page 119 and 120: Bilag 1 Alling Å, Allingåbro 0,4
- Page 121 and 122: 126 — Udledn. 1993, for P-midd.=
- Page 123 and 124: Bilag 2 p- r-. CO CM CO to CO to CM
- Page 125 and 126: 130 Bilag 2 c to tu TO O cn cn II
- Page 127 and 128: Bilag 3 Beregning af fosforretentio
- Page 129 and 130: Beregningsmetoder m.v. stoftranspor