Skriptum (PDF) - Institut für Experimentelle und Angewandte Physik
Skriptum (PDF) - Institut für Experimentelle und Angewandte Physik
Skriptum (PDF) - Institut für Experimentelle und Angewandte Physik

Erfolgreiche ePaper selbst erstellen
Machen Sie aus Ihren PDF Publikationen ein blätterbares Flipbook mit unserer einzigartigen Google optimierten e-Paper Software.
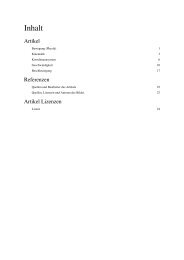
An Introduction to Extraterrestrial Physics<br />
very preliminary lecture notes<br />
Robert F. Wimmer-Schweingruber<br />
winter 2004/2005<br />
Robert F. Wimmer-Schweingruber<br />
<strong>Institut</strong> <strong>für</strong> experimentelle <strong>und</strong> angewandte <strong>Physik</strong><br />
Abt. Extraterrestrik<br />
Leibnizstrasse 11, D-24118 Kiel
Contents<br />
1 Introduction 9<br />
2 Formation of the Solar System 11<br />
2.1 The Interstellar Medium . . . . . . . . . . . . . . . . . . . . . . 11<br />
2.1.1 Composition of the Interstellar Medium . . . . . . . . . . 11<br />
2.1.2 Nucleosynthesis . . . . . . . . . . . . . . . . . . . . . . . 13<br />
2.1.3 Galactic Chemical Evolution . . . . . . . . . . . . . . . . 14<br />
2.1.4 contributions to the Solar Nebula . . . . . . . . . . . . . 18<br />
2.2 Star Formation . . . . . . . . . . . . . . . . . . . . . . . . . . . 18<br />
2.2.1 Jeans Collapse . . . . . . . . . . . . . . . . . . . . . . . 18<br />
2.2.2 Free-Fall Time . . . . . . . . . . . . . . . . . . . . . . . 21<br />
2.2.3 Instabilities . . . . . . . . . . . . . . . . . . . . . . . . . 23<br />
2.3 Accretion Disks . . . . . . . . . . . . . . . . . . . . . . . . . . . 23<br />
2.3.1 Chemistry in the Disk . . . . . . . . . . . . . . . . . . . 25<br />
2.3.2 Meteoritic Information . . . . . . . . . . . . . . . . . . . 26<br />
2.3.3 Dust Coagulation . . . . . . . . . . . . . . . . . . . . . . 32<br />
2.3.4 From Planetesimals to Planets . . . . . . . . . . . . . . . 33<br />
2.3.5 Clearing the Disk . . . . . . . . . . . . . . . . . . . . . . 34<br />
2.4 Exosolar Planets . . . . . . . . . . . . . . . . . . . . . . . . . . 36<br />
2.4.1 Detection of Exosolar Planets . . . . . . . . . . . . . . . 36<br />
2.4.2 Metallicity of the Protostellar Discs . . . . . . . . . . . . 36<br />
3 The Sun 39<br />
3.1 Solar Interior . . . . . . . . . . . . . . . . . . . . . . . . . . . . 39<br />
3.2 Nuclear Reactions . . . . . . . . . . . . . . . . . . . . . . . . . . 42<br />
3.2.1 Hydrogen Burning . . . . . . . . . . . . . . . . . . . . . 42<br />
3.2.2 Cross Sections . . . . . . . . . . . . . . . . . . . . . . . . 42<br />
3.2.3 Kinetic Energy of Protons in the Core . . . . . . . . . . 44<br />
3.2.4 The Solar Neutrino Problem (†) . . . . . . . . . . . . . . 45<br />
3.3 Large-Scale Structure of the Sun . . . . . . . . . . . . . . . . . . 51<br />
3.3.1 Radiative Transport . . . . . . . . . . . . . . . . . . . . 51<br />
3
4 CONTENTS<br />
3.3.2 Convective Transport . . . . . . . . . . . . . . . . . . . . 55<br />
3.4 Solar Evolution Models . . . . . . . . . . . . . . . . . . . . . . . 58<br />
3.5 Verifying Solar Evolution Models . . . . . . . . . . . . . . . . . 59<br />
3.5.1 Helioseismology . . . . . . . . . . . . . . . . . . . . . . . 59<br />
3.5.2 So<strong>und</strong> Speed in the Solar Interior . . . . . . . . . . . . . 62<br />
3.5.3 Elemental Migration . . . . . . . . . . . . . . . . . . . . 64<br />
3.6 The Faint-Young-Sun Problem . . . . . . . . . . . . . . . . . . . 72<br />
3.6.1 The Greenhouse Effect . . . . . . . . . . . . . . . . . . . 75<br />
3.7 Solar Atmosphere . . . . . . . . . . . . . . . . . . . . . . . . . . 80<br />
3.7.1 The Photosphere . . . . . . . . . . . . . . . . . . . . . . 80<br />
3.7.2 The Chromosphere . . . . . . . . . . . . . . . . . . . . . 84<br />
3.7.3 The Corona . . . . . . . . . . . . . . . . . . . . . . . . . 87<br />
3.7.4 Coronal Heating . . . . . . . . . . . . . . . . . . . . . . 96<br />
3.7.5 Linking the Corona to the Photosphere . . . . . . . . . . 96<br />
3.7.6 Source-Surface Models . . . . . . . . . . . . . . . . . . . 97<br />
3.7.7 Coronal Activity, Solar Activity, and Stellar Activity . . 97<br />
3.8 Formation of the Solar Wind . . . . . . . . . . . . . . . . . . . . 97<br />
3.8.1 Early Observations . . . . . . . . . . . . . . . . . . . . . 97<br />
3.8.2 The Solar Wind . . . . . . . . . . . . . . . . . . . . . . . 98<br />
3.8.3 The Parker Model . . . . . . . . . . . . . . . . . . . . . 99<br />
3.8.4 Coronal Heating Revisited . . . . . . . . . . . . . . . . . 108<br />
3.9 Shaping the Heliosphere . . . . . . . . . . . . . . . . . . . . . . 120<br />
3.9.1 The Local Interstellar Environment . . . . . . . . . . . . 120<br />
3.9.2 Parker Model . . . . . . . . . . . . . . . . . . . . . . . . 120<br />
4 Dynamos 121<br />
4.1 A Simple Model . . . . . . . . . . . . . . . . . . . . . . . . . . . 121<br />
4.2 Cowlings Theorem . . . . . . . . . . . . . . . . . . . . . . . . . 123<br />
4.3 Modern Dynamo Theory . . . . . . . . . . . . . . . . . . . . . . 124<br />
4.4 The Solar Dynamo . . . . . . . . . . . . . . . . . . . . . . . . . 124<br />
4.5 Planetary Dynamos . . . . . . . . . . . . . . . . . . . . . . . . . 124<br />
5 The Planets 127<br />
5.1 Structure of the Planets . . . . . . . . . . . . . . . . . . . . . . 127<br />
5.1.1 Terrestrial Planets . . . . . . . . . . . . . . . . . . . . . 127<br />
5.1.2 The Gas Giants . . . . . . . . . . . . . . . . . . . . . . . 127<br />
5.1.3 Pluto? . . . . . . . . . . . . . . . . . . . . . . . . . . . . 127<br />
5.1.4 Exoplanets . . . . . . . . . . . . . . . . . . . . . . . . . . 127<br />
5.2 Terrestrial Planets . . . . . . . . . . . . . . . . . . . . . . . . . 127<br />
5.2.1 Internal Structure . . . . . . . . . . . . . . . . . . . . . . 127<br />
5.2.2 uncompressed density . . . . . . . . . . . . . . . . . . . . 127
CONTENTS 5<br />
5.3 The Gas Giants . . . . . . . . . . . . . . . . . . . . . . . . . . . 127<br />
5.4 The Outer Planets . . . . . . . . . . . . . . . . . . . . . . . . . 127<br />
5.5 Comets . . . . . . . . . . . . . . . . . . . . . . . . . . . . . . . . 127<br />
5.6 Asteroids . . . . . . . . . . . . . . . . . . . . . . . . . . . . . . 127<br />
6 Planetary Atmospheres 129<br />
6.1 Description of Atmospheres . . . . . . . . . . . . . . . . . . . . 129<br />
6.2 Origin of Atmospheres . . . . . . . . . . . . . . . . . . . . . . . 129<br />
6.3 Survival of Atmospheres . . . . . . . . . . . . . . . . . . . . . . 129<br />
6.4 Dynamics of the Terrestrial Atmosphere . . . . . . . . . . . . . 130<br />
6.5 The COSPAR standard atmosphere . . . . . . . . . . . . . . . . 130<br />
7 The Ionosphere 131<br />
7.1 Origin of the Ionosphere . . . . . . . . . . . . . . . . . . . . . . 131<br />
7.2 Charging Processes . . . . . . . . . . . . . . . . . . . . . . . . . 131<br />
7.3 Chemistry . . . . . . . . . . . . . . . . . . . . . . . . . . . . . . 131<br />
7.4 Seasonal Variations . . . . . . . . . . . . . . . . . . . . . . . . . 131<br />
7.5 Day/Night Variations . . . . . . . . . . . . . . . . . . . . . . . . 131<br />
8 The Magnetosphere 133<br />
8.1 Origin of the Magnetosphere . . . . . . . . . . . . . . . . . . . . 133<br />
8.2 Overall Structure . . . . . . . . . . . . . . . . . . . . . . . . . . 133<br />
8.3 Currents and Current-Sheets . . . . . . . . . . . . . . . . . . . . 133<br />
8.4 Magnetospheric Dynamics . . . . . . . . . . . . . . . . . . . . . 133<br />
8.5 Scales and Cross-Scale Coupling . . . . . . . . . . . . . . . . . . 133<br />
8.6 Particle Acceleration . . . . . . . . . . . . . . . . . . . . . . . . 133<br />
8.7 Storms and Substorms . . . . . . . . . . . . . . . . . . . . . . . 133<br />
8.8 Solar-Terrestrial Physics . . . . . . . . . . . . . . . . . . . . . . 133<br />
8.9 Comparing Different Magnetospheres . . . . . . . . . . . . . . . 133<br />
8.9.1 Jupiter and Other Giant Planets . . . . . . . . . . . . . 133<br />
8.9.2 Planets Without Magnetic Fields and With Atmospheres 133<br />
8.9.3 Planets With Magnetic Fields and Without Atmospheres 134<br />
8.9.4 Planets Without Magnetic Fields and Without Atmospheres<br />
. . . . . . . . . . . . . . . . . . . . . . . . . . . . 134<br />
9 The Earth’s Plasma Environment 135<br />
9.1 Particle Motion in a Magnetic Field . . . . . . . . . . . . . . . . 135<br />
9.2 Definition of adiabatic invariants . . . . . . . . . . . . . . . . . 142<br />
9.3 Particle Drifts . . . . . . . . . . . . . . . . . . . . . . . . . . . . 148<br />
9.4 Instabilities . . . . . . . . . . . . . . . . . . . . . . . . . . . . . 148<br />
9.5 Plasma Waves in Extraterrestrial Plasmas . . . . . . . . . . . . 148<br />
9.6 Shock Formation . . . . . . . . . . . . . . . . . . . . . . . . . . 148
6 CONTENTS<br />
9.7 Bo<strong>und</strong>ary Layers . . . . . . . . . . . . . . . . . . . . . . . . . . 148<br />
10 Kinetic Physics 149<br />
10.1 Phase Space Density and Distribution Functions . . . . . . . . . 150<br />
10.2 The Boltzmann Equation . . . . . . . . . . . . . . . . . . . . . . 150<br />
10.3 The Vlasov Equation . . . . . . . . . . . . . . . . . . . . . . . . 150<br />
10.3.1 Fokker-Planck . . . . . . . . . . . . . . . . . . . . . . . . 150<br />
10.4 Pitch-Angle Distributions . . . . . . . . . . . . . . . . . . . . . 150<br />
10.5 Velocity Distributions Functions . . . . . . . . . . . . . . . . . . 150<br />
10.5.1 Ion VDFs . . . . . . . . . . . . . . . . . . . . . . . . . . 150<br />
10.5.2 Electron VDFs . . . . . . . . . . . . . . . . . . . . . . . 150<br />
10.5.3 Coulomb Collisions . . . . . . . . . . . . . . . . . . . . . 150<br />
10.5.4 Stability of VDFs . . . . . . . . . . . . . . . . . . . . . . 150<br />
10.5.5 Heating and Cooling . . . . . . . . . . . . . . . . . . . . 150<br />
10.6 Wave-Particle Interactions and Instabilities . . . . . . . . . . . . 150<br />
10.7 Turbulence and Heating . . . . . . . . . . . . . . . . . . . . . . 151<br />
11 heliosphere 153<br />
11.1 The Inner Heliosphere . . . . . . . . . . . . . . . . . . . . . . . 153<br />
11.1.1 linking the Corona to the Heliosphere . . . . . . . . . . . 153<br />
11.1.2 The Magnetic Field . . . . . . . . . . . . . . . . . . . . . 153<br />
11.1.3 The Frozen-in Interplanetary Magnetic Field . . . . . . . 153<br />
11.1.4 Properties of the Solar Wind . . . . . . . . . . . . . . . . 163<br />
11.1.5 Magnetic Sector Structure . . . . . . . . . . . . . . . . . 164<br />
11.1.6 Stream Structure . . . . . . . . . . . . . . . . . . . . . . 164<br />
11.1.7 SEP propagation . . . . . . . . . . . . . . . . . . . . . . 164<br />
11.2 Interplanetary Dust . . . . . . . . . . . . . . . . . . . . . . . . . 164<br />
11.2.1 Poynting-Robertson . . . . . . . . . . . . . . . . . . . . . 164<br />
11.2.2 Mie-Scattering . . . . . . . . . . . . . . . . . . . . . . . 164<br />
11.2.3 Dust Dynamics and Origin . . . . . . . . . . . . . . . . . 164<br />
11.3 The Heliosphere in 3-d . . . . . . . . . . . . . . . . . . . . . . . 188<br />
11.3.1 Ulysses results . . . . . . . . . . . . . . . . . . . . . . . . 188<br />
11.3.2 Corotating Interaction Regions . . . . . . . . . . . . . . 188<br />
11.3.3 Fisks Model . . . . . . . . . . . . . . . . . . . . . . . . . 188<br />
11.3.4 Corotating Interaction Regions . . . . . . . . . . . . . . 188<br />
11.4 Langsame Variationen . . . . . . . . . . . . . . . . . . . . . . . 192<br />
11.5 The outer heliosphere . . . . . . . . . . . . . . . . . . . . . . . . 194<br />
11.5.1 Voyager Results . . . . . . . . . . . . . . . . . . . . . . . 194<br />
11.5.2 Pickup ions . . . . . . . . . . . . . . . . . . . . . . . . . 194<br />
11.5.3 The magnetic field . . . . . . . . . . . . . . . . . . . . . 194<br />
11.5.4 Energy Considerations . . . . . . . . . . . . . . . . . . . 194
CONTENTS 7<br />
12 Solar Terrestrial Physics 195<br />
12.1 Space Weather . . . . . . . . . . . . . . . . . . . . . . . . . . . 195<br />
12.2 Solar Activity . . . . . . . . . . . . . . . . . . . . . . . . . . . . 195<br />
12.2.1 Remote Observations . . . . . . . . . . . . . . . . . . . . 195<br />
12.2.2 Radio Observations . . . . . . . . . . . . . . . . . . . . . 195<br />
12.2.3 In-situ Observations . . . . . . . . . . . . . . . . . . . . 195<br />
12.2.4 Particle Acceleration at the Sun . . . . . . . . . . . . . . 195<br />
12.3 Magnetospheric Response . . . . . . . . . . . . . . . . . . . . . 195<br />
12.4 Ionospheric response . . . . . . . . . . . . . . . . . . . . . . . . 196<br />
12.5 Heliospheric Response . . . . . . . . . . . . . . . . . . . . . . . 196<br />
12.5.1 Shock Formation . . . . . . . . . . . . . . . . . . . . . . 196<br />
12.5.2 Particle Acceleration at Shocks . . . . . . . . . . . . . . 196<br />
12.5.3 Forbush Decreases . . . . . . . . . . . . . . . . . . . . . 196<br />
12.6 Solar Energetic Particles . . . . . . . . . . . . . . . . . . . . . . 196<br />
12.6.1 Properties . . . . . . . . . . . . . . . . . . . . . . . . . . 196<br />
12.6.2 Transport Processes . . . . . . . . . . . . . . . . . . . . 196<br />
12.6.3 Archives for SEPs? . . . . . . . . . . . . . . . . . . . . . 196<br />
12.7 Implications for Society . . . . . . . . . . . . . . . . . . . . . . . 197<br />
13 Galactic Cosmic Rays 199<br />
13.1 Discovery of Cosmic Rays . . . . . . . . . . . . . . . . . . . . . 199<br />
13.2 Observations of Cosmic Rays . . . . . . . . . . . . . . . . . . . 199<br />
13.2.1 methods . . . . . . . . . . . . . . . . . . . . . . . . . . . 199<br />
13.3 Origin of the GCR . . . . . . . . . . . . . . . . . . . . . . . . . 200<br />
13.3.1 FIP vs. volatility . . . . . . . . . . . . . . . . . . . . . . 200<br />
13.3.2 The Anomalous Component of Cosmic Radiation (ACR) 200<br />
13.3.3 Solar Cosmic Rays . . . . . . . . . . . . . . . . . . . . . 200<br />
13.3.4 The Greisen-Zatsepin-Kuzmin Cutoff Problem . . . . . . 200<br />
13.4 Measurements of GCR in the Heliosphere . . . . . . . . . . . . . 200<br />
13.4.1 GCR composition . . . . . . . . . . . . . . . . . . . . . . 200<br />
13.5 GCR Modulation . . . . . . . . . . . . . . . . . . . . . . . . . . 201<br />
13.5.1 Modulation Models . . . . . . . . . . . . . . . . . . . . . 201<br />
13.5.2 Particle Drifts . . . . . . . . . . . . . . . . . . . . . . . . 201<br />
13.5.3 Diffusion . . . . . . . . . . . . . . . . . . . . . . . . . . . 201<br />
13.5.4 Mean Free Paths . . . . . . . . . . . . . . . . . . . . . . 201<br />
13.5.5 Microscopic Origin of Transport Parameters . . . . . . . 201<br />
13.5.6 Kinetic Models . . . . . . . . . . . . . . . . . . . . . . . 201<br />
13.6 GCRs at Earth . . . . . . . . . . . . . . . . . . . . . . . . . . . 201
8 CONTENTS<br />
14 Dosimetry 203<br />
14.1 Interaction of Charged Particles with Matter . . . . . . . . . . . 203<br />
14.1.1 Ionization: Bethe-Bloch . . . . . . . . . . . . . . . . . . 203<br />
14.1.2 Other Interactions . . . . . . . . . . . . . . . . . . . . . 203<br />
14.1.3 cascades . . . . . . . . . . . . . . . . . . . . . . . . . . . 204<br />
14.1.4 air showers . . . . . . . . . . . . . . . . . . . . . . . . . 204<br />
14.1.5 GEANT . . . . . . . . . . . . . . . . . . . . . . . . . . . 204<br />
14.2 Ionizing Radiation . . . . . . . . . . . . . . . . . . . . . . . . . 204<br />
14.2.1 Biological Effects . . . . . . . . . . . . . . . . . . . . . . 204<br />
14.2.2 Dosimetry . . . . . . . . . . . . . . . . . . . . . . . . . . 204<br />
14.2.3 Measurement Techniques . . . . . . . . . . . . . . . . . . 204<br />
14.3 Example: A Manned Mission to Mars . . . . . . . . . . . . . . . 204
Chapter 1<br />
Introduction<br />
9
10 CHAPTER 1. INTRODUCTION
Chapter 2<br />
Formation of the Solar System<br />
2.1 The Interstellar Medium<br />
2.1.1 Composition of the Interstellar Medium<br />
The composition of the LISM is known to a limited extent both from remotesensing<br />
observations and from space-based particle instruments. The latter<br />
measure either interstellar pick-up ions, interstellar neutral atoms, or the reaccelerated<br />
anomalous component of cosmic rays, the ACR. Remote-sensing observations<br />
make use of characteristic emission or absorption lines of molecules<br />
and atoms. While remote sensing by necessity can only yield line-of-sight averaged<br />
values for the composition of the LISM, particle instruments only measure<br />
the composition of the very, very local ISM. It is possible, <strong>und</strong>er favorable circumstances,<br />
that remote observations obtain measurements of the composition<br />
(and speed and temperature or turbulence) of more than one cloud along a<br />
line of sight, if the clouds differ sufficiently in their relative speeds along the<br />
line of sight so that the absorption or emission lines can be separated due to<br />
the ensuing different Doppler shifts. Most information about the composition<br />
of interstellar clouds and the interstellar medium come from remote-sensing<br />
observations. Binney and Merrifield (1998) and Pagel (1997) give lucid introductions<br />
to such measurements.<br />
The first systematic analysis of the composition of the ISM was performed<br />
along the line of sight towards ζ Ophiuci (Morton, 1974, 1975). We have plotted<br />
their measurements in Figure ?? but against improved 50% condensation<br />
temperatures given by Lodders and B. Fegely, Jr. (1998) normalized to the<br />
improved photospheric or meteoritic ab<strong>und</strong>ances given in Grevesse and Sauval<br />
(1998). As Morton (1974) reported we observe a strong depletion of the refractive<br />
elements relative to standard “cosmic” (i. e. solar) ab<strong>und</strong>ances. The<br />
more volatile elements such as nitrogen, or carbon are much less depleted. It<br />
11
12 CHAPTER 2. FORMATION OF THE SOLAR SYSTEM<br />
Figure 2.1: Depletion of refractory elements along the line of sight towards ζ<br />
Ophiuci. The depleted elements are enriched in interstellar grains. The volatile<br />
elements are only weakly depleted and may form a thin veneer on the grains<br />
in regions where temperatures permit condensation onto grains or on grains<br />
that were not heated to higher temperatures. Ab<strong>und</strong>ances towards ζ Ophiuci<br />
from Morton (1974), normalized to solar system ab<strong>und</strong>ances from Grevesse<br />
and Sauval (1998) versus 50% condensation temperatures from Lodders and<br />
B. Fegely, Jr. (1998).<br />
is gratifying that using the improved condensation temperatures and solar system<br />
ab<strong>und</strong>ances makes the depletion pattern stand out even more clearly than<br />
when using the original data of Morton (1974). On the other hand it is a sobering<br />
fact that, once again, it is improvements in the solar ab<strong>und</strong>ances that are<br />
at least partly responsible for this improvement. Once more this demonstrates<br />
our limited knowledge of solar ab<strong>und</strong>ances. The pattern of depletion has since<br />
been observed along numerous other lines of sight. Field (1974) interpreted<br />
the depletion pattern as suggesting condensation onto grains <strong>und</strong>er pressure<br />
in the atmospheres of stars or during star formation. However, this scenario of<br />
the depletion pattern being determined during the grain-formation process has<br />
increasingly been questioned. Traveling interstellar shocks play an important<br />
role in the formation of interstellar clouds. In this case, depletion in the gas
2.1. THE INTERSTELLAR MEDIUM 13<br />
phase would occur for the elements that remain in grains during the passage<br />
of an interstellar shock. The shock heats the grains and the more volatile elements<br />
evaporate, leaving the condensible ones on the grains. Here we also note<br />
that grain chemistry is extremely important for <strong>und</strong>erstanding the ab<strong>und</strong>ance<br />
patterns. Presently it is not clear exactly why the observed depletion patterns<br />
form in that way. For our purpose we note that the depletion pattern is organized<br />
such that element ab<strong>und</strong>ances relative to solar ab<strong>und</strong>ances decrease<br />
with increasing condensation temperature. Some elements don’t seem to fit the<br />
trend, notably Ca which is depleted much more than would be expected from<br />
the general trend. A special section of the Journal of Geophysical Research<br />
(105:A5, (2000)) contains a number of articles dealing with the composition<br />
and other properties of interstellar dust and their relations to the ISM. The<br />
isotopic composition of the ISM is known fairly well. Wilson and Matteucci<br />
(1992) and Wilson and Rood (1994) review the observational status. Measurements<br />
of isotopes seem to confirm the puzzling observation that the Sun<br />
is more metal-rich than the local neighborhood indicating that it formed from<br />
material that had <strong>und</strong>ergone more chemical processing than the present-day<br />
LISM has. The observations of galactic gradients in the isotope ratios of C,<br />
N, O, and S have implications for the galactic chemical evolution but will not<br />
be discussed in more detail here. The measured isotope ratios are often quite<br />
different from solar or terrestrial values, i. e. they may differ by a factor of two<br />
or so.<br />
2.1.2 Nucleosynthesis<br />
Primordial Nucleosynthesis The first nuclei were produced during the<br />
Big Bang about 13 billion years ago and then served as the seeds for further<br />
chemical processing in stars. The helium mass fraction can in the early universe<br />
can be estimated from the mass difference between proton and neutron and<br />
the energy or temperature below which neutrons and protons cease to be in<br />
chemical equilibrium.<br />
Most of the matter remained in the form of protons (and electrons), small<br />
amounts of deuteerium and tritium, a fraction of helium, as well as small<br />
amounts of rare light elemenents which are important for the further synthesis<br />
of elements in stars.<br />
Stellar Nucleosynthesis Most elements heavier than helium and parts of<br />
helium were processed in stars and in supernovae. Main sequence stars, such<br />
as the Sun, gain their energy from the net fusion of four protons into a helium<br />
nucleus (alpha particle) in the so-called “pp-chain”.
14 CHAPTER 2. FORMATION OF THE SOLAR SYSTEM<br />
Figure 2.2: pp-chain: The net reaction fuses four protons into a helium nucleus<br />
with a net relrease of energy.<br />
The rates of the fusion reactions (not only of the pp-chain) increase dramatically<br />
with increasing temperature, the small fraction of particles inside the<br />
suprathermal tails of the Boltzmann distribution have enough energy to penetrate<br />
the strong Coulomb barrier protecting nuclei from other nuclei. Once<br />
this barrier has been passed, nuclear forces dominate and nuclear reactions can<br />
take place. Nuclear reactions take place at equilibrium temperatures exceeding<br />
several million degrees. We will go into more detail about these processes<br />
in the chapter on solar structure (Chapter 3). We will not, however, treat<br />
the origin of elements in this course. That may eventually be the case in a<br />
specialized course on the origin of elements sometime in the distant future. . .<br />
2.1.3 Galactic Chemical Evolution<br />
Even without exact knowledge of the nucleosynthetic processes, we can set up<br />
a simple model for galactic chemical evolution which governs the evolution of<br />
the composition of the interstellar medium, at least in a statistical sense.While<br />
Big Bang nucleosynthesis (BBN) synthesized the light nuclei H, D, 3 He, 4 He,<br />
and 7 Li, stars are believed to be largely responsible for the synthesis of all<br />
other nuclei. The products of stellar processing are expelled in stellar winds or<br />
in the final phases of stellar lives, the more or less violent explosions of novae<br />
and supernovae. In the latter, stellar material and the surro<strong>und</strong>ing ISM are<br />
further processed, synthesizing the elements heavier than iron. The importance<br />
and many of the details of stellar nucleosynthesis were first described in the<br />
remarkable work of Burbridge et al. (1957) (usually abbreviated as B 2 FH),<br />
and, independently, by Cameron (1957). A recent review of the status of the<br />
ideas presented by Burbridge et al. (1957) is given in Wallerstein et al. (1997).
2.1. THE INTERSTELLAR MEDIUM 15<br />
The current <strong>und</strong>erstanding of the synthesis of the elements is illustrated<br />
in the cartoon in Figure 2.3. The primordial elements are further processed<br />
in stars, yielding the primary elements. The next generation of stars can synthesize<br />
the secondary elements or nuclei. Therefore, we expect the ab<strong>und</strong>ance<br />
of secondary elements (and isotopes) to increase over time relative to the primary<br />
elements and isotopes. Of course, some primary elements also behave<br />
as secondaries if they are produced in long-living stars. For instance iron is<br />
produced as a primary in stellar nuclear synthesis, but also in supernovae of<br />
type Ia. Such supernovae have long-lived white dwarves as their progenitors.<br />
Therefore, it is necessary to make the definition of primary and secondary<br />
more precise. Wilson and Matteucci (1992) define primary elements as those<br />
produced from H and He by stars with short lifetimes when compared to the<br />
age of the galaxy. Secondary elements, on the other hand, result from burning<br />
of previously synthesized elements and their yield is therefore roughly proportional<br />
to the ab<strong>und</strong>ance of their primary progenitors. Of course, there are<br />
many more factors affecting the chemical processing in the galaxy. Obviously,<br />
nuclear reaction rates need to be known to some degree of accuracy. This is<br />
not always the case, not even for such important ones as 12 C(α, γ) 16 O (e. g.<br />
Pagel, 1997). The physical conditions in stellar interiors need to be known for<br />
various types of stars, differing not only in mass, but also in metallicity, and,<br />
in principle, rotation rate. There seems to be a scarcity of stellar evolution<br />
models which include stellar rotation, inspite of the fact that rotation does<br />
seem to influence nucleosynthesis. The evolution of stars needs to be known,<br />
as does the star formation rate (for all classes of stars), and the so-called initial<br />
mass function for stars in the galaxy. Furthermore, the galaxy emits a galactic<br />
wind into the intergalactic medium, and less processed material is probably<br />
accreted from that medium or from the galactic halo. The complicating factors<br />
just listed are known to various degrees, some are based on relatively<br />
so<strong>und</strong> experimental data and theoretical <strong>und</strong>erstanding, many are only poorly<br />
<strong>und</strong>erstood, some are virtually unexplored. Under these circumstances, it is<br />
surprising that remarkably simple models can account for the basic features<br />
of galactic chemical evolution. Pagel (1997) summarizes various models for<br />
galactic chemical evolution. Their basic ingredients are:<br />
• Initial conditions, e. g. initial ab<strong>und</strong>ances, density distributions, gas to<br />
dust ratio.<br />
• The end results and time scales of stellar evolution.<br />
• The initial mass function.<br />
• A model for star formation.
16 CHAPTER 2. FORMATION OF THE SOLAR SYSTEM<br />
Figure 2.3: Chemical evolution of the elements by stellar nucleosynthesis.<br />
Artist unknown.
2.1. THE INTERSTELLAR MEDIUM 17<br />
• Assumptions about other important galactic processes.<br />
The simplest GCE models parametrize chemical evolution with the fraction µ<br />
of gas mass, m g , relative to the total mass in the galaxy, m tot , µ = . m g /m tot . µ<br />
is a function of time, as the galaxy ages, more and more gas is bo<strong>und</strong> in stars,<br />
planets, and other non-gaseous bodies, which are summarized as dust. In the<br />
approximation of instant recycling, i. e. where elements are synthesized on a<br />
time scale that is fast compared to the one ruling µ(t), the expectation value<br />
for the ab<strong>und</strong>ance of an isotope averaged over a stellar population is (Pagel,<br />
1997)<br />
(<br />
< X i >= p i 1 + µ ln(µ) )<br />
, (2.1)<br />
1 − µ<br />
where p i are the isotope-specific production rates. In this simple model, allowance<br />
for primary and secondary nuclei can be made by multiplying µ by<br />
some factor, resulting in an approach termed “delayed recycling”. Examples<br />
of primary elements are C, O, and Ne. C and O are produced in hydrostatic<br />
burning in stellar cores, 12 C is formed by the “3-α” process 4 He(2α, γ) 12 C<br />
and 16 is synthesized via 12 C(α, γ) 16 O. Ne is synthesized during later stages<br />
of stellar evolution, He burning on O results in 20 Ne and 24 Mg via the reactions<br />
16 O(α, γ) 20 Ne(α, γ) 24 Mg. This reaction starts at 16 O and therefore, we<br />
could argue that 20 Ne is secondary, however, the starting-point 16 O can be<br />
synthesized by the star during the preceding hydrostatic burning. For galactic<br />
chemical evolution, this pedantic detail is irrelevant. If we consider a star a<br />
black box into which matter of some primordial composition was injected, and<br />
out of which processed matter is released at the end of the life of the star, it<br />
looks as if Ne had been synthesized from primordial matter.<br />
The galaxy is structured on a large scale, with higher densities towards<br />
the galactic center. Since higher densities imply faster star formation and<br />
probably also formation of more massive stars, we expect regions nearer to the<br />
galactic center to show faster chemical evolution than regions farther out in<br />
the galactic disk. Indeed, observations of the metallicity of stars show that<br />
they are generally more evolved (i. e. metal rich) towards the galactic center<br />
than away from the current location of the Sun. Similar observations have<br />
been made for the ab<strong>und</strong>ances of non-primordial elements versus galactocentric<br />
distance (see e. g. Pagel, 1997, for an exposé). Irrespective of the decrease<br />
of metallicity with increasing distance from the galactic center, the ratio of<br />
primary to primary elements should remain approximately constant over a<br />
range of some metallicity measure such as O/H. This is the case for Ne/O which<br />
shows no dependence on O/H. However, the picture is not so simple, C/O<br />
shows a strong dependence on O/H which is not completely <strong>und</strong>erstood. Fe/O<br />
increases with increasing Fe/H which is interpreted as due to a substantial
18 CHAPTER 2. FORMATION OF THE SOLAR SYSTEM<br />
contribution to the production of iron from younger, more metal-rich stars (of<br />
which the Sun is a low-mass example) when they explode in type Ia supernovae<br />
(the Sun will not). Because these stars live for about 1 Gy, their contribution<br />
cannot be treated in the instant recycling approximation, and the Fe/O ratio<br />
varies with time. Its behavior can be <strong>und</strong>erstood in the “delayed-recycling”<br />
model.<br />
2.1.4 contributions to the Solar Nebula<br />
Several types of stars contribute to the interstellar medium, supernovae, novae,<br />
AGB stars, Wolf-Rayet stars, etc. Not all stars contribute the same<br />
nucleosynthetic products, Wolf-Rayet stars appear to be important contributors<br />
of 22 Ne, while AGB stars contribute diamond grains from their large-scale<br />
atmospheres. Supernovae can contribute radioactive elements such as 26 Al or<br />
other “radioactive clocks” which can help unravel the mistery and even the<br />
history of solar-system formation. We will encounter uses of radioactive clocks<br />
in the discussion of the early phases of the formation of the solar system.<br />
2.2 Star Formation<br />
2.2.1 Jeans Collapse<br />
In order to <strong>und</strong>erstand he collapse of a cloud <strong>und</strong>er the influence of its own<br />
gravitation, we first consider the virial heorem. It states that the average<br />
potential energy − 〈U〉 equals twice the verage kinetic energy 2 〈T 〉 of the<br />
molecules making up an equilibrium ensemble of molecules (being dust, gas,<br />
etc. particles)<br />
2 〈T 〉 = − 〈U〉 . (2.2)<br />
The proof is not very complicated. We have<br />
2T = ∑ ⃗p i⃗v i = d ( ) ∑<br />
⃗p i ⃗r i − ∑<br />
i<br />
dt<br />
i<br />
i<br />
Taking a long-term average (that’s where the equilibrium enters) of a timevaryingquantitiy<br />
f(t) which can be expressed as the time derivative of a limited<br />
function F (t), f(t) = F (t), ˙ we have<br />
〈f〉 =<br />
1<br />
lim τ→∞ τ<br />
=<br />
1<br />
lim τ→∞ τ<br />
∫ τ<br />
0<br />
∫ τ<br />
0<br />
dtf(t),<br />
dt dF<br />
dt ,<br />
= lim τ→∞<br />
F (τ) − F (0)<br />
τ<br />
= 0.<br />
⃗r i ˙⃗pi
2.2. STAR FORMATION 19<br />
Figure 2.4: Star-forming region in the Orion nebula. Credit: C.R. O’Dell/Rice<br />
University, NASA<br />
Hence the long-term average of the time derivative of a limited quantity vanishes<br />
and we are left with<br />
〈 〉 ∑<br />
2 〈T 〉 = − ⃗r i ˙⃗pi<br />
i<br />
in which we insert the usual definition of a potential force<br />
˙⃗p i = − ∂U<br />
∂⃗r i<br />
to obtain<br />
〈 ∑<br />
2 〈T 〉 =<br />
i<br />
⃗r i<br />
∂U<br />
∂⃗r i<br />
〉
20 CHAPTER 2. FORMATION OF THE SOLAR SYSTEM<br />
For a general potential U ∼ r −k we thus have<br />
〈 〉<br />
∑<br />
2 〈T 〉 ∼ ⃗r i kr k−1 and hence<br />
i<br />
2 〈T 〉 = 〈kU〉<br />
In the case of gravitation, k = 1, and thus we have the virial theorem.<br />
Now let’s consider the collapse of a homogeneous cloud with density ρ and<br />
radius R <strong>und</strong>er self gravitation. We have<br />
ρ ∼ 〈ρ〉 =<br />
M<br />
4π<br />
3 R3<br />
from which we imediately obtain the mass enclosed in a sphere of radius r < R,<br />
M(r) ≈ 4π 3 r3 〈ρ〉 . (2.3)<br />
The difference in potential energy between different spheres is then<br />
dU = −G M(r)dm , wheredm = 4πr 2 dr 〈ρ〉 .<br />
r<br />
Inserting and integrating we obtain<br />
dU = −GM(r)4πr 〈ρ〉 dr,<br />
U = −4πG<br />
= −4πG<br />
∫ R<br />
0<br />
∫ R<br />
〈U〉 = − 16π2 G<br />
15<br />
and, from the virial theorem,<br />
0<br />
dr M(r) 〈ρ〉 r,<br />
dr 4π 3 r4 〈ρ〉 2 ,<br />
〈ρ〉 2 R 5 ≈ − 3GM 2<br />
〈T 〉 = 3 GM 2<br />
10 R<br />
Now the average kinetic energy in the cloud consisting of particles in thermodynamical<br />
equilibrium is<br />
Thus the criterion for collapse is<br />
5R<br />
〈T 〉 = 3 M<br />
NkT, where N = .<br />
2 µm H<br />
2 〈T 〉 < 〈U〉 , (2.4)
2.2. STAR FORMATION 21<br />
which we want to rewrite to find the critical mass, above which a cloud must<br />
collapse <strong>und</strong>er its own gravitation. From above we have<br />
3 M kT < 3 GM 2<br />
µm H 5 R<br />
(2.5)<br />
Inserting<br />
we obtain<br />
R =<br />
3<br />
kT < 3 µm H 5<br />
(<br />
5kT 3 1<br />
)/ 3<br />
Gµm H 4π ρ<br />
M ><br />
( 3<br />
4π<br />
) 1/3<br />
M<br />
ρ<br />
GM<br />
M −1/3 ,<br />
)/ 3<br />
( 3<br />
4π<br />
< M 2/3 ,<br />
1<br />
ρ<br />
( 5kT<br />
Gµm H<br />
) 3/2 (4π<br />
3 ρ ) 1/2<br />
. = MJ . (2.6)<br />
The quantity M J is called the Jeans mass, if the mass of the cloud exceeds the<br />
Jeans mass, it is unstable gainst gravitational collapse.<br />
2.2.2 Free-Fall Time<br />
Given a homogeneous cloud with initial mass density ρ 0 at an initial time t 0<br />
we have an equation of motion for a packet of gas in the cloud or on its outer<br />
edge:<br />
d 2 r<br />
dt = −GM r<br />
, (2.7)<br />
r 2<br />
where M r denotes the mass of gas inside a sphere of radius r,<br />
M r = 4π 3 r3 ρ.<br />
To solve this equation of motion we multiply by ṙ<br />
which can be integrated by parts<br />
¨rṙ = − GM r<br />
r 2 ṙ,<br />
ṙ 2 = 2GM r<br />
( 1<br />
r − 1 r 0<br />
)<br />
,
22 CHAPTER 2. FORMATION OF THE SOLAR SYSTEM<br />
Figure 2.5: M16 molecular cloud (Eagle nebula) showing contracting clumps.<br />
The cloud is irradiated from above (top) and much of the material has evaporated,<br />
leaving only the densest regions.<br />
where r 0 is the radius of the spherical cloud containing M r at time t = t 0 .<br />
Separating the variables r and t we obtain<br />
dr √<br />
√ 1 − = 2GM r dt,<br />
1<br />
r r 0<br />
which has the solution<br />
( ) 1/2 8πGρ0<br />
· t = (1 − r/r 0 ) · √r<br />
0 + arcsin(1 − r/r 0 ).<br />
3<br />
Obviously, all shells of the sphere will reach r/r 0 simultaneously and we call<br />
that time t ff , the so-called “free-fall time”:<br />
√<br />
3π<br />
t ff =<br />
(2.8)<br />
32Gρ 0
2.3. ACCRETION DISKS 23<br />
The fact that density enters the free fall time demonstrates that clouds<br />
must fragments. The density of the cloud will increase until it reaches a point<br />
where the Jeans mass has been reduced so much that substructures of the cloud<br />
become gravitationally unstable and collapse, possibly with accompanied by<br />
further fragmetation of their own structure. This is visible in Figure ?? where<br />
closeby bright stars (off the top of the image) have evaporated away much of<br />
the cloud material except for the densest structures in the cloud which stick<br />
out like little fingers. Those dense regions are where stars are being formed.<br />
Their size is about that of the solar system.<br />
2.2.3 Instabilities<br />
Not all parts of the cloud will collapse at the same rate because the cloud is not<br />
completely homogeneous initially. Density enhancements on the outer edges<br />
will tend to “sink” into the cloud faster than less dense regions, a classical<br />
example of the Rayleigh-Taylor instability. This allows for mixing inside the<br />
cloud. Material from the outer regions, which may contain freshly processed<br />
material from nearby massive stars.<br />
2.3 Accretion Disks<br />
It is rather unlikely that a collapsing cloud had no initial angular momentum<br />
at all. If it did, it can’t be spherically symmetric and more detailed analysis<br />
shows that it will collapse into a disk. The very early Sun and its surro<strong>und</strong>ing<br />
disk are often called the “primitive solar nebula” and the planets formed from<br />
the “protoplanetary disk”, part of this nebula. The collapsing nebula heats the<br />
disk, the heat is radiated away. The fast (supersonic) inflow and the heating in<br />
the vicinity of the disk imply the formation of a shock front somewhere above<br />
and below the disk, presumably in a conical structure aro<strong>und</strong> the central proto<br />
star. Similar structures are indeed observed (see Fig. 2.6).<br />
In order to <strong>und</strong>erstand stellar (accretion) disks, we need to consider several<br />
processes inside disks: ordinary Keplerian orbits, torques, gas drag, and the<br />
Poynting-Robertson effect, to name a few.<br />
Keplerian Physics, Two-Body Physics We assume that ordinary Keplerian<br />
physics (the two-body problem) is known.<br />
Torques Friction, gravity, as well as the magnetic field of the young star will<br />
lead to torques acting on the material in the disk. This allows the redistribution<br />
of angular momentum inside the disk. Strong magnetic field threading through
24 CHAPTER 2. FORMATION OF THE SOLAR SYSTEM<br />
Figure 2.6: Hubble image of a protoplanetary disk.<br />
the disk will tend to force the disk to corotate with the star. This implies that<br />
the disk is at least sufficiently ionized that gas, dust, and plasma all move<br />
together. The role of the “locking agent” probably needs to be played by<br />
collisions among the disk particles (ions, electrons, atoms, dust grains). This<br />
<strong>und</strong>erlines the importance of disk temperature in the behavior of the disk. As<br />
the innermost regions are probably the hottest, as this is where most material<br />
falls in and heats the disk, but also because the young star is beginning to heat<br />
the disk. Farther out, and possibly shielded in the shadow of the inner disk,<br />
matter is cooler and hence mostly neutral, so we may expect the innermost<br />
regions of the disk to be magnetically coupled to the stellar rotation. Because<br />
the disk would rotate more slowly than the star based on Keplerian orbits,<br />
this process thends to slow down the rotation of the Sun, thus transporting<br />
angular momentum outwards. Farther out, where the gas is no longer coupled<br />
to the magnetic field this transport is interrupted.<br />
The gas falling into the star along its magnetic fields is partly incorporated<br />
into the star, but some fraction of it is expelled in a bursty bipolar jet which<br />
is roughly aligned with thr rotation axis. The imperfect alignment allows for<br />
a further removal of angular momentum from the star. Such objects have long<br />
been known as so-called Herbig-Haro objects (Figs. 2.7 and 2.8).<br />
Another torque arises from viscous forces due to the Keplerian orbits of<br />
matter in the outer regions of the disk. The slower movement of an outer<br />
“ring” relative to its neighbor on the inside leads to “friction” by collisions
2.3. ACCRETION DISKS 25<br />
Figure 2.7: Herbig-Haro object. The temporal variations can easily be seen.<br />
between the molecules of the neighboring (imaginary) rings. These will slow<br />
down the material on the outside and speed up matter on the inside, thus<br />
again transporting angular momentum outwards. The “viscosity” governing<br />
this process is again largely determined by the temperature profile of the disk.<br />
Current models show high mid-plane temperatures near to the star (1500 K<br />
at 1 AU, dropping quickly to 100 - 200 K within 5-6 AU and then declining<br />
slowly at a roughly constant rate out to larger distances.).<br />
2.3.1 Chemistry in the Disk<br />
Given these strong temperature gradients in the inner stellar disk, there will be<br />
quite different chemical reactions going on in different parts of the disk. This<br />
could, in principle, lead to chemical gradients in the disk. However, due to the<br />
large-scale angular momentum transport during disk formation and subsequent<br />
planet formation, no obvious chemical gradients worth mentioning are visible<br />
in the present-day solar system except for the so-called “ice-line”, the region<br />
delimiting where gas planets could form and where terrestrial planets had to<br />
form. We will investigate this aspect in some more detail in chapter 5.<br />
Large parts of disk chemistry can be <strong>und</strong>erstood based on condensation<br />
temperature characteristics (see sec. 2.1.1. Elements with the highest condensation<br />
temperatures will condense first, accompanied by an alteration of the<br />
chemistry of the disk by including these elements into grains where they are
26 CHAPTER 2. FORMATION OF THE SOLAR SYSTEM<br />
Figure 2.8: Jets of gas from stellar disks. Obviously, the jets are not precisely<br />
aligned with the roatation axis of the star.<br />
not anymore available for other chemical reactions. A rough idea about the<br />
condensation sequence is sketched in Table 2.1. The ices that form at low temperatures<br />
oftel form on already existing dust grains and form an onion-skin-like<br />
shell structure aro<strong>und</strong> the grain. The grains in turn are relatively mobile and<br />
move relative to the gas, thus transporting condensed material inwards into<br />
the presolar nebula.<br />
2.3.2 Meteoritic Information<br />
Much of the information we have about the origin and evolution of the solar<br />
system comes from studies of meteorites. Meteorites are normally called after<br />
the place they were fo<strong>und</strong>, antarctic meteorites are given names which incorporate<br />
the place they were fo<strong>und</strong>, the year they were fo<strong>und</strong> and a sequential<br />
number, e. g. ALH84004, the famous Martian meteorite once believed to show<br />
signs of life on Mars is called after Alan Hills, where it was fo<strong>und</strong>, 1984, when<br />
it was fo<strong>und</strong>, and its sequential number, 004. Roughly 10 4 tons of cosmic dust<br />
falls onto Earth every year, this corresponds to about 10 15 atoms per square<br />
meter and day. Most of this matter consists of minute dust particles, the<br />
matter follows a rough power law in size distribution.<br />
Meteorites can be grouped into two large groups, differentiated and <strong>und</strong>ifferentiated<br />
meteorites. The latter are more primitive and more important for<br />
<strong>und</strong>erstanding the early history of the solar system, while the former give infor-
2.3. ACCRETION DISKS 27<br />
Temperature Elements Mineral<br />
(K)<br />
∼ 1700 Ca, Al cor<strong>und</strong>um (Al 2 O 3 ), perovskite (Ca Ti O 3 )<br />
∼ 1400 Fe, Ni alloys<br />
∼ 1350 Mg, Si silicates (enstatite (Mg Si O 3 ), forsterite (Mg 2 Si O 4 )<br />
∼ 1200<br />
feldspars: plagioclase anorthite (Ca Al 2 Si 2 O 8 ) ∗<br />
∼ 1100 Na, K Na, K feldspars ((Na, K) Al Si 3 O 8 ) ∗<br />
∼ 700 Fe, S troilite (Fe + H 2 S −→ Fe S + other<br />
∼ 500 Fe, water Fe + H 2 O −→ Fe O + H 2<br />
∼ 500 FeO, forsterite olivine, pyroxene<br />
enstatite<br />
< 500 C, N, O, H C O + 3 H 2 −→ C H 4 + H 2 O; N 2 + 3 H 2 −→ 2 N H ∗ 3 ∗<br />
hydrated silicates (e. g. talc)<br />
∼ 200 H, O water ice<br />
< 200 N, H, C ammonia and methane ices<br />
< 40 Ar, C, H Ar and CH 4 ices<br />
< 25 N, C, O N 2 , CO ices<br />
Table 2.1: Condensation sequence in the early solar nebula. ∗ Note that Al has<br />
already condensed into grains. Therefore these grains need to react to form<br />
feldspars. Hence the exact mineralology will depend on grain growth speed. ∗∗<br />
These reaction are kinetically limited, i. e. they are not in equilibrium anymore.<br />
Cloud processes are faster than reactions because of the low temperatures and<br />
the low density in the outer regions of the cloud.<br />
mation about differentiated bodies in the solar system, such as differentiated<br />
asteroids, Mars, and the Moon. Undifferentiated meteorites are called chondrites,<br />
again there are several groups of chondrites, ordinary (H, L, and LL),<br />
carbonaceous, and enstatite chondrites. Differentiated meteorites are called<br />
achondrites, there are three asteroidal classes, distinguished by their iron or<br />
silicate content, and two additional classes, on for lunar, the other for Martian<br />
meteorites.<br />
A very primitive chondrite class, the CI-chondrites, are among the most<br />
volatile-rich bodies of the solar system. Their chemical composition, with the<br />
exception of the very volatile noble gases and H, C, N, and O, is identical<br />
to that of the solar photosphere within the uncertainties which are mainly<br />
driven by uncertain atomic data. Certain exceptions can be explained by solar<br />
evolution models (cf. Chapter 3. Figure 2.9 shows Orgueil, the largest fall of<br />
this sort. Note that there are only four other falls of this primitive, but rare,<br />
class, and Orgueil is by far the largest and has been analysed most of all.
28 CHAPTER 2. FORMATION OF THE SOLAR SYSTEM<br />
Figure 2.9: Image of Orgueil, the largest of the CI-chondritic meteorite falls.<br />
Dating Meteorites<br />
Dating of meteorites uses the properties of radioactive clocks, decaying isotopes.<br />
Table 2.2 gives the half lives of some radioactive isotopes and their<br />
dominant decay products. In order to date a meteorite, one makes two basic<br />
mother daughter half-life<br />
(nuclide) (decay product) [million years]<br />
40 K 40 Ar, 40 Ca 1250<br />
87 Rb 87 Sr 48800<br />
107 Pd 107 Ag 7<br />
129 I 129 Xe 17.2<br />
147 Sm 143 Nd 106000<br />
232 Th 208 Pb 14000<br />
235 U 207 Pb 704<br />
238 U 206 Pb 4470<br />
Table 2.2: Some long-lived radionuclides, their decay products and half lives.<br />
assumptions:<br />
a) all daughter products are removed from the sample at the time of the<br />
event to be dated<br />
b) the system is closed, i. e. no mother or daughter isotopes are inserted or<br />
removed from the sample by some outside process.<br />
An important example is the dating with 40 K - 40 Ar in which a grain melts,<br />
thus removing all Ar from it, the cools down quickly compared to the half
2.3. ACCRETION DISKS 29<br />
life of 40 K. The decay then produces 40 Ar which cannot escape from the grain<br />
because temperatures are too low for diffusion to lead to a noticable effect. If<br />
assumption a) is not satisfied, additional reference isotopes need to be used to<br />
correct the results, e. g. another isotope of the daughter element. This allows<br />
one to date samples which need not be homogeneous. Obviously,<br />
D = D 0 + (M 0 − M) = D 0 + M(e λt − 1),<br />
where an index 0 means the original concentration of an isotope, M and D are<br />
mother and daughter isotopes respectively, λ is the decay constant. Dividing<br />
by a reference isotope R, we obtain the maini dating equation<br />
( )<br />
D D<br />
R = + M R 0 R<br />
(<br />
e λt − 1 ) . (2.9)<br />
Plotting D/R versus M/R yields a straight line with slope e λt − 1 along<br />
which lie points with different original and final composition, but with equal<br />
age. Grains with different ages lie on other lines with different slopes called<br />
isochrones. If the samples all come from the same meteorite, the isochrone is<br />
called an internal isochrone. Using different radionuclides increases the precision<br />
of the dating. If the different methods disagree, this does not necessarily<br />
imply an error in age determination. Often this is an indication that the<br />
closure times for the different mother-daughter systems are different, e. g. due<br />
to different temperature histories which could lead to loss of radiogenic 40 Ar<br />
during a heating event, but leave another system (with less volatile isotopes)<br />
<strong>und</strong>isturbed.<br />
Inspite of the great simplicity of this basic dating scheme, we need to stress<br />
that not every straight line is an isochrone! Straight lines can also be (and<br />
often are) due to mixing of two components. All mixtures of a component<br />
with composition ((D/R) 1 , (M/R) 1 ) and another component with composition<br />
((D/R) 2 , (M/R) 2 ) lie along a straight line between the two components<br />
(the endpoints). As an example, we show a so-called three-isotope plot of Ne<br />
in Figure 2.10. Here we can clearly make out the mixing between three components,<br />
the solar wind (with its own isotopic composition of Ne), a so-called<br />
“SEP” component, and the spallation products of the interaction of galactic<br />
cosmic rays with the lunar soil grains for which these measurements were made.<br />
Other kinds of ages of meteorites can also be determined from their composition,<br />
the most important is the exposure age or exposure time to the cosmic<br />
radiation. As long as a lunar, asteroidal, or even Martian rock is well beneath<br />
the surface exposed to cosmic rays, essentially no spallation takes place. As<br />
soon as the rock is exposed to cosmic rays, they result in nuclear and other<br />
interaction with its surface and interior:
30 CHAPTER 2. FORMATION OF THE SOLAR SYSTEM<br />
Figure 2.10: Three-isotope plot of Ne. The mixing lines between the solar wind<br />
and SEP (HEP) component and between the SEP (HEP) component and the<br />
spallation products in the soil by galactic cosmic rays are clearly visible.<br />
• Trapping of the solar wind in the outermost surface layers. The range of<br />
the solar wind in typical materials is on the order of 250 Å. The amount<br />
of trapped solar wind divided by an average solar wind flux gives a “solar<br />
wind exposure age” as long as the solar wind has not yet saturated or<br />
reached an equilibrium between implantation and sputtering (due to solar<br />
wind and UV).<br />
• The implantation of the solar wind leads to permanent destruction of the<br />
crystalline structure in the outermost surface layers (amorphous rim).<br />
• More energetic particles penetrate the solid body and leave behind nuclear<br />
tracks, permanent disruptions of the crystal lattice. This only<br />
ocurrs in a finite energy range, by so-called minimally ionizing particles<br />
(more about them in Chapter ??). Counting the number of tracks<br />
per unit volume allows an estimates for the duration of exposure if the<br />
flux was constant and is known.<br />
• Lower-energy particles (1 - 100 MeV) can lead to low-energy nuclear<br />
reactions which in turn result in stable or radioactive isotopes in the
2.3. ACCRETION DISKS 31<br />
sample. Two prominent examples are the reactions<br />
p + 23 Na = 22 Ne + 2p,<br />
p + 23 Na = 22 Na + p + n.<br />
• More energetic particles can lead to nuclear spallation reactions in which<br />
several nucleons are removed from a target nucleus, e. g.<br />
p + 56 Fe = 38 Ar + xome neutrons + some protons + other.<br />
Moreover, the resulting secondary particles can have enough energy to<br />
lead to further nuclear reactions in the body. This process is called<br />
spallation.<br />
• The secondary particles often result in low-energy nuclear reactions (see<br />
above). Often these reactions set free neutrons which are slowed down by<br />
collisions and can cause n, γ reactions as thermal or epithermal neutrons.<br />
Such reactions often have large cross sections, leading to the creation of<br />
very specific cosmogenic isotopes, e. g.<br />
79 Br(n, γ) 80 Br, which decays into<br />
80 Kr,<br />
which can be measured by noble-gas mass spectrometry. This dating<br />
method is especially interesting because it has a quite different depth<br />
profile (because of the (n, γ) reactions, neutrons have a much larger range<br />
than charged particles, see Chapter 14).<br />
Investigations of the Allende CV3 meteorite revealed calcium-aluminumrich<br />
inclusions (termed CAIs) with highly enriched 26 Mg ab<strong>und</strong>ances. These<br />
inclusions are considered to have formed very early during solar system formation,<br />
presumably they were the first solids to form. They formes so early,<br />
that the radioactive Al isotope 26 Al (half life 0.72 Myr) was still present and<br />
decayed to 26 Mg, leading to this large isotopic anomaly in these CAIs. Thus<br />
the time of CAI formation is often taken as a definition of the origin of the<br />
solar system. The molecular cloud must have begun its collapse and have been<br />
seeded with 26 Al no earlier than at most 20 millioon years before the formation<br />
of CAIs. Based on 207 Pb/ 206 Pb dating one finds the age of the solar system to<br />
be (4.563 ± 0.004) × 10 9 years. Other age determinations yield similar ages,<br />
although mostly slightly younger ones. These meteorites are older than the<br />
oldest terrestrial, lunar, and Martian rocks, which implies that the planets<br />
formed later on.<br />
Eucrite achondrites exhibit isotopic excesses of 60 Ni, which is a daughter<br />
product of 60 Fe (half life 1.5 Myr) which is correlated with the iron ab<strong>und</strong>ance
32 CHAPTER 2. FORMATION OF THE SOLAR SYSTEM<br />
of these bodies. Eucrite achondrites come from differentiated bodies (e. g. 4<br />
Vesta), thus the implication of this finding is that differentiated bodies existed<br />
few to several half lives of 60 Fe after the formation of the solar system. Other<br />
signatures, especially of 26 Al decay in other bodies imply the existence of<br />
differentiated bodies (planetesimals) within 3 - 5 Myrs after the formation of<br />
CAIs.<br />
The existance of these CAIs and another type of inclusion, so-called chondrules,<br />
in primitive meteorites, some of which include the delicate pre-solar<br />
grains, is a puzzle. On the one hand, chondrules are definitely material that<br />
has been melted at high temperatures and was subsequently cooled rather<br />
quickly. On the other hand, chondrites which contain chondrules are <strong>und</strong>ifferentiated<br />
and have not <strong>und</strong>ergone alterations due to high temperatures. So it<br />
appears as if chondrules that formed in a very hot environment were included<br />
in the chondritic matrix in a cool environment. How did they form and how did<br />
they get there and how were they incorporated? We don’t know - a well known<br />
joke among meteoriticists is that “chondrules were formed by the chondruleforming<br />
process”. There are some hypotheses that could explain some of the<br />
properties, we will present one later on when we consider the clearing of the<br />
disk.<br />
2.3.3 Dust Coagulation<br />
Fluffy grains, as they exist in interstellar clouds, must also have formed and<br />
preexisted in the presolar nebula. Such fluffy structures can stick to eachother<br />
once they have come close enough. E. g. Van der Waals forces can hold the<br />
together and thus they can form dust particles that tend to increase in size.<br />
One presumes tha such “stickinig” processes lead to the formation of mm-sized<br />
particles, some of which were melted by “the chondruel forming process”. The<br />
appearance of larger bodies, meter to kilometer sized, is poorly <strong>und</strong>erstood.<br />
The pressure gradient in the gas in the disk leads to a pressure-gradient<br />
force and the effectie gravity felt by the gas is reduced<br />
g eff = − GM ⊙<br />
r 2<br />
− 1 ρ g<br />
dP<br />
dr .<br />
If the gas is on a circular orbit (which it will tend to due to friction), the g eff<br />
must be balanced by the centrifugal acceleration, rω 2 g, thus giving us a way to<br />
compute the angular velocity of the gas<br />
ω g ≈<br />
√<br />
GM⊙<br />
r 3 (1 − η) ,
2.3. ACCRETION DISKS 33<br />
where<br />
η =<br />
−r2 dP<br />
2GM ⊙ dr ≈ 5 · 10−3 .<br />
Inserting typical estimates for disk properties, one obtains an angular velocity<br />
which is about 0.5% smaller than the corresponding Keplerian value. On the<br />
other hand, large grain particles will move at the Keplerian orbital speed and<br />
will thus feel a friction force due to the gas. This will tend to make them<br />
move inwards and spiral toward the protostar. The rate at which particles<br />
drift inwards depends sensitively on their size (and hence their mass to size<br />
ratio). Small particles are strongly coupled to te gas and only feel a slow<br />
“headwind”, and large (km-sized) bodies have such a large size to mass ratio<br />
that the gas friction gets unimportant for their dynamics. Inbetween lies a size<br />
region that can be striongly affected by gas drag, maximum drift speeds are<br />
expected for meter-sized bodies, they drift inwards at a rate on the order of 10 6<br />
km a year. They should disappear from the disk and fall into the Sun within<br />
about 100 years! So we expect meter-sized bodies to move rapidly and sweep<br />
up all the gas in their way. If they grow fast enough, i. e. reach kilometer sizes<br />
fast enough, they can remain available for planet formation by planetesimals.<br />
This growth from centimeter-sized bodies to planetesimals must happen very<br />
fast, on the timescale of h<strong>und</strong>red years!.<br />
There are two alternative scanarios to explain growth in this phase. in one,<br />
the disk is quiescent and thus thin enough to allow gravitational instabilities<br />
to form. Planetesimals wouold then presumably form due to these instabilities<br />
with sizes of typicaly 1 km in the inner solar system and larger farther out.<br />
The competing point of view is that kilometer-sized bodies form by binary<br />
collisions in a turbulent presolar nebula. Whatever the explanation is, there<br />
still remain severe problems in <strong>und</strong>erstanding the growth of bodies between<br />
mm-sized bodies (chondrules) and km sized bodies - planetologists are looking<br />
for a “planetary glue” to keep such bodies to stick together, as they are not<br />
held together by gravitation yet, but are too large for Van der Waals forces<br />
or the like to keep them together. Binary collisions would tend to destroy as<br />
many bodies as they form.<br />
2.3.4 From Planetesimals to Planets<br />
After this large gap in <strong>und</strong>erstanding, comes a better <strong>und</strong>erstood phase of<br />
solar system formation, the growth from planetesimals to planets by binary<br />
collisions. Consider two bodies of mass m 1 and m 2 with relative velocity y<br />
when they are still very far from eachother. Then their speed at encounter or<br />
impact is<br />
√<br />
v i = v 2 + ve,<br />
2
34 CHAPTER 2. FORMATION OF THE SOLAR SYSTEM<br />
where v e is the escape velocity from the point of impact,<br />
v e =<br />
( 2G(m1 + m 2 )<br />
R 1 + R 2<br />
) 1/2<br />
.<br />
Thus impact velocity is at least as large as the escape velocity, leaving us with<br />
the question how we should accrete planetesimals by such a process? Of course,<br />
the collision will not be elastic, we can introduce a “rebo<strong>und</strong>” parameter ɛ,<br />
and write the rebo<strong>und</strong> velocity as ɛv i . As long as ɛ is small enough, binary<br />
collisions will lead to accretion of material onto the surface, possibly after some<br />
complicated behavior of the two collision partners. As these will probably<br />
disrupt and reform, ɛ can indeed be quite small. Once a body gets big enough,<br />
it will accrete at the rate of collisions, because the smaller impactor will be<br />
completely shattered on its surface resulting in significant heating and thus a<br />
very low ɛ. Of course, the larger the body gets, the larger will its gravitational<br />
attraction get, its mass growth rate will grow according to<br />
Ṁ ∝ 1 + v e<br />
v .<br />
The body will accrete everything in a trajectory inside the impact parameter<br />
with closest approach less than the sum of the two radii, R 1 + R 2 . Obviously,<br />
the constant of proportionality must include the planetesimals cross section<br />
πR 2 , so that<br />
( )<br />
Ṁ ∝ ρπR1<br />
2 1 + v2 e<br />
v 2<br />
If v ≪ v e , we have the case where Ṁ ∝ R2 , as can easily be seen by inserting<br />
the expression for v e in this limit. For small relative velocities which may<br />
be expected in a rotating viscous disc, we obtain that Ṁ ∝ R 4 , leading to a<br />
runaway situation, where the largest planetesimals grow larger and faster than<br />
smaller ones.<br />
Other scenarios are possible - gravitational instabilities in the disc have<br />
also been discussed as a possible way to obtain large planets directly from the<br />
gaseous disk. Nevertheless, the current trend seems to point towards a hierarchical<br />
formation of the solar system and not to a “spontaneous” formation of<br />
planets directly from disk material.<br />
2.3.5 Clearing the Disk<br />
Our present-day solar system contains no gas between the planets (apart from<br />
the solar wind), so the gas must have been cleared away from the disk at some<br />
point during the formation of the solar system. The timing of this removal is
2.3. ACCRETION DISKS 35<br />
somewhat delicate. If the gas is removed too early, i. e. before the formation of<br />
planetesimals, then there will be no solar system, if it is removed too late, there<br />
is sufficient time for all planetesimals to spiral inwards towards the protostar<br />
and be swallowed by it, leaving no planetary system at all.<br />
One of the currently debated scenarios how the disk could have been cleared<br />
is that proposed by ? which also gives an explanation for the formation of<br />
chondrules and CAIs. The scenario is sketched in Fig. 2.11. The strong T-<br />
Tauri wind gradually removes the disk, at the same time solid material from<br />
the disk is accreted onto the protostar and part of it is ejected as a strong<br />
wind. The strong UV and X-ray activity is energetic enough to ionize much<br />
of the disk, the thermal emission of the protostar is strong enough to heat<br />
ejected material to high temperatures very fast. This material then can fall<br />
back onto the disk once it has solidified - the chondrules have formed! This<br />
explanation has the nice property to explain several enigmas of solar system<br />
formation and combining it with astrophysical observations of strong T-Tauri<br />
winds from protostars. The importance of neighboring stars in clearing the<br />
Figure 2.11: After ?.<br />
disk is unclear, just as it is for seeding the nebula with active radionuclides<br />
prior to collapse. Observations with the Hubble space telescope seem to imply<br />
an increasingly important role for the neighborhood in which the young solar
36 CHAPTER 2. FORMATION OF THE SOLAR SYSTEM<br />
system grew up.<br />
2.4 Exosolar Planets<br />
One of the philosophical questions that mankind has pondered since tha nature<br />
of stars and galaxies has become evident is, “Are we alone?” The idea that<br />
there must be exosolar planets is not new, but finding them is difficult and has<br />
only become possible in the last decade.<br />
2.4.1 Detection of Exosolar Planets<br />
To everybodies surprise, the first exosolar planet was detected aro<strong>und</strong> a pulsar,<br />
hardly where one would expect one. The first planet orbiting a Sun-like star<br />
was reported in 1995 by the Geneva group.<br />
Complete and up-to-date lists are given at the Exosolar Planets organization<br />
(<br />
http:// exoplanets.org/<br />
). To date (April 2005), 136 exosolar planets have been detected.<br />
Methods<br />
Several different techniques are used to detect planets aro<strong>und</strong> other stars:<br />
• Radial Velocities: fit Doppler shifts to spectra<br />
• Astrometry: Measure the wobble of the stellar orbit<br />
• Transits: Photometric detection, light curves, limited to small inclinations<br />
of orbtal plane rel. to line of sight.<br />
• Microlensing: Useful if lensing star has planetary companions. They can<br />
result in short-term changes in lensed light curves.<br />
Statistics<br />
2.4.2 Metallicity of the Protostellar Discs<br />
Our ideas about the formation of the solar system have been changed alot since<br />
the first exosolar planets have been observed and especially since the statistics<br />
on these planetary systems have been solidified. To date (Nov. 17, 2004), 132<br />
exosolar planets have been fo<strong>und</strong>, many of them should never have formed
2.4. EXOSOLAR PLANETS 37<br />
according to present theories of solar system formation . . . . We will consider<br />
more details of orbital evolution and characteristics in chapter 5. For the time<br />
being, let it suffice to mention that it is difficult to form Jupiter-mass planets<br />
very near the central stellar object. However, this might be a selection effect<br />
- only very massive stars can currently be observed in the immediate vicinity<br />
of stars. An Earth-mass planets at 1 AU from a star would still be invisible.<br />
An important puzzle in planetary system formation is the relation of metal<br />
content of the star with the probability of observing a planetary system. While<br />
Figure 2.12: Metallicity of field and planet-bearing stars.<br />
stellar cannibalism has been discussed as a solution to solve this puzzle, it<br />
now appears that protoplanetary nebulae need to be iron enriched in order<br />
to produce planets. The clue to this conclusion came from comparing the<br />
metallicity of planet-bearing F-stars with F-stars without planets. F-stars have<br />
very thin convective zones (see Chapter ??) and hence would have to have<br />
considerably enhanced metallicity if metal-rich protoplanets were to impact<br />
onto the star and enrich it with metals. This is not fo<strong>und</strong>, indicating that stars<br />
which formed from a metal rich protostellar cloud seem to be more probable<br />
to form a planetary system than stars with average metallicity. This implies<br />
an important role for the entire condensation chemistry during the formation<br />
of the solar system which is badly <strong>und</strong>erstood.
38 CHAPTER 2. FORMATION OF THE SOLAR SYSTEM
Chapter 3<br />
The Sun<br />
As the Sun formed out of the protosolar cloud, it went through a “pre-mainsequence”<br />
stage before it settled onto the main sequence evolutionary track.<br />
Solar (and stellar) models successfully reproduce the Hertzsprung-Russel diagrams<br />
and hence one is confident that they accurately describe the physics<br />
going on inside a star or the Sun. In fact, a star is not a very complicated<br />
beast at all, some very basic physics goes a long ay in describing its interior<br />
structure, as was fo<strong>und</strong> out by Eddington in the early 20-th century. In this<br />
chapter, we will describe the physics that goes into solar and stellar models,<br />
describe the evolution of the Sun in its early, pre-main-sequence, stage, and<br />
describe in a very coarse manner the formation of the solar wind and how<br />
it emanates into interplanetary space, shaping the heliosphere by interacting<br />
with the local interstellar medium.<br />
3.1 Solar Interior<br />
dr<br />
A<br />
⃗F P,t<br />
dm<br />
Alot about the interior structure of the Sun<br />
can be learnt by considering hydrostatic equilibrium.<br />
While the formation of the Sun is certainly<br />
not an equilibrium process, its evolution<br />
thereafter is much slower and equilibrium is often<br />
a good approximation that reproduces the<br />
relevant physics to a reasonable degree of accuracy.<br />
To begin with, we may assume that a parcel<br />
of solar matter is only influenced by gravitation<br />
and pressure. Then the forces on the parcel of<br />
solar material sketched in Fig. ?? cancel and<br />
A<br />
⃗ FP,b<br />
39
40 CHAPTER 3. THE SUN<br />
we have<br />
dm d2 r<br />
dt 2 = F G + F P,t + F P,b ,<br />
where F G is the gravitational force pointing inwards, and F P,t and F P,b are the<br />
pressure forces at the top and bottom of the cylindrical parcel, respectively. In<br />
this case, the gravitational force is balanced by the pressure differential dF P ,<br />
or, if the parcel experiences a force,<br />
dm d2 r<br />
dt 2 = F G − dF P .<br />
Using dm = ρ A dr and dF P = AdP , we have<br />
ρ d2 r<br />
dt = −GM rρ<br />
− dP<br />
2 r 2 dr<br />
(3.1)<br />
In the case of hydrostatic equilibrium, the left-hand side vanishes, i. e. there is<br />
no acceleration acting on the parcel, and thus we have<br />
dP<br />
dr = −GM rρ<br />
r . (3.2)<br />
2<br />
Thus we need to find pressure as a function of density and of temperature, this<br />
is given by the equation of state via minimization of the free energy F ,<br />
P =<br />
( ) ∂F<br />
.<br />
∂V<br />
T,ρ<br />
This can be simplified by using the expression for radiation pressure and for<br />
gas pressure,<br />
P = P r + P g . (3.3)<br />
Radiation pressure is given by<br />
and gas pressure by<br />
P r = σ c T 4 , (3.4)<br />
P g = ρkT<br />
¯m ,<br />
where ¯m is the average mass of an atom or ion, often this is expressed using<br />
the mean molecular weight, µ, of a gas,<br />
µ = ¯m m H<br />
(3.5)
3.1. SOLAR INTERIOR 41<br />
where ¯m is the mass of the hydrogen atom. Both the neutral and ionized<br />
fractions of the gas contribute to the pressure, and µ is different for the two<br />
because the electronn is muich lighter than the proton. Let us compute µ n for<br />
the neutral and µ i for the ionized fractions. Obviously, the average mass in<br />
the neutral fraction is given by<br />
1<br />
¯m = 1 =<br />
µm H<br />
∑<br />
1 N i<br />
∑i m i N i<br />
,<br />
where N i are the numbers of particles of species i in a unit volume. Using this<br />
number is somewhat cumbersone and it is useful to define the mass fraction of<br />
atoms of species i, X i , by<br />
X . =<br />
total mass of H<br />
total mass of gas ;<br />
Y . =<br />
Then the average mass ¯m will be<br />
total mass of He<br />
total mass of gas ;<br />
Z . =<br />
total mass of Heavies<br />
.<br />
total mass of gas<br />
(3.6)<br />
1<br />
¯m = 1 = ∑ µ n m H i<br />
N i<br />
M tot<br />
= ∑ i<br />
N i<br />
N i m i<br />
N i m i<br />
M tot<br />
= ∑ i<br />
N i<br />
N i A i m H<br />
X i . (3.7)<br />
For a neutral gas of solar composition, this is<br />
1<br />
≈ X + 1 〈 〉 1<br />
µ n 4 Y + Z,<br />
A n<br />
where 〈1/A〉 n<br />
is the average inverse atomic weight for a gas of solar composition<br />
and is approximately 1/15.5.<br />
For the ionized fraction, the story looks different because the ionization<br />
state, determined by the Saha equation, enters by contributing light electrons<br />
to the gas. A hydrogen atom will contribute a nucleus (proton) and an electron<br />
once ionized, similarly, a fully ionized helium atom will contribute a nucleus<br />
and two electrons, etc. Thus<br />
1<br />
µ i<br />
= ∑ i<br />
1 + z i<br />
A i<br />
X i ≈ 2X + 3 〈 〉 1 + z<br />
4 Y + Z,<br />
A i<br />
where Z i is the number of electrons contributed by atoms of species i at a<br />
given temperature. The right-hand side is given for a fully ionized plasma.<br />
Since most heavy elements have roughly one neutron per proton, the term<br />
〈(1 + z)/A〉 has a value near 1/2. For solar composition, X = 0.7, Y = 0.28,<br />
and Y = 0.02, and thus µ n 1.3 and µ i = 0.62<br />
Thus finding the pressure requires finding the energy source that heats up<br />
the interior of the Sun.
42 CHAPTER 3. THE SUN<br />
3.2 Nuclear Reactions<br />
3.2.1 Hydrogen Burning<br />
The energy source in the Sun lies in nuclear reactions, in its current state of<br />
evolution in the net fusion of hydrogen to helium. There are two principal<br />
paths to burning hydrogen, the pp-chain and the CNO-cycle. Three reactions<br />
contribute to the pp-chain - they are summariezed in Table 3.1. The net result<br />
Name Reaction Q [MeV] Q ν [MeV] Symbol branching<br />
ratio<br />
ppI p(p,e + ν)d 1.177 0.265 λ pp<br />
d(p,γ) 3 He 5.494 λ pd<br />
3 He( 3 He,2p)α 12.860 λ 33 69%<br />
ppII 3 He(α, γ) 7 Be 1.586 λ 34<br />
7 Be(e − ,νγ) 7 Li 0.049 0.815 λ e7<br />
7 Li(p,α)α 17.346 λ ′ 17 30.09%<br />
ppIII 7 Be(p,γ) 8 B 0.137 λ 17<br />
8 B(,e + ν) 8 Be ∗ 8.367 6.711 λ 8<br />
8 Be ∗ (, α)α 2.995 λ ′ 8 0.01%<br />
Table 3.1: The three reactions contributing to the pp-chain of hydrogen burning<br />
in the Sun.<br />
is the fusion of four protons to one helium nucleus, liberating a total of 26.732<br />
MeV per α particle. Note that the first two reactions need to happen twice<br />
to produce an alpha particle. Obviously, the numbers don’t add up to that<br />
number, ppI is by far the most prolific reaction. The so-called “branching<br />
ratios” between the three chains appropriate for the core of the Sun are given<br />
in the last column of Table 3.1.<br />
A second possibility to convert protons to α particles was suggested by Hans<br />
Bethe in the late 1930s. In this CNO cycle, C, N, and O serve as catalyzers to<br />
fuse four protons into on 4 He nucleus in the two branches given in Table 3.2. As<br />
we will see shortly, this reaction is not very frequent for conditions prevalent<br />
in the solar core, but can be the dominant energy source for slightly more<br />
massive stars.<br />
3.2.2 Cross Sections<br />
The efficiency or frequency with which a reaction takes place is determined by<br />
the number of available reaction partners and the cross section for the reaction.
3.2. NUCLEAR REACTIONS 43<br />
Reaction Q [MeV] Q ν [MeV] Symbol branching<br />
ratio<br />
12 C(p,γ) 13 N 1.944 λ p12<br />
13 N(,e + ν) 13 C 1.513 0.707 λ 13<br />
13 C(p,γ) 14 N 7.551 λ p13<br />
14 N(p,γ) 15 O 7.297 λ p14<br />
15 O(,e + ν) 15 N 1.757 0.997 λ 15<br />
15 N(p,α) 12 C 4.966 λ p15 99.96%<br />
15 N(p,γ) 16 O → 16 O(p,γ) 17 F → 17 F(,e + ν) 17 O → 17 O(p,α) 14 N 0.04%<br />
Table 3.2: The CNO cycle<br />
We define the cross section of a reaction by<br />
σ(E) . =<br />
number of reactions per nucleus and time<br />
number of incident nuclei per area and time , (3.8)<br />
i. e. the cross section has units area. The reaction rate, i. e. the number of<br />
reactions per unit volume and time, is given by the product of v·σ, Of course, σ<br />
is a function of energy or of relative speed, v, and hence a detailed calculation<br />
of the reaction rate, r ik , between nuclei i and k will need to consider the<br />
energy or velocity distribution of the reacting partners. Assuming an isotropic<br />
geometry (as is presumably the case in the rigidly and slowly rotating center of<br />
the Sun, we see that we only need to consider the relative speeds (as opposed<br />
to velocities) of the reaction partners which translates into knowledge of the<br />
energy distribution. This latter must be a Maxwellian, as the interior of the<br />
Sun is in thermodynamic equilibrium due to the high densities and the ensuing<br />
large collision rates. Thus<br />
r ik =<br />
∫ ∞<br />
0<br />
dEn i n k σ(E)f(E), (3.9)<br />
where n i and n k are the number densities per space volume of reaction partners<br />
and f(E) is the Maxwellian distribution in energy space. σ(E) is generally not<br />
well known in the energy domsin prevalent in the solar core. At there low energies,<br />
extrapolations from accelerator results are needed. Nevertheless, some<br />
information can be gleaned fromm simple considerations. apart from resonances,<br />
the strongest dependence on energy will be due to the necessity to<br />
overcome the Coulomb barrier by tunneling and the energy dependent localization<br />
(de-Broglie-radius, λ dB ) of the nucleus. The latter easily translates into<br />
an area, hence,<br />
( ) 2<br />
h<br />
σ(E) ∝ πλ 2 dB = π ∝ 1 p E , (3.10)
44 CHAPTER 3. THE SUN<br />
where p is momentum of the particle. The tunneling probability enters into<br />
σ(E) as well, hence,<br />
σ(E) ∝ e −2π2 U c/E , (3.11)<br />
where U c is the Coulomb potential height. The ratio U c /E can be derived from<br />
simple considerations assuming that r ∼ λ dB = h/p.<br />
U c<br />
E = Z 1Z 2 e 2 2<br />
r 2 µ m v = 2Z 1Z 2 e 2<br />
. (3.12)<br />
2 hv<br />
Inserting the classical relation E = 1 2 µ mv 2 , we readily obtain<br />
σ(E) ∝ e − 23/2 π 2 √ µmZ1 Z 2 e 2<br />
h √ E<br />
= e − b √<br />
E , (3.13)<br />
wherre b clearly depends on the chemical composition of the Sun. Thus we<br />
can write the cross section as<br />
σ(E) = S(E)<br />
E e−bE−1/2 , (3.14)<br />
where S(E) is a slowly varying function of E as long as it is not in the vicinity<br />
of some resonance.<br />
Gamow Peak<br />
Combining the results we have obtained sofar, we have for the reaction rates<br />
r ik<br />
∫ ∞<br />
r ik ∝ n i n k dS(E)e −bE−1/2 e −E/kT , (3.15)<br />
0<br />
which has a strongly peaked integrand, an observations first made by Gamow,<br />
after whom the peak is named (“Gamow-peak”). Figure 3.1 shows an example.<br />
3.2.3 Kinetic Energy of Protons in the Core<br />
The temperature of protons in the solar core, T c , can be estimated by demanding<br />
that they be hot enough to pressure balance solar gravitational compression,<br />
i. e. that their thermal energy equal the gravitational potential energy,<br />
E thermal = 3 2 kT c = Gm pM ⊙<br />
R ⊙<br />
= gravitational potential energy. (3.16)<br />
Thus<br />
T c = 2Gm pM ⊙<br />
3kR ⊙<br />
≈ 15.6 × 10 6 K.
3.2. NUCLEAR REACTIONS 45<br />
Figure 3.1: The Gamow Peak.<br />
3.2.4 The Solar Neutrino Problem (†)<br />
Several reactions associated with the energy source of the Sun release neutrinos<br />
of various energies in prodigious amounts. The neutrino flux, Φ i , of a reaction<br />
i can be calculated from its reaction rate, λ i , by<br />
Φ i = 1 ∫ m⊙<br />
dm λ<br />
4πr 2 i , (3.17)<br />
0<br />
where r is the distance from the source. Neutrino spectra for a standard solar<br />
model are shown in Fig. 3.2. Neutrinos interact only very weakly with matter<br />
and hence their detection is difficult. It is customary to measure neutrino<br />
fluxes in so-called “solar neutrino units”, SNUs, which are the product of flux<br />
Φ and detection cross section σ with some detector material. Cross sections σ<br />
are, of course, energy and material dependent, typically, they are on the order<br />
of few times 10 −50 m 2 . One SNU is then defined as<br />
1SNU . = 1 neutrino capture per second and per 10 36 target atoms. (3.18)<br />
Neutrinos can be detected at Earth by various reactions, the first one tried<br />
was<br />
ν e + 37 Cl −→ e − + 37 Ar, (3.19)<br />
in which an electronic neutrino reacts with a chlorine nucleus to produce an<br />
electron and a 37 Ar atom. Thus filling a large tank with perchloroethylene,
46 CHAPTER 3. THE SUN<br />
Figure 3.2: Neutrino spectra for the neutrinos resulting from the various nuclear<br />
reactions discussed in Section 3.2. From Bahcalls web page.<br />
C 2 Cl 4 , and purging it every once in a while and measuring the 37 Ar content<br />
allows one to determine the electronic neutrino flux. Such an experiment with<br />
a volume of 384’000 l (i. e. 100’000 gallons) was installed in the Homestake<br />
Gold mine in South Dakota, 1500 meters <strong>und</strong>ergro<strong>und</strong>. The measured count<br />
rate is 2.17 37Ar atoms created per day requiring long integration times to<br />
ensure acceptable statistics. The Homestake 37 Cl experiment has an expected<br />
neutrino flux of about 9 SNUs, However, only about 3 SNUs, or one third of the<br />
expected flux, are measured! This discrepancy is also observed with different<br />
experiments, notably Kamiokande (water), GALLEX ( 71 Gallium), and SAGE<br />
( 71 Gallium), where the ratio of observed to expected fluxes range between 0.3<br />
and 0.5, see Fig. ??. These newer experiments are sensitive to lower-energy<br />
neutrinos, thus greatly improving counting statistics and demonstrating the<br />
discrepancy between modeled and measured solar neutrino fluxes. So where
3.2. NUCLEAR REACTIONS 47<br />
are the missing neutrinos?<br />
Figure 3.3: The solar neutrino problem: Predictions from a standard solar<br />
model (tall columns) and observations (smaller columns) in various experiments<br />
(Homestake, Kamiokande, SAGE, and GALLEX). The colors indicate<br />
the contribution to neutrion flux from different nuclear reactions in the solar<br />
core, as predicted by solar models.<br />
The answer to this problem was one of the outstanding problems in solar<br />
physics up to 2002. It was not clear whether solar models were so uncertain<br />
or missing some crucial piece of physics that they could produce such a large<br />
systematic error in the estimate of the solar neutrino flux. Solar physicists were<br />
very reluctant to believe this, as they believed that the Sun is a remarkably<br />
simple entity and that the basic physics was well <strong>und</strong>erstood. On the other<br />
hand, nuclear reactions in this energy range were also well known and there<br />
was little space to wiggle out of the so-called “solar neutrino problem”. A<br />
third venue, elementary particle physics, turned out to be the solution.<br />
Already in 1957, Pontecorvo discussed the possibility of neutrino oscillations.<br />
Neutrinos occur in three flavors, electronic, ν e , muonic, ν µ , and tauonic,
48 CHAPTER 3. THE SUN<br />
ν τ . In quantum mechanics, they are the neutrino flavor eigenstates. If neutrinos,<br />
or at least one flavor of them, had a mass, even a very small one (< 1 eV),<br />
then the flavor eigenstates can be written as linear combinations of the mass<br />
eigenstates ν i . To simplify matters, we consider only electronic and muonic<br />
neutrinos in the following discussion, the result needs to be generalized to three<br />
flavors.<br />
ν e = ν 1 cos θ + ν 2 sin θ, (3.20)<br />
ν µ = −ν 1 cos θ + ν 2 sin θ. (3.21)<br />
When a neutrino is created during a nuclear reaction, its flavor eigenstate<br />
is uniquely determined. However, as it begins to move through the Sun or<br />
interplanetary space, the relative phases between the eigenstates with well<br />
defined masses will change according to the laws of quantum mechanics,<br />
ν e (t) = ν 1 cos θe −iE 1t + ν 2 sin θe −iE 2t , (3.22)<br />
ν µ (t) = −ν 1 sin θe −iE 1t + ν 2 cos θe −iE 2t , (3.23)<br />
where E i is the energy of the neutrino, Ei<br />
2 = m 2 i + p 2 . Thus the probability<br />
amplitude to find an electronic neutrino still in its electronic flavor is given by<br />
〈ν e (0), ν e (t)〉 = cos 2 θ e −iE 1t + sin 2 θ e −iE 2t . (3.24)<br />
Neutrinos will oscillate between flavors, even if they propagate through vacuum.<br />
These are the so-called “vacuum oscillations”. Detection probability,<br />
P (ν e (0), ν e (t)), is as always given by the square of the probability amplitude,<br />
P (ν e (0), ν e (t)) = 1 − sin 2 2θ sin 2 (E 2 − E 1 )t/2. (3.25)<br />
The derivation is left as an exercise. The quantity θ is the so-called mixing<br />
angle. Assuming neutrinos to propagate at the speed of light, we can convert<br />
the second term into an oscillation length, L, after which neutrinos retain their<br />
original identity again. For that, the argument of the sin in the second term<br />
must equal π, thus<br />
π = E 2 − E 1<br />
T = m2 2 − m 2 1<br />
L, (3.26)<br />
2<br />
4p<br />
where T is the period of the oscillation in the second term. Writing the difference<br />
of the squares of the masses as ∆m 2 , as is customary, we obtain<br />
L = 4πp<br />
∆m 2 . (3.27)<br />
With this, and a given heliocentric distance R, we can write the probability of<br />
still finding an electronic neutrino in its electronic flavor eigenstate,<br />
P (ν e (0), ν e (R)) = 1 − sin 2 2θ sin 2 πR/L, (3.28)
3.2. NUCLEAR REACTIONS 49<br />
which varies between unity and 1/2 (the average of a rapidly oscillating sin 2 πR/L)<br />
for R ≫ L. If there are three flavors, then it will vary between unity and 1/3.<br />
Measurements of atmospheric neutrinos which are created in the Earths atmosphere<br />
by interactions of the galactic cosmic radiation with the atmosphere,<br />
showed that similar oscillations do indeed take place, however, this could only<br />
be showed for µ and τ neutrinos, not for electronic neutrinos. These neutrinos<br />
travel from where they were created and can be detected by an <strong>und</strong>ergro<strong>und</strong><br />
experiment. Depending on where they were created, they must have travelled<br />
along a short or a long path l which is determined by the zenith angle<br />
θ. Because the direction of the neutrino flight path can be inferred from the<br />
θ<br />
l<br />
r<br />
Θ<br />
R<br />
Figure 3.4: Geometry for atmospheric neutrinos. These are created in the<br />
atmosphere, at a distance R from the center from the Earth (at aro<strong>und</strong> 20 km<br />
altitude in the atmosphere), from where they propagate along a flight path l<br />
to an <strong>und</strong>ergro<strong>und</strong> detector at r from the Earth’s center.<br />
Cerenkov measurements in the experiment, one knows how long the flight path<br />
of the neutrino was, and can then compute the probability of it having chaged<br />
flavor by neutrino oscillations. Such oscillations should manifest themselves<br />
as an oscillation along the zenith angle θ. Measurements performed at Super<br />
Kamiokande confirmed that indeed, such oscillation take place.<br />
Add Kamiokande results here.
50 CHAPTER 3. THE SUN<br />
The experiments considered sofar were all capable of detecting electronic<br />
neutrinos, because these interact with 37 Cl, ordinary water, and 71 Ga through<br />
the charged current reaction (Fig. 3.5). The situation changed dramatically<br />
ν e<br />
e −<br />
ν x ν x<br />
W +<br />
Z 0<br />
e − ν e e −<br />
e −<br />
Figure 3.5: Feynman diagrams for the neutrino interaction with charged leptons.<br />
Left-hand side: charged current; right-hand side: neutral current. ν x<br />
means ν e , ν µ , or ν τ .<br />
with the advent of the Sudbury Neutrino Observatory, SNO, which consists of<br />
a water Cerenkov detector located at a depth of 6010m water equivalent in the<br />
INCO, Ltd. Creighton nickel mine in Sudbury, Ontario, Canada. The detector<br />
uses ultra-pure heavy water contained in a transparent acrylic spherical shell 12<br />
m in diameter to detect solar neutrinos. The Cerenkov photons are detected by<br />
9456 photomultiplier tubes surro<strong>und</strong>ing the sphere which is immersed in ultrapure<br />
light water that provides shielding from radioactivity in the surro<strong>und</strong>ing<br />
rocks. SNO detects 8 B neutrinos through the three reactions<br />
ν e + d −→ p + p + e + (CC),<br />
ν x + d −→ p + n + ν x (NC),<br />
ν x + e − −→ ν x + e − (ES).<br />
The first reaction, the charged-current (CC) reaction is sensitive only to electronic<br />
neutrinos, while the lower two are sensitive to all flavors of neutrinos,<br />
although the elastic scattering (ES) reaction is not very sensitive to ν µ and ν τ .<br />
The sensitivity to all three flavors allows SNO to determine the electron and<br />
non-electron neutrino components in the solar flux. The SNO collaboration<br />
published their exciting results in 2002,<br />
Φ νe = 1.76 +0.05+0.09<br />
−0.05−0.09,<br />
Φ νµτ = 3.41 +0.45+0.48<br />
−0.45−0.45,
3.3. LARGE-SCALE STRUCTURE OF THE SUN 51<br />
where the first set of uncertainties is statistical and the second systematic.<br />
The non-electronic neutrino flux Φ νµτ = 3.41 0.66<br />
−0.64 is 5.3σ above zero and thus<br />
provides strong evidence, that solar electronic neutrinos do indeed oscillate<br />
and thus transform their flavor on the way from the Sun to Earth. The total<br />
flux of neutrinos (NC channel) was measured to be<br />
Φ NC = 6.42 +1.57+0.55<br />
−1.57−0.58,<br />
which is in good agreement with the standard solar model result of<br />
Φ SSM = 5.05 +1.01<br />
−0.81.<br />
Thus one believes that the solar neutrino problem is now solved, it is not a<br />
solar problem, but has opened a new exciting window to the non-standard<br />
electroweak theory.<br />
3.3 Large-Scale Structure of the Sun<br />
Next we need to consider the transport of energy through the solar interior.<br />
This can happen by radiation or by convection. The location where convective<br />
transport sets in is largely determined by stability considerations. As long as<br />
stratifications remain stable, energy is transported radiatively, once convection<br />
sets in, it dominates. Hence an <strong>und</strong>erstanding of energy transport inside the<br />
Sun requires <strong>und</strong>erstanding of the stability of solar structure and of radiative<br />
transport through a mixture of a complex plasma.<br />
Energy transport can thus be written as<br />
F = F R + F C =<br />
L<br />
4πr 2 ,<br />
where F is the energy flux, F R and F C are raiative and convective energy flux,<br />
respectively, and L is solar luminosity.<br />
3.3.1 Radiative Transport<br />
Inspite of the small mean free path of photons in the solar interior, energy<br />
is efficiently transported by radiation inside the socalled “radiative core”. A<br />
photon takes approximately 1000 years to escape from the solar core, where<br />
nuclear fusion is taking place, out to the photosphere. This has an important<br />
consequence, though, that of local thermodynamical equilibrium. If photons<br />
take such a long time to escape, this also implies that conditions in the core<br />
need to be well equilibrated and hence we may assume local thermodynamical
52 CHAPTER 3. THE SUN<br />
equilibrium (LTE). Hence the only governing quantity is temperature and we<br />
may use the Kirchhoff-Planck expression for the local spectrum,<br />
or, in wavelength,<br />
B ν (T ) = 2h<br />
c 2 ν 3<br />
e hν/kT − 1 , (3.29)<br />
B λ (T ) = 2h<br />
λ 5 1<br />
e hc/λkT − 1 . (3.30)<br />
The energy density in a given wavelength interval [λ, λ + dλ] is<br />
u λ dλ = 4π c B λdλ = 1 c<br />
∫ 2π ∫ π<br />
0<br />
0<br />
dθ dφI λ (θ, φ) sin θ, (3.31)<br />
where I λ is the intensity at wavelength λ. During passage through a length ds<br />
of gas or plasma of density ρ, it will change by<br />
dI λ = −κ λ ρI λ ds + j λ ρds, (3.32)<br />
where j λ is the emission coefficient of the gas, i. e. the change is given by the<br />
difference of emission and absorbtion of the gas. κ λ is the absorption coefficient<br />
of the gas at wavelength κ, also called opacity. If κ λ I λ = j λ , radiation would<br />
be isotropic and in equilibrium. However, in the Sun, there is a net outward<br />
.<br />
transport of radiation. The quantity S λ = jλ /κ λ is called the source function<br />
and allows us to write the equation above in a slightly simpler form,<br />
− 1 dI λ<br />
κ λ ρ ds = I λ − S λ , (3.33)<br />
the socalled “transfer equation”. The quantity τ λ = ∫ s<br />
0 ds κ λρ is called the<br />
optical depth. Several processes contribute to it:<br />
• bo<strong>und</strong>-bo<strong>und</strong> transitions between two bo<strong>und</strong> electron states in an<br />
atom or ion. A photon with the wavelength corresponding to the change<br />
in binding energy is absorbed by the atom or ion. Obviously, this is a<br />
line-related process. The reverse process, emission of a photon of that<br />
energy is isotropic and hence the net effect of bo<strong>und</strong>-bo<strong>und</strong> transitions<br />
is a scattering of the photons. Under certain circumstances, reemission<br />
can happen via two photons with the same total energy, thus this process<br />
can also lead to shift of the frequency spectrum towards lower energies.<br />
• bo<strong>und</strong>-free absorption occurs when a photon is energetic enough to<br />
ionize an atom or further ionize an ion, i. e. has an energy larger than<br />
the ionization energy for the atom or ion. As this depends on the exact
3.3. LARGE-SCALE STRUCTURE OF THE SUN 53<br />
quantum state of the atom/ion, this process can be quite complicated.<br />
Again, reemission may occur when an ion recombines with a free electron,<br />
thus contributing to photon scattering and a net shift towards lower<br />
energies.<br />
• free-free absorption is the reverse of the Bremsstrahlungs-process. An<br />
electron can absorb a photon and accelerate as a consequence, just as it<br />
emits Bremsstrahlung when it decelerates.<br />
• electron scattering is just that - a photon is scattered by the electron,<br />
the cross section for this process is σ T = (8π/3) · (e 2 /m e c 2 ) 2 = 6.65 ·<br />
10 −29 m 2 for Thompson scattering and smaller for Compton and Rayleigh<br />
scattering of photons by electrons bo<strong>und</strong> in atoms or ions. Compton<br />
scattering happens for photons with wavelengths much smaller than the<br />
atom, Rayleigh scattering for photons with much larger wavelengths.<br />
All these processes contribute to the total opacity,<br />
κ λ = κ bb + κ bf + κ ff + κ es , (3.34)<br />
which reduces to the so-called Rosseland mean opacity,<br />
averaged over all wavelengths,<br />
∫ ∞ 1<br />
1<br />
¯κ = 0 dλ<br />
κ λ<br />
∫ ∞<br />
0<br />
dB λ<br />
dT<br />
dλ dB λ<br />
dT<br />
¯ kappa, when it is<br />
(3.35)<br />
Their computation is non trivial, therefore tabulated values or approximations<br />
are usually used. The weighted mean implies that more energy is transported<br />
in wavelength regions where matter is more transparent. The weight being<br />
dB λ /dT means that more energy is also transported in wavelength regions<br />
where the Kirchhoff-Planck function has a strong dependence on wavelength.<br />
Coming back to the transfer equation, we need to modify it by including<br />
angular information:<br />
− 1<br />
κ λ ρ cos θ dI λ<br />
ds = I λ − B λ , (3.36)<br />
which we now want to solve for I λ . An approximate solution is given by<br />
I λ = B λ − cos θ<br />
κ λ ρ<br />
dB λ<br />
ds . (3.37)<br />
Next, we derive an expression for the pressure and temperature gradients<br />
in the Sun. The radiative flux F λ is given by<br />
F λ dλ =<br />
. ∫<br />
dΩ dλ I λ cos θ, (3.38)
54 CHAPTER 3. THE SUN<br />
the integral over it in an isotropic medium gives the well known equation<br />
F rad = σT 4 . We can now derive an expression for radiation pressure using the<br />
momentum of a photon of energy E, p = E/c. The component perpendicular<br />
to a surface and due to photons in the wavelength inerval λ to λ + dλ is then<br />
p ⊥ = E λ<br />
cos θ<br />
c<br />
(3.39)<br />
Now E λ is the energy in the radiation in the wavelength interval,<br />
dΩ<br />
I λ<br />
θ<br />
Figure 3.6: Geometry for intensity considerations.<br />
Then, from the considerations above, we write<br />
E λ dλ = I λ dλ dt dA cos θ dΩ. (3.40)<br />
P rad, λ dλ = 1 c<br />
∫<br />
dΩ I λ cos 2 θ. (3.41)<br />
We now have all the ingredients to obtain the pressure gradient inside the Sun.<br />
For this we consider two steps. First we integrate eq. 3.36 noting eq. 3.38,<br />
− 1 ∫<br />
d<br />
dΩ I λ cos θ =<br />
κ λ ρ ds<br />
− 1 d<br />
κ λ ρ ds F rad,λ =<br />
∫<br />
∫<br />
dΩ I λ<br />
dΩ I λ<br />
−<br />
−<br />
∫<br />
∫<br />
ddΩ B λ ,<br />
ddΩ B λ . (3.42)
3.3. LARGE-SCALE STRUCTURE OF THE SUN 55<br />
In the next step, we multiply eq. ?? by cos θ and integrate it over the solid<br />
angle as well,<br />
− 1 ∫<br />
∫<br />
∫<br />
d<br />
dΩ I λ cos 2 θ = dΩ I λ cos θ − ddΩ B λ cos θ,<br />
κ λ ρ ds<br />
− c d<br />
κ λ ρ ds P rad,λ = F rad,λ − 0, (3.43)<br />
which, in spherical coordinates, translates to<br />
dP rad<br />
dr<br />
Now we know the radiation flux at radius r,<br />
F rad (r) =<br />
= − κρ<br />
c F rad. (3.44)<br />
L r<br />
4πr 2 ,<br />
and hence we can rewrite the pressure gradient with luminosity,<br />
dP rad<br />
dr<br />
= − c<br />
κ λ ρ fracL r4πr 2 . (3.45)<br />
In order to obtain the temperature gradient, we use the expression for radiation<br />
pressure, eq. 3.4, and obtain<br />
dP rad<br />
dr<br />
= 4σcT 3 dT<br />
dr , (3.46)<br />
from which we obtain the final expression for the temperature gradient inside<br />
the Sun in thos regions where energy is transported by radiation alone,<br />
dT<br />
dr = −κρ c 2 1<br />
4σT 3<br />
3.3.2 Convective Transport<br />
L r<br />
4πr 2 . (3.47)<br />
The other important transport process in the solar interior is convection. Consider<br />
a bubble of solar material that by chance rises up through the solar interior<br />
by δr, such as sketched in Fig. 3.7. The bubble will expand adiabatically,<br />
there is no energy transfer from bubble to environment. This expansion will<br />
result in a decrease in density. The environment at height r + δr will also be<br />
less dense than the bubble, but the two densities will not necessarily agree, as<br />
the environment has had much more time to reach that height and hence it did<br />
not reach it adiabatically. If the bubble is denser than the environment, it sinks<br />
down, if it is less dense, it continues to rise, typically in an accelerated motion
56 CHAPTER 3. THE SUN<br />
r + δr<br />
ρ b<br />
ρ e<br />
r ρ b ρ e<br />
Figure 3.7: Schwarzschild criterion for stability. If the rising bubble is denser<br />
than its environment at r + δr, then it drops back and the situation is stable.<br />
If it is less dense, it continues to rise and the situation is unstable.<br />
- the situation is unstable. Let us cosider the bubble and its environment at<br />
height r + δr,<br />
ρ b (r + δr) = ρ b (r) + δr dρ b<br />
dr ,<br />
ρ e (r + δr) = ρ e (r) + δr dρ e<br />
dr ,<br />
at least to lowest order. Assuming that the bubble and its environment were<br />
initially in equilibrium, we have for the difference,<br />
( dρb<br />
ρ b (r + δr) − ρ e (r + δr) = δr<br />
dr − dρ )<br />
e<br />
. (3.48)<br />
dr<br />
In an unstable situation, the left-hand side of eq. 3.48 is negative, and hence<br />
we have the Schwarzschild criterion for instability,<br />
( ) dρ<br />
< dρ<br />
dr<br />
dr , (3.49)<br />
adiabatic
3.3. LARGE-SCALE STRUCTURE OF THE SUN 57<br />
because we assumed the bubble to expand adiabatically. This relation can<br />
be reformulated into a temperature version using standard thermodynamical<br />
relations,<br />
( ) dT<br />
> dT<br />
dr<br />
dr , (3.50)<br />
adiabatic<br />
If the temperature gradient due to radiative transport, eq. 3.47, is smaller<br />
than the adiabatic gradient, then bubbles will begin to rise and set up convective<br />
motions inside the Sun. This can happen by various mechanisms, for<br />
example by large opacities in the solar interior which would require an unrealistically<br />
steep gradient to transport the energy by radiation alone. Another<br />
possibility would be a strong radial dependence of nuclear energy generation,<br />
which could be due to the strong temperature dependence of nuclear reaction<br />
rates.<br />
The temperature gradients in the Sun are such that the inner core is dominated<br />
by radiative transport and an outer convective zone transports energy<br />
to the solar surface.<br />
Figure 3.8: Overall structure of the Sun.
58 CHAPTER 3. THE SUN<br />
3.4 Solar Evolution Models<br />
We have now fo<strong>und</strong> that f<strong>und</strong>amental equations that govern the interior constitution<br />
of the Sun (and stars),<br />
mass conservation:<br />
momentum conservation:<br />
energy flux:<br />
radiative transfer:<br />
∂r<br />
∂m = 1<br />
4πρr , 2<br />
∂P<br />
∂m = − Gm<br />
4πr , 4<br />
∂L<br />
∂m = ɛ − T ∂S<br />
∂t ,<br />
⎧⎪<br />
∂T ⎨ −<br />
∂m = ⎪ ⎩<br />
3κL<br />
256π 2 σr 4 T 3<br />
( ) ∂T<br />
∂m conv.<br />
(stable layer)<br />
(unstable layer)<br />
where S is entropy and we have transformed all radial equations to massdependent<br />
ones because we know (we demand, to a good approximation this<br />
is true) that mass is conserved during solar evolution, but we don not know<br />
the radius of the Sun in the past. In addition to these equations we need<br />
four additional equations that give us information on energy production, the<br />
equation of state, opacities, and entropy:<br />
ρ = ρ(P, T ) , dS = dS(P, T ) ,<br />
ɛ = ɛ(ρ, T ) , κ = κ(ρ, T ).<br />
Finally, we need the bo<strong>und</strong>ary conditions to solve this system of differential<br />
equations. Two of them are imposed at the center of the Sun, two at the outer<br />
bo<strong>und</strong>ary. The inner bo<strong>und</strong>ary conditions are<br />
r(0) = 0, and L(0) = 0.<br />
The outer bo<strong>und</strong>ary conditions are more complicated and require some explanation.<br />
As we do not know the true radius, we replace this ill-defined quantity<br />
by the optical depth, τ(r),<br />
τ(r) . =<br />
∫ ∞<br />
0<br />
dr ′ κρ. (3.51)<br />
we define the surface radius, r s , as the location at which t = 2/3, i. e. τ(r s ) =<br />
2/3. Then we have four outer bo<strong>und</strong>ary conditions, r s , P s , L s , and T s which we<br />
don’t know. However, we can find two relations which we do know and which<br />
we can use as outer bo<strong>und</strong>ary conditions. We assume the solar atmosphere<br />
to be optically thin (by definition!), furthermore, we assume that there is no
3.5. VERIFYING SOLAR EVOLUTION MODELS 59<br />
mass in the atmosphere, i. e. that all mass is inside the surface, r s . Then<br />
m(r) = m ⊙ in the atmosphere. We now take the momentum conservation<br />
expression (equation of motion) and rewrite it in terms of optical depth.<br />
∂P ∂m<br />
∂m ∂r · ∂r<br />
∂m = ∂P<br />
∂r<br />
1<br />
4πρr 2 = −Gm ⊙<br />
4πr 4 .<br />
From the definition of optical depth we have ∂τ/∂r = κρ and hence<br />
∂P<br />
∂r<br />
∂P<br />
∂τ<br />
= − Gm ⊙<br />
ρ κ rs<br />
2 κ ,<br />
= − Gm ⊙<br />
r 2 s<br />
= − Gm ⊙<br />
r 2 s<br />
1<br />
κ · ∂κ<br />
∂r ,<br />
· 1<br />
κ ,<br />
which is easily integrated to give the third bo<strong>und</strong>ary condition,<br />
P s = Gm ⊙<br />
r 2 s<br />
∫ 2/3<br />
0<br />
dτ 1 κ .<br />
The final bo<strong>und</strong>ary condition is the well-known<br />
T eff =<br />
(<br />
Ls<br />
4πr 2 s<br />
)/ 4<br />
.<br />
Solar models are then iterated until they yield the present-day solar luminosity<br />
at a model age corresponding to the age of the Sun and satisfy the other<br />
bo<strong>und</strong>ary conditions. The iteration begns with initial guesses for r s and L s and<br />
then integrate inwards where they should, but will generally not, reproduce<br />
the inner bo<strong>und</strong>ary conditions. One then starts with another guess (which is<br />
hopefully cleverly chosen) and iterates to convergence.<br />
3.5 Verifying Solar Evolution Models<br />
3.5.1 Helioseismology<br />
Helioseismology gives us a window into the interior of the Sun and allows us<br />
to derive properties such as chemical composition (X and Y) and temperature<br />
via the local so<strong>und</strong> speed. While the idea is relatively simple, the detailed<br />
calculations involved in the inversion of the seismic signals are very computer<br />
intensive. The basic idea behind helioseismology is discussed in the following<br />
paragraphs.
60 CHAPTER 3. THE SUN<br />
As parcel on the solar surface move, the lines that they emit are Dopplershifted.<br />
Using suitable lines, one can then subtract images taken in the red<br />
and blue wings of this line and obtains a “Doppler” image of the Sun in this<br />
line. Depending on the line chosen, one may obtain Doppler-images of various<br />
heights in the solar atmosphere (different temperatures) or, in the case of<br />
low temperatures, even in the chromosphere or photosphere. These Doppler<br />
images show the speed at which a parcel is moving relative to the observer.<br />
Taking time series of such images gives us the temporal behavior and allows<br />
us to find oscillations of the solar surface. Such oscillations were first fo<strong>und</strong><br />
in the period range of five minutes with speed amplitudes of 0.5 to 1 km/s.<br />
Figure 3.9 shows a newer image obtained with MDI on SOHO. The fine-scale<br />
Figure 3.9: Doppler image of the Sun. The dark half shows the movement<br />
of the Sun towards the observer, the other half rotates away. Image credit:<br />
SOHO/MDI consortium.<br />
structure that is left over after one subtracts the overall solar rotation gives us<br />
information about the interior of the Sun. As a parcel of solar matter moves<br />
out of its equilibrium position, a restoring force will act on it (as long as the<br />
situation is stable, see previous section), resulting in an oscillation, harmonic<br />
in the simplest case. The velocity signal v will be a function of position (x and
3.5. VERIFYING SOLAR EVOLUTION MODELS 61<br />
y) and of time t, we can write v(x, y, t) in terms of its Fourier transform f,<br />
∫<br />
v(x, y, t) = dk x dk y dω f(k x , k y , ω) exp {i (k x x + k y y + ωt)} , (3.52)<br />
which allows us to trivially find the power spectrum P (k x , k y , ω) = f f ∗ . If the<br />
. √<br />
horizontal directions x and y are indistinguishable, then only k h = k<br />
2<br />
x + ky<br />
2<br />
will appear in the power spectrum. If the region being considered is large<br />
enough that curvature plays a role, then spherical coordinates must be used<br />
and the velocity signal must be decomposed into spherical harmonics,<br />
v(θ, φ, t) = ∑ l<br />
= 0 ∞ l∑<br />
m=−l<br />
α lm (t)Y m<br />
l (θ, φ), (3.53)<br />
where the spherical harmonic<br />
Yl<br />
m (θ, φ) = P |m|<br />
l (θ)e imφ , (3.54)<br />
where Pl<br />
m is an associated Legendre function. Its degree, l, gives the total<br />
number of node circles on the surface of the sphere, and its longitudinal order,<br />
m, is the number of node circles going through the poles.<br />
Let us return to the oscillation movement now. If they are fast enough that<br />
no energy is transferred between a moving plasma parcel and its environment,<br />
then the corresponding density and pressure perturbations δρ and δP can be<br />
considered as adiabatic,<br />
δP<br />
P 0<br />
where ρ 0 and 0 are the <strong>und</strong>isturbed density and pressure at a given location,<br />
e. g. radius r. The adiabatic exponent<br />
Γ 1 =<br />
= Γ 1<br />
δρ<br />
ρ 0<br />
, (3.55)<br />
( ) d ln P<br />
S = P 0 1<br />
d ln ρ ρ 0 c , (3.56)<br />
2<br />
where c is the speed of so<strong>und</strong>, depends only on r. If ξ is the distance from the<br />
equilibrium position, then we have ξ r ∼ ρ −1/2<br />
0 exp(ik r r) and P l ∼ ρ 1/2<br />
0 exp(ik r r).<br />
In a stably stratified layer with constant scale height<br />
H = . − ρ (<br />
0 g<br />
dρ 0 /dr = c + N 2 ) −1<br />
,<br />
2 g<br />
where N is the Brunt-Väisälä frequency,<br />
( 1<br />
N 2 dP 0<br />
= g<br />
Γ 1 P 0 dr − 1 )<br />
dρ 0<br />
,<br />
ρ 0 dr
62 CHAPTER 3. THE SUN<br />
one obtains the following dispersion relation for the waves<br />
( ) N<br />
kr 2 = ω 2 − 1 + kh<br />
2 2<br />
ω − 1 , (3.57)<br />
2<br />
where we have switched to dimensionless quantities, ω −→ ω/ω A , etc. This is<br />
derived by inserting the expressions for ξ r and P 1 into the equation of continuity<br />
and momentum equation which results in a set of two homogeneous linear<br />
equations with constant coefficients for ξ and P . This can only be solved if<br />
their determinant vanishes; this yields the dispersion relation, eq. 3.57. If ξ r<br />
and P l are to be oscillatory, then k r must be real, in other words, the right-hand<br />
side of eq. 3.57 must be positive. For large ω 2 ≫ 1 we obtain the dispersion<br />
relation for acoustic waves, ω 2 = c 2 (k 2 r + k 2 h). These waves are restored by<br />
pressure gradients and are hence called p-waves. Two other modes are allowed<br />
by the dispersion relation. So-called evanescent waves are low-frequency waves<br />
that are so slow that the surro<strong>und</strong>ing plasma has enough time to adjust to a<br />
changing hydrostatic equilibrium. The f<strong>und</strong>amental mode is similar to surface<br />
waves.<br />
Figure 3.10 gives the power in the solar oscillations as measured by MDI<br />
on SOHO.<br />
3.5.2 So<strong>und</strong> Speed in the Solar Interior<br />
It turns out that one may obtain the speed of so<strong>und</strong> in the solar interior without<br />
recourse to a model for the solar interior! This remarkable observation is due<br />
to Duvall’s law that states that the ratio (n + α)π/ω plotted versus ω/k h is<br />
given by one single curve. Here, n is the mode number and α is a constant that<br />
needs to be suitably chosen. In this representation, all p-mode ridges collapse<br />
onto this single curve, if an appropriate counting scheme and constant α are<br />
chosen. This can be used to find an implicit expression for the amplitude of<br />
oscillations at different distances from the solar center, ξ(r). This however, is<br />
directly related to the speed of so<strong>und</strong> via ξ = (r/c) 2 . The so<strong>und</strong> speed c(r) as<br />
determined by some solar model can thus be compared to that measured by<br />
helioseismology. Figure 3.11 shows a result based on SOHO/MDI observations.<br />
Several points can be made with this figure. First, modeled so<strong>und</strong> speed agrees<br />
very well with the observations, the relative difference is less than about 6%<br />
everywhere in the Sun. Second, there is an obvious sore thumb beneath the<br />
base of the convection zone. Third, so<strong>und</strong> speeds disagree aro<strong>und</strong> 0.2 solar<br />
radii, where we expect hydrogen burning to modify the composition of the<br />
material. Indeed, allowing a modest amount of mixing in solar models greatly<br />
reduces these discrepancies, as does elemental migration. On the other hand,<br />
one could also say that the figure beautifully demonstrates how incomplete our
3.5. VERIFYING SOLAR EVOLUTION MODELS 63<br />
Figure 3.10: Power spectrum of solar oscillations as measured by SOHO/MDI.<br />
Courtesy SOHO/MDI consortium. SOHO is a joint ESA/NASA project.<br />
<strong>und</strong>erstanding of the Sun is. The difference in so<strong>und</strong> speeds is nearly nowhere<br />
less than many times the estimated measurement and model uncertainties!<br />
Deriving other quantities such as temperature rpofiles, chemical composition<br />
variations, etc. from helioseismological results is much more difficult<br />
and, in general, can not be achieved. The reason is the complex and often<br />
non-linear coupling of these quantities that results in an <strong>und</strong>erdetermined set<br />
of equations. As so<strong>und</strong> speed is given by<br />
( ) d ln P<br />
c 2 = Γ 1 P 0 /ρ 0 , where Γ 1 = ,<br />
d ln ρ<br />
S<br />
several quantities may be varied to achieve an observed so<strong>und</strong> speed. Other
64 CHAPTER 3. THE SUN<br />
Figure 3.11: Relative difference between the squared so<strong>und</strong> speed inferred from<br />
SOHO/MDI observations and a standard solar model. The vertical uncertainties<br />
are error estimates, the horizontal ones reflect the resolution.<br />
quantities, such as elemental composition (mainly via µ and opacities) also<br />
play an important role.<br />
3.5.3 Elemental Migration<br />
The basic structure of the Sun consists of a dynamically stable inner sphere<br />
which extends to a little more than 70% of the Sun’s radius and an overlaying<br />
convective shell which extends to the photosphere. The turbulent motions in<br />
the convection zone are so rapid compared to other time scales that one can<br />
assume that it is well mixed, leading to a homogeneous composition in its<br />
entirety. Compositional changes due to nuclear processing in the convection<br />
zone can be excluded because the temperature is too low. Hence changes<br />
in the chemical composition have to be generated at the bo<strong>und</strong>aries of the<br />
convection zone, either in the dynamically stable region at its base or at the<br />
solar surface (through infall of material or mass loss). As any excess or deficit
3.5. VERIFYING SOLAR EVOLUTION MODELS 65<br />
of an element is diluted in the entire convection zone, a variation of, say, 10%<br />
in the observed ab<strong>und</strong>ance entails that the mass of the element i in question<br />
added or subtracted from the convection zone must be M i = 0.1 X i M CZ , X i<br />
being the original mass fraction of element i and M CZ being the mass of the<br />
convection zone (in the current Sun M CZ is roughly 2% of the total mass of<br />
the Sun [Christensen-Dalsgaard et al., 1996]). For instance, if one terrestrial<br />
planet had migrated into the Sun in the early stages of the formation of the<br />
solar system, this would have resulted in an increase of solar metallicity by only<br />
about 1% using the present-day mass fraction of the convective zone. Note<br />
that this process will not alter the relative ab<strong>und</strong>ances of refractive elements<br />
among themselves. Moreover, in the early Sun, the convection zone was deeper<br />
and hence more massive and a larger flux of matter into it would have been<br />
necessary for any observable effect to be expected.<br />
The current mass loss or accretion rates are much too low to have any<br />
measurable impact on photospheric ab<strong>und</strong>ances. Earlier in the Sun’s life it is<br />
probable that mass loss or accretion rates were higher. Because of the faster<br />
rotation of the Sun in the past, dynamo action was enhanced. This made<br />
more energy in the form of magnetic fields available to drive the solar wind.<br />
Simple calculations show that this could at most have doubled the solar wind<br />
fluence over the lifetime of the Moon [Wimmer-Schweingruber and Bochsler,<br />
2001b], commensurate with measurements of solar wind noble gases in lunar<br />
soils [Geiss, 1973]. Extrapolating these results to earlier times does not result<br />
in a significant increase of mass loss. Moreover, the convection zone was also<br />
much more massive in the past. During the Sun’s evolution on the pre main<br />
sequence when mass exchange would be expected to be greatest the Sun is<br />
thought to have been completely convective [Hayashi, 1961]. The hypothesis<br />
of large mass loss rates in the young Sun has been examined but is not favored<br />
by helioseismology [Morel et al., 1997]. The addition of material that has<br />
been processed by nuclear reactions in the dynamically stable core can also be<br />
excluded. Again, temperatures are high enough only in its innermost regions<br />
making any exchange at its bo<strong>und</strong>ary impossible (with the sole exception of<br />
lithium, see section 3.5.3).<br />
Migration and Separation Processes<br />
The evolution of ab<strong>und</strong>ances in the solar convection zone and in the outer<br />
radiative envelope just below it occurs chiefly as a result of the differential<br />
effects of gravity on the elements of different mass. In a simple two component<br />
gas, constituted of hydrogen and helium, the inward gravitational pull is four<br />
times greater on helium than on hydrogen. As a result, helium will gradually<br />
settle toward the Sun’s center and the fractional ab<strong>und</strong>ance of hydrogen will
66 CHAPTER 3. THE SUN<br />
rise at the surface. Differential radiation pressure induces a minor correction in<br />
the overall chemical evolution in the convection zone but is plays a dominant<br />
role in the evolution of ab<strong>und</strong>ances ratios.<br />
The rate at which gravitational settling occurs is determined in a large part<br />
by the “friction” within the gas, which is dominated by Coulomb interactions.<br />
Because friction increases with the overall ionization state of the plasma, the<br />
settling rate generally will decrease as temperature and density rise.<br />
As the evolution of photospheric ab<strong>und</strong>ances is governed by the evolution<br />
of the ab<strong>und</strong>ances at the base of the convection zone, the deeper the convection<br />
zone, or the smaller the stable radiative interior, the smaller are the<br />
fluxes of elements in and out of the convection zone. This is the combined<br />
effect of enhanced interactions between particles leading to smaller diffusion<br />
velocities and the geometrical effect of reducing the area of the surface through<br />
which particles can flow. Moreover, the dilution of ab<strong>und</strong>ance changes in the<br />
larger convection zone further increases the time scale for the rate of change<br />
of composition. This is important because the depth of convection zone varied<br />
strongly as the Sun evolved [as shown in Bahcall et al., 2001].<br />
The time scale for the evolution of surface ab<strong>und</strong>ances can be approximated<br />
as [Michaud et al., 1976]<br />
τ =<br />
M CZ<br />
4π (r 2 ρv diff ) CZ<br />
, (3.58)<br />
where ρ is the density, r is the radius, and v diff is the diffusion velocity all<br />
evaluated at the base of the convection zone (CZ). The timescales for helium,<br />
silicon and iron with respect to time shown in Figure 3.12 illustrate the combined<br />
effect of the increases in v diff and the radius of the base of the convection<br />
zone and the reduction in M CZ .<br />
The gravitational force exerted on an ion species “i” is A i m H g(r), where<br />
g(r) is the gravitational acceleration at distance r from the center of the Sun.<br />
Radiative pressure is included in the modeling of diffusion by changing the<br />
effective gravity felt by different atomic species to A i m H (g − g rad;i ), where<br />
g rad;i is the radiative acceleration. g rad;i is very sensitive to the to features of<br />
the species spectrum, i. e. to the atomic structure of the ion, on the ionization<br />
state of the ion and of other ions competing for the same photons. Completely<br />
ionized elements feel practically no radiation acceleration.<br />
The expression for g rad;i is taken from Richer et al. [1998] (please refer to<br />
this paper for a detailed discussion) as being<br />
g rad;i =<br />
L r κ R<br />
f<br />
4π r 2 flux . (3.59)<br />
c X i<br />
In this expression X i is the mass fraction of species i, f flux is the fraction of the<br />
radiative flux which will be transferred to species i (refer to Eq.1 in Richer et
3.5. VERIFYING SOLAR EVOLUTION MODELS 67<br />
Figure 3.12: Evolution of the timescale for the variation of chemical composition<br />
in the convection zone with the age of the Sun, the values are normalized<br />
to those in the contemporary Sun at log(age)=0.66. The timescale is element<br />
dependent, here helium (t(He), normalized to 39 Gyr)), silicon (t(Si), normalized<br />
to 51 Gyr) and iron (t(Fe), normalized to 51 Gyr) are shown. Also shown<br />
are the evolution of the mass of the convection zone (M CZ , normalized at the<br />
current value of 0.023 M ⊙ ), and the radius of the base of the convection zone<br />
(R CZ , which is currently at 0.710 R ⊙ in this model).<br />
al. [1998]). The Rosseland mean opacity κ R is a measure of the opacity of the<br />
plasma and determines the total momentum of the radiation field transferred<br />
to the absorbing plasma.<br />
The inverse relationship between g rad;i and the species ab<strong>und</strong>ance has an<br />
interesting potential consequences for isotopic fractionation. Different isotopes<br />
of an element can have large differences in ab<strong>und</strong>ance, which would favor the<br />
less ab<strong>und</strong>ant species. This could potentially create large isotopic anomalies.<br />
The condition for such an effect is that the spectral lines of the minor isotope<br />
be well separated from the spectral lines of the major isotope and that there<br />
would be no coincidence with strong lines from other elements so that f flux can<br />
become non negligible for the minor isotope. This is not the case in the Sun,<br />
not even for helium for which the effect would be the most noticeable. The<br />
temperatures below the convection zone where separation by radiative pressure<br />
could occur are large enough, T > 2 × 10 6 K, that the thermal width of the<br />
spectral lines is much larger than the line separation for different isotopes of
68 CHAPTER 3. THE SUN<br />
a given element. Therefore, f flux will be small and will cancel out the effect of<br />
the 1/X i factor.<br />
It follows that in all calculations of the evolution of isotopic ratios in the<br />
present paper the g rad;i will be assumed to be the same for all isotopes of a<br />
given element. The radiation pressure will only play a role in the evolution of<br />
elemental ratios.<br />
Mixing below the solar convection zone<br />
The first evidence for mixing outside of the convection zone came from the<br />
strikingly low photospheric lithium ab<strong>und</strong>ance. Compared to its meteoritic<br />
ab<strong>und</strong>ance it is depleted by a factor of 137 in the photosphere [Carlsson et al.,<br />
1994]. Solar models without mixing cannot account for this large difference.<br />
Modern solar models include various forms of mixing, based on convective<br />
overshoot or rotationally-driven mechanisms, and can now account for the<br />
observed lithium depletion while preserving the observed beryllium ab<strong>und</strong>ance<br />
and 3 He/ 4 He ratio [See e. g. Brun et al., 2000; Richard et al., 1996].<br />
Moreover, based on helioseismic results, it appears that diffusion alone is<br />
not sufficient to explain the radial profile of the speed of so<strong>und</strong> in the Sun.<br />
There are large discrepancies between older models and measured values, especially<br />
aro<strong>und</strong> the lower bo<strong>und</strong>ary of the convection zone. This can be and has<br />
been rectified by including a limited extension of mixing below the convection<br />
zone into the stable radiative interior [Christensen-Dalsgaard, 1996].<br />
Both issues, lithium and so<strong>und</strong> speed, can be resolved simultaneously by<br />
the same mixing mechanism [as in Brun et al., 2000]. The mixing occurs in<br />
a narrow region at the base of the convection zone in which there is a large<br />
gradient in rotational velocity, this region is called the tachocline. Although<br />
several mixing processes in that region can match the constraints in the Sun,<br />
studies in other solar type stars [Piau and Turck-Chièze, 2002] suggest that<br />
turbulent mixing caused by the shear due to the rotational velocity gradient<br />
[Spiegel and Zahn, 1992] is superior to other processes, the most often suggested<br />
being convective overshoot [e.g. Blöcker et al., 1998].<br />
The predicted evolution of the composition of the outer convection<br />
zone<br />
For this work, we have used the models calculated by Turcotte et al. [1998]<br />
which feature the most detailed treatment of microscopic diffusion in the Sun.<br />
The evolution of the ab<strong>und</strong>ance of the minor isotopes of elements heavier than<br />
carbon have been calculated explicitly. The Turcotte et al. [1998] models have<br />
also been used by Bochsler [2000] to investigate the effect of isotopic fractionation<br />
in the Sun on solar wind ab<strong>und</strong>ances. He estimated the fractionation
3.5. VERIFYING SOLAR EVOLUTION MODELS 69<br />
based on isotopic mass differences and the published factors of depletion for<br />
the major isotope of each element. In the current paper the full effect of the<br />
solar evolution on the net isotopic fraction is taken into account and an approximate<br />
prescription for the effect of mixing beyond the convection zone is<br />
also used. The net effect on isotopic ratios is quite similar in Bochsler [2000]<br />
and here in the absence of mixing. While the Turcotte et al. [1998] models<br />
do not include the effect of mixing beneath the convection zone, we have approximated<br />
how mixing affects the evolution of the photospheric composition<br />
by reducing the changes in composition such as to reflect the results of Brun<br />
et al. [2000] who include mixing in the tachocline in addition to a standard<br />
treatment of diffusion.<br />
Because of the assumptions on initial composition inherent in the computation<br />
of solar models, the absolute values of the ab<strong>und</strong>ances predicted by<br />
solar evolution models cannot be used, only relative changes are meaningful<br />
(with the notable exception of the helioseismic measurements of the helium<br />
ab<strong>und</strong>ance). Here we assume an initial composition as in Grevesse and Noels<br />
[1993] calibrated to reproduce a contemporary value of Z/X of 0.245. This<br />
value of Z/X inferred from the observations is thought to be accurate to 10%<br />
at best.<br />
The predicted surface composition at 4.6 Gyr is illustrated in Fig. 3.13<br />
where the difference between the composition at 4.6 Gyr and the original<br />
composition is plotted in function of the atomic number. The features reflect<br />
mostly the effect of the differential radiative forces. These effects are relatively<br />
small however as the spread in the relative ab<strong>und</strong>ance variations spans 8.8%<br />
for Ar to 7.6% for Ca. The mean variation in the detailed model is aro<strong>und</strong><br />
8.5%. The model including mixing has a lower relative change, with an adopted<br />
value for all estimates done in this work of 71.8% as high as that of the detailed<br />
diffusion-only model.<br />
As a consequence of the evolution of the Sun itself, reflected in the decreasing<br />
timescales shown in Figure 3.12, the rate of ab<strong>und</strong>ance changes has<br />
increased sharply as the Sun has aged. This is illustrated in Fig. 3.14 where<br />
the elemental ab<strong>und</strong>ance ratio of calcium to iron and the isotopic ab<strong>und</strong>ance<br />
ratio of 12 C and 13 C are shown to increase exponentially in the near past. One<br />
notices that the trends are the same for the elemental and isotopic ratios even<br />
though radiative forces are irrelevant in the latter case. One consequence of<br />
this rapid recent evolution is that fossil records of the solar wind at different<br />
epochs (lunar soils for example) may possibly contain evidence of the variations<br />
of some ab<strong>und</strong>ance ratios.<br />
The predicted evolution of isotopic ratios for He, C, N, O, Ne, Mg, Si, and<br />
Ar is presented in Table 3.3. Recalling the discussion on diffusion processes<br />
(Section 3.5.3), one can infer that the only difference of note for isotopes in the
70 CHAPTER 3. THE SUN<br />
Figure 3.13: Relative change in the surface ab<strong>und</strong>ances predicted by the detailed<br />
solar models with diffusion, the lower one without mixing and the higher<br />
one with an approximate affect of mixing at the base of the convection zone.<br />
context of diffusion is their mass. It is assumed here that all characteristics<br />
(i. e. ionization state, radiative forces) for the major isotope were shared by the<br />
minor isotopes with the exception of mass.<br />
As a result of the large mass difference between its isotopes, helium has the<br />
largest variation in its isotopic ratio. Although the variation of the isotopic<br />
ratio is by far the largest variation of all ratios either isotopic or elemental,<br />
the study of helium is compromised by the lack of accurate measurements<br />
of the isotopic ratio of helium at earlier times in the Sun’s life, as has been<br />
touched upon in the introduction. For other elements, the isotopic ratios vary<br />
much less but not much more so than elemental ratios as seen in Table ??.<br />
Not surprisingly, the largest effect, after helium, was fo<strong>und</strong> for 18 O/ 16 O and<br />
36 Ar/ 40 Ar which have similar isotopic relative mass differences. As a general<br />
rule, as the mass of the element increases the effect decreases gradually as the<br />
relative mass difference between isotopes decreases. Nonetheless, significant<br />
effects can be seen when comparing the more massive isotopes of Mg and Si<br />
to their major isotopes.
3.5. VERIFYING SOLAR EVOLUTION MODELS 71<br />
Table 3.3: Values of the relative variation in isotopic ab<strong>und</strong>ance ratios over the<br />
Sun’s life (∆(A/B)/(A/B) o ) in percent. The value without mixing is taken<br />
from the Turcotte et al. [1998] models and the values with mixing are the same<br />
results corrected by the estimated effect of tachocline mixing as discussed in<br />
Brun et al. [1999].<br />
A/B No Mixing (%) With mixing (%)<br />
3 He/ 4 He 4.10 2.85<br />
13 C/ 12 C 0.61 0.43<br />
15 N/ 14 N 0.44 0.31<br />
17 O/ 16 O 0.37 0.26<br />
18 O/ 16 O 0.91 0.64<br />
21 Ne/ 20 Ne 0.26 0.19<br />
22 Ne/ 20 Ne 0.71 0.50<br />
25 Mg/ 24 Mg 0.19 0.13<br />
26 Mg/ 24 Mg 0.57 0.40<br />
29 Si/ 28 Si 0.13 0.09<br />
30 Si/ 28 Si 0.45 0.31<br />
36 Ar/ 40 Ar 1.09 0.76<br />
38 Ar/ 40 Ar 0.64 0.43
72 CHAPTER 3. THE SUN<br />
Figure 3.14: The evolution of the calcium over iron and 12 C/ 13 C ab<strong>und</strong>ance<br />
ratios in the solar convection zone over it’s lifetime. The solid line and dotted<br />
lines show Ca/Fe with and without mixing below the convection zone<br />
respectively. The dashed and dot-dashed lines show 12 C/ 13 C with and without<br />
mixing.<br />
3.6 The Faint-Young-Sun Problem<br />
Solar evolution models predict the temporal evolution of solar luminosity,<br />
L ⊙ ,and other relevant parameters. One of the more interesting problems related<br />
with the evolution of solar luminosity is the so-called “faint young sun<br />
problem”. Fig. 3.16 shows the evolution in a standard model. It can be approximated<br />
by the equation<br />
L ⊙ (t) =<br />
1<br />
1 + 0.4(1 − t/t 0 ) , (3.60)<br />
where t 0 is the present age of the Sun. Other, non-standard solar models with<br />
increased mass loss in the early evolution of the Sun show different luminosities
3.6. THE FAINT-YOUNG-SUN PROBLEM 73<br />
in the past, but could all result in the same present-day luminosity. However,<br />
such enhanced mass loss, probably by a prolonged T-Tauri-like phase in which<br />
a strong wind would emanate from the Sun, would result in enhanced atmosphereic<br />
losses of various planets and moons, and should have left signatures<br />
in asteroidal regoliths and hence in meteoritic data. The low luninosity in the<br />
past is a problem, because it should have resulted in very low surface temperatures<br />
on Earth and the other terrestrial planets. This in turn is a problem<br />
at least for Earth, where we know that life emerged some 3.8 billion years<br />
ago on a hot planet. Solar luminosity translates directly to the so-called solar<br />
Figure 3.15: Solar luminosity variation with time. Standard solar models<br />
predict a gradual increase of solar luminosity with time once the T-Tauri phase<br />
is over. Here we show an approximation to solar luminosity (solid black), as<br />
well as two alternative models with enhanced mass loss.<br />
constant,S ⊙ , at Earth orbit,<br />
S ⊙ =<br />
̷L ⊙<br />
4πr 2 1 AU<br />
, (3.61)<br />
which today has the value S ⊙ = 1368 W/m 2 and gives the power incident<br />
on a unit area at Eart orbit. Obviously, this heats up the Earth, which then<br />
reradiates the incident radiation. The incident radiation is normally not fully<br />
reflected, but some is absorbed and then reradiated and some may be reflected.<br />
This ratio of reflected to absorbed and reemitted will be frequency dependent
74 CHAPTER 3. THE SUN<br />
Figure 3.16: Solar constant variation with time. Standard solar models predict<br />
a gradual increase of solar luminosity and hence the solar constant with time<br />
once the T-Tauri phase is over. Here we show an approximation to solar<br />
constant as measured at Earth (solid black), as well as two alternative models<br />
with enhanced mass loss during the evolution of the Sun.<br />
and in general also depend on time-varying properties of the Earth or any<br />
planet. This results in a monochromatic albedo α(ν) for a given frequency ν.<br />
If we integrate the ratio of reflected, scattered, or reemitted light over incident<br />
light over all frequencies, we obtain the so-called Bond albedo α. The<br />
absorbed radiation heats up the planet, which in turn emits thermal radiation.<br />
Its emissivity ɛ(ν) is again a frequency-dependent quantity, but can be approximated<br />
by a constant value ɛ over a limited wavelength range, especially in the<br />
infrared. α and ɛ do not necessarily have the same numerical value. In order<br />
to determine the equilibrium temperature of a rapidly spinning body in the<br />
solar system, we equate the absorbed radiation F in with the emitted radiation<br />
F out ,<br />
T eq =<br />
( (1 − α) ̷L⊙<br />
4πr 2 ɛ σ<br />
F in =<br />
L ⊙<br />
(1 − α)<br />
4πr 2 πR2 ,<br />
F out = 4πR 2 ɛσT 4 ,<br />
) 1/4<br />
, (3.62)
3.6. THE FAINT-YOUNG-SUN PROBLEM 75<br />
T eq<br />
α<br />
S ⊙<br />
S out<br />
Figure 3.17: Determination of the equilibrium temperature of a rapidly spinning<br />
body in the solar system.<br />
where σ is the Stefan-Boltzmann constant. Inserting sensible quantities for<br />
α and ɛ, one obtains temperatures for early Earth which are way below the<br />
freezing point for water during the early stages of the evolution of the solar<br />
system. This is the faint young Sun paradox - how could life have evolved on a<br />
warm Earth, if the Sun was not bright enough to heat it up to the temperatures<br />
inferred from the geological and fossil observations shown in Fig. 3.18?<br />
This record shows that the Earth must have been very warm in the past,<br />
even approaching the boiling point for water in the earliest times for which<br />
there is a geological record. The records are complete this paragraph.<br />
3.6.1 The Greenhouse Effect<br />
The solution to the Faint Young Sun Problem most probably lies in an enhanced<br />
greenhouse effect in the distant past. If the Earths atmosphere is<br />
optically thin for visible light, but optically thick for infrared, then the radiation<br />
emitted by the planetary surface (which is at a much lower temperature,<br />
T g , than the Sun, and thus, according to Wiens displacement law, emitts at a<br />
much longer wavelength) will be trapped inside the atmosphere (see Fig. 3.19).<br />
While the principle idea so<strong>und</strong>s trivial, the detailed physics are not. Nevertheless,<br />
let us consider it. The radiative transfer equation, eq. 3.33, can also
76 CHAPTER 3. THE SUN<br />
Figure 3.18: The faint young sun paradox. Given current atmospheric composition<br />
data and various albedos, the lower solar luminosity or solar constant<br />
in the past would not have been high enough to melt water or lead to the<br />
temperatures that are inferred from fossils.<br />
be written in the form<br />
µ dI λ<br />
dτ λ<br />
= S λ − I λ , (3.63)<br />
where µ = cos θ (see Fig. 3.6), S λ is the source function and I λ is the intensity<br />
and τ λ the optical depth at wavelength λ, can be rewritten in terms of<br />
frequency,<br />
µ dI ν<br />
dτ λ<br />
= S ν − I ν , (3.64)<br />
which we will use for our study of the greenhouse effect. We will also use<br />
the so-called two-stream approximation. At any height in the atmosphere,<br />
the intensity I ν is assumed isotropic in the hemispheres pointing upwards and<br />
downwards, but the two do not necessarily need to agree. We call the upwards<br />
pointing intensity I ν<br />
+ and the downwards pointing intensity Iν − . Furthermore,<br />
we assume that the atmosphere is optically thin for visible radiation. This<br />
means that the atmosphere is heated from below, by radiative transfer from<br />
the radiation emitted by the warm surface at gro<strong>und</strong> temperature T g . Since<br />
there is no heating from the top, we have Iν − (τ = 0) = 0, where we measure<br />
optical depth τ from the top of the atmosphere down. τ = 0 is then at
3.6. THE FAINT-YOUNG-SUN PROBLEM 77<br />
τ ⊙ ∼ ∞<br />
I + ν<br />
τ IR ≪ ∞<br />
I − ν<br />
T g<br />
S ν<br />
Figure 3.19: The greenhouse effect.<br />
the top of the atmosphere (This also defines what we mean by “top of the<br />
atmosphere”.). The radiation flux F ν is defined by eq. 3.38 repeated here in<br />
the frequency version<br />
F ν dν =<br />
. ∫<br />
dΩ dν I ν µ,<br />
The integration over a sphere can be rewritten as an integration over µ if the<br />
radiation is cylindrically symmetric,<br />
Exercise 3.1 Verify this.<br />
∫<br />
∫<br />
dΩ = 2π<br />
∫ +1<br />
dθ sin θ = 2π dµ.<br />
−1<br />
In the two stream approximation, F ν can be writen as<br />
F ν = π ( I + ν<br />
− I − ν<br />
)<br />
. (3.65)<br />
Exercise 3.2 Verify this. Hint: Divide the integration over µ into two halves,<br />
one for I + ν , one for I − ν .<br />
The radiative flux out of the atmosphere must be conserved and hence we must<br />
have<br />
dF ν<br />
dτ = 0 (3.66)<br />
For a horizontally stratified atmosphere, optical depth maps to height in the<br />
atmosphere, and thus we would also have dF ν /dz = 0. This would change<br />
slightly for a spherically symmetric atmosphere, however, as the Earths (and<br />
other planets) atmosphere is thin compared to the Earths radius, we may consider<br />
the atmosphere as flat and horizontally stratified and hence dF ν /dz = 0
78 CHAPTER 3. THE SUN<br />
would still be true to a good approximation. We can use this flux conservation<br />
to derive an expression for the upwards and downwards intensities at any<br />
place in the atmosphere. For this we integrate the radiative transfer equation,<br />
eq. 3.63, over a sphere. The integral over the source function S ν is just<br />
the Kirchkoff-Planck function B ν for an atmosphere in local thermodynamical<br />
equilibrium (you could also consider this to be the definition of lTE). In the<br />
isotropic case, the average intensity, J ν = I ν , and we thus define a two-stream<br />
approximation average intensity J + ν = I + ν and J − ν = I − ν . Using the two-stream<br />
approximation in the radiative transfer equation and integrating over a sphere,<br />
we obtain<br />
dF ν<br />
dτ = 4πB ν − 2πI + ν − 2πT − ν . (3.67)<br />
Using dFν<br />
dτ<br />
= 0 and adding 2πI ± ν we find<br />
We apply this to gro<strong>und</strong> level, where we find<br />
I ν + = B ν + 1<br />
2π F ν, (3.68)<br />
Iν − = B ν − 1<br />
2π F ν. (3.69)<br />
I + ν g = B ν (T g ) = B ν (T 1 ) + 1<br />
2π F ν, (3.70)<br />
where we have introduced the temperature T 1 right above the surface. Formally,<br />
this cannot be the same as the temperature of the gro<strong>und</strong> (because<br />
F ν has a finite non-zero value), however, in “real life” convection and heat<br />
conduction will tend to equalize the temperatures T g andT 1 , thus reducing the<br />
jump at the surface-atmosphere interface. At the top of the atmosphere we<br />
can use Iν<br />
− = 0 to derive<br />
B ν (T 0 ) = 1<br />
2π F ν, (3.71)<br />
where T 0 is the local temperature at the top of the atmosphere and is called<br />
the skin temperature. With this, we can find the outwards intensity at that<br />
location,<br />
I νtop + = B ν (T 0 ) + 1<br />
2π F ν = 2B ν (T 0 ), (3.72)<br />
which is a remarkable finding, the upward intensity at the top of the atmosphere<br />
is twice that of a black body at the same temperature! The reason for<br />
this is the bo<strong>und</strong>ary condition that Iνtop − = 0 and thus the “missing half” of<br />
the intensity is radiated upwards. This bo<strong>und</strong>ary condition implies that the<br />
radiation intensity at the top effectively comes from a deeper location (at a<br />
larger optical depth than zero) which is hotter. The radiation can reach the
3.6. THE FAINT-YOUNG-SUN PROBLEM 79<br />
top because the atmosphere is opaque, some radiation still reaches the outside.<br />
The location where the radiation “comes from” can easily be determined. Integrating<br />
eq- 3.72 over frequency, we have<br />
∫<br />
∫<br />
dν I νtop + = 2<br />
dν B ν (T 0 ),<br />
T 4 eff = 2T 4 0 . (3.73)<br />
Thus the atmosphere radiates at an effective temperature T eff .<br />
Exercise 3.3 Verify the calculations up to this step.<br />
The location where the atmosphere has its effective temperature can be<br />
determined after we have derived the temperature profile of the atmosphere.<br />
We begin this by multiplying the radiative transfer equation by µ and again<br />
integrating over a sphere. We readily obtain<br />
4π<br />
3<br />
d<br />
dτ J ν = −F ν .<br />
Using eq. 3.67 and dFν<br />
dτ<br />
= 0 we have<br />
4π<br />
3<br />
dB ν<br />
dτ = −F ν and hence<br />
dB ν<br />
dτ = − 3<br />
4π F ν, (3.74)<br />
a trivial differential equation for B ν with the bo<strong>und</strong>ary condition B ν (T 0 , τ =<br />
0) = 1/(2π)F ν . We integrate<br />
∫<br />
dB ν = − 3 ∫<br />
4π F ν<br />
dτ = − 3 2 B ν(T 0 )τ + const.,<br />
where the integration constant comes from the boudary condition B ν (τ = 0) =<br />
B ν (T 0 ), and hence we have the temperature profile<br />
B ν (τ) = B ν (T 0 )<br />
(1 + 3 )<br />
2 τ . (3.75)<br />
Exercise 3.4 Where did the sign of τ change?<br />
Integrating over frequency and using π ∫ dνB ν (T ) = σT 4 , we obtain<br />
T 4 (τ) = T0<br />
(1 4 + 3 )<br />
2 τ . (3.76)<br />
Thus the radiation at the effective temperature T eff<br />
depth τ = 2/3.<br />
stems from an optical
80 CHAPTER 3. THE SUN<br />
We can also estimate the gro<strong>und</strong> temperature from this effective temperature.<br />
Using<br />
B ν (T g ) = B ν (T 1 ) + 1<br />
2π F ν = B ν (T 1 ) + B ν (T 0 )<br />
and B ν (T 1 ) = B ν (τ g ) we obtain<br />
B ν (T g ) = 2B ν (T 0 )<br />
(1 + 3 )<br />
4 τ<br />
and finally<br />
T 4 g = T 4 eff<br />
(1 + 3 4 τ )<br />
. (3.77)<br />
As already mentioned, the large gradient in the immediate vicinity of the<br />
gro<strong>und</strong> can be substantial in the approximation that only radiation transports<br />
energy. However, in most atmospheres, heat conduction or convection will<br />
reduce that gradient. In fact, the onset of convective heat transport can be<br />
estimated using the Schwarzschild stability criterion.<br />
3.7 Solar Atmosphere<br />
3.7.1 The Photosphere<br />
Obviously, the outer convective zone must have an outer bo<strong>und</strong>ary. Observations<br />
of the Sun at visible wavelengths shows a pattern that is reminiscent<br />
of the surface of boiling water in a pan. Figure 3.24 shows a high-resolution<br />
image of the solar surface at 430 nm. The image shows bright structures<br />
(called granules) separated by dark intergranular lanes. While similar structures<br />
can be observed <strong>und</strong>er good seeing conditions, early photographic studies<br />
generally did not manage to capture this fine-scale structure of the solar surface.<br />
Leighton (1963), who studied the solar granulation pattern extensively<br />
in the early 1960-s states “Until rather recently, the only photograph which<br />
clearly showed a reticulated pattern was that by Janssen, taken in 1885”. Today,<br />
gro<strong>und</strong>-based, balloon-borne, and space-borne telescopes allow detailed<br />
studies of the solar granulation. The reason for the difficulty in obtaining photographic<br />
evidence of solar granulation turned out to be the strong temporal<br />
variability of this pattern which averages out over the exposure times needed<br />
in early-day photographs. This granulation pattern appears to be interrupted<br />
at sunspots (cf. Fig. 3.26). The mean size of these granules appears to be about<br />
1.5 Mm, the sizes show a large variation aro<strong>und</strong> this mean. The intuitively<br />
appealing interpretation of granulation as due to convective motion (similar to<br />
the surface of boiling water) was soon fo<strong>und</strong> to apply, with many corrections
3.7. SOLAR ATMOSPHERE 81<br />
Figure 3.20: High-resolution photograph of solar granulation aro<strong>und</strong> 430 nm.<br />
This image shows many granules in different stages of evolution. Several granules<br />
have dark (cool) centers, a precursor to their disintegration, while others<br />
can be seen in the process of cleaving. The smallest bright features between<br />
granules are connected with magnetic structures. Credit: Göran Scharmer<br />
with the Swedish vacuum solar telescope on La Palma.<br />
and caveats that will be discussed later on. Spectroscopic observations are required<br />
to derive at least the upward and downward motions of the granulation<br />
pattern. Fig. 3.22 shows such an example. A central region of the solar disk<br />
was observed (that’s the context image on the right-hand side) and spectra<br />
were acquired every 15s. The spectrum on the left-hand side shows variations<br />
of the spectral lines of TiII at 491 nm, FeIP at 491.13 nm, FeI at 491,78 nm,<br />
and NiI at 491.20 nm. These wiggles are due to differences in up- or downflow<br />
speeds across the length of the slit. Fig: 3.23 shows the corresponding granulation<br />
speeds v conv along the spectrograph slit in Fig. 3.22. The large amplitude<br />
variations within 0.7 arc seconds (5 times the resolution), corresponding to a<br />
spatial scale of about 500 km, can lead to shear turbulence. Nevertheless, such<br />
observations show that the bright features, the granules are upflowing, whereas<br />
the intergranular lanes are filled with material that is flowing downward. This<br />
convective pattern is not a straightforward continuation of the convective motion<br />
inside the convective zone. As we have seen in subsection 3.3.2, it is
82 CHAPTER 3. THE SUN<br />
Figure 3.21: Photograph of solar granulation aro<strong>und</strong> a sunspot. Credit Big<br />
Bear Solar Observatory.<br />
possible for a parcel of solar material to rise upwards through the surro<strong>und</strong>ing<br />
medium if it is Schwarzschild unstable. This appears to happen with the<br />
material in the 2000 km or so below the solar surface and is closely connected<br />
with the ionization state of hydrogen (the dominant element), which reaches<br />
about 50% at that depth. The instability results from a combination of high<br />
opacity, which causes a steep radiative temperature gradient, and a low ratio<br />
of specific heats, γ, associated with the ionization of hydrogen. An upwardmoving<br />
fluid element, expanding so as to remain in pressure equilibrium with<br />
its surro<strong>und</strong>ings, will find itself warmer, and thus less dense and lighter, than<br />
the surro<strong>und</strong>ings, and will continue to rise, while a down-flowing parcel will<br />
experience the reverse effects (Leighton, 1963). This combines to develop a<br />
convective motion that manifests itself in the form of solar granulation. This<br />
phenomenon is by no means limited to the Sun but is very probably a general<br />
phenomenon of stars a mixture of radiative and convective energy transport<br />
in their outer layers.
3.7. SOLAR ATMOSPHERE 83<br />
Figure 3.22: Left-hand panel: Part of a spectrogram in the wavelength interval<br />
491.11 < λ < 491.24 nm. Right-hand panel: Context image with the slit along<br />
the vertical and a fiducial calibration hair crossing horizontally at about 87<br />
arcseconds. From Nesis et al. (2001).<br />
Obviously, the upward-moving material must at some point begin to move<br />
sideways, acquiring a horizontal velocity component. This requires a horizontal<br />
pressure gradient that must built up in the center of the granule and drives the<br />
material out to the edges of the granule and over the intergranular lanes to decelerate<br />
the material there. This pressure must decelerate the upward-flowing<br />
material and accelerate the down-flowing material and thus the downflows are<br />
faster than the upflows. Because of mass conservation, the downflow lanes<br />
must be narrower than the upflowing granules. This additional pressure at<br />
the center of the granules leads to a slight decelleration of the upflowing material,<br />
allowing it to cool more efficiently as it reaches the surface, thus its<br />
opacity decreases rapidly (by up to two orders of magnitude (Stix, 2002)), the<br />
ensuiing increased transparency allows more rapid cooling and a reduced radiative<br />
buoyancy, leading to a rapid slowing down of the upflow. This material<br />
“sitting ontop” of the center of the granule will enhance the central pressure<br />
peak, thus further slowing down the central upflow, and ultimately leading to<br />
a disintegration of the granule, most spectacularly in the form of an exploding<br />
granule (see Fig. 3.24). This effect limits the sizes and the lifetimes of granules.
84 CHAPTER 3. THE SUN<br />
Figure 3.23: Granular Doppler velocity variations along the spectrograph slit<br />
derived from the deviations if the absorption wavelength of the NiI absorption<br />
line at rest. From Nesis et al. (2001).<br />
• granulation<br />
• mesogranulation<br />
• supergranulation<br />
• concentration of magnetic field<br />
• sunspots<br />
3.7.2 The Chromosphere<br />
The chromosphere is normally not visible to the human eye, except for a very<br />
short instance during solar eclipses. During few seconds, just after the beginning<br />
and before the end of an eclipse, a colorful ring can be seen aro<strong>und</strong><br />
the limb, the chromosphere, literally, the colored sphere. It is visible in emission<br />
lines, notably the Hα-line at 656.3 nm and remarkably structured. Dark<br />
mottles, probably a counterpart of spicules more or less follow the magnetic<br />
network on the solar surface or supergranulation. Spicules appear to be the<br />
site of large mass motion, in which about two orders of magnitude more mass<br />
is moved upwards than eventually ends up in the solar wind at speeds of typically<br />
25 km/s. This is remarkable since an initial upward ballistic motion of<br />
25 km/s is not enough to move the mass up along the total length of 5000
3.7. SOLAR ATMOSPHERE 85<br />
Figure 3.24: A time sequence of an exploding granule with the corresponding<br />
velocity or divergence field overlaid. Each snapshot is 5.6” wide and the time<br />
step is 20s. From Rieutord et al. (2000)<br />
km of a spicule. The disagreement of masses also implies that the mass must<br />
ultimately fall back to the surface.<br />
Exercise 3.5 Verify that an initial speed of 25 km/s will not move a parcel of<br />
the solar atmosphere along the length of a vertical spicule.<br />
Another remarkable feature of the chromosphere is its increasing temperature,<br />
its positive temperature gradient. In principle, this is determined in the following<br />
way. Consider the radiation transfer equation, eq. 3.63.<br />
−µ dI λ<br />
dτ λ<br />
= I λ − S λ ,<br />
Formally, this can be integrated to obtain the total intensity from the Sun,<br />
I λ (0, µ) = 1 µ<br />
∫ ∞<br />
0<br />
dτ λ S λ (τ λ )e −τ λ/µ . (3.78)<br />
If we consider wavelengths in the continuum, then we know that the absorption<br />
coefficient will vary smoothly. Furthermore, we assume local thermodynamic<br />
equilibrium, in which case S λ = B λ . Now consider a specific wavelength,<br />
e. g. λ = 500nm, an often used reference. Given our assumption, it is now<br />
possible to obtain both temperature and κ λ . Since the optical depth will always<br />
be larger towards the limb than towards the center of the Sun, the exponential<br />
in the integral in eq. 3.78 will increase the attenuation of tha intensity of
86 CHAPTER 3. THE SUN<br />
Figure 3.25: Normalized histograms of diameters (assuming circular shape) of<br />
granular brightness maxima (solid curve) and intergranular brightess minima<br />
(dotted curve). From Hirzberger et al. (1997)<br />
the considered wavelength towards the limb, where µ is small, more than<br />
towards the center of the disk, where µ is large, i. e. unity. Thus observing at<br />
different optical depths, the source function, in our case B λ (T (τ λ )) is weighted<br />
in different ways and can thus be determined from measurements of the centerto-limb<br />
variation of I λ (τ λ , µ). Thus we obtain the temperature T (τ λ ) at a given<br />
optical depth. Given this temperature, we can further obtain the absorption<br />
coefficient κ λ by repeating this measurement at another wavelength. Because<br />
of the definition of optical depth,<br />
τ λ<br />
∫<br />
. s<br />
= ds κ λ · ρ, (3.79)<br />
0<br />
we have<br />
and hence<br />
and hence<br />
dτ λ<br />
ds = κ λρ,<br />
dT<br />
/ dT = κ 500<br />
,<br />
dτ λ dτ 500 κ λ<br />
τ λ =<br />
∫ τ500<br />
dτ 500<br />
0<br />
κ λ<br />
κ 500<br />
,<br />
where τ 500 needs to be guessed and subsequently iterated to convergence. Since<br />
many ion species contribute to the absorption coefficient, the chemical composition<br />
of the solar amosphere needs to be taken into account in any detailed
3.7. SOLAR ATMOSPHERE 87<br />
Figure 3.26: Histograms of the lifetimes of the 2643 nonred<strong>und</strong>ant automatically<br />
tracked granules (sample A; left) and the 481 manually tracked granules<br />
(sample B; right). The dash-dotted curves represent exponential fits in a lifetime<br />
range between 2 and 96 images, i.e., they are valid for lifetimes of T ≤ 30<br />
minutes. From Hirzberger et al. (1999)<br />
model of it. Such models all show an initial decrease of T , followed by an<br />
increase of temperature with increasing distance from the Sun. Several models<br />
exits for this region, the best known among them are those of ? and of ?<br />
and subsequent work. The temperature minimum between the photosphere<br />
and the again increasing temperature lies aro<strong>und</strong> T ≈ 4200K. Temperatures<br />
in the chromosphere increase to values aro<strong>und</strong> 25’000 K, the thickness of this<br />
layer is only about 2000 km! The observation of spicules with their heights of<br />
typically 5000 km just demonstrates that the simple 1-dimensional models we<br />
just discussed are indeed very crude and the care must be taken in interpreting<br />
their results.<br />
The temperature inversion is visible in highly resolved spectra of chromospheric<br />
absorption lines, notably the CaII H and K lines.<br />
• temperature profile<br />
• magnetic fields, Ca HK lines<br />
• solar and stellar activity<br />
3.7.3 The Corona<br />
• Electron Density Profiles (use Joe Davilas material too)<br />
• Motion in the Corona (SUMER)<br />
• Rigid Rotation of Coronal Holes (implications)<br />
• Coronal Loops
88 CHAPTER 3. THE SUN<br />
Figure 3.27: Ca K line spectrum for an active region and the quiet Sun.<br />
• Temperature of the Corona and its Structuring<br />
• Heating an Atmosphere from Above<br />
• Composition and the FIP Effect (UVCS results)<br />
Eigenschaften der Korona werden mit verschiedensten Methoden bestimmt,<br />
durch optische Beobachtungen, Messungen der Radioemission oder gestreuter<br />
Radiowellen <strong>und</strong> durch Messungen von Teilchen im Sonnenwind <strong>und</strong> von solaren<br />
energetischen Teilchen. Von Interesse sind die Bestimmung der Dichte,<br />
Temperatur, Ausflussgeschwindigkeit <strong>und</strong> Zusammensetzung der Korona.<br />
Dichteprofile der Elektronen können recht einfach bestimmt werden, indem<br />
man die Intensität des an koronalen Elektronen gestreuten Sonnenlichtes<br />
während einer Sonnenfinsternis bestimmt. Weltraumgestützte Koronagraphen<br />
bedecken die Sonne mit einer kleinen Scheibe um eine dauernde Sonnenfinsternis<br />
hervorzurufen. Dies ist notwendig, weil die Sonnenscheibe mehrere<br />
Grössenordnungen heller ist, als die Korona. Das koronale Licht setzt sich<br />
aus vier verschiedenen Komponenten zusammen, der K (Kontinuierlich), F<br />
(Fraunhofer), E (Emission) <strong>und</strong> T (Thermal) Korona. Dabei ist nur der Anteil<br />
der K-Korona auf Streuung durch Elektronen zurückzuführen. Die F-Korona<br />
hat ihren Ursprung in Sonnenlicht, welches an interplanetaren Staubteilchen<br />
gestreut wird (siehe Abschnitt ??), die E-Korona besteht aus Licht, welches<br />
von Ionen emittiert wird, die T-Korona aus der thermischen Emission der<br />
Staubteilchen im Infrarotbereich. In Abständen bis zu etwa einem Sonnenradius<br />
von der Sonne weg dominiert die K-Korona, weiter weg wird die F-Korona<br />
zunehmend wichtiger. Die Streuung an Elektronen heisst Thomson Streuung,
3.7. SOLAR ATMOSPHERE 89<br />
der Streuquerschnitt beträgt<br />
σ T = 8π 3<br />
( e<br />
2<br />
mc 2 ) 2<br />
≈ 6.65 · 10 −29 m 2 . (3.80)<br />
Weil sich die an der Streuung beteiligten Elektronen nur senkrecht zum einfallenden<br />
Lichtstrahl bewegen können, erscheint das von der K-Korona emittierte<br />
Licht <strong>für</strong> weit entfernte Beobachter polarisiert (Abb. 3.28). Dies ermöglicht<br />
⃗E<br />
⃗B<br />
Elektron<br />
e − schwingt mit<br />
Licht erscheint polarisiert<br />
Figure 3.28: Das Licht von Thompson Streuung erscheint einem bei ∼ 90 Grad<br />
sitzenden Beobachter polarisiert.<br />
es, den Beitrag von K- <strong>und</strong> F-Korona zu trennen. Schwierigkeiten entstehen<br />
dadurch, dass die K-Korona nicht vollständig polarisiert ist, <strong>und</strong> weil auch die<br />
F-Korona eine geringe Polarisation aufweist.<br />
Weil das Elektronenplasma in der Korona so heiss ist, werden photosphärische<br />
Emissionslinien verschmiert <strong>und</strong> wir erwarten eine glatte spektrale Emission<br />
der K-Korona. Gewisse sehr intensive Linien können aber im Licht der K-<br />
Korona noch erkannt werden. Durch die Dopplerverbreiterung der Linien ist<br />
es möglich, auf die Temperatur im Elektronengas zu schliessen. Mehr dazu<br />
z.B. in Golub and Pasachoff (1997).
90 CHAPTER 3. THE SUN<br />
Messungen der E-Korona sind aus zwei Gründen wesentlich schwieriger.<br />
Einerseits liegen die Emissionslinien fast ausschliesslich im Ultravioletbereich,<br />
was erfordert, dass die Messungen weltraumgestützt erfolgen. Erschwerend<br />
kommt dazu, dass die E-Korona noch einmal mehrere Grössenordnungen<br />
schwächer ist, als die K- <strong>und</strong> F-Korona. Dies kann nur mit sehr schmalbandigen<br />
Spektrometern wettgemacht werden, deren Bandbreite schmaler oder<br />
höchstens so breit wie die beobachteten Linien sind. Damit wird der Beitrag<br />
der Linien maximiert <strong>und</strong> der Beitrag des Hintergr<strong>und</strong>es der K- <strong>und</strong> F-Korona<br />
minimiert. Beispiele <strong>für</strong> funktionierende Spektrometer sind SUMER <strong>und</strong> UVCS<br />
auf SOHO. SUMER (Solar Ultraviolet Measurements of Emitted Radiation)<br />
wurde am Max-Planck-<strong>Institut</strong> <strong>für</strong> Aeronomie in Lindau gebaut, mit Hilfe<br />
wichtiger Beiträge vom <strong>Institut</strong> d’Astrophysique Spatiale in Orsay (Frankreich),<br />
vom Goddard Space Flight Center der NASA in Greenbelt (Maryland)<br />
<strong>und</strong> der Universität von California in Berkeley, sowie mit der finanziellen Unterstützung<br />
staatlicher Stellen aus Deutschland, Frankreich, den USA <strong>und</strong> der<br />
Schweiz. SUMER misst Profile <strong>und</strong> Intensitäten von Linien im extremen ultravioletten<br />
(EUV) Licht, die in der Sonnenatmosphäre zwischen der oberen<br />
Chromosphäre <strong>und</strong> der unteren Korona emittiert werden, bestimmt Linien-<br />
Verbreiterungen, spektrale Positionen <strong>und</strong> Doppler-Verschiebungen mit hoher<br />
Genauigkeit <strong>und</strong> Sicherheit, liefert typische Bilder ausgewählter Sonnenregionen<br />
im EUV-Licht mit hoher räumlicher, zeitlicher <strong>und</strong> spektraler Auflösung<br />
<strong>und</strong> nimmt in geeigneten EUV-Linien (in einem Temperatur-Intervall zwischen<br />
10 000 <strong>und</strong> 2 000 000 K) Bilder der gesamten Sonnenscheibe <strong>und</strong> der inneren<br />
Korona auf. Insbesondere können durch die Messung der Doplerverschiebungen<br />
<strong>und</strong> -verbreiterungen gewisser Linien die Bewegungen <strong>und</strong> Temperaturen<br />
von Plasmapaketen in der Korona bestimmt werden. UVCS misst Spektren<br />
in der äusseren Korona zwischen 1.5 r ⊙ <strong>und</strong> 3.5 r ⊙ mit einer Auflösung von<br />
0.25 Å (Linienprofile) bzw. 2 Å (Linienintensität). Messungen von an in geringen<br />
Mengen vorhandenem neutralen Wasserstoff (H I) reflektiertem chromosphärischem<br />
H I Lyα ermöglichen es, durch die Dopplerverbreiterung der Linie<br />
die Geschwindigkeitsverteilung entlang der Sichtline zu bestimmen. Die Breite<br />
der Verteilung entspricht der thermischen Geschwindigkeit, welche unerwartet<br />
hoch, je nach Quellregion zwischen 100 <strong>und</strong> 320 km/s beträgt.<br />
Bestimmungen koronaler Parameter mit UVCS verwenden nebst der soeben<br />
besprochenen Verbreiterung der Spektrallinien auch die Methode des “Doppler<br />
dimming”, der Doppler Abschwächung. Um diese zu verstehen betrachten wir<br />
zunächst eine statische Korona ohne eine systematische radiale Geschwindigkeit.<br />
Der in der Korona in geringen Mengen vorhandene neutrale Wasserstoff absorbiert<br />
Ly α, welches in der kühlen Chromosphäre emittiert wird. Nach Absorption<br />
in der äusseren Korona emittiert das H I isotrop, dieser Vorgang heisst<br />
resonante Streuung. Das resonant gestreute Licht kann gemessen <strong>und</strong> seine In-
3.7. SOLAR ATMOSPHERE 91<br />
Figure 3.29: Doppler Pumpen in der Korona. Je nach<br />
Ausströmgeschwindigkeit <strong>und</strong> thermischer Geschwindigkeit des koronalen O<br />
VI streut dieses mehr oder weniger Licht von C II resonant. Im Falle von v th<br />
= 32 km/s wird das Linienverhältnis bei ca. 100 km/s den Wert 2 erreichen,<br />
um dann weiter zu sinken.<br />
tensität bestimmt werden. Besteht eine systematische radiale Geschwindigkeit,<br />
so verschiebt sich im System des koronalen H I die Ly α Linie wegen des<br />
Dopplereffekts,<br />
∆λ<br />
λ = u c , (3.81)<br />
<strong>und</strong> das H I kann weniger Licht resonant streuen, was sich in einer Abschwächung<br />
der Intensität der Ly α Linie bemerkbar macht, die Doppler Abschwächung.<br />
Um zu funktionieren, muss diese Methode also den Anteil H I in<br />
der Korona sehr genau kennen. Dies muss durch Modellrechnungen, wie wir<br />
sie vorher beispielhaft <strong>für</strong> Eisen angedeutet haben, <strong>für</strong> den Ionisationsgrad von<br />
Wasserstoff in der Korona geschehen, weil dieser nicht direkt gemessen werden<br />
kann. Dazu muss die Elektronendichte, wie auch deren Temperatur bekannt<br />
sein.
92 CHAPTER 3. THE SUN<br />
Eine Variante der Dopplerabschwächung ist die “Doppler Pumping” Methode.<br />
Das Sauerstoffion O VI weist ein Linienpaar auf (1032Å <strong>und</strong> 1037Å),<br />
welches in der Korona durch Stösse mit Elektronen angeregt wird <strong>und</strong> im<br />
Verhältnis 2:1 emittiert. Im Falle von resonanter Streuung emittieren die Linien<br />
im Verhältnis 4:1, doppelt so stark, weil das absorbierte Licht ja in diesem<br />
Verhältnis ausgestrahlt worden ist. Durch Messung des Intensitätsverhältnisses<br />
kann also der Anteil des resonant gestreuten Lichtes bestimmt werden, wie<br />
auch die Menge emittierenden Gases. Im Falle einer Korona ohne Ausströmgeschwindigkeit<br />
emittieren die Linien im Verhältnis 4:1, <strong>für</strong> zunehmende radiale<br />
Geschwindigkeiten nimmt das Verhältnis ab, bis die Linie aus der Resonanz<br />
herausfällt <strong>und</strong> die Linien im Verhältnis 2:1 emittieren. Ein besonderes Merkmal<br />
dieser Methode besteht nun darin, dass in der Chromosphäre CII in der<br />
Wellenlänge 1037.018 Å emittiert. Nimmt die Geschwindigkeit weiter zu, absorbiert<br />
die O VI 1037.613Å Linie die C II Photonen <strong>und</strong> streut sie resonant,<br />
was das Linienverhältnis <strong>und</strong>er 2 sinken lässt. Nimmt die Geschwindigkeit noch<br />
weiter zu, steigt das Linienverhältnis wieder auf 2 an. Dies ist in Abb. 3.29<br />
dargestellt.<br />
Die mit der Doppler-Pump Methode gemessenen Ausströmgeschwindigkeiten<br />
von O VI zeigen <strong>für</strong> polare koronale Gebiete eine sehr rasche Zunahme. Innerhalb<br />
von 2 r ⊙ nimmt u von 0 km/s auf über 300 km/s zu. Dies ist wesentlich<br />
schneller, als man vor der SOHO Ära gedacht hat. Die Geschwindigkeiten parallel<br />
zur Sichtlinie sind ebenfalls sehr hoch, was auf Temperaturen der O VI<br />
Ionen von ca. 10 8 Grad Kelvin hindeutet, was deutlich über der Temperatur<br />
der Elektronen von ca. 1 Million Kelvin liegt. Die heute gängige Erklärung<br />
da<strong>für</strong> ist, dass die Ionen durch sogenannte Ionen-Zyklotron Wellen selektiv<br />
geheizt werden. Schwere Ionen weisen ein anderes Verhältnis von Masse zu<br />
Ladung, m/q, auf, als Protonen <strong>und</strong> sind deshalb in einem anderen Bereich<br />
des Wellenspektrums mit diesen Wellen resonant. Das Intensitätsspektrum<br />
von Plasmawellen in der Korona wird weitgehend bestimmt durch eine turbulente<br />
Kaskade, in der grossräumige Bewegungen in stets kleinere zerfallen.<br />
So wird Energie, welche z.B. in grossen magnetischen Schleifen gespeichert ist<br />
zunächst in kleinere Regionen innerhalb der Schleife verteilt, z.B. in kleine<br />
Wirbel, welche wiederum in noch kleinere Wirbel zerfallen, etc. bis die Energie<br />
schliesslich auf der kleinsten Skala in Form von unkorrellierter thermischer Bewegung<br />
der Plasmateilchen dissipiert wird. Diese Konzept der “turbulenten<br />
Kaskade” wird in vielen Bereichen der Hydrodynamik erfolgreich angewandt.<br />
Dabei sorgt ein zunächst unbekannter nicht-linearer Prozess da<strong>für</strong>, dass die<br />
Kaskade über viele Grössenordnungen selbstähnlich verläuft <strong>und</strong> deshalb ein<br />
Potenzgesetz <strong>für</strong> die gespeichedrte Energie (oder Leistung) beobachtet wird.<br />
Abbildung 3.31 gibt einen Eindruck, wie die Leistungsdichte sich verhält. Mehr<br />
dazu später in dieser Vorlesung.
3.7. SOLAR ATMOSPHERE 93<br />
Figure 3.30: Turbulente Kaskade. Grossräumige Strukturen zerfallen in<br />
kleinere. Dabei niummt der Wellenvektor ⃗ k zu. Am meisten Leistung steckt<br />
in den grossen Strukturen.<br />
Noch weiter aussen in der Korona können Messungen mit der Methode<br />
der interplanetaren Szintillation (IPS) gemacht werden. Dazu werden weit<br />
entfernte Radioquellen, z.B. Quasare von mehreren Radiostationen auf der<br />
Erde beobachtet. Die Radiosignale werden durch Dichtefluktuationen in der<br />
Korona verschieden fest gestreut was sich in Intensitätsfluktuationen im Radiosignal<br />
der fernen Quellen niederschlägt. Weil die Dichtefluktuationen in<br />
der Korona nach aussen konvektiert werden, bewegt sich das gestreute Signal<br />
auch auf der Erde <strong>und</strong> die verschiedenen Stationen messen ein zeitlich<br />
verzögertes Signal, das sich sonst ähnlich sieht, jedoch aufgr<strong>und</strong> kleiner Unterschiede<br />
in der Korona nicht exakt übereinstimmt. Durch eine Korrellationsanalyse<br />
der verschiedenen Signale kann die Geschwindigkeit der Dichtefluktuation<br />
bestimmt werden. Aufgr<strong>und</strong> der Dichtekontraste kann diese Methode<br />
zwischen ca. 20 <strong>und</strong> 100 r ⊙ zuverlässige Resultate liefern. Solange nicht Wert<br />
auf kurzfristige Geschwindigkeitsmessungen gelegt wird, können mit dieser
94 CHAPTER 3. THE SUN<br />
ln(P )<br />
p ∝ k −1<br />
p ∝ k −5/3<br />
p ∝ k −3<br />
ln(k = 1 λ )<br />
Figure 3.31: Frequenzspektrum von Wellen im turbulenten Sonnenwind.<br />
Methode durchschnittliche Geschwindigkeiten über weite Bereiche der Korona<br />
bestimmt werden. Insbesondere können “tomographische” Messkampagnen<br />
die globale Geschwindigkeitsverteilung der Korona liefern, welche mit anderen<br />
Methoden nicht möglich sind.<br />
Genau genommen hört die Korona nicht bei 5, auch nicht be 20 oder<br />
mehr r ⊙ Abstand von der Sonne auf. Damit sind Messungen von Teilchen<br />
im interplanetaren Medium eigentlich auch Messungen der Teilchen in der<br />
Korona. Die bei weitestem häufigste Population von Teilchen ist der Sonnenwind.<br />
Die ersten in situ Messungen des Sonnenwindes (<strong>und</strong> damit der<br />
Korona) wurden kurz nach den Vorschlägen von Chapman <strong>und</strong> Parker zur<br />
Erklärung eines Sonnenwindes in den frühen 1960-er Jahren gemacht. Diese<br />
Messungen stellten ein <strong>für</strong> alle Mal klar, dass das interplanetare Medium von<br />
einem überschallschnellen Strom von Sonnenwindteilchen erfüllt wird. Die<br />
ersten Messungen wurden mit Instrumenten auf den russischen Weltraumsonden<br />
Luna 2 <strong>und</strong> 3, sowie Venus 3 gemacht (Gringauz et al., 1960; Gringauz,<br />
1961; Gringauz et al., 1967). Die russischen Messungen zeigten einen Fluss<br />
von mehreren 10 7 Teilchen pro cm 2 <strong>und</strong> Sek<strong>und</strong>e. Darauf folgende Messungen
3.7. SOLAR ATMOSPHERE 95<br />
Figure 3.32: Interplanetare Szintillation. Dichtevariationen im Sonnenwind<br />
rufen Intensitätsschwankugnen im transmittierten Radiosignal ferner Quellen<br />
auf. Die Schwankungen werden über die Erde bewegt mit der Geschwindigkeit<br />
der Plasmapakete, also des Sonnenwindes. Durch Korrellation der Beobachtungsstationen<br />
untereinander kann die Sonnenwindgeschwindigkeit in der Korona<br />
gef<strong>und</strong>en werden.<br />
mit verbesserter Technik auf der amerikanischen Sonde Explorer 10 zeigten<br />
denselben Fluss (Bonetti et al., 1963) <strong>und</strong> eine Geschwindigkeit von ca 280<br />
km/s <strong>und</strong> Protonentemperaturen zwischen 3 <strong>und</strong> 8 10 5 Kelvin (Scherb, 1964).<br />
Die ersten kontinuierlichen Langzeitmessungen des Sonnenwindes wurden mit<br />
der amerikanischen Sonde Mariner 2 auf ihrem Weg zur Venus gemacht. Die<br />
Messugen zeigten einen kontinuierlichen überschallschnellen Fluss von Sonnenwindteilchen<br />
(Snyder and Neugebauer, 1964; Neugebauer and Snyder, 1966).<br />
Heute wird der Sonnenwind routinemäsig auf mehreren Sonden gemessen<br />
<strong>und</strong> die interplanetaren Parameter in “near-real-time” zu Erde gesandt. Sie<br />
sind so wenige Minuten nach ihrer Messung auf einer Raumsonde im Internet<br />
abrufbar <strong>und</strong> dienen z.B. zur besseren Vorhersage des “Weltraumwetters”,<br />
welches z.B. <strong>für</strong> Telekommunikationssatelliten gefährlich werden kann, aber
96 CHAPTER 3. THE SUN<br />
auch <strong>für</strong> den Funkbetrieb wichtig ist, weil die Leitfähigkeit der Ionosphäre<br />
durch diese Grössen beinflusst wird. Informationen über koronale Grössen<br />
können hauptsächlich aus Kompositionsdaten der Instrumente SWICS (Solar<br />
Wind Ion Composition Spectrometer) auf Ulysse <strong>und</strong> ACE, sowie CTOF<br />
(Charge Time of Flight) auf SOHO gewonnen werden. Diese Instrumente<br />
messen nicht nur die Geschwindigkeit <strong>und</strong> Temperatur der Hauptkomponente<br />
des Sonnenwindes, dem Wasserstoff, sondern auch die Zusammensetzung (<strong>und</strong><br />
die kinetischen Eigenschaften) der schweren Ionen. Wie wir gesehen haben,<br />
liefert die Ladungsverteilung der schweren Ionen Informationen über Verhältnisse<br />
in der Korona. Diese Instrumente beruhen alle auf demselben Prinzip. Ein<br />
Sonnenwindion ist charakterisiert durch drei Grössen, seiner Energie, Masse<br />
<strong>und</strong> Ladung. Die Instrumente kombinieren eine elektrostatische Ablenkung<br />
mit einer Messung der Flugzeit <strong>und</strong> der Energie des Teilchens. Im elektrostatischen<br />
Ablenksystem wird die Energie pro Ladung (E/q) festgehalten. Die<br />
eindringenden Sonnenwindteilchen durchfliegen eine Strecke bekannter Länge,<br />
<strong>und</strong> da<strong>für</strong> wird die Flugzeit bestimmt. Mit einer dritten Messung, die der<br />
verbleibenden Energie des Teilchens sind nun drei Messungen <strong>für</strong> die drei Unbekannten<br />
gemacht worden <strong>und</strong> diese können bestimmt werden. Die Auflösung<br />
dieser Instrumente wird begrenzt durch die E/q Auflösung des Eintrittssystems,<br />
eines wenig bekannten Energieverlustes in den zum Triggern eines Startpulses<br />
<strong>für</strong> die Flugzeitmessung verwendeten dünnen (ca. 120 Å) Kohlenstofffolien,<br />
einer nicht unbeträchtlichen Dispersion in der Flugzeitmessung <strong>und</strong> in<br />
Schwankungen in der gemessenen Energie. Selbst neuste Instrumente dieses<br />
Typs erlauben keine wesentlich verbesserte m/q <strong>und</strong> m Auflösung. Trotzdem<br />
gelingt es auf diese Weise, die Zusammensetzung des Sonnenwindes zu<br />
messen. Die während eines Tages (dem 1.1.2000) akkumulierten Daten von<br />
ACE/SWICS sind in Abb. 3.33 wiedergegeben.<br />
3.7.4 Coronal Heating<br />
nanoflares<br />
waves<br />
3.7.5 Linking the Corona to the Photosphere<br />
need coronal magnetic fields, measuring coronal magnetic fields, Hanle effect,<br />
ATST, FASR for active regions,<br />
Solar Orbiter
3.8. FORMATION OF THE SOLAR WIND 97<br />
Figure 3.33: Rohdaten zur Bestimmung der Zusammensetzung des Sonnenwindes.<br />
Die Figur zeigt Daten, welche vom Instrument SWICS auf ACE<br />
während eines Tages (1.1.2000) gemacht wurden. Ladungszustände wie auch<br />
Massen der Sonnenwindionen werden aufgelöst.<br />
3.7.6 Source-Surface Models<br />
potential models<br />
3.7.7 Coronal Activity, Solar Activity, and Stellar Activity<br />
3.8 Formation of the Solar Wind<br />
3.8.1 Early Observations<br />
• Birkeland<br />
• Fitzgerald<br />
• Bartel’s M-regions
98 CHAPTER 3. THE SUN<br />
• Biermann<br />
• Chapman - Parker<br />
• in-situ measurements<br />
Unter dem Begriff “interplanetarer Raum” verstehen wir im folgenden den<br />
Raum, den der von der Sonne ausströmende Sonnenwind definiert. Der interplanetare<br />
Raum beinhaltet also den Sonnenwind, das mitgeführte Magnetfeld<br />
<strong>und</strong> den in geringen Mengen vorhandenen interplanetaren Staub, wie<br />
auch z.B. das Strahlungsfeld der Sonne, die (solare <strong>und</strong> extrasolare) kosmische<br />
Strahlung, interstellare Teilchen, etc. Dies wird oft unter dem Begriff<br />
interplanetares Medium subsummiert. Die Heliosphäre ist die Kavität, welche<br />
durch die Wechselwirkung des Sonnenwindes <strong>und</strong> der solaren Strahlung mit<br />
dem umgebenden lokalen interstellaren Medium (LISM, “local interstellar medium”,<br />
siehe Kapitel ??.) entsteht. Wir werden die Ausbildung der Heliosphäre in<br />
Kapitel ?? genauer untersuchen. Vorweg genommen sei, dass der Sonnenwind<br />
<strong>für</strong> die grossräumige Strukturierung der Heliosphäre die dominante Rolle<br />
spielt, die mikroskopische Struktur der sich am Rand der Heliosphäre bildenden<br />
Grenzflächen ist äusserst komplex, weil die dazu beitragenden Grössen<br />
wie Plasmadruck, Energiedichte im Magnetfeld, in der kosmischen Strahlung<br />
etc. alle etwa denselben Betrag aufweisen <strong>und</strong> so nicht vernachlässigt werden<br />
können.<br />
3.8.2 The Solar Wind<br />
Figur 3.34 zeigt die Parameter des interplanetaren Mediums bei 1 AE <strong>für</strong> die<br />
Bartelsrotation 2303. Die Parameter wurden durch Instrumente auf der Raumsonde<br />
ACE (Advanced Composition Explorer) gemessen <strong>und</strong> stehen im www<br />
öffentlich zur Verfügung (www.srl.caltech.edu/ACE/ASC). ACE umfliegt in<br />
einem Haloorbit den ersten Lagrangepunkt <strong>und</strong> ist somit ca. eine astronomische<br />
Einheit (AE) von der Sonne entfernt. Das Instrument SWEPAM misst<br />
Sonnenwindparameter (von oben nach unten: Dichte, Temperatur, Verhältnis<br />
α/Protonen, Geschwindigkeit), MAG die Parameter, welche das interplanetare<br />
Magnetfeld beschreiben (von oben nach unten: Feldstärke |B| <strong>und</strong> die beiden<br />
Polarwinkel von B). ⃗ Zwei Typen von Sonnenwind können unterschieden<br />
werden, der schnelle <strong>und</strong> der langsame Sonnenwind. Die beiden Typen unterscheiden<br />
sich nicht nur durch ihre Geschwindigkeit (zwischen 300 <strong>und</strong> 400<br />
km/s sowie zwischen 500 <strong>und</strong> 700 km/s), sondern auch durch andere Merkmale,<br />
insbesondere durch ihre Zusammensetzung, was letztlich auf einen anderen Ursprung<br />
in der solaren Korona hindeutet. Tabelle 3.4 gibt einen Überblick über<br />
durchschnittliche Eigenschaften der beiden Sonnenwindtypen.
3.8. FORMATION OF THE SOLAR WIND 99<br />
Figure 3.34: Parameter des interplanetaren Mediums bei ungefähr 1 astronomischen<br />
Einheit Entfernung von der Sonne <strong>für</strong> Bartelsrotation 2303 (Tag<br />
101, 2002 bis Tag 127, 2002). Von oben nach unten: Dichte der Sonnenwindprotonen,<br />
Temperatur der Protonen, Verhältnis der α Teilchen zu Protonen,<br />
Protonengeschwindigkeit, Feldstärke |B| <strong>und</strong> die beiden Polarwinkel der Magnetfeldrichtung<br />
in RTN Koordinaten. Quelle: Level II Daten der ACE Mission.<br />
Exercise 3.6 Ergänzen Sie in Tabelle 3.4 Impulsfluss,dynamischen Druck <strong>und</strong><br />
Schallgeschwindigkeit der beiden Sonnenwindtypen.<br />
3.8.3 The Parker Model<br />
Der Sonnenwind ist ein (fast?) vollständig ionisiertes Plasma, ein eventueller<br />
neutraler Sonnenwind ist experimentell noch nicht niet- <strong>und</strong> nagelfest nachgewiesen.<br />
Er entsteht durch Ladungsaustausch mit neutralen interstellaren Teilchen (Kapitel<br />
??), durch Neutralisation durch Wechselwirkung mit interplanetaren Staubteilchen<br />
(Unterkapitel ??), oder selten in koronalen Massenauswürfen (Kapitel ??). Der<br />
hohe Ionisationsgrad ist eine Folge des Beschleunigungsprozesses aus der Sonnenatmosphäre<br />
heraus durch die Korona in den interplanetaren Raum. Stösse
100 CHAPTER 3. THE SUN<br />
langsam schnell<br />
Grösse Wert σ Wert σ<br />
v p 327 15 702 32 km/s<br />
n p 11.9 4.5 3.9 0.6 cm −3<br />
T p 3.4 1.5 23 3 10 4 K<br />
T α 11 8 142 62 10 4 K<br />
n α /n p 3.8 1.8 4.8 0.5 %<br />
n p vp<br />
2<br />
ρ p vp<br />
2<br />
c s<br />
m −1 s −2<br />
Pa<br />
km/s<br />
Table 3.4: Statistische Eigenschaften des langsamen <strong>und</strong> des schnellen Sonnenwindes.<br />
Nach Bame et al. (1977)<br />
mit dem heissen Elektronengas der Korona ionisieren das Gas vollständig.<br />
Aus der Verteilung von Ladungszuständen schwerer Ionen (Z > 2) lässt sich<br />
die Grössenordnung der Elektronentemperatur abschätzen, allerdings ist eine<br />
genaue Bestimmung des Temperaturprofils aus solchen Messungen wohl nicht<br />
oder nur schwer möglich.<br />
Exercise 3.7 Schätzen Sie ab, welchen Anteil der gesamten von der Sonne<br />
abgestrahlten Energie in die Heizung der Korona gesteckt wird.<br />
Die Photosphäre der Sonne weist eine Temperatur von ca. 5770 K auf. Die<br />
ersten Ionisationspotentiale vieler Elemente liegen in der Grössenordnung von<br />
10 eV. 10’000 K entsprechen etwa 1 eV. Wenn der Sonnenwind fast vollständig<br />
ionisiert ist, bedeutet doch dies, dass die koronalen Elektronen mindestens die<br />
10 eV Energie haben <strong>und</strong> also wesentlich heisser als ca. 6000 K sein müssen.<br />
Wie kann die Korona heisser sein als die Sonnenoberfläche? Oder, salopp<br />
ausgedrückt, was hält den Topf am Kochen? In dieser Frage sind in den<br />
letzten Jahren grosse Fortschritte erzielt worden. Beobachtungen von Emissionslinien<br />
von Wasserstoff, Sauerstoff <strong>und</strong> Magnesium durch das Instrument<br />
UVCS (UltraViolet Coronagraph Spectrometer) auf der SOHO (SOlar and<br />
Heliospheric Observatory, siehe http://sci.esa.int/home/soho/.) Raumsonde<br />
scheinen den wesentlichen Einfluss von Ionen-Zyklotron-Wellen zu untermauern.<br />
Aus der Breite der Emissionslinien kann auf die Temperatur der<br />
Ionen geschlossen werden, welche <strong>für</strong> Protonen bei einigen Millionen Grad<br />
Kelvin liegt, <strong>für</strong> die schweren Ionen aber deutlich über 100 Millionen Grad.<br />
Die Massenabhängigkeit der Heizung der einzelnen Ionenspezies ist eine Eigenschaft<br />
der Wechselwirkung von Ionen-Zyklotron-Wellen mit Ionen.
3.8. FORMATION OF THE SOLAR WIND 101<br />
Die Energiequelle <strong>für</strong> die Beschleunigung des Sonnenwindes muss im solaren<br />
Magnetfeld liegen, welches durch den solaren Dynamo erzeugt wird. Wir<br />
diskutieren hier ein einfaches Sonnenwindmodell, welches die Gr<strong>und</strong>züge der<br />
Beschleunigung <strong>und</strong> deren mathematische Behandlung illustiert. Wir betrachten<br />
eine sphärisch symmetrische Korona, welche sich stationär ausbreitet,<br />
so dass alle Grössen nur von r, nicht aber von der Zeit abhängen. Das expandierende<br />
Gas muss die Kontinuitätsgleichung erfüllen, welche in Kugelkoordinaten<br />
lautet<br />
1 d (<br />
r 2 ρ u ) = 0. (3.82)<br />
r 2 dr<br />
Hier bedeutet r der Abstand von der Sonne, u die Geschwindigkeit <strong>und</strong> ρ<br />
die Dichte. Wir nehmen an, dass u rein radial ist, also keine azimuthalen<br />
oder meridionalen Komponenten aufweist. Wir betrachten ein Gasvolumen,<br />
welches ein Massenelement dm beinhalte. Die Kräfte, welche auf das Volumen<br />
wirken, sind die Gravitation <strong>und</strong> der Druckgradient. Die auf den Druckgradid<br />
⃗ f<br />
dm<br />
Figure 3.35: Gasvolumen in der Sonnenatmosphäre.<br />
enten zurückzuführende Kraft ist einfach zu verstehen. An jedem Ort an der<br />
Oberfläche des Volumens greift die Kraft P df ⃗ an, <strong>und</strong> wir können über die<br />
Oberfläche des Volument integrieren,<br />
∫<br />
⃗F Druck = − dfP ⃗ ∫<br />
= − dV ∇P, ⃗ (3.83)<br />
∂V<br />
wobei ∂V die Oberfläche des Volumens V bedeutet <strong>und</strong> die zweite Gleichheit<br />
aus dem Satz von Stokes folgt. Die durch den Druck erzeugte Kraft pro Volumeneinheit<br />
ist also gleich dem negativen Druckgradienten. Weil auch in der<br />
Sonnenatmosphäre der Druck unten höher ist als oben, erfährt also ein Gaspaket<br />
einen Auftrieb. In unserer Modellatmosphäre haben wir also nun die<br />
folgende Bewegungsgleichung,<br />
ρ d2 r<br />
dt 2 = −G M ⊙ ρ<br />
r 2 − dP<br />
dr . (3.84)
102 CHAPTER 3. THE SUN<br />
Wir wollen den Massefluss von der Sonne weg bestimmen <strong>und</strong> schreiben diese<br />
Gleichung deshalb um in eine Gleichung, welche die Geschwindigkeit explizit<br />
enthält. Mit<br />
d 2 r<br />
dt = du<br />
2 dt = du dr<br />
dr dt = udu<br />
(3.85)<br />
dt<br />
wird Glg. 3.84 zu<br />
ρ u du<br />
dr = −G M ⊙ ρ<br />
− dP<br />
r 2 dr . (3.86)<br />
Wir haben mit der Kontinuitätsgleichung 3.82 eine Gleichung, welche uns<br />
sagt, wie sich der Massenfluss radial verhält. Mit einer Gleichung, welche<br />
uns sagt, wie sich die Geschwindigkeit radial verhält, können wir dann auch<br />
sagen, wie die Dichte vom Abstand von der Sonne abnimmt. Die Impulserhaltungsgleichung<br />
(Glg. 3.86) definiert das Verhalten der Geschwindigkeit bei<br />
gegebenem Druckprofil P (r). Wir brauchen also eine weitere Gleichung, welche<br />
dieses liefert. In anderen Grössen ausgedrückt, ist die Kontinuitätsgleichung<br />
eine Gleichung <strong>für</strong> den Massenfluss, die Bewegungsgleichung eine Gleichung<br />
<strong>für</strong> den Impulsfluss, <strong>und</strong> die nächste Gleichung in der Hierarchie muss eine<br />
Gleichung <strong>für</strong> den Energiefluss sein. Eine formale Herleitung dieser Hierarchie<br />
ist im Appendix ?? gegeben, wo auch die Gleichungen 3.82 <strong>und</strong> 3.86 aus der<br />
f<strong>und</strong>amentalen Boltzmanngleichung hergeleitet werden. Die Energiegleichung<br />
lautet<br />
[ (<br />
1 d 1<br />
r 2 ρ u<br />
r 2 dr 2 u2 + 3 )]<br />
P<br />
= − 1 d (<br />
r 2 P u ) − ρu GM ⊙<br />
+ S(r), (3.87)<br />
2 ρ r 2 dr<br />
r 2<br />
wo S(r) ein Term ist, welcher Energiequellen oder -senken beschreibt, wie<br />
z.B. Strahlung oder Wärmeleitung. Mit den Gleichungen 3.82, 3.86 <strong>und</strong> 3.87<br />
ist das System aber immer noch nicht vollständig beschrieben. Die Massenflussgleichung<br />
3.82 kann nur mit Kenntnis des Impulsflusses gelöst werden.<br />
Dieser wird mit Glg. 3.86 beschrieben, welche aber nur mit Kenntnis des<br />
Energieflusses, Glg. 3.87, bekannt ist. Hier wird nun Kenntnis eines Quellterms<br />
vorausgesetzt, welche mit einer weiteren Gleichung beschrieben werden<br />
könnte. Diese würde aber wiederum die Divergenz des nächsthöheren<br />
Geschwindigkeitsmoments voraussetzen, etc. Diese unendliche Reihe von Gleichungen<br />
muss irgendwo <strong>und</strong> irgendwann abgebrochen werden. Eine Möglichkeit<br />
dies zu tun besteht darin, den Druck durch eine physikalisch sinnvolle <strong>und</strong> gut<br />
motivierte Beziehung durch die Dichte oder eine andere Grösse niedrigerer Ordnung<br />
auszudrücken <strong>und</strong> so das System zu “schliessen”. Im einfachen Modell,<br />
welches wir hier betrachten, geschieht dies durch eine Polytropennäherung,<br />
P = P 0<br />
( ρ<br />
ρ 0<br />
) α<br />
, (3.88)
3.8. FORMATION OF THE SOLAR WIND 103<br />
wo der Polytropenindex α = 1 <strong>für</strong> eine isotherme Korona. Dieser Ansatz macht<br />
eine implizite Annahme über den Quellterm S(r), welcher nicht unbedingt der<br />
Realität entsprechen muss. Für eine isotherme Korona ist die Temperatur<br />
der Korona überall gleich gross. Dies ist gewährleistet, wenn T = 1(T 2 e + T p )<br />
überall gleich gross ist. Dann gilt <strong>für</strong> ein ideales Gas P = 2nkT . Damit lasen<br />
sich Gleichungen 3.82 <strong>und</strong> 3.86 umschreiben zu<br />
1 d (<br />
r 2 n u ) = 0 (3.89)<br />
r 2 dr<br />
<strong>und</strong><br />
n m u du dn<br />
= −2kT<br />
dr dr − nmGM ⊙<br />
. (3.90)<br />
r 2<br />
Das erste Integral von Glg. 3.90 ist<br />
4πnur 2 = I = const., (3.91)<br />
welches ausdrückt, dass der Massenfluss durch sonnenzentrierte Kugelflächen<br />
immer gleich gross bleibt, unabhängig vom Kugelradius. Wir leiten diesen<br />
Ausdruck nach r ab <strong>und</strong> lösen die entstandene Gleichung nach d n auf, welches<br />
dr<br />
wir dann in Glg. 3.90 einsetzen. Nach wenig Arithmetik erhalten wir<br />
(<br />
1 du<br />
u 2 − 2 k T )<br />
= 4 k T<br />
u dr m mr − GM ⊙<br />
, (3.92)<br />
r 2<br />
welche das Verhalten von u(r) durch nur einen einzigen Parameter, der Temperatur<br />
T , bestimmt. Weil wir die Korona als isotherm angenommen haben,<br />
ist T = const. <strong>und</strong> folglich ist zur Bestimmung nichts anderes nötig. Ohne<br />
wesentliche Einschränkung der Allgemeinheit beschränken wir uns auf Temperaturen<br />
T < GM ⊙ m/(4kr 0 ). Sollten wir T grösser wünschen, könnte r 0 ohne<br />
weiteres kleiner gewählt werden. r 0 gibt den kleinsten Radius an, bestimmt<br />
also die “Basis” der Korona in diesem einfachen Modell. Die rechte Seite von<br />
Glg. 3.92 ist also negative <strong>für</strong> r 0 < r < r c , wo<br />
r c = GM ⊙m<br />
4kT , (3.93)<br />
dem sogenannten kritischen Radius. Oberhalb dieses Radius ist die rechte<br />
Seite von Glg. 3.92 positiv. An der Nullstelle muss entweder<br />
oder<br />
u 2 (r c ) . = u 2 c = 2kT<br />
m , (3.94)<br />
1 du<br />
u dr | r=r c<br />
= 0 (3.95)
104 CHAPTER 3. THE SUN<br />
sein. Wir suchen nun Lösungen der Gleichung 3.92, welche stetig <strong>und</strong> eindeutig<br />
sind. Im Falle, dass Glg. 3.94 zutrifft, darf du das Vorzeichen nicht wechseln<br />
dr<br />
<strong>und</strong> folglich ist die Lösung entweder monoton steigend oder monoton fallend.<br />
Im Falle von Glg. 3.95 ändert u 2 c − 2kT<br />
du<br />
das Vorzeichen nicht, wohl aber .<br />
m<br />
dr<br />
Diese Lösung erreicht also bei r = r c ein Extremum. Folglich ergeben sich aus<br />
Glg. 3.92 4 Klassen von Lösungen:<br />
1: u(r) steigt monoton bis r = r c , wo ein Maximum erreicht wird, um dann<br />
wieder abzunehmen,<br />
2: u(r) steigt monoton <strong>und</strong> erreicht bei r = r c den Wert u 2 (r c ) = 2kT/m,<br />
3: u(r) nimmt monoton ab <strong>und</strong> erreicht bei r = r c den Wert u 2 (r c ) =<br />
2kT/m,<br />
4: u(r) nimmt monoton ab bis r = r c , erreicht dort ein Minimum, um<br />
anschliessend wieder zu steigen.<br />
Die vier Klassen unterscheiden sich durch andere Randbedingungen bei r = r 0<br />
<strong>und</strong> r → ∞. Klassen 3 <strong>und</strong> 4 sind nicht physikalisch, weil sie <strong>für</strong> kleine r,<br />
also nahe r 0 eine Geschwindigkeit aufweisen, welche wesentlich grösser ist, als<br />
die thermische Geschwindigkeit des Gases. Klassen 1 <strong>und</strong> 2 sind aus diesen<br />
Überlegungen noch nicht ausgeschieden <strong>und</strong> wir müssen deren Verhalten <strong>für</strong><br />
r → ∞ bestimmen. Dazu kann die Ableitung du umgeschrieben werden als<br />
(1/2u)(du 2 /dr) <strong>und</strong> man erhält <strong>für</strong> Glg. 3.92<br />
1 du 2 (<br />
1 − 2kT<br />
2 dr m<br />
dr<br />
)<br />
1<br />
= 4kT<br />
u 2 mr − GM ⊙<br />
. (3.96)<br />
r 2<br />
Diese lässt sich einfach lösen, indem man mit dr multipliziert <strong>und</strong> anschliessend<br />
links nach du 2 <strong>und</strong> rechts nach dr integriert. Die Lösung u(r) wird beschrieben<br />
durch ( ) u 2 ( ) u 2<br />
GM ⊙ m<br />
− ln = 4 ln r + + ln(u 2<br />
u c u c kT r<br />
c) + C ′ , (3.97)<br />
wo u c = u(r c ). Die Integrationskonstante C ′ bestimmen wir, indem wir gemäss<br />
den vorherigen Überlegungen verlangen, dass am kritischen Radius r c u = u c<br />
gilt. Wir erhalten so die Lösung von Glg. 3.92 in impliziter Form,<br />
( ) u 2 ( ) (<br />
u 2 − u 2 c − u 2 c ln = 4u<br />
2 r 1<br />
u c ln + 2GM ⊙<br />
c r c r − 1 )<br />
. (3.98)<br />
r c<br />
Das Verhalten von Glg. 3.98 ist in Abb. 3.36 <strong>für</strong> verschiedene Abstände von<br />
der Sonne dargestellt. Wie mit der Bestimmung der Integrationskonstanten<br />
verlangt, hat sie bei r = r c genau eine Lösung, u = u c . Bei allen anderen<br />
Abständen r ≠ r c hat sie zwei Lösungen, eine langsame <strong>und</strong> eine schnelle.<br />
Gleichung 3.98 kann numerisch gelöst werden (Tun Sie dies in Übung 2.3!).
3.8. FORMATION OF THE SOLAR WIND 105<br />
Figure 3.36: Grafische Darstellung der impliziten Lösung des Parkermodelles<br />
<strong>für</strong> den Sonnenwind. Die Lösungen <strong>für</strong> die Geschwindigkeit der koronalen<br />
Expansion sind die Nullstellen von Gleichung 3.98, bzw. 3.99.<br />
Exercise 3.8 Lösen Sie Gleichung 3.98 numerisch <strong>und</strong> stellen Sie das Resultat<br />
<strong>für</strong> verschiedene Temperaturen T dar. Tragen Sie die kritischen Punkte<br />
ein. Wie gut ist die Näherung einer konstanten Geschwindigkeit bei der Erde?<br />
Geben Sie die Integrationskonstante C ′ explizit <strong>für</strong> verschiedene Geschwindigkeiten<br />
am kritischen Punkt an.<br />
Für die anderen Lösungen (1 <strong>und</strong> 4) gelten andere Randbedingungen, d.h. die<br />
Integrationskonstante lautet anders. Die allgemeine Lösung lautet in diesem<br />
Fall<br />
( ) u 2 ( ) ũ 2<br />
− − 2 ln( ũ (<br />
u c u c u ) + 4 1 − ln( r ) − r )<br />
c<br />
= 0, (3.99)<br />
r c r<br />
wo ũ = u(r c ). Das Verhalten der einzelnen Lösungen (1 bis 4) ist in Abb. 3.37<br />
dargestellt. Die Lösungen verhalten sich wie erwartet. Für Lösungen der<br />
Klassen 1 <strong>und</strong> 2 ist u/u c < 1 <strong>und</strong> u/ũ < 1 <strong>für</strong> grosse Abstände r → ∞. Damit
106 CHAPTER 3. THE SUN<br />
Figure 3.37: Die vier Lösungsklassen des Parkermodells. Klassen 1 <strong>und</strong> 2<br />
erlauben kein Gleichgewicht mit dem interstellaren Medium, während Klasse<br />
4 nahe an der Sonne nicht beobachtete, zu hohe Geschwindigkeiten aufweist.<br />
Lösungen der Klasse 3 sind physikalisch <strong>und</strong> beschreiben den Sonnenwind erstaunlich<br />
gut.<br />
wird |(u/u c ) 2 | ≪ | ln(u/u c ) 2 | <strong>und</strong> damit<br />
ln(u/u c ) ≈ −2 ln(r/r c ), also u ∝<br />
( ) rc 2<br />
. (3.100)<br />
r<br />
Wegen der Kontinuitätsgleichung 3.89, bzw. der Erhaltung des Massenflusses<br />
(Glg. 3.91), wird <strong>für</strong> diese Lösungsklassen also die Dichte bei grossen Abständen<br />
einen endlichen Wert n ∞ annehmen. Weil wir eine isotherme Korona angenommen<br />
haben wird also P = 2n ∞ kT ebensalls einen von Null verscheidenen,<br />
endlichen Wert annehmen, was es verunmöglicht, mit dem stark verdünnten,<br />
kalten, interstellaren Medium ins Gleichgewicht zu kommen. Wir brauchen<br />
also eine Lösung, welche <strong>für</strong> grosse Abstände<br />
lim n(r) = 0<br />
r→∞
3.8. FORMATION OF THE SOLAR WIND 107<br />
erlaubt. Dies ist nach den vorherigen Überlegungen nur <strong>für</strong> Lösungen der<br />
Klassen 3 <strong>und</strong> 4 möglich. Weil <strong>für</strong> sie u ≫ u c <strong>für</strong> grosse Abstände gilt, haben<br />
wir<br />
( ) u 2<br />
r<br />
√<br />
≈ 4 ln( ), also u ≈ 2u c ln(r/r c )<br />
u c r c<br />
<strong>und</strong> n → 0 <strong>und</strong> damit P → 0. Lösungen der Klassen 2 <strong>und</strong> 4 können ausgeschlossen<br />
werden, weil sie nahe an der Sonne, also tief in der Korona unterhalb<br />
von r c , Geschwindigkeiten aufweisen, welche über der lokalen Schallgeschwindigkeit<br />
liegen. Solch hohe Geschwindigkeiten werden in den koronalen Massenbewegungen<br />
nicht beobachtet. Damit ist von den 4 Lösungen nur diejenige von<br />
Klasse 3 physikalisch. Die Expansion des Sonnenwindes beginnt langsam,<br />
erreicht am kritischen Punkt die Schallgeschwindigkeit <strong>und</strong> expandiert anschliessend<br />
supersonisch weiter ins All. In Abb. 3.38 sind Lösungen <strong>für</strong> verschiedene<br />
koronale Temperaturen dargestellt.<br />
Figure 3.38: Lösungen des isothermen Parkermodells <strong>für</strong> verschiedene koronale<br />
Temperaturen.<br />
Natürlich ist das soeben behandelte Modell <strong>für</strong> den Sonnenwind sehr stark<br />
vereinfacht <strong>und</strong> in vielen Aspekten schlicht falsch. So stammt z.B. der schnelle
108 CHAPTER 3. THE SUN<br />
Sonnenwind aus kühleren koronalen Gebieten, als der langsame Sonnenwind.<br />
Dennoch werden die Gr<strong>und</strong>züge richtig wiedergegeben. Etliche Annahmen sind<br />
nicht gerechtfertigt, wie z.B. die Isothermie, die gleichen Temperaturen <strong>für</strong><br />
Elektronen <strong>und</strong> Protonen, etc. Weitergehende, physikalisch bessere Modelle<br />
sind aber wesentlich komplizierter, <strong>und</strong> deren Lösung erfordert demnach einen<br />
wesentlich grösseren Aufwand, als hier getrieben werden kann.<br />
The further expansion of the solar wind into the heliosphere is discussed<br />
in Chapter ??. Here, we continue to discuss the ionic composition of the solar<br />
wind because we can derive information about coronal heating from it and the<br />
elemental composition of the solar wind because it relates directly to the origin<br />
of the Sun and solar system.<br />
3.8.4 Coronal Heating Revisited<br />
Die Annahme einer isothermen Korona hat es erlaubt, ein einfaches Sonnenwindmodell<br />
zu entwickeln, welches die gr<strong>und</strong>legenden Züge der koronalen Expansion<br />
beschreibt. Wie aber wird die Korona heisser als die Photosphäre?<br />
Dazu muss Energie in der Korona deponiert werden <strong>und</strong> die Elektronen wie<br />
auch die Ionen heizen. Dazu muss in Glg. 3.87 der Term S(r) spezifiziert<br />
werden. S(r) wird oft als exponentiell abfallende Funktion angesetzt, obwohl<br />
die genaue Natur von S(r) immer noch nicht geklärt ist. Auch wenn verschiedene<br />
neue Ansätze erfolgversprechend aussehen, gehört die Heizung der<br />
Korona nach wie vor zu den grossen Rätseln der Sonnenphysik. Die heute am<br />
meisten Erfolg versprechende Idee <strong>für</strong> die Heizung der Korona ist die Heizung<br />
durch die Wechselwirkung von Ionen mit Ionen-Zyklotron Wellen. Das soeben<br />
besprochene Modell kann solche Wellen nicht beinhalten, weil es rein hydrodynamisch<br />
ist, das Magnetfeld <strong>und</strong> der Plasmacharakterdes Sonnenwindes kommt<br />
in den Gleichungen nirgends vor. Ein verbessertes Modell der Koronaheizung<br />
<strong>und</strong> Sonnenwindexpansion muss dieses aber beinhalten, z.B. durch eine magentohydrodynamische<br />
(MHD) oder plasmaphysikalische Beschreibung. Die<br />
Gr<strong>und</strong>züge der MHD werden in Kapitel ?? <strong>und</strong> in Anhang ?? behandelt. Die<br />
Theorie von Wellen im Plasma wird in Anhang ?? zusammengestellt.<br />
Obwohl wir den eigentlichen Heizprozess der Korona nicht gut verstehen, so<br />
können wir doch die Auswirkungen der heissen Korona auf die Verteilung der<br />
Ladungszustände einzelner Elemente im Sonnenwind quantitativ beschreiben.<br />
Die heissen Elektronen der Korona stossen mit Ionen <strong>und</strong> können diese weiter<br />
ionisieren oder mit ihnen rekombinieren. Zur (zeitabhängigen) Kontinuitätsgleichung 3.82<br />
kommen also rechts ein Quell- <strong>und</strong> ein Verlustterm hinzu. Wir schreiben die<br />
Kontinuitätsgleichung <strong>für</strong> ein prominentes Sonnenwindion, O 6+ auf,<br />
∂n 6<br />
∂t + ⃗ ∇ (n 6 ⃗u 6 ) = n e [n 5 C 5 − n 6 (R 6 + C 6 ) + n 7 R 7 ] , (3.101)
3.8. FORMATION OF THE SOLAR WIND 109<br />
wo n i die Dichte des i-ten Ladungszustandes von Sauerstoff ist, C i die Ionisationsrate<br />
aus dem Ladungszustand i heraus, R i die Rekombinationsrate aus<br />
dem Ladungszustand i heraus. Die Änderung des Ladungszustandes ist also<br />
proportional zur Elektronendichte, hängt aber auch von der Dichte der benachbarten<br />
Ladungszustände ab. Gleichung 3.101 alleine ist also sinnlos <strong>und</strong><br />
muss durch ein vollständiges System von Gleichungen ersetzt werden,<br />
∂n n−1<br />
∂t<br />
∂n 0<br />
∂t + ∇ ⃗ (n 0 ⃗u 0 ) = n e [− n 0 C 0 + n 1 R 1 ] ,<br />
∂n 1<br />
∂t + ∇ ⃗ (n 1 ⃗u 1 ) = n e [n 0 C 0 − n 1 (R 1 + C 1 ) + n 2 R 2 ] ,<br />
. = .<br />
∂n i<br />
∂t + ∇ ⃗ (n i ⃗u i ) = n e [n i−1 C i−1 − n i (R i + C i ) + n i+1 R i+1 ] ,<br />
. = .<br />
+ ⃗ ∇ (n n−1 ⃗u n−1 ) = n e [n n−2 C n−2 − n n−1 (R n−1 + C n−1 ) + n n R n ] ,<br />
∂n n<br />
∂t + ⃗ ∇ (n n ⃗u n ) = n e [n n−1 C n−1 − n n R n ] . (3.102)<br />
Dazu kommt eine Gleichung, welche beschreibt, dass die totale Anzahl Ionen<br />
eines gewissen Elementes erhalten bleibt,<br />
n∑<br />
n i = n tot . (3.103)<br />
i<br />
Damit kann eine Gleichung aus dem System Glg. 3.102 entfernt werden. Die<br />
Ionisationsraten C i sind stark temperaturabhängig, die Rekombinationsraten<br />
R i wesentlich weniger. Offensichtlich hängt die Ionisationsrate eng mit dem<br />
Ionisationpotential der Ionen zusammen. Kleinere Ionisationspotentiale werden<br />
eine grössere Ionisationsrate ergeben. Verschiedene Prozesse spielen bei<br />
Ionisation <strong>und</strong> Rekombination eine Rolle:<br />
• Direkte Ionisation: Ein freies Elektron stösst mit einem Ion oder Atom<br />
<strong>und</strong> hat genügend Energie, um es (weiter) zu ionisieren. Je höher also<br />
die Energie der Elektronen, desto wichtiger wird dieser Prozess.<br />
• Excitation-Autoionisation: Photoionisation tendiert dazu, Elektronen aus<br />
inneren Schalen zu entfernen <strong>und</strong> ein hochangeregtes Ion zu produzieren.<br />
Ein Elektron aus einer äusseren Schale muss nun die Vakanz füllen. Dabei<br />
kann es vorkommen, dass die dabei frei werdende Energie ein weiteres<br />
Elektron aus den äusseren Schalen freisetzt <strong>und</strong> sich das Ion in einem<br />
gewissen Sinne “selber” ionisiert, daher der Name “Autoionisation”.
110 CHAPTER 3. THE SUN<br />
• Radiative Rekombination: Ein Ion bindet ein freies Elektron aus dem<br />
Plasma <strong>und</strong> emitiert dabei Strahlung. Für verschiedene Ionensorten gelten<br />
hier verschiedene Wirkungsquerschnitte.<br />
• Dielektrische Rekombination: Die mit dem rekombinierten Elektron aufgenommene<br />
Energie regt das Ion weiter an. Es kann nun entweder autoionisieren,<br />
oder aber in einer radiativen Kaskade einen energetisch günstigeren Zustand<br />
erreichen.<br />
• Ladungstransfer-Prozesse: Ein Atom stösst mit einem Proton (oder, viel<br />
seltener, mit einem α Teilchen oder noch seltener mit einem schweren<br />
Ion) <strong>und</strong> gibt dabei ein Elektron an das Proton ab, X 0 + p → X + + H.<br />
Die Raten <strong>für</strong> die einzelnen Reaktionen müssen aus gemessenen Querschnitten<br />
berechnet werden. Diese sind im allgemeinen von der Energie abhängig<br />
<strong>und</strong> damit muss die Rate ein Mittel sein über die Energie-Verteilungsfunktion<br />
der freien Elektronen. Die Einheit einer Ionisations- oder Rekombinationsrate<br />
ist Volumen pro Zeit, also m 3 /s. Im Erwartungswert <strong>für</strong> die Raten muss der<br />
Wirkungsquerschnitt σ vorkommen, die einfachste (<strong>und</strong> korrekte) Kombination<br />
ist<br />
R oder C = 〈σ · v〉 =<br />
. ∫<br />
dv σ(v) v f(v). (3.104)<br />
Weil Geschwindigkeit in der Regel als eine die Richtung enthaltende Grösse<br />
aufgefasst wird, der Streuquerschnitt aber isotrop ist, ist es sinnvoller, die<br />
Raten als Funktion der Energie zu schreiben. Mit<br />
dE<br />
dE<br />
= mv <strong>und</strong> damit dv = (3.105)<br />
dv mv<br />
erhalten wir <strong>für</strong> Gleichung 3.104<br />
∫<br />
dE √<br />
〈σ · v〉 = √<br />
m 2E/m σ(E) 2E/mf(E) (3.106)<br />
check!<br />
..<br />
〈σ · v〉 = . 8π ∫ ∞<br />
dE E σ(E) f(E), (3.107)<br />
m 2 0<br />
wo m die Elektronenmasse <strong>und</strong> E = 1 2 mv2 die kinetische Energie der Elektronen<br />
ist. σ(E) ist der Wirkungsquerschnitt <strong>für</strong> den untersuchten Prozess.<br />
f(E) ist die Verteilungsfunktion <strong>für</strong> die Elektronen. Die meisten Rechnungen<br />
<strong>für</strong> den Ionisationszustande der Korona gehen von einer Verteilung der Elektronen<br />
im thermodynamischen Gleichgewicht aus, setzen also <strong>für</strong> f(E) eine<br />
Maxwellverteilung an<br />
f(E) =<br />
( ) 3 (<br />
m 2<br />
exp − E )<br />
, (3.108)<br />
2πkT kT
3.8. FORMATION OF THE SOLAR WIND 111<br />
wo T die Temperatur des Elektronenplasmas ist (<strong>und</strong> k die Boltzmannkonstante).<br />
Wenn sich das Plasma nicht im thermodynamischen Gleichgewicht<br />
befindet, müsste es durch eine andere Verteilung beschrieben werden, oft wird<br />
eine sogennante κ-Verteilung verwendet, weil sie sich analytisch einigermassen<br />
anständig benimmt:<br />
f κ (E) =<br />
wo A κ ein Normierungsfaktor ist<br />
( ) [<br />
] m 3/2 −(κ+1)<br />
E<br />
Aκ · 1 +<br />
(3.109)<br />
2πkT<br />
(κ − 1.5) · kT<br />
A κ =<br />
Γ(κ + 1)<br />
Γ(κ − 0.5)(κ − 1.5) 3/2<br />
<strong>und</strong> κ ein frei wählbarer Parameter ist. Für κ → ∞ geht die κ-Verteilung in die<br />
bekannte Maxwellverteilung über, <strong>für</strong> κ = 2 resultiert die Lorentzverteilung.<br />
Der Parameter κ widerspiegelt die Stärke des Schwanzes in der Energieverteilung.<br />
Exercise 3.9 Zeigen Sie, dass f κ <strong>für</strong> κ → ∞ in eine Maxwellverteilung übergeht<br />
<strong>und</strong> <strong>für</strong> κ = 2 gleich der Lorentzverteilung ist. Stellen Sie f κ <strong>für</strong> verschiedene<br />
Werte von κ graphisch dar <strong>und</strong> vergleichen Sie f κ mit den beiden bekannteren<br />
Verteilungen (Maxwell <strong>und</strong> Lorentz).<br />
Mit den notwendigen Grössen, um die Wirkungsquerschnitte σ bestimmen<br />
zu können, können nun die Ladungszustandsverteilungen <strong>für</strong> verschiedene Elemente<br />
in der Korona berechnet werden. Befindet sich das Gas im stationären<br />
Gleichgewicht, so wird sich auch in der Ladungsverteilung ein Gleichgewicht<br />
einstellen. Zwischen zwei benachbarten Ladungszuständen werden aus jedem<br />
Zustand heraus gleich viele Ionen wegionisiert oder rekombiniert wie hinein,<br />
also<br />
n i C i = n i+1 R i+1 , (3.110)<br />
<strong>und</strong> das interessierende Verhältnis im Gleichgewicht lautet also<br />
n i<br />
n i+1<br />
= R i+1<br />
C i<br />
. (3.111)<br />
Wir bestimmen die typische Ladungsmodifikationszeit τ i↔i+1 zwischen zwei<br />
benachbarten Ladungszuständen. In<br />
∂n i<br />
∂t = n e (n i+1 R i+1 − n i C i ) (3.112)
112 CHAPTER 3. THE SUN<br />
ersetzen wir n i+1 = n − n i . Im Gleichgewicht ist n = const. <strong>und</strong> wir lösen<br />
nach n i . Die allgemeinste Lösung lautet<br />
∂n i<br />
∂t + n e (R i+1 + C i ) n i = nn e R i+1 (3.113)<br />
n i (t) = G(t) e −U(t) , (3.114)<br />
wo U(t) die Stammfunktion des Koeffizienten n e (R i+1 + C i ) ist <strong>und</strong> die Inverse<br />
einer Zeitskala definiert. Damit<br />
τ i↔i+1<br />
. =<br />
1<br />
n e (C i + R i+1 ) . (3.115)<br />
Exercise 3.10 Überzeugen Sie sich, dass die Lösung 3.114 nicht im Widerspruch<br />
zu Glg. 3.111 steht.<br />
Um die Bedingungen <strong>für</strong> das thermodynamische Gleichgewicht zu überprüfen,<br />
müssen wir τ i↔i+1 mit einer typischen Expansionszeit τ exp <strong>für</strong> den Sonnenwind<br />
vergleichen. Typischerweise wird dazu die Zeit verwendet, welche ein<br />
Sonnenwindpaket braucht, um eine Skalenhöhe der Korona zu durchqueren.<br />
τ exp = H u . (3.116)<br />
τ exp ∼ 50 St<strong>und</strong>en ist ein üblicherweise angegebener Wert (H<strong>und</strong>hausen, 1972).<br />
Ist τ i↔i+1 kleiner als τ exp , so stellt sich das Ladungsgleichgewicht schneller<br />
ein, als es durch die Expansion des Sonnenwindes verändert werden kann <strong>und</strong><br />
das Plasma befindet sich im Ionisationsgleichgewicht. Ist die Expansionszeit<br />
τ exp kürzer als τ i↔i+1 , so expandiert der Sonnenwind schneller als sich die<br />
Ladungsverteilung ändern kann. In diesem Fall spricht man von “eingefrorenen”<br />
Ladungszustandsverteilungen. Weil die Elektronendichte in der Korona<br />
sehr schnell abnimmt, wird τ i↔i+1 sehr schnell zunehmen, weil der Sonnenwind<br />
beschleunigt wird, nimmt τ exp schnell ab. Weil die beiden Zeitskalen<br />
gegenläufig sind, müssen sie sich irgendwo kreuzen. Die Korona weist also<br />
Gebiete auf, in denen sich das Plasma im Ionisationgleichgewicht befindet <strong>und</strong><br />
andere, in denen die Ladungsverteilungen eingefroren sind. Dieses sehr einfache<br />
Konzept erlaubt es, einige weitere interessante Schlüsse zu ziehen. Weil<br />
die Ionisations- <strong>und</strong> Rekombinationsraten der verschiedenen Ionen sehr unterschiedlich<br />
sein können, die Expansionszeit aber <strong>für</strong> alle ähnlich ist, müssen<br />
verschiedene Ionen(paare) in verschiedenen Abständen von der Sonne einfrieren.<br />
Wenn die Korona nicht isotherm ist, so muss sie in verschiedenen<br />
Abständen eine andere Temperatur aufweisen. Wenn das Elektronenplasma
3.8. FORMATION OF THE SOLAR WIND 113<br />
τ i↔i+1<br />
τ exp<br />
τ i↔i+1<br />
Ladungszustände<br />
eingefroren<br />
τ exp<br />
Figure 3.39: Modifikation von Ladungszuständen in der Korona. Solange<br />
die Expansionszeit τ exp grösser ist, als die τ i↔i+1 befindet sich das Plasma<br />
im Ionisationsgleichgewicht. Wenn τ exp < τ i↔i+1 sind die Ladungszustände<br />
“eingfroren”.<br />
r<br />
nicht Maxwellsch ist, so ändern sich die Ionisations- <strong>und</strong> Rekombinationsraten,<br />
was sich auf Ort <strong>und</strong> Temperatur des Einfrierens auswirkt. Damit erweisen sich<br />
Messungen der Ladungsverteilungen verschiedener Ionen als gute Instrumente,<br />
um die Struktur der Korona zu bestimmen. Gemessene Ladungsverteilungen<br />
schränken die möglichen Dichte-, Temperatur <strong>und</strong> Geschwindikeitsprofile in<br />
der Korona stark ein.<br />
Hinweis: Die kanonische Expansionszeit von 50 St<strong>und</strong>en beruht auf sehr<br />
wackeligen Annahmen. Da<strong>für</strong> wird die Skalenhöhe auf 0.5 AE gesetzt <strong>und</strong><br />
durch 400 km/s geteilt, was ungefähr 50 St<strong>und</strong>en entspricht. Eine solche Vereinfachung<br />
ist nicht gerechtfertigt, die Expansionszeit sollte ja <strong>für</strong> Merkurbewohner<br />
dieselbe sein! Realistischer scheint es, als Skalenhöhe ein paar Sonnenradien<br />
zu nehmen. Damit verkürzt sich τ exp auf ca. eine St<strong>und</strong>e. Genau<br />
genommen ist τ exp wie folgt definiert: In Anlehnung an das Verhalten einer<br />
barometrischen Atmosphäre (also mit einem exponentiell Abfallenden Dichte<strong>und</strong><br />
Druckprofil) wird die Skalenhöhe λ definiert als<br />
|λ| = . | d ln (n(r)) |. (3.117)<br />
dr<br />
Damit kann die Expansionszeit leicht berechnet werden. Für das hier beispielhaft<br />
betrachtete Parkermodell ergeben sich <strong>für</strong> eine koronale Dichte von 10 13
114 CHAPTER 3. THE SUN<br />
m −3 bei r = r ⊙ Expansionszeiten von wenigen 10 Sek<strong>und</strong>en bei einem Abstand<br />
von wenigen Sonnenradien. Das gegenläufige Verhalten der Expansion-<br />
Figure 3.40: Dichteprofil <strong>und</strong> Expansionszeit in der Korona. Die Dichte nimmt<br />
rasch ab, die Expansionszeit ebenso, jedenfalls in der Nähe der Sonne. Sie<br />
erreicht in etwa 10 r ⊙ ein sehr flaches Minimum von etwa 15 Sek<strong>und</strong>en.<br />
szeit <strong>und</strong> Ionisationszeit wird klar, wenn man beachtet, dass nach Glg. 3.115<br />
τ i↔i+1 ∝ 1/n e ist.<br />
Die <strong>für</strong> die Berechnung der Ionisations- <strong>und</strong> Rekombinationstraten findet<br />
man in Artikeln von Arnaud and Rothenflug (1985) <strong>und</strong> Arnaud and Raymond<br />
(1992). Neuere Werte <strong>für</strong> die verschiedenen Wirkungsquerschnitte findet man<br />
in Mazzotta et al. (1998). τ i↔i+1 liegt <strong>für</strong> Fe 9+ <strong>für</strong> T = 1 MK in 2r ⊙ Abstand<br />
bei etwa 110 Sek<strong>und</strong>en, während die Expansionszeit τ exp etwa 1 Minute<br />
beträgt. Fe 9+ ist also <strong>für</strong> diese Annahmen wenig innerhalb von 2 Sonnenradien<br />
eingefroren.<br />
Composition of the Solar Wind<br />
Bei der Entstehung des Sonnensystems vor ca. 4.57 Mia. Jahren hat die Sonne<br />
den grössten Teil der Masse im präsolaren Nebel in sich eingeschlossen. Weil
3.8. FORMATION OF THE SOLAR WIND 115<br />
sie mehr als 99% der Masse im Sonnensystem enthält, ist die solare Zusammensetzung<br />
die Referenz <strong>für</strong> alle Vergleiche zwischen der Komposition verschiedener<br />
Himmelskörper. Während der Evolution der Sonne hat sich die<br />
Zusammensetzung in ihrem Kern natürlich geändert, die der Photosphäre<br />
aber nur geringfügig. Die heute besten Evolutionsmodelle der Sonne sagen<br />
eine Abnahme der Häufigkeiten der schweren Elemente um weniger als 10%<br />
voraus. Vergleicht man Häufigkeitsverhältnisse schwerer Elemente untereinander,<br />
so prognostizieren diese Modelle noch kleinere Unterschiede von der<br />
Grössenordnung ein Prozent. Innerhalb dieser Unsicherheiten kann also die<br />
Zusammensetzung der Photosphäre angesehen werden als die “wahre”, ursprüngliche<br />
solare Zusammensetzung. Weil eine gewisse Klasse von Meteoriten,<br />
die CI Meteorite, eine sehr ähnliche Zusammensetzung wie die Photosphäre<br />
aufweisen, nimmt man gemeinhin an, diese seien sehr primitiv <strong>und</strong><br />
dass sie <strong>für</strong> die Zusammensetzung der schweren <strong>und</strong> nicht volatilen Elemente<br />
repräsentativ sind. Abb. 3.41 zeigt die Zusammensetzung von zwei Klassen<br />
von Meteoriten <strong>und</strong> der Photosphäre. Traditionell werden solche Plots gegen<br />
die 50% Kondensationstemperatur gemacht, einer modellabhängigen Temperatur,<br />
in der 50% der in Frage kommenden Elementes in einem präsolaren Nebel<br />
(mit dessen Zusammensetzung) kondensiert ist. Gezeigt sind in der unteren<br />
Hälfte die Häufigkeitsverhältnisse relativ zu Mg in sogenannten CM Chondriten<br />
relativ zu dieser in CI Chondriten. Offensichtlich sind Elemente bis<br />
zu einer Kondensationstemperatur von ca. 1200 Grad Kelvin um etwa einen<br />
Faktor zwei abgereichert. Ab etwa 1500 Grad sind die Elemente etwas angereichert.<br />
Vergleicht man auf diese Weise alle Klassen von meteoriten untererindander,<br />
so findet man, dass die CI-Meteorite den höchsten Gehalt an volatilen<br />
Elementen aufweisen. In der oberen Hälfte der Abb. 3.41 ist der Vergleich<br />
der Häufigkeiten zwischen CI-Meteoriten <strong>und</strong> der Photosphäre gemacht. Die<br />
y-Achse ist der 10-er Logarithmus des Häufigkeitsverhältnisses (X/Mg) relativ<br />
zum selben Verhältnis in der Photosphäre (dies ist das “dex” an der y<br />
Achse). Offensichtlich ist die Übereinstimmung sehr gut. Einige Ausnahmen<br />
wie Li <strong>und</strong> In, welche ausserhalb des gepltteten Gebietes liegen, sind verstanden.<br />
Abbildung 3.42 wiederholt auf der rechten Seite die obere Hälfte<br />
von Abb. 3.41. Die linke Seite zeigt zwei Histogramme der Häufigkeiten mit<br />
verschiedenen Klassenbreiten sowie einen Fit durch das Histogramm. Die Standardabweichung<br />
der Häufigkeiten liegt bei 0.084 dex, oder etwa 22 %. Diese<br />
Unsicherheit ist nahezu vollständig auf Unsicherheiten in der Bestimmung der<br />
photosphärischen Häufigkeiten zurückzuführen. Alleine die Unsicherheten in<br />
den atomaren Parametern, welche zur Bestimmung von Häufigkeiten aus Linienspektren<br />
benötigt werden liegen in dieser Grössenordnung (Del Zanna et al.,<br />
2001). Dazu kommen Unsicherheiten in der Thermodynamik der Linien emittierenden<br />
Regionen der Photoshäre <strong>und</strong> der tiefen Chromosphäre (Holweger,
116 CHAPTER 3. THE SUN<br />
Figure 3.41: Meteoritische Häufigkeiten in CM <strong>und</strong> CI Chondriten, sowie ein<br />
Vergleich von Häufigkeiten in CI Chondriten <strong>und</strong> in der Photosphäre. Die untere<br />
Hälfte zeigt das Doppelverhältnis (X/Mg) in CM relativ zu CI Chondriten.<br />
Die obere H¨lfte dasselbe <strong>für</strong> CI Chondrite zu Photosphäre. Die x-Achse is in<br />
beiden Hälften die 50% Kondensationstemperatur.<br />
2001). Weil Meteorite im Labor sehr genau untersucht werden können, sind<br />
die Unsicherheiten in ihren Messungen ausschliesslich auf Inhomogenitäten in<br />
den Proben <strong>und</strong> auf Auswahleffekte zurückzuführen. Sie liegen bei 3 - 10%.<br />
Aus diesem Gr<strong>und</strong> werden CI Häufigkeiten sehr oft als Referenz <strong>für</strong> solare<br />
Häufigkeiten gebraucht. In etwas überheblicher Manier wird oft sogar von<br />
kosmischen Häufigkeiten gesprochen 1 .<br />
1 Dies ist umsomehr erstaunlich, wenn man bedenkt, dass es ganze fünf CI Chondrite gibt,<br />
<strong>und</strong> dass die meisten Häufigkeitsbestimmungen von Proben aus einem (dem grössten) dieser<br />
fünf Meteorite stammen. Böse Zungen könnten behaupten, die kosmischen Häufigkeiten<br />
basierten auf Messungen eines einzigen vom Himmel gefallenen Steines. Immerhin ist der<br />
Stein weise ausgewählt worden.
3.8. FORMATION OF THE SOLAR WIND 117<br />
Figure 3.42: Vergleich von CI Häufigkeitn mit der Phosotphäre. Die rechte<br />
Hälfte wiederholt den Vergleich aus Abb. 3.41, die linke Seite ist ein Histogramm<br />
davon.<br />
Der FIP-Effekt<br />
Erste Messungen der Zusammensetzung des Sonnenwindes erlaubten es, diese<br />
mit der der Photosphäre zu vergleichen. Dabei zeigte sich eine systematische<br />
Abweichung von der photosphärischen Zusammensetzung, welche durch<br />
das erste Ionisationspotential gut organisiert scheint. Abbildung 3.43 zeigt<br />
einen Vergleich <strong>für</strong> den schnellen (schwarze Punkte) <strong>und</strong> den langsamen (rote<br />
Diamanten) Sonnenwind. Die Normierung des Doppelverhältnisses (X/O)<br />
im Sonnenwind zu (X/O) in der Photosphäre wird oft relativ zu Sauerstoff<br />
gemacht, weil dieser das häufigste schwere Element ist. In dieser Normierung<br />
erscheinen Elemente mit einem ersten Ionisationpotential (First Ionization Potential<br />
“FIP”) angereichert <strong>und</strong> solche mit einem sehr hohen Ionisationspotential<br />
etwas abgereichert. Würde z. B. relativ zu Mg normiert, würden alle Elemente<br />
mit hohem FIP ( FIP > 10) als abgereichert erscheinen. In der hier<br />
gewählten doppelt logarithmischen Darstellung erscheinen die Häufigkeiten<br />
ungefähr als Potenzgesetz organisiert zu sein. Einzig die blauen Symbole,<br />
welche Messungen von im Mondboden eingefangenem Sonnenwind darstellen,<br />
scheinen den trend zu stören. Diese Edelgase können aber auch besser in den<br />
allgemeinen Verlauf eingeb<strong>und</strong>en werden, wenn man die Häufigkeiten statt<br />
gegen das erste Ionisationspotential gegen die erste Ionisationszeit aufträgt.<br />
Diese ist eine modellabhängige Grösse, z. B. muss man über die Ionisationsprozesse<br />
gewisse Annahmen machen. Aus diesem Gr<strong>und</strong> hat es sich als zuverlässiger<br />
erwiesen, das erste Ionisationpotential als organisierende Grösse zu<br />
verwenden.<br />
Die dem FIP-Effekt zugr<strong>und</strong>eliegende Fraktionierung in der Sonnenatmo-
118 CHAPTER 3. THE SUN<br />
Figure 3.43: Häufigkeiten im Sonnenwind im Vergleich zur Photosphäre als<br />
Funktion des ersten Ionisationspotentials. Häufigkeiten werden auf Sauerstoff<br />
normiert.<br />
sphäre ist nicht verstanden. Es gibt viele Modelle, welche alle ihre Vor- <strong>und</strong><br />
Nachteile haben <strong>und</strong> die Messungen mehr oder weniger gut wiedergeben. Allen<br />
liegt eine Separation von neutralen <strong>und</strong> geladenen Teilchen zugr<strong>und</strong>e un damit<br />
kann der FIP Effekt verstanden werden als ein Wettbewerb zwischen zwei Zeitskalen,<br />
der Ionisationszeit <strong>und</strong> einer Zeit, die es braucht, um neutrale Teilchen<br />
nachzuliefern oder abzureichern. Wesentlicher Bestandteil der Modelle ist auch<br />
eine Bindung der frisch geladenen Teilchen an magnetische Strukturen. Neutrale<br />
Teilchen können dann z. B. wegdiff<strong>und</strong>ieren. Ein solches Szenario ist<br />
in Abb. 3.44 skizziert. Der FIP Effekt scheint auch <strong>für</strong> energetische solare<br />
Teilchen aufzutreten, was auf einen Ursprung dieser Teilchen in der solaren<br />
Korona hindeutet.<br />
Andere Fraktionierungsmechanismen<br />
Die gute Organisation der Elementhäufigkeiten im Sonnenwind durch das erste<br />
Ionisationpotential legt nahe, dass andere Fraktionierungsprozesse weniger
3.8. FORMATION OF THE SOLAR WIND 119<br />
Figure 3.44: Skizze eines möglichen Szenarios <strong>für</strong> den FIP Effekt. Die geladenen<br />
Teilchen (rot) sind an die magnetischen Fledlinien geb<strong>und</strong>en, während die<br />
neutralen Atome (blau) wegdiff<strong>und</strong>ieren können.<br />
stark ausgeprägt sein müssen. Weil bestehende Messungen mit Unsicherheiten<br />
von ca. 20% behaftet sind, ist es auch schwierig, zusätzliche Fraktionierungsprozesse<br />
experimentell zu messen. Zwei Ausnahmen seien hier erwähnt,<br />
die ungenügende Kopplung an das Protonengas durch Coulombstösse <strong>und</strong><br />
Welle-Teilchen Wechselwirkung. Die erste ist in Kompositionsmessungen in<br />
koronalen Streamers (siehe Seite 162) nachgewiesen worden <strong>und</strong> tritt auf,<br />
wenn der Protonenfluss eine gewisse Schwelle unterschreitet <strong>und</strong> die schwereren<br />
Ionen weniger effizient als sonst aus der Korona hinaus “bugsiert”. Welle-<br />
Teilchen Wechselwirkung ist in Kompositionsmessungen noch ungenügend erforscht<br />
worden, hingegen ist sie bekannt aus dem Studium von Geschwindigkeitsverteilungen<br />
von Ionen im Sonnenwind. Sie nimmt mit zunehmendem Abstand von der<br />
Sonne zu, weil die Stossfrequenz im immer stärker verdünnten Plasma immer<br />
kleiner wird. Weil auch in grossen Abständen von der Sonne noch Wellen<br />
generiert werden können (z. B. durch Ionisation von neutralem interstellarem<br />
Material, siehe Kapitel ??), kann dieser Effekt Teilchen auch noch bis weit in<br />
die Heliosphäre beeinflussen. Allerdings ist der Effekt auf die Zusammensetzung<br />
des Sonnenwindes in diesem Falle vernachlässigbar, weil dieser ja schneller<br />
fliesst, als die heliosphärische Fluchtgeschwindigkeit. Welle-Teilchen Wechselwirkung<br />
in Sonnennähe sind experimentell sehr schwer direkt nachzuweisen.
120 CHAPTER 3. THE SUN<br />
Beobachtungen der massenabhängigen Temperaturen von Ionen mit UVCS<br />
bilden eine Ausnahme. Potentiell ist Welle-Teilchen Wechselwirkung <strong>für</strong> die<br />
Fraktionierung von Isotopen im Sonnenwind wichtig, wie auch die ineffiziente<br />
Coulomb-Kopplung. Isotope eines Elementes weisen alle (fast) dasselbe erste<br />
Ionisationspotential auf, <strong>und</strong> deshalb spielt der FIP-Effekt <strong>für</strong> Isotopenfraktionierung<br />
nur eine untergeordnete Rolle.<br />
3.9 Shaping the Heliosphere<br />
3.9.1 The Local Interstellar Environment<br />
3.9.2 Parker Model
Chapter 4<br />
Dynamos<br />
The question how a rotating body such as the Sun could become a magnet was<br />
first correctly addressed by Sir Joseph Larmor (?) in his article “How could<br />
a Rotating Body such as the Sun become a Magnet?”. There he laid out the<br />
crucial idea that convection inside the Sun could build up electric fields which<br />
in turn could lead to currents flowing and thus generating a magnetic field.<br />
Interestingly, the Earth’s magentic field did not attract so much attention<br />
at that time (and before), probably because it was believed that it could be<br />
<strong>und</strong>erstood as a permanent field. Today we know from seismological studies<br />
that the inside of the Earth, and indeed of most planets, is liquid and exhibits<br />
temperatures far exceeding the Curie-temperatures of any know permanent<br />
magnet. Larmor also addressed this question and correctly identified that the<br />
Earth’s magnetic field should have the same origin as the Sun’s. The crucial<br />
point in driving a planetary or stellar magnetic field thus lies in finding a<br />
geometry or mode of internal circulation that will naturally lead to currents<br />
that drive the magnetic field. The “flipping” of the Earth’s magnetic field<br />
and the Sun’s magnetic cycle would then be the consequence of a change of<br />
this internal circulation pattern. The generation of a magnetic field by such<br />
internal flows is called a “dynamo”, the theory behind this subject is thus<br />
called “dynamo-theory”. Here we will give a brief introduction and an outlook<br />
into modern dynamo theory.<br />
4.1 A Simple Model<br />
Ω<br />
⃗B<br />
One of the most intuitive ways to illustrate the<br />
workings of a dynamo is given by ? and shown in<br />
Fig. 4.1. His “homopolar dynamo” consists entirely<br />
of solids. A solid disc of copper rotates<br />
about its symmetry axis at an angular speed Ω.<br />
I<br />
121
122 CHAPTER 4. DYNAMOS<br />
A wire connects to its circumference through a<br />
wire-brush and back to the systems axle along a<br />
cleverly chosen path. As we will see, this system<br />
can lead to the growth of magnetic field. Let<br />
us assume that some remnant current I flows in<br />
the loop (disc and wire), then it generates a weak<br />
magnetic field B ⃗ or a magnetic flux Φ across the<br />
disc if the disc is not a good conductor (otherwise<br />
it would exclude the magnetic field).<br />
Φ = M I, (4.1)<br />
where M is the mutual inductance between the<br />
loop of wire and the rim of the disc. The charge<br />
carriers in the disc feel the Lorentz force which<br />
acts outwards for positive charges and thus feeds<br />
the current I. Depending on the total resistance<br />
of the contraption, R, this can lead to a growing or<br />
decaying magnetic field. The Lorentz force is due<br />
to the rotation of the disc and can also be viewed<br />
as leading to a electromotive potential ϕ = ΩΦ/(2π) because ∫ drF/q = ϕ,<br />
where F = q · Ω · r · B = q · Ω · Φ/πr 2 . Thus ϕ = (ΩΦ)/(2π) and we have the<br />
induction equation for the current I(t) is<br />
This has the solution<br />
L dI<br />
dt + R I = M Ω I. (4.2)<br />
2π<br />
I(t) = I 0 · e ( MΩ<br />
2π −R)t , (4.3)<br />
which can be a growing or a decaying function with time, depending on the sign<br />
of the exponent MΩ<br />
MΩ<br />
− R. If the resistance R is less than , then the current<br />
2π<br />
2π<br />
I(t) and thus the magnetic field B increases with time. In other words, if Ω is<br />
large eneough, i. e. if the body rotates fast enough, this rotation will lead to an<br />
instability against the growth of I and thus of B. Of course, this is still very<br />
much different from a rotating fluid body, nevertheless, this simple example<br />
shows two key ingredients of any dynamo:<br />
• The dynamo requires differential rotation: This can be seen at the wire<br />
brush contacts to the rim and axle of the contraption,<br />
• a dynamo is reflexionally asymmetric, i. e. Ω is parallel to I in this picture.<br />
In a reflexionally symmetric constellation, Ω would be antiparallel to I.
4.2. COWLINGS THEOREM 123<br />
Ω 1 Ω 2<br />
Figure 4.2: Rikitakes geodynamo illustrates in a simple manner the intrinsic<br />
properties of coupled dynamos: the coupling leads to non-linear<br />
terms in the governing system of evolution equations which results in<br />
a chaotic behavior of the net field of the configuration.<br />
In fact,<br />
a simple<br />
combination<br />
of two<br />
such homopolar<br />
dynamos<br />
allows<br />
on to<br />
reproduce<br />
field<br />
reversals<br />
as seen<br />
in the<br />
Earth’s<br />
magnetic field or with the Sun’s magnetic activity cycle. Rikitake’s geodynamo<br />
is such an example and is shown in Fig. ??. Its mathematical descripion is<br />
given by<br />
L dI 1<br />
dt + RI 1 = MΩ 1 I 2 ,<br />
L dI 2<br />
dt + RI 2 = MΩ 2 I 1 ,<br />
C dΩ 1<br />
dt<br />
C dΩ 2<br />
dt<br />
= G − MI 1 I 2 ,<br />
= G − MI 2 I 2 , (4.4)<br />
where C is the moment of inertia of the discs about their axes and G is the<br />
torque applied to each disc. The non-linearity occurs in the lower two equations.<br />
The two coupled homopolar dynamos describe different aspects of the<br />
Earth’s or the Sun’s dynamo that we will soon get to know.<br />
4.2 Cowlings Theorem<br />
There is no axi-symmetric dynamo<br />
Give steps of derivation and leave gro<strong>und</strong> work as an exercise
124 CHAPTER 4. DYNAMOS<br />
4.3 Modern Dynamo Theory<br />
• α<br />
• ω<br />
• use Schüssler manuscript<br />
• helicity<br />
4.4 The Solar Dynamo<br />
• location<br />
• overshoot region<br />
• relation with elemental diffusion?<br />
4.5 Planetary Dynamos<br />
• loaction<br />
• reversals<br />
• show planetary magnetic fields<br />
– the gas planets<br />
– Earth and Moon<br />
– Venus<br />
– Mars<br />
– Mercury
4.5. PLANETARY DYNAMOS 125<br />
Figure 4.3: The homeopolar dynamo<br />
illustrates in a simple manner the intrinsic<br />
properties of any dynamo: axial<br />
symmetry is broken by the wire, and<br />
differential rotation occurs at the rim<br />
of the disk and at the contact with the<br />
axis.
126 CHAPTER 4. DYNAMOS
Chapter 5<br />
The Planets<br />
5.1 Structure of the Planets<br />
5.1.1 Terrestrial Planets<br />
5.1.2 The Gas Giants<br />
5.1.3 Pluto?<br />
5.1.4 Exoplanets<br />
5.2 Terrestrial Planets<br />
5.2.1 Internal Structure<br />
5.2.2 uncompressed density<br />
5.3 The Gas Giants<br />
5.4 The Outer Planets<br />
5.5 Comets<br />
5.6 Asteroids<br />
127
128 CHAPTER 5. THE PLANETS
Chapter 6<br />
Planetary Atmospheres<br />
6.1 Description of Atmospheres<br />
• atmospheres and exospheres<br />
• scale heights<br />
• thermal structure:<br />
– heat sources<br />
– energy transport<br />
– eddy diffusion<br />
– clouds<br />
6.2 Origin of Atmospheres<br />
6.3 Survival of Atmospheres<br />
• atmpsheric escape and evolution<br />
• loss mechanisms<br />
• climate, greenhouse effect<br />
• biological markers, O 2 , O 3<br />
• extrasolar planets and their atmospheres<br />
129
130 CHAPTER 6. PLANETARY ATMOSPHERES<br />
6.4 Dynamics of the Terrestrial Atmosphere<br />
• winds and waves<br />
• El Niño<br />
• gravity waves<br />
• Jupiters red spot<br />
6.5 The COSPAR standard atmosphere
Chapter 7<br />
The Ionosphere<br />
7.1 Origin of the Ionosphere<br />
7.2 Charging Processes<br />
• solar input, UV, X-ray<br />
• charged particles<br />
• aurorae<br />
7.3 Chemistry<br />
• ozone<br />
• ionospheres of other planets<br />
7.4 Seasonal Variations<br />
7.5 Day/Night Variations<br />
• noctilucent clouds<br />
131
132 CHAPTER 7. THE IONOSPHERE
Chapter 8<br />
The Magnetosphere<br />
8.1 Origin of the Magnetosphere<br />
8.2 Overall Structure<br />
8.3 Currents and Current-Sheets<br />
8.4 Magnetospheric Dynamics<br />
8.5 Scales and Cross-Scale Coupling<br />
8.6 Particle Acceleration<br />
8.7 Storms and Substorms<br />
8.8 Solar-Terrestrial Physics<br />
8.9 Comparing Different Magnetospheres<br />
8.9.1 Jupiter and Other Giant Planets<br />
8.9.2 Planets Without Magnetic Fields and With Atmospheres<br />
• Mars<br />
• Venus<br />
133
134 CHAPTER 8. THE MAGNETOSPHERE<br />
8.9.3 Planets With Magnetic Fields and Without Atmospheres<br />
Mercury<br />
8.9.4 Planets Without Magnetic Fields and Without<br />
Atmospheres<br />
• Moon<br />
• asteroids
Chapter 9<br />
The Earth’s Plasma<br />
Environment<br />
9.1 Particle Motion in a Magnetic Field<br />
In this section, we consider the motion of a particle in a magnetic field. There is<br />
more to this easy-so<strong>und</strong>ing problem than meets the eye and alot of interesting<br />
phenomena can be <strong>und</strong>erstood based on the equation of motion for a particle<br />
of mass m and charge q (expressed in units of the elementary charge, e),<br />
d⃗p<br />
dt = q ( ⃗ E + ⃗v × ⃗ B<br />
)<br />
, (9.1)<br />
where ⃗p = γ m ⃗v is the relativistic particle momentum, and<br />
γ . =<br />
1<br />
√1 − v 2 / c 2 . (9.2)<br />
The particles kinetic energy is given by U = mγc 2 . If the electric field vanishes<br />
everywhere at all times, E ⃗ = 0, then the induction equation implies that B ⃗<br />
remains constant in time,<br />
˙⃗B = 0. In this case, we can compute the scalar<br />
product of the equation of motion with momentum ⃗p,<br />
d⃗p<br />
dt · ⃗p = q ( ⃗v × ⃗ B ) · ⃗p = 0, (9.3)<br />
because velocity ⃗v is parallel to momentum, ⃗p. This tells us that magnitude of<br />
the momentum is conserved in a magnetic field, d|⃗p| / dt = 0, and hence that<br />
total kinetic energy U as well as the Lorentz factor areconserved quantities<br />
as well. A magnetic field performs no work. Expanding momentum in the<br />
135
136 CHAPTER 9. THE EARTH’S PLASMA ENVIRONMENT<br />
equation of motion allows us to find the acceleration acting on the particle<br />
d⃗v<br />
dt =<br />
q<br />
m γ<br />
We now define a new vector quantity, ⃗ Ω,<br />
allowing us to rewrite the previous equation 9.4<br />
(<br />
⃗v × ⃗ B<br />
)<br />
. (9.4)<br />
⃗Ω . = −q<br />
m γ ⃗ B (9.5)<br />
d⃗v<br />
dt = ⃗ Ω × ⃗ B. (9.6)<br />
⃗Ω is called the gyro frequency, in the non-relativistic limit, v 2 / c 2 ≪ 1, it<br />
tends towards the cyclotron frequency.<br />
Next we divide the motion of the particle into a part that is parllel to the<br />
magnetic field and a part perpendicular to it, as sketched in Fig.9.1. Defining<br />
⃗r c<br />
⃗ B<br />
v ‖<br />
⃗v ⊥<br />
z<br />
x<br />
y<br />
Figure 9.1: The particles motion can be visualized as a superposition of a<br />
circular motion perpendicular to ⃗ B and a linear motion along ⃗ B.<br />
the z component of our coordinate system to point along ⃗ B, we can now rewrite<br />
eq.9.6 in components<br />
˙v x = Ω y v z − Ω z v y = −Ω z v y ,<br />
˙v y = Ω z v x − Ω x v z = Ω x v z , (9.7)<br />
˙v z = Ω x v y − Ω y v x = 0.<br />
(9.8)
9.1. PARTICLE MOTION IN A MAGNETIC FIELD 137<br />
Because Ω points along ⃗ B, Ω x = Ω y = 0, implying that ˙v z = 0, i. e. a uniform<br />
motion along z. Hence we may consider the motion to be a superposition of a<br />
linear motion along ⃗ B and a circular motion which can be described by<br />
⃗v ⊥ = Ω × ⃗r c , (9.9)<br />
where ⃗r c is the position vector of the particle as seen from the field line it is<br />
circling or from an imaginary point that lies at the center of the circle and<br />
moves along the magnetic field at a speed v ‖ . This center is called the guiding<br />
center, r c is the gyro radius, in the non-relativistic case it reduces to the Larmor<br />
radius and can be fo<strong>und</strong> to be<br />
⃗r c = ⃗v × ⃗ B<br />
Ω 2<br />
= m γ<br />
q<br />
⃗B × ⃗v<br />
B 2<br />
= 1 q<br />
⃗B × ⃗p<br />
B 2 . (9.10)<br />
Evaluating r c for the field configuration studied here, we find that<br />
r c = |⃗r c | = 1 ( )<br />
B<br />
2<br />
q B 2 z p 2 y + Bz 2 p 2 1/2 |p ⊥ |<br />
x =<br />
q B = p sin α<br />
q B , (9.11)<br />
where the angle α defined by tan α = p ⊥ /p ‖ is the pitch angle. For a circular<br />
motion (i. e. α = π/2) we have r c = p/(qB). The quantity<br />
c B r c = p c<br />
q<br />
(9.12)<br />
is called magnetic rigidity and has units Volts, as is readily verified.<br />
Now let us consider the situation where the magnetic field is not uniform,<br />
but varies slowly on a large spatial scale L,<br />
∣ ∣<br />
1 ∣∣∣∣<br />
L ∼ 1 ∂ B ∣∣∣∣ i<br />
, (9.13)<br />
B ∂x j<br />
i. e. 1/L is about equal to the largest of the quantities |(1/B)(∂B/∂x j )|. In<br />
the following, we will assume that L is always much larger then the distance<br />
travelled by the particle during on gyration period τ = 2π/Ω,<br />
L ≫ vτ ≫ r c . (9.14)<br />
This implies that the magnetic field does not change appreciably within the<br />
gyroradius and that we may use its value at the guiding center for further<br />
computations and that our results will be accurate to within ±(r c /L) 2 or<br />
±(vτ/L) 2 . Given the position ⃗x of the particle, the position of the guiding<br />
center is<br />
⃗x G = ⃗x − ⃗r c , (9.15)
138 CHAPTER 9. THE EARTH’S PLASMA ENVIRONMENT<br />
and the velocity of the guiding center is<br />
⎛<br />
⃗v G = d⃗x<br />
dt − d⃗r c<br />
dt = ⃗v − d ⃗ ⎞<br />
B × ⃗p<br />
⎝ ⎠ ,<br />
dt q B 2<br />
⎡<br />
= ⃗v − 1 ⎣ d⃗p<br />
q dt × B ⃗ ⎛<br />
B + ⃗p × d ⃗ ⎞⎤<br />
B<br />
⎝ ⎠⎦ , (9.16)<br />
2 dt B 2<br />
where we have inserted the expression for the gyroradius, eq. 9.10. Because<br />
there is no electric field, we know that ∂B/∂t = 0 and hence,<br />
⎛<br />
d ⃗ ⎞<br />
B<br />
⎝ ⎠ = ∂ ⃗B<br />
dt B 2 ∂t B + ⃗v · ⃗∇ B ⃗<br />
2 B = ( ⃗v · ⃗∇ ) B ⃗<br />
2 B . (9.17)<br />
2<br />
Inserting the equation of motion for d⃗p/dt in eq. 9.16, we have,<br />
Now<br />
⃗v G = ⃗v + 1 q<br />
⎡<br />
⎣q ( ⃗v × ⃗ B ) × ⃗ B<br />
B 2<br />
+ ⃗p × ( ⃗v · ⃗∇ ) ⃗ B<br />
B 2 ⎤<br />
⎦ . (9.18)<br />
(<br />
⃗v × ⃗ B<br />
)<br />
× ⃗ B = − ⃗ B ×<br />
(<br />
⃗v × ⃗ B<br />
)<br />
= −<br />
[<br />
⃗v<br />
( ⃗B · ⃗ B<br />
)<br />
− ⃗ B<br />
( ⃗B · ⃗v<br />
)]<br />
. (9.19)<br />
The second term in the square brackets is just the projection of ⃗v onto ⃗ B<br />
multiplied by B 2 ,<br />
and hence we have<br />
⃗v ‖ =<br />
⃗B ( ⃗v · ⃗B )<br />
B 2 , moreover, ⃗v ⊥ = ⃗v − ⃗v ‖ . (9.20)<br />
⃗v G = ⃗v ‖ + ⃗p × ( ⃗v · ⃗∇ ) ⃗ B<br />
B 2 , (9.21)<br />
which tells us that the guiding center exhibits no transverse motion if ⃗ B is<br />
uniform.<br />
So far, we have computed the instantaneous motion of the guiding center.<br />
Very often however, it is more convenient to know the “smoothed” motion of<br />
the guiding center, neglecting all the small changes that may occur over the<br />
course of one gyration. This is done by averageing ⃗v G over one gyroperiod τ,<br />
⃗V ⊥<br />
. = 〈⃗vG⊥ 〉 τ<br />
. =<br />
1<br />
τ<br />
∫ τ<br />
0<br />
dt⃗v G⊥ . (9.22)
9.1. PARTICLE MOTION IN A MAGNETIC FIELD 139<br />
Thus we are faced with the problem of evaluating<br />
⃗V G⊥ = 1 〈 ⎡ ⎛<br />
⎣⃗p × ⎝(⃗v ·<br />
q ⃗∇) B ⃗ ⎞⎤〉<br />
⎠⎦<br />
B 2<br />
τ<br />
(9.23)<br />
using zero-order quantities for ⃗p, ⃗v, ⃗ B, B 2 , i. e. evaluating these quantities at<br />
the guiding center. Then we can take the guiding center as the origin of our<br />
coordinate system, just as sketched in Fig. 9.1. Thus B x = B y = 0 and we<br />
have<br />
v x<br />
v<br />
v y<br />
v<br />
v z<br />
v<br />
= p x<br />
p<br />
= p y<br />
p<br />
= p z<br />
p<br />
= − sin α sin Ωt (9.24)<br />
= − sin α cos Ωt (9.25)<br />
= cos α (9.26)<br />
Again, just to rub the point in, v z is constant and is independent of the magnetic<br />
field magnitude (independent of Ω). Hence, we write only the x and y<br />
components of the averaged guiding center motion,<br />
V xG = 1 〈<br />
〉<br />
∂ B z<br />
p y v i<br />
q ∂x i B − p ∂ B 2<br />
3v 2 i<br />
∂x i B 2<br />
V yG = 1 〈<br />
〉<br />
∂ B x<br />
p z v i<br />
q ∂x i B − p ∂ B 3<br />
xv 2 i<br />
∂x i B 2<br />
τ<br />
τ<br />
(9.27)<br />
(9.28)<br />
In order to compute these quantities, we need to know the gyroperiod-averaged<br />
products of v i p j ,<br />
〈v i p j 〉 τ<br />
= 1 τ<br />
〈v i p j 〉 τ<br />
= 1 τ<br />
〈v i p j 〉 τ<br />
= 1 τ<br />
〈v z p z 〉 τ<br />
= 1 τ<br />
∫ τ<br />
0<br />
∫ τ<br />
0<br />
∫ τ<br />
0<br />
∫ τ<br />
0<br />
dt vp sin 2 α sin(Ωt) cos(Ωt) = 0, for i ≠ j (9.29)<br />
dt vp sin 2 α sin 2 (Ωt) = 1 2 vp sin2 α, for i = j = x (9.30)<br />
dt vp sin 2 α cos 2 (Ωt) = 1 2 vp sin2 α, for i = j = y (9.31)<br />
dt vp cos 2 α = 1 2 vp cos2 α, (9.32)<br />
(9.33)<br />
and evaluating the derivatives<br />
∂ B x<br />
= 1 (<br />
( ∂ )<br />
∂z B 2 B 4 ∂z B x)B 2 ∂<br />
− B x<br />
∂z B2 ,
140 CHAPTER 9. THE EARTH’S PLASMA ENVIRONMENT<br />
= 1 ∂<br />
B 2 ∂z B x,<br />
= 1 (<br />
)<br />
∂<br />
B<br />
B 3 x<br />
∂x + B ∂<br />
y<br />
∂y + B ∂<br />
z = 1 ( ) ⃗B · ∇ ⃗ Bx , (9.34)<br />
∂z B 3<br />
∂ B y<br />
= 1 (<br />
( ∂ )<br />
∂z B 2 B 4 ∂z B y)B 2 ∂<br />
− B y<br />
∂z B2 ,<br />
= 1 ∂<br />
B 2 ∂z B y,<br />
= 1 (<br />
)<br />
∂ ∂ ∂<br />
B<br />
B 3 x = 1 ( ) ⃗B · ∇ ⃗ By , (9.35)<br />
B 3<br />
∂<br />
∂x i<br />
B z<br />
B 2 = 1 B 4 (<br />
( ∂<br />
∂x + B y<br />
∂y + B z<br />
∂z<br />
)<br />
B z )B 2 ∂<br />
− B z B 2 where, B = B z<br />
∂x i ∂x i<br />
)<br />
= 1 B 4 (<br />
( ∂<br />
∂x i<br />
B)B 2 − B2B ∂<br />
∂x i<br />
B<br />
= − 1 B 2 ∂<br />
∂x i<br />
B. (9.36)<br />
Now we can evaluate the gyroperiod-averaged guding-center motion in x and<br />
y,<br />
V xG = 1 (<br />
) (<br />
) 〉<br />
∂ ∂ ∂ Bz<br />
〈p y v x + v y + v z<br />
q ∂ x ∂ y ∂ z B − p ∂ ∂ ∂ By<br />
2 z v x + v y + v z ,<br />
∂ x ∂ y ∂ z B 2 τ<br />
V xG = 1 (<br />
) (<br />
) 〉<br />
∂ ∂ ∂ Bx<br />
〈p z v x + v y + v z<br />
q ∂ x ∂ y ∂ z B − p ∂ ∂ ∂ Bz<br />
2 x v x + v y + v z ,<br />
∂ x ∂ y ∂ z B 2<br />
Inserting the previously fo<strong>und</strong> expressions for the gyroperiod-averaged products<br />
pv and partial derivatives, we find<br />
V xG = pv [ ( 1 ∂<br />
qB 2 2 sin2 α z)<br />
∂y B − cos 2 α ∂ ]<br />
∂z B y ,<br />
V yG = − pv<br />
qB 2 [ 1<br />
2 sin2 α<br />
( ) ∂<br />
∂x B z − cos 2 α ∂ ]<br />
∂z B x .<br />
Next we symmetrize these equations with the aim of writing them more concisely<br />
as a vector equation. We can achieve this aim by noting that the x and<br />
y components of the magnetic field vanish and so any quantity that is multiplied<br />
by them may be added to the equations above with no adverse effects.<br />
Together with eqs. 9.34 to 9.36 we find<br />
V xG = pv<br />
q<br />
[ 1<br />
2 sin2 α 1 (<br />
)<br />
∂<br />
B<br />
B 3 y<br />
∂z B − B ∂<br />
z<br />
∂y B +<br />
,<br />
τ
9.1. PARTICLE MOTION IN A MAGNETIC FIELD 141<br />
cos 2 { (<br />
)<br />
α ∂ ∂ ∂<br />
B<br />
B 4 y B x + B y + B z B z −<br />
∂ x ∂ y ∂ z<br />
(<br />
) }]<br />
∂ ∂ ∂<br />
B z B x + B y + B z B y ,<br />
∂ x ∂ y ∂ z<br />
V yG = pv [ 1<br />
q 2 sin2 α 1 (<br />
)<br />
∂<br />
B<br />
B 3 z<br />
∂x B − B ∂<br />
x<br />
∂z B +<br />
cos 2 { (<br />
)<br />
α ∂ ∂ ∂<br />
B<br />
B 4 z B x + B y + B z B x −<br />
∂ x ∂ y ∂ z<br />
B x<br />
(<br />
B x<br />
∂<br />
∂ x<br />
+ B y<br />
∂<br />
∂ y<br />
+ B z<br />
∂<br />
∂ z<br />
)<br />
B z<br />
}]<br />
.<br />
These lengthy expressions can now be compactely written as a vector equation<br />
which gives us the perpendicular motion of the guiding center in a given nonuniform<br />
magnetic field,<br />
⎡<br />
⃗V G⊥ = pv ⎣ 1 B<br />
qB 2 sin2 α ⃗ × ∇B ⃗ ⃗B × [( ) ] ⎤<br />
B ⃗ · ∇ ⃗ ⃗B<br />
+ cos 2 α<br />
⎦ . (9.37)<br />
B 2<br />
B 3<br />
It is important to remember that this equation is not valid for all non-uniform<br />
field configurations. It was derived <strong>und</strong>er the explicit assumptions that we may<br />
evaluate all quantities at the guiding center and do not need to know them at<br />
the particles exact location. This expression correct up to second-order terms<br />
in r c /L or in vτ/L and no more. It is not a general expression such as the<br />
equation of motion, eq. 9.1.<br />
Nevertheless, it tells us alot about the motion of the guiding center in a<br />
weakly non-uniform field. The first term in the square brackets describes the<br />
influence of the transverse gradient of the magnetic field strength, the second<br />
results from the curvature of the field lines. The first term can be brought<br />
into a possibly more familiar form by inserting the explicit expression for the<br />
gyroradius (eq. 9.11) and using v ⊥ = v sin α. Then we have<br />
⃗V G⊥∇ = 1 2 r cv ⊥<br />
⃗ B × ⃗ ∇B<br />
B 2 . (9.38)<br />
It describes a drift perpendicular to ⃗ B × ⃗ ∇B, i. e. perpendicular to both ⃗ B and<br />
⃗∇B. It points in opposite directions for positively and negatively charged particles<br />
because the charge enters as an odd power in these expressions (obvious<br />
in eq. 9.37, hidden in r c in eq. 9.38). An often cited special case of this drift is<br />
of great importance for the modulation of cosmic rays. Consider a greatly simplified<br />
heliospheric current sheet as sketched in Fig. 9.2. The particles will drift<br />
along the current sheet, positively charged particles in one diection, negatively
142 CHAPTER 9. THE EARTH’S PLASMA ENVIRONMENT<br />
Figure 9.2: ⃗ ∇B drift in a very much simplified heliospheric curret sheet configuration.<br />
charged particles in the other. This may explain he differences in the fluxes of<br />
GCR electrons and protons between even and odd solar activity cycles. However,<br />
even in this sketch, and even more so in reality, our assumption that the<br />
gyroradius is much smaller then the scla length of the non-uniformities of the<br />
field is flagrantly violated.<br />
The second term in the square brackets in eq. 9.37 can be rewritten using<br />
v ‖ = v cos α. Then we havve<br />
⃗V G‖curv = γmv2 ‖<br />
qB 4 [ ⃗B ×<br />
{( ⃗B · ⃗ ∇<br />
) ⃗B<br />
}]<br />
, (9.39)<br />
which again may be more familiar. The drift is perpendicular to the plane<br />
containing the surface spanned by the curved field line and goes in opposite<br />
directions for oppositely charged particles.<br />
9.2 Definition of adiabatic invariants<br />
Consider the motion of a particle which can be described by a parameter λ. λ<br />
may change slowly <strong>und</strong>er the influence of external forces, this is called adiabatic<br />
change. Slowly means that λ changes only by a small amount during a period<br />
T of the motion<br />
dλ<br />
dt ≪ λ T ; (9.40)<br />
for dλ/dt = 0 the motion is strictly periodic and has a fixed energy E. If<br />
λ changes slowly, so does E as some function of λ. This dependence of E on<br />
λ can be expressed by the constancy of some combination I of E and λ. This<br />
quantity I remains constant even for slow changes of the system. It is called<br />
an adiabatic invariant; a formal derivation can be fo<strong>und</strong> using the Hamiltonian<br />
formalism (see e. g. Landau and Lifschitz, 1981, vol. I),<br />
I = . 1 ∮<br />
pdq, (9.41)<br />
T
9.2. DEFINITION OF ADIABATIC INVARIANTS 143<br />
where the contour is over a complete period of the motion,T , and p and q are<br />
conjugate canonical coordinates. I can be considered as the area enclosed by<br />
the orbit of the system in phase space (p, q).<br />
In the following we will give adiabatic invariants for the motion of the guiding<br />
center in a weakly non-uniform field. There are three adiabatic invariants<br />
for this motion, the first is due to the gyromotion of the particle aro<strong>und</strong> the<br />
guiding center (Fig. 9.3), the second comes from a longer time scale, the bounce<br />
time scale sketched in Fig. 9.5 when there is such a scale, the third is due to<br />
the curvature drift and the time scale is the time it takes the particle to move<br />
once aro<strong>und</strong> the configuration, e. g. the Earth’s magnetic field, as sketched in<br />
Fig. 9.6. Adiabatic invariants can be fo<strong>und</strong> by considering quantities that<br />
would be conserved if the system were not changing at all, as we will see in<br />
the following three examples.<br />
Let us consider the adiabatic invariant for the motion of a particle in a<br />
weakly non-uniform magnetic field sketched in Fig. 9.3. The particle gyrates<br />
Figure 9.3: Motion of a particle in a weakly non-uniform magnetic field.<br />
aro<strong>und</strong> its guiding center, in a uniform field, the angular momentum of the particle<br />
would be a conserved quantity, and we insert it in place of the generalized<br />
momentum into eq. 9.41,<br />
I 1 = 1 ∮<br />
2π<br />
p sin αr c dϕ =<br />
(p sin α)2<br />
q B<br />
= p2 ⊥<br />
q B = (mγv ⊥) 2<br />
q B<br />
= mγ 2 |⃗µ|, (9.42)<br />
q<br />
where we have inserted the expression for the gyroradius and ⃗µ is the magnetic<br />
moment of the particle gyrating aro<strong>und</strong> the guiding-center field line. In this<br />
case, I is often called the first adiabatic invariant. It itself is a conserved<br />
quantity of the motion of the particle in the non-uniform field.<br />
This conservation has important consequences. Consider a particle approaching<br />
a magnetic mirror, sketched in Fig. 9.4. Then the conservation of<br />
the first adiabatic invariant will often lead to a reflection of the particle. This<br />
is easily seen. Because there is no electric field, the kinetic energy of the particle<br />
is conserved and composed of two parts, the parallel and perpendicular<br />
terms: E kin = 1/2mv‖ 2 + 1/2mv2 ⊥ = const. The second term is equal to µB.<br />
Because µ is conserved even with increasing B, the first term need to change
144 CHAPTER 9. THE EARTH’S PLASMA ENVIRONMENT<br />
appropriately to ensure energy conservation. This is achieved by converting all<br />
kinetic energy into gyration energy. When this happes, the particle does not<br />
propagate parallel to the field anymore, but the guiding center stands still for a<br />
brief moment, before the motion is reversed and the guiding center moves back<br />
along its previous trajectory, resulting in a net change of linear momentum,<br />
∆p = 2p. The strength of the field in the mirror as well as the pitch angle<br />
of the particle determine whether a partice will be reflected at the mirror or<br />
transmitted. Which particles are reflected? Let us consider a region where<br />
Figure 9.4: Magnetic mirror.<br />
the magnetic field strength is constant, ⃗ B = ⃗ B0, and the region in the mirror<br />
where the particle has no forward momentum anymore, ⃗ B = ⃗ B 1 . Because of<br />
the invariance of µ we have<br />
1<br />
2 mv2 ⊥0<br />
B 0<br />
and because of conservation of kinetic energy<br />
We rewrite eq. 9.43 and insert eq. 9.44<br />
= 1 2 mv2 ⊥1<br />
B 1<br />
(9.43)<br />
v 2 ⊥1 = v 2 ⊥0 + v 2 ‖0 = v 2 0. (9.44)<br />
1<br />
2 mv2 ⊥0<br />
B 0<br />
= 1 2 mv2 ⊥1<br />
B 1<br />
,<br />
B 0<br />
= v2 ⊥0<br />
,<br />
B 1<br />
v 2 ⊥1<br />
= v2 ⊥0<br />
v0<br />
2<br />
,<br />
= sin 2 α. (9.45)
9.2. DEFINITION OF ADIABATIC INVARIANTS 145<br />
If we could measure the pitch angles of all particles in the region where ⃗ B = ⃗ B 0 ,<br />
then those would be reflected by the mirror which have a pitch angle α > α m ,<br />
for which<br />
sin 2 α m = B 0<br />
B m<br />
. (9.46)<br />
If the magnetic field in the mirror changes with a frequency ω, then when<br />
ω approaches Ω, the induced electric field will be in phase with the particles<br />
and accelerate them, In this case, the concept of adiabatic invarinats breaks<br />
down, our assumption that chages are slow compared with typical time sclaes<br />
of the system is no longer valid. An example of this violation is the heating<br />
of a plasma by cyclotron waves such as in an electron cyclotron resonance ion<br />
source (ECR) or with ion-yclotron waves in the solar corona.<br />
Next let us consider the motion of the guiding center in a situation similar<br />
to that sketched in Fig. 9.5. The particle bounces back and forth between two<br />
Figure 9.5: Field configuration leading to the conservation of the second adiabatic<br />
invariant. The particle (guiding center) bounces back and forth between<br />
two magnetic mirrors.<br />
magnetic mirrors which only move slowly. Neglecting drifts, we can consider<br />
the motion of the guiding center only in a scalar magnetic field/potential – in<br />
this picture the kinetic energy of the guiding center is converted to potential<br />
energy when the particle is at rest at a position l m along the field line, where l<br />
measures the length along a field line. Then the relevant canonical momentum<br />
of the guiding center is P G‖ = mγV G‖ and the spatial coordinate is the length<br />
along the field line, dl . Hence<br />
∮<br />
∮<br />
I 2 = P G‖ dl = mγ V G‖ dl. (9.47)<br />
This quantity is called the second adiabatic invariant and is conserved during<br />
bounce motion.<br />
If the mirrors approach and retract fom eachother at a frequency ω which<br />
approaches Ω bounce then of course, our assumption of slow change breaks down<br />
and the second adiabatic invariant is not conserved. This situation arises in<br />
the process of transit-time pumping.<br />
The derivation of the third adiabatic invariant is somewhat more complicated.<br />
Consider particles bouncing back and forth between two mirrors in a
146 CHAPTER 9. THE EARTH’S PLASMA ENVIRONMENT<br />
nearly axially symmetric field configuration such as that sketched in Fig. 9.6.<br />
The bounce period T can be computed using<br />
Figure 9.6: Field configuration for leading to the conservation of the third<br />
adiabatic invariant. Note that it is not completely symmetric about the ”symmetry”<br />
axis (dash-dotted line), but nearly so. The bounce period between<br />
two mirrors T is much shorter than the time required for the particle to move<br />
aro<strong>und</strong> the symmetry axis.<br />
∫ l ∗<br />
m<br />
T = 2<br />
l m<br />
dl<br />
= 2 ∫ l ∗<br />
m<br />
V G‖ v l m<br />
dl<br />
〈cos α〉 τ<br />
, (9.48)<br />
where 〈cos α〉 τ, the gyroperiod-averaged pitch-angle cosine, is itself a function<br />
of l. l m and l ∗ m denote the mirror two points. We know, from our previous<br />
considerations of the motion in a magnetic mirror, that<br />
and hence<br />
T = 2 v<br />
sin 2 α =<br />
∫ l ∗<br />
m<br />
l m<br />
B<br />
B(l m ) , (9.49)<br />
√<br />
dl<br />
. (9.50)<br />
1 − B(l)<br />
B(l m)<br />
From Hamiltonian mechanics we know that when the Hamiltonian is independent<br />
of a certain coordinate q k or component thereof, then the conjugate<br />
momentum is a conserved quantity because<br />
dp k<br />
dt = −∂H ∂q k<br />
. (9.51)<br />
An axially symmetric field configuration is independent of the azimuth angle<br />
ϕ and hence P ϕ , the momentum along the azimuthal direction, is a conserved
9.2. DEFINITION OF ADIABATIC INVARIANTS 147<br />
quantity. In a configuration that is only nearly axially symmetric<br />
I 3 =<br />
∫<br />
1 2π<br />
dϕP Gϕ (9.52)<br />
T bounce 0<br />
is a conserved quantity and is, of course, called the third adiabatic invariant.<br />
P Gϕ can easily be derived using the Hamiltonian formalism. The Lagrangian<br />
of a charged particle in a given field configuration is given by<br />
L = q ( ⃗ A · ⃗v − φ<br />
)<br />
− mc<br />
2 √ 1 − v 2 /c 2 , (9.53)<br />
where ⃗ A is the vector potential ( ⃗ B = ⃗ ∇× ⃗ A) and φ is the scalar potential ( ⃗ E =<br />
∂ t<br />
⃗ A − ∇φ). In an axially symmetric (cylindrically symmetric) configuration,<br />
we have<br />
L = q ( A r˙[r] + Aϕ r ˙ϕ + A z z − φ ) − mc 2√ 1 − (ṙ 2 + r 2 ˙ϕ 2 + z 2 )/c 2 . (9.54)<br />
Now we know from Hamiltonian mechanics that<br />
P Gϕ = ∂L<br />
∂ ˙ϕ = qA ϕr + γmr 2 ˙ϕ. (9.55)<br />
Since this is a conserved quantity in the symmeric case, we may evaluate it at<br />
any convenient location, e. g. at the time t 0 when ˙ϕ(t 0 ) = 0. Then we have<br />
1<br />
2π I 3 = qr 0 A ϕ = q 1 ∮<br />
2π<br />
d⃗s ⃗ A, (9.56)<br />
where d⃗s = rdϕe ϕ and the contour integral is along a circle with radius r 0 . This<br />
is true because A ⃗ is independent of ϕ. Using Stoke’s theorem and B ⃗ = ∇ ⃗ × A ⃗<br />
we see that<br />
q 1 ∮<br />
2π<br />
d⃗s A ⃗ = q 1 ∫<br />
2π<br />
d⃗σ B ⃗ = q 1 Φ, (9.57)<br />
2π<br />
where Φ is the magnetic flux through the circle described by the guiding center<br />
aro<strong>und</strong> the “symmetry axis”. Φ will remain constant during the time needed<br />
for the particle to drift aro<strong>und</strong> the whole field configuration.<br />
The importance of the third adiabatic invariant is not as large as that of<br />
the two first ones because it is only conserved on very long time scales. In the<br />
Earth’s magentosphere hydromagnetic waves often destroy this nice property<br />
because they are in phase with some particles and can accelerate their drift<br />
motion.
148 CHAPTER 9. THE EARTH’S PLASMA ENVIRONMENT<br />
9.3 Particle Drifts<br />
9.4 Instabilities<br />
9.5 Plasma Waves in Extraterrestrial Plasmas<br />
9.6 Shock Formation<br />
9.7 Bo<strong>und</strong>ary Layers
149
150 CHAPTER 10. KINETIC PHYSICS<br />
Chapter 10<br />
Kinetic Physics<br />
10.1 Phase Space Density and Distribution Functions<br />
10.2 The Boltzmann Equation<br />
10.3 The Vlasov Equation<br />
10.3.1 Fokker-Planck<br />
10.4 Pitch-Angle Distributions<br />
10.5 Velocity Distributions Functions<br />
10.5.1 Ion VDFs<br />
10.5.2 Electron VDFs<br />
10.5.3 Coulomb Collisions<br />
10.5.4 Stability of VDFs<br />
10.5.5 Heating and Cooling<br />
10.6 Wave-Particle Interactions and Instabilities<br />
Gurnett
10.7. TURBULENCE AND HEATING 151<br />
10.7 Turbulence and Heating<br />
(MHD turbulence)<br />
ranges, Kolmogoroff, etc.
152 CHAPTER 10. KINETIC PHYSICS
Chapter 11<br />
Heliosphere<br />
11.1 The Inner Heliosphere<br />
11.1.1 linking the Corona to the Heliosphere<br />
11.1.2 The Magnetic Field<br />
11.1.3 The Frozen-in Interplanetary Magnetic Field<br />
Bisher haben wir in allen Betrachtungen das Magnetfeld der Sonne vernachlässigt.<br />
Dies ist eine grobe Vereinfachung, wie die folgende Abschätzung zeigt. Die<br />
thermische Energie des Sonnenwindes beträgt bei 1 AE ca.<br />
E therm = nkT ≈ 10 −11 J/m 3 , (11.1)<br />
was mit der magnetischen Feldenergie verglichen werden muss,<br />
E mag = B2<br />
2 µ 0<br />
≈ 10 −11 J/m 3 . (11.2)<br />
Die beiden Energiedichten sind etwa ähnlich gross, dies bedeutet, dass der<br />
Wert <strong>für</strong> das sogenannte Plasma β<br />
β = . P Gas<br />
= 2µ ( )<br />
0nkT<br />
≈<br />
c2<br />
, (11.3)<br />
P mag B 2<br />
v 2 Alfven<br />
in der Nähe der Erde um den Wert 1 liegt. Sehr nahe an der Sonne wird<br />
β sehr klein, d.h. das Magnetfeld dominiert die inhärenten Eigenschaften des<br />
Plasmas.<br />
Um das Verhalten des Plasmas <strong>und</strong> damit des Magnetfeldes im interplanetaren<br />
Raum beschreiben zu können, bedienen wir uns der sogenannten Magnetohydrodynamik<br />
(MHD). Diese beschreibt ein Plasma in der Näherung einer<br />
153
154 CHAPTER 11. HELIOSPHERE<br />
global elektrisch neutralen aber magnetisierten Flüssigkeit, in der zeitliche <strong>und</strong><br />
räumliche Störungen langsam bzw. gross sind im Vergleich zu den <strong>für</strong> das<br />
Plasma charakteristischen Grössen wie Plasma- oder Zyklotronfrequenz <strong>und</strong><br />
Debyeradius. Die Gr<strong>und</strong>gleichungen der MHD sind im Anhang ?? hergeleitet.<br />
Sie bestehen aus je einer Kontinuitätsgleichung <strong>für</strong> die Massendichte ρ <strong>und</strong> die<br />
Ladungsdichte ξ, einer Bewegungsgleichung, dem Ohm’schen Gesetz, sowie<br />
den Maxwellgleichungen. In der Regel kann in ihnen der Verschiebungsstrom<br />
1 ˙⃗E vernachlässigt werden. Wir verbinden das Ampére’sche <strong>und</strong> das Ohm’sche<br />
c 2<br />
Gesetz in dieser Näherung<br />
⃗J = 1 µ 0<br />
⃗ ∇ × ⃗ B = σ<br />
( ⃗E + ⃗v × ⃗ B<br />
)<br />
, (11.4)<br />
wo σ die elektrische Leitfähigkeit des Plasmas ist<br />
σ . = ne2<br />
m e<br />
τ c , (11.5)<br />
wo τ c die mittlere Kollisionszeit im Plasma ist. Wir bestimmen die Rotation<br />
von Glg. 11.4 <strong>und</strong> setzen aus dem Faraday’schen Gesetz<br />
ein,<br />
˙⃗B = − ⃗ ∇ × ⃗ E (11.6)<br />
˙⃗B = ⃗ ∇ × ⃗u × ⃗ B + 1<br />
µ 0 σ ∆ ⃗ B, (11.7)<br />
wobei wir ∇×∇×B = ∇(∇·B)−∆B = −∆B verwendet haben (“rot rot gleich<br />
grad div - Laplace”). Gleichung 11.7 ist die Induktionsgleichung der MHD. Ein<br />
Verständnis ihrer Struktur hilft uns, das Verhalten des interplanetaren Plasmas<br />
zu verstehen. Je nach Leitfähigkeit des Plasmas dominiert der eine oder der<br />
andere Term auf der rechten Seite. Für sehr schlechte (kleine) Leitfähigkeit<br />
oder bei sehr langsamen Bewegungen im Plasma, wird die Induktionsgleichung<br />
zu einer Diffusionsgleichung<br />
˙⃗B = 1<br />
µ 0 σ ∆ ⃗ B (11.8)<br />
weil dieser Term den Bewegungsterm in diesem Falle dominiert. Die Grösse<br />
1/µ 0 σ heisst magnetische Diffusivität. Wir können aus Glg. 11.8 eine Diffusionszeit<br />
abschätzen,<br />
⎡<br />
⎣ ∂ ⃗ B<br />
∂t<br />
⎤<br />
⎦ =<br />
⎡<br />
⎣ 1<br />
µ 0 σ<br />
wo L eine typische Längenskala ist.<br />
⎤<br />
∂ 2 B ⃗<br />
⎦ =⇒ τ<br />
∂r 2 diff = µ 0 σL 2 , (11.9)
11.1. THE INNER HELIOSPHERE 155<br />
Exercise 11.1 Schätzen Sie die Leitfähigkeit der Korona ab. Hinweis: Streuquerschnitt<br />
σ c via e 2 /r c = m e v 2 abschätzen <strong>und</strong> <strong>für</strong> v eine sinnvolle Grösse<br />
verwenden.<br />
Exercise 11.2 Bestimmen Sie die Stabilität gegen Diffusion von Sonnenflecken.<br />
L ∼ 10 7 m, T ∼ 10 4 K sind typische Werte <strong>für</strong> Sonnenflecken.<br />
Im Falle, dass die Leitfähigkeit sehr gross ist, oder die Bewegungen sehr<br />
schnell sind, kann der diffusive Term vernachlässigt werden.<br />
˙⃗B = ⃗ ∇ × ⃗u × ⃗ B. (11.10)<br />
Wie wir im Folgenden herleiten, bedeutet diese Gleichung, dass der magnetische<br />
Fluss durch eine im Plasma mitgeführte geschlossene Kurve konstant<br />
bleibt. In Abb. 11.1 ist die zu untersuchende Situation schematisch skizziert.<br />
d ⃗ S<br />
d ⃗ l<br />
⃗u<br />
⃗B<br />
S<br />
C<br />
Figure 11.1: Magnetischer Fluss durch die durch die geschlossene Kurve C<br />
aufgespannte Fläche S.<br />
Der durch die Fläche S durchtretende magnetische Fluss kann in zwei Weisen<br />
ändern, einerseits kann sich das in einer festen Kurve C eingeschlossene Feld<br />
⃗B ändern, oder die Kurve C bewegt sich relativ zum Feld ⃗ B. In der ersten<br />
Möglichkeit ist die änderung des Flusses in einem kleinen Flächenelement d ⃗ A<br />
gegeben durch<br />
˙⃗B · d ⃗ A (11.11)<br />
<strong>und</strong> die totale änderung ergibt sich durch Integration über die gesamte Fläche<br />
S. In der zweiten Möglichkeit bewegt sich also ein infinitesimales Element der<br />
Kurve d ⃗ l relativ zu ⃗ B. Die änderung des eingeschlossenen Feldes ist dann<br />
⃗B · (⃗u × d ⃗ l ) (11.12)
156 CHAPTER 11. HELIOSPHERE<br />
<strong>und</strong> die totale änderung ergibt sich durch Konturintegration entlang C. Wir<br />
verwenden die Vektoridentität A · (B × C) = (A × B) · C um Glg. 11.12<br />
umzuformen <strong>und</strong> schreiben die gesamte Änderung des Flusses durch die durch<br />
die Kurve C aufgespannte Fläche S<br />
∫<br />
d<br />
dA dt<br />
⃗ · ⃗B<br />
∫<br />
= dA ⃗ · ∂ B ⃗<br />
S<br />
S ∂t<br />
∮C<br />
− d ⃗ l · (⃗u × B ⃗ ) . (11.13)<br />
Das Konturintegral formen wir mit Hilfe des Gesetzes von Stokes in ein Flächenintegral<br />
um<br />
∮<br />
d ⃗ l · (⃗u × B ⃗ ) ∫<br />
= dA ⃗ ∇ ⃗ × ( ⃗u × B ⃗ ) . (11.14)<br />
C<br />
S<br />
Im Integranden steht nun genau die rechte Seite der Induktionsgleichung <strong>für</strong><br />
den Fall unendlich guter Leitfähigkeit des Plasmas, was heisst, dass<br />
⎛<br />
∫<br />
d<br />
dA dt<br />
⃗ · ⃗B<br />
∫<br />
= dA ⃗ · ⎝ ∂ B ⃗<br />
S<br />
S ∂t − ∇ ⃗ × ( ⃗u × B ⃗ )⎞ ⎠ = 0, (11.15)<br />
womit die eingangs aufgestellte Behauptung, dass sich der Fluss durch die<br />
Kurve C nicht verändert, bewiesen ist. <strong>Physik</strong>alisch bedeutet dies, dass sich<br />
das Magnetfeld mit dem Plasma bewegt, was salopp oft ausgedrückt wird als<br />
die Approximation der “eingefrorenen” Feldlinien. Für σ → ∞ ist also das<br />
Magnetfeld im Plasma eingefroren, <strong>und</strong> es fliesst passiv mit. Diese Näherung<br />
heisst auch “ideale” MHD. Der Übergang zwischen einem diffusiven <strong>und</strong> einem<br />
eingefrorenen Magnetfeld lässt sich parametrisieren durch das Verhältnis der<br />
Diffusionszeit τ d zur Konvektionszeit τ u . Wir haben<br />
τ d = µ 0 σL 2 ,<br />
τ u = L u<br />
(11.16)<br />
<strong>und</strong> definieren damit die magnetische Reynoldszahl R M<br />
R M<br />
. τ d = = µ 0σL 2 u<br />
τ u L<br />
= µ 0 σLu. (11.17)<br />
Ist R M gross, so gilt die Näherung der eingefrorenen Feldlinien, ist R M klein,<br />
so diff<strong>und</strong>iert das Magnetfeld. Im interplanetaren Medium, wie in der Chromosphäre<br />
<strong>und</strong> Korona ist R M gross.<br />
Exercise 11.3 Schätzen Sie R M <strong>für</strong> Chromosphäre, Korona <strong>und</strong> IPM ab <strong>und</strong><br />
vervollständigen Sie Tabelle 11.1.<br />
Wir sind nun in der Lage, das Verhalten des Magnetfeldes im interplanetaren<br />
Medium zu bestimmen. Weil die Feldlinien hier in guter Näherung<br />
eingefroren sind, muss es sich wie eine archimedische Spirale um die Sonne
11.1. THE INNER HELIOSPHERE 157<br />
T u L R M<br />
Chromosphäre 10 4 K 10 km/s 10 4 km<br />
Korona 10 6 K 500 km/s 10 4 km<br />
IPM 10 5 K 500 km/s 10 7 km<br />
Table 11.1: Typische Grössen <strong>für</strong> Chromosphäre, Korona <strong>und</strong> IPM.<br />
wickeln. Das Sonnenwindplasma trägt das Magnetfeld mit sich radial von der<br />
Sonne weg. Weil sich die Sonne um sich selber dreht, tritt der “Rasensprengereffekt”<br />
auf. In einem mit der Sonne rotierenden Bezugssystem lauten die<br />
Geschindigkeitskomponenten des Sonnenwindes in Kugelkoordinaten<br />
u r = u, (11.18)<br />
u φ = −ω sin θ, (11.19)<br />
u θ = 0, (11.20)<br />
wo ω = 2.7 × 10 −6 Radian pro Sek<strong>und</strong>e die Winkelgeschwindigkeit der Sonnenrotation<br />
<strong>und</strong> θ vom Nordpol her gemessen ist. u φ ist ausschliesslich darauf<br />
zurückzuführen, dass wir uns in ein mitrotierendes System versetzt haben. In<br />
einem ortsfesten System fliesst der Sonnenwind radial von der Sonne weg. Im<br />
mitrotierenden System erhält der Sonnenwind eine nicht-radiale Geschwindigkeitskomponente<br />
u φ . Der Winkel zwischen einer eingrefrorenen <strong>und</strong> mitbewegten<br />
Magnetfeld <strong>und</strong> der Radialen beträgt nach der Skizze in Abb. 11.2<br />
cos (Φ) =<br />
1<br />
1 + ( ωr sin θ<br />
u<br />
) 2<br />
. (11.21)<br />
u φ kann auch geschrieben werden als rdφ/dt <strong>und</strong> damit lässt sich eine Differentialgleichung<br />
<strong>für</strong> die Bewegung des Magnetfeldes aufstellen<br />
1<br />
r<br />
dr<br />
dφ = u r<br />
u φ<br />
=<br />
u<br />
, θ = const. (11.22)<br />
−ωr sin θ<br />
Für grosse Abstände von der Sonne r ≫ r c ist die Geschwindigkeit des Sonnenwindes<br />
nahezu konstant <strong>und</strong> wir können dort in guter Näherung u(r) = u<br />
konstant setzen. Damit wird Glg. 11.22 leicht integrierbar <strong>und</strong> ergibt die explizite<br />
Form der Feldlinien<br />
r − r 0 =<br />
−u<br />
ω sin θ (φ − φ 0) , (11.23)<br />
wo φ 0 die Anfangsposition bei r 0 ist. Die entstehende Magnetfeldkonfiguration<br />
im interplanetaren Medium ist in Abb. 11.3 wiedergegeben 1 . Bei einer kleinen<br />
1 Die Spiralkonfiguration heisst Parkerspirale, nach dem ersten Amerikaner, der sie<br />
berechnet hat, E. Parker. Archimedes war wohl schon zu alt.
158 CHAPTER 11. HELIOSPHERE<br />
ωr<br />
u<br />
Φ<br />
Richtung des<br />
Magnetfeldes<br />
r<br />
Sonne<br />
Figure 11.2: Die Orientierung des interplanetaren Magnetfeldes in der Ekliptik.<br />
Geschwindigkeit werden die Feldlinien stärker aufgewickelt, wie ein Vergleich<br />
der gestrichelten mit den durchgezogenen Linien zeigt. Weil die Feldlinien mit<br />
dem Plasma mitfliessen, erfährt dieses auch keine Lorentzkraft. Die einzelnen<br />
Teilchen im Plasma fühlen nur Kräfte, welche auf ihre thermische Bewegung<br />
im Plasma zurückzuführen sind. Teilchenpopulationen, welche sich relativ<br />
zum Sonnenwind bewegen, spüren aber das an ihnen vorbeikonvektierte Magnetfeld.<br />
Dies ist <strong>für</strong> Transportprozesse in der Heliosphäre von gr<strong>und</strong>legender<br />
Bedeutung.<br />
Wir können nun die einzelnen Komponenten des Magnetfeldes berechnen.<br />
In Kugelkoordinaten geschrieben lautet die Quellenfreiheit des Magnetfeldes<br />
⃗∇ · ⃗B = 1 ∂ ( )<br />
r 2 1<br />
B<br />
r 2 r +<br />
∂r r sin θ<br />
∂<br />
∂θ (sin θB θ) + 1<br />
r sin θ<br />
∂<br />
∂φ B φ = 0. (11.24)<br />
In der Approximation der eingefrorenen Feldlinien ist nach Abb. 11.2<br />
B φ<br />
= u φ ωr sin θ<br />
= − . (11.25)<br />
B r u r u<br />
Damit kann B φ durch B r ausgedrückt werden <strong>und</strong> wegen der Axialsymmetrie<br />
muss ferner auch<br />
∂B r<br />
∂φ = 0 (11.26)<br />
gelten. B θ ist wegen u θ = 0 gleich Null. Damit vereinfacht sich Glg. 11.24 zu<br />
⃗∇ · ⃗B = 1 ∂ ( )<br />
r 2 B<br />
r 2 r = 0 (11.27)<br />
∂r
11.1. THE INNER HELIOSPHERE 159<br />
Figure 11.3: Spiralkonfiguration des interplanetaren Magnetfeldes.<br />
<strong>und</strong> folglich muss B r ∼ 1/r 2 sein. Wir führen die Referenzgrösse B 0<br />
. =<br />
B r (r 0 , φ 0 ) ein. Damit lauten die Komponenten des interplanetaren Magnetfeldes<br />
( ) r0 2<br />
B r = −B 0 ,<br />
r<br />
(11.28)<br />
B θ = 0, (11.29)<br />
ωr0 2 sin θ<br />
B φ = −B 0 .<br />
u r<br />
(11.30)<br />
Wie aus Glg. 11.28 <strong>und</strong> 11.30 ersichtlich, muss die radiale Abhängigkeit des<br />
gesamten Betrags des Magnetfeldes nicht wie 1/r 2 abnehmen, sondern muss<br />
noch einen Term 1/r enthalten. Dieser Beitrag stammt von der immer mehr<br />
zunehmenden Aufwicklung des Magnetfeldes. Das Verhalten von |B(r)| ist in<br />
Abb. 11.4 dargestellt. Dieses Verhalten speilt <strong>für</strong> die Ausbreitung von Plasmawellen<br />
im interplanetaren Medium eine wesentliche Rolle, weil es bedeutet,<br />
dass die Schallgeschwindigkeit <strong>und</strong> die Alfvéngeschwindigkeit nicht dieselbe<br />
radiale Abhaängigkeit haben.<br />
Die Struktur des interplanetaren Magnetfeldes wird bestimmt durch die<br />
Ausbreitungseigenschaften des Sonnenwindes <strong>und</strong> durch die Anfangsbedingungen<br />
auf der Sonne. Während des Aktivitätsminimums der Sonne gleicht die<br />
magnetische Konfiguration der eines Dipols, allerdings verfälscht durch die Expansion<br />
des Sonnenwindes. Abbildung 11.5 zeigt eine mögliche Konfiguration.<br />
Ein grosses koronales Loch bedeckt Nord <strong>und</strong> Südpol. Koronale Löcher sind<br />
Gebiete mit niedriger Elektronendichte, welche auf Weisslichtaufnahmen als
160 CHAPTER 11. HELIOSPHERE<br />
Figure 11.4: Radiale Abhängigkeit des Gesamtbetrages des interplanetaren<br />
Magnetfeldes.<br />
dunkle (wenig belichtete) Gebiete erscheinen, weil die niedrige Elektronedichte<br />
weniger photosphärisches Licht streut als dichtere Gebiete. Koronale Löcher<br />
sind Gebiete mit unipolarem Magnetfeld, welches durch die Expansion des<br />
Sonnenwindes geöffnet ist, d.h. die Feldlinien sind nicht mehr mit der Sonnenoberfläche<br />
verb<strong>und</strong>en, sondern irgendwo mit dem interstellaren Medium.<br />
Natürlich muss nach Maxwell ⃗ ∇ · ⃗B = 0 sein, dies bedeutet lediglich, dass<br />
gleich viele positiver, wie negativer Fluss die Quellfläche verlassen muss. Als<br />
Quellfläche (source surface) wird im allgemeinen eine Fläche bei 2.5 r ⊙ verwendet,<br />
welche das Resultat von physikalischen Extrapolationsmodellen des photosphärischen<br />
Magnetfeldes sind. Während des Sonnenaktivitätsminimums erscheint<br />
das solare Magnetfeld global mit einer dominanten Dipolkomponente.<br />
Dessen Symmetrieachse ist um ca. 7 Grad gegenüber der Rotationsachse der<br />
Sonne geneigt 2 . Diese Neigung führt zusammen mit der Rotation der Sonne<br />
2 Es ist nicht unmöglich, dass diese Neigung (also ein Symmetriebruch) <strong>für</strong> die Existenz<br />
des solaren Magnetfeldes notwendig ist. Nach dem sog. Satz von Cowling existiert kein<br />
axialsymmetrischer Dynamo, welcher das solare Magnetfeld treiben könnte.
11.1. THE INNER HELIOSPHERE 161<br />
Figure 11.5: Struktur des solaren Magnetfeldes während des solaren Aktivitätsminimums.<br />
<strong>und</strong> er Expansion des Sonnenwindes zu einer Ausbildung einer Sektorstruktur<br />
des interplanetaren Magnetfeldes. In der Ekliptik erscheint die Polarität des<br />
IMF abwechslungsweise positiv <strong>und</strong> negativ. Ein Wechsel zwischen den beiden<br />
Polaritäten erfolgt in der in Abb. 11.5 skizzierten Konfiguration einmal pro<br />
Umdrehung der Sonne. Die Region zwischen den gut ausgebildeten unipolaren<br />
koronalen Löchern besteht hauptsächlich aus geschlossenen Feldlinien. Hier ist<br />
die Expansionsgeschwindigkeit des Sonnenwindes zu klein, um die Feldlinien<br />
über den kritischen (Alfvén-)radius hinaus zu ziehen. Aus diesen Gebieten entweicht<br />
kein Sonnenwind weil die kritische Geschwindigkeit kleiner ist als die<br />
Entweichgeschwindigkeit der Sonne, was zu einer hohen Dichte (bis zu 100 Mal<br />
dichter als in koronalen Löchern) führt. Der Sonnenwind strömt hier entlang<br />
der Grenzen zwischen den offenen <strong>und</strong> geschlossenen Feldlinien ins interplanetare<br />
Medium. Damit muss diese grossräumig in zwei unipolare Hälften geteilt<br />
sein, welche durch eine Stromschicht, der heliosphärischen Stromschicht (heliospheric<br />
current sheet) getrennt sind. Die heliosphärische Stromschicht ze-<br />
⃗B<br />
⃗I<br />
⃗B<br />
Figure 11.6: Die heliosphärische Stromschicht trennt Gebiete verschiedener<br />
magnetischer Polarität.
162 CHAPTER 11. HELIOSPHERE<br />
ichnet sich durch mehrere ungewöhnliche Eigenschaften aus, welche erstmals<br />
von Borrini et al. (1981) <strong>und</strong> Gosling et al. (1981) beschrieben worden sind:<br />
• erhöhte Dichte,<br />
• besonders langsamen <strong>und</strong> kalten Sonnenwind,<br />
• Verschwinden der differentiellen Strömung,<br />
• Angleichung der kinetischen Temperaturen von Protonen <strong>und</strong> Alphateilchen,<br />
• Abnahme der Heliumhäufigkeit,<br />
• besonders heisses koronales Plasma (hohe Einfriertemperaturen),<br />
• etc.<br />
Die erhöhte Dichte, das Verschwinden der sonst beobachteten differentiellen<br />
Strömung zwischen Protonen <strong>und</strong> α-Teilchen <strong>und</strong> die Angleichung ihrer Temperaturen<br />
sind alle miteinander verb<strong>und</strong>en, die erhöhte Dichte resultiert in<br />
einer erhöhten Stossfrequenz <strong>und</strong> folglich ist das Plasma näher dem thermodynamischen<br />
Gleichgewicht, in welchem alle Temperaturen <strong>und</strong> Geschwindigkeiten<br />
gleich sind. Die Abnahme der Heliumhäufigkeit kann erklärt werden durch<br />
gravitative Schichtung der Streamer 3 oder durch einen ungenügend hohen Sonnenwindfluss,<br />
der die Heliumkerne nicht mehr aus der Korona herauszuziehen<br />
vermag. In detaillierten Modellen des Ursprungs des langsamen Sonnenwindes<br />
speilt die Reibung zwischen protonen <strong>und</strong> schwereren Ionen während der Beschleunigung<br />
eine nicht unwesentliche Rolle. Durch Stösse mit Protonen können<br />
schwerere Ionen einen Impulsgewinn erhalten, der mithilft, sie aus der Korona<br />
zu beschleunigen. In gewissen Situationen ist diese Reibungskraft nicht<br />
besonders effizient, die Kopplung der Geschwindigkeiten der schweren Ionen<br />
<strong>und</strong> Protonen ist dann nicht mehr gewährleistet. Dies scheint in grossen polaren<br />
koronalen Löchern, wie auch in streamern der Fall zu sein. Messungen<br />
von schweren Ionen (hier schwerer als Helium) können dies erhärten.<br />
Weil diese alle einen ggrösseren Streuquerschnitt mit protonen haben, als<br />
α-Teilchen, sind sie besser ans Protonengas gekoppelt tendieren eher dazu,<br />
dieselbe Geschwindigkeit aufzuweisen. Weil sie aber wesentlich schwerer sind,<br />
als α-Teilchen, wirkt die Gravitation um so stärker auf sie. Damit braucht<br />
lediglich z.B. das Verhältnis He/O bestimmt zu werden, um herauszufinden, ob<br />
der Sonnenwind in der Nähe von Sektorgrenzen, also aus streamern stammend,<br />
aufgrud der Gravitation oder von ungenügendem Protonenfluss eine geringe<br />
3 Dies ist der englische Ausdruck <strong>für</strong> die hellen Gebiete in Koronagraphenaufnahmen der<br />
Korona. Diese Gebiete zeichnen sich durch erhöhte Elektronendichte aus, daher der erhöhte<br />
Kontrast.
11.1. THE INNER HELIOSPHERE 163<br />
Heliumhäufigkeit aufweist. Beobachtungen zeigen, dass selbst He/O an Sektorgrenzen<br />
abnehmen, was darauf hindeutet, dass die Heliumhäufigkeit alleine<br />
abgereichert ist <strong>und</strong> also die Ursprungsregion des langsamen Sonnenwindes<br />
nicht gravitativ geschichtet ist. Weil streamer in der Regel im hydrostatischen<br />
Gleichgewicht zu stehen scheinen, <strong>und</strong> in diesem eine gravitative Schichtung<br />
zu erwarten ist, impliziert die wenig veränderte Sauerstoffhäufigkeit, dass der<br />
Sonnenwind entlang der Ränder von Streamern entspringt. Die gravitative<br />
Schichtung von Streamern ist durch UVCS Messungen bestätigt worden.<br />
In der einfachsten Konfiguration des IMF trennt die heliosphärische Stromschicht<br />
zwei Hemisphären unterschiedlicher Polarität <strong>und</strong> damit wird durch<br />
Raumsonden in der Ekliptik eine zwei-Sektor-Struktur gemessen. Ist die Grenze<br />
der polaren koronalen Löcher komplizierter strukturiert, führt dies zu einer<br />
komplizierteren Struktur des IMF. In der Regel werden vier oder mehr magnetische<br />
Sektoren pro Umdrehung der Sonne gemessen. Abbildung 11.7 zeigt<br />
ein solches Beispiel.<br />
Figure 11.7: Ballerina Modell der heliosphärischen Stromschicht.<br />
11.1.4 Properties of the Solar Wind<br />
• high-speed streams
164 CHAPTER 11. HELIOSPHERE<br />
• highly variable slow wind<br />
• transient coronal mass ejections<br />
• composition<br />
11.1.5 Magnetic Sector Structure<br />
Ballerina, sector bo<strong>und</strong>aries<br />
11.1.6 Stream Structure<br />
stream interfaces<br />
11.1.7 SEP propagation<br />
11.2 Interplanetary Dust<br />
11.2.1 Poynting-Robertson<br />
11.2.2 Mie-Scattering<br />
11.2.3 Dust Dynamics and Origin<br />
Neben Photonen, Magnetfeld <strong>und</strong> Ionen <strong>und</strong> Elektronen, tragen auch makroskopische<br />
Staubteilchen zum interplanetaren Medium bei. Diese haben ihren Ursprung<br />
in Asteroiden, Kometen <strong>und</strong> im interstellaren Raum. Erste Hinweise<br />
darauf finden sich schon in Berichten von Cassini (1683 <strong>und</strong> 1693!) über seine<br />
Beobachtungen des Zodiakallichts. Eine nach heutiger Sicht korrekte Interpretation<br />
dieser Beobachtungen stammt von seinem Schüler Noccolo Fatio de<br />
Duiliiers um 1684. Leider ist es heute unwahrscheinlich, dass solche Beobachtungen<br />
wieder in der Nähe von grossen Städten (Paris <strong>und</strong> Genf) gemacht<br />
würden, das Streulicht aus den grossen Agglomerationen ist wesentlich stärker,<br />
als das Zodiakallicht. Weitere historische Berichte sind in Fechtig et al. (2001)<br />
diskutiert.<br />
Heute wird das Licht der F-Korona interpretiert als photosphärisches Licht,<br />
welches an interplanetaren Staubteilchen zum Beobachtier hin reflektiert wird.<br />
Abildung 11.8 zeigt eine Aufnahme einse IDP. Das daran gestreute Licht ist<br />
grösstenteils unpolarisiert <strong>und</strong> wegen der geringen stochastischen Geschwindigkeiten<br />
der Staubteilchen erscheinen die photosphärischen Fraunhoferlinien deutlich<br />
in Spektren der F-Korona. Insbesondere aus der Intensität der (thermischen)<br />
T-Korona lässt sich auf die Häufigkeit der reflektierenden Staubteilchen
11.2. INTERPLANETARY DUST 165<br />
Figure 11.8: Interplanetare Staubteilchen<br />
schliessen. Nach grosser Kontroverse in den 60-er Jahren hat sich die Staubgemeinschaft<br />
nun auf eine, allenfalls zwei, kanonische Flussverteilung(en) geeinigt<br />
zu haben. Abbildung 11.9 zeigt die heute gebräuchliche kumulative Verteilung<br />
des Flusses oder der Teilchendichte von Grün et al. (1985). Die kumulative<br />
Dichteverteilung gibt an, wieviele Teilchen schwerer als die Masse m in einem<br />
m 3 gemessen werden. Grob scheint das Verhalten der Kurve durch ein Potenzgesetz<br />
gut beschrieben zu werden. Die ist die Konsequenz von Kollisionen,<br />
welche grosse Staubteilchen in viele kleine Staubteilchen verwandeln. Die mittlere<br />
freie Weglänge <strong>für</strong> Staubteilchen ist zwar sehr lang, diese legen aber<br />
während ihres Daseins in der Heliosphäre auch eine sehr weiten Weg zurück.<br />
In erster Näherung bewegen sie sich auf Keplerbahnen durch das Sonnensystem<br />
<strong>und</strong> können so höchstens durch Stösse oder Dreikörperbegegnungen ihre
166 CHAPTER 11. HELIOSPHERE<br />
Figure 11.9: Massenverteilungen nach Grün et al. (1985).<br />
Bahn ändern. Die Energie der Bahn ist gegeben durch<br />
E<br />
m = v2<br />
r − G M R = G M<br />
2 a − R p<br />
, (11.31)<br />
wo a die grosse Halbachse <strong>und</strong> R p = a(1 − e) das Perihel der Bahn sind. Bei<br />
kleinen Staubteilchen, welche dieselbe Grössenordnung wie die Wellenlänge von<br />
Licht haben, kommt aber eine weitere Kraft dazu. Das IDP fühlt den durch<br />
das auffallende Licht erzeugten Druck, was in einer Reduktion der verspürten<br />
Zentralkraft, der Gravitation, mündet.<br />
G M −→ (1 − β)G M.<br />
Die durch das Licht auf ein ruhendes Teilchen ausgeübte Druckkraft ist gegeben<br />
durch<br />
F r = S A<br />
c , (11.32)<br />
wo S der Poyntingfluss, A der Wirkungsquerschnitt (ungefähr die Querschnittsfläche)<br />
<strong>und</strong> c die Lichtgeschwindigkeit ist. Trifft nun ein Meteor auf einen Asteroiden
11.2. INTERPLANETARY DUST 167<br />
<strong>und</strong> erzeugt dort feine Staubteilchen, oder verlässt ein Staubteilchen einen<br />
Kometen, so hat es zwar ungefähr dieselbe Geschwindigkeit v(R), wie der Mutterkörper,<br />
fühlt aber sofort die verringerte Gravitation, was zu einer Änderung<br />
der Bahn führt. Je nach Exzentrität der Bahn des Muttrerkörpers, kann dies<br />
dazu führesn, dass das Staubteilchen das Sonnensystem auf einer hyperbolischen<br />
Bahn verlässt. Wir betrachten den Extremfall, in dem ein Staubteilchen<br />
einen der zahlreichen SOHO-Kometen nahe seines Perihels verlässt. Diese<br />
Kometen fliegen auf hochelliptischen Bahnen in die unmittelbare Nähe der<br />
Sonne, wo sie verglühen. In diesem Fall verlässt das Staubteilchen das Sonnensystem<br />
fast immer. Seine Bahn kann durch den Winkel φ parametrisiert<br />
werden,<br />
a(1 − e)<br />
R =<br />
1 + e cos φ . (11.33)<br />
Für eine elliptische (oder parabolische) Bahn haben wir<br />
was jetzt wegen β ≠ 0 ändert,<br />
v 2 (R p ) = G M a<br />
1 − e<br />
1 + e , (11.34)<br />
G M<br />
2 a<br />
v 2<br />
2 − (1 − β)G M R<br />
1 + e<br />
1 − e − (1 − β) G M<br />
a(1 − e)<br />
1 + e<br />
2<br />
= E m ,<br />
= E m ,<br />
− (1 − β) = E/m a(1 − e). (11.35)<br />
G M<br />
Für eine geb<strong>und</strong>ene Bahn muss die Bahnenergie E/m negativ sein, was eine<br />
obere Grenze <strong>für</strong> β setzt<br />
1 + e<br />
2<br />
− (1 − β) ≤ 0<br />
e − 1<br />
2<br />
+ β ≤ 0<br />
β ≤ 1 − e<br />
2 . (11.36)<br />
Die Bahnen der SOHO-Kometen sind hochelliptisch, also e ≈ 1 <strong>und</strong> damit sind<br />
fast alle emittierten Staubteilchen ungeb<strong>und</strong>en. Andere Mutterkörper haben<br />
natürlich andere Exzentritäten <strong>und</strong> damit ändert sich auch die Emission des<br />
Staubes. Abbildung 11.10 zeigt <strong>für</strong> verschiedene Exzentritäten diejenigen β,<br />
<strong>für</strong> welche ein Teilchen noch gerade auf einer geb<strong>und</strong>enen Bahn bleiben, wenn<br />
sie in einem Bahnwinkel φ ihren Mutterkörper verlassen.
168 CHAPTER 11. HELIOSPHERE<br />
Figure 11.10: Maximale Werte von β damit ein Teilchen, welches bei φ den<br />
Mutterkörper verlässt noch auf einer geb<strong>und</strong>enen Bahn im Sonnensystem<br />
bleibt.<br />
Wechselwirkung von IDPs mit Licht<br />
Wir zeigen im folgenden, wie β berechnet wird. Licht wird am Teilchen<br />
gestreut <strong>und</strong> übt auf dieses eine Druck aus. Für den Fall einer Kugel kann<br />
dies exakt berechnet werden <strong>und</strong> heisst in diesem Fall Mie Streutheorie. Um<br />
das Vorgehen etwas klarer zu gestalten, erinnern wir an einige Resultate der<br />
Theorie der Streuung von Licht (<strong>und</strong> Teilchen). Ein Körper kann Licht streuen<br />
<strong>und</strong> absorbieren. Abbildung 11.11 zeigt die wesentlichen Grössen. Das<br />
Licht, das in das Raumwinkelelement sin θdθdφ um die Richtung (θ, φ) gestreut<br />
wird, ist durch eine Fläche, welche um den Stossparameter b von der Symmetrieachse<br />
verschoben ist in das System eingetreten. Diese Fläche ist gleich<br />
dem Streuquerschnitt C λ (θ, φ) <strong>für</strong> die Richtung (θ, φ) <strong>und</strong> Wellenlänge λ.
11.2. INTERPLANETARY DUST 169<br />
Die gesamte Menge gestreutes Licht der Wellenlänge λ erhält man durch Integration<br />
über θ <strong>und</strong> φ, was den totalen Streuquerschnitt C scat (λ) definiert.<br />
Ähnlich kann ein Wirkungsquerschnitt <strong>für</strong> das absorbierte Licht definiert werden,<br />
C abs . Damit ist auch derWirkungsquerschnitt <strong>für</strong> die Extinktion definiert,<br />
.<br />
C ext = Cscat + C abs . Die Extinktion ist also nicht gleich der Menge des absorbierten<br />
Lichtes. Zur Berechnung der Streuung von Licht an Kugeln be-<br />
b<br />
φ<br />
θ<br />
2s<br />
Figure 11.11: Streugeometrie<br />
liebiger Grösse nähern wir das Licht durch ebene Wellen <strong>und</strong> beschreiben dann<br />
die Streuung durch eine Kugel:<br />
• Beschreibung von Licht urch ebene Wellen<br />
⃗E = ⃗ E 0 exp(i ⃗ k · ⃗x − i ω t),<br />
<strong>und</strong><br />
⃗B = ⃗ B 0 exp(i ⃗ k · ⃗x − i ω t).<br />
Der Wellenvektor ⃗ k kann eine komplexe Grösse sein, ⃗ k = ⃗ k ′ + i ⃗ k ′′ .<br />
• Wegen ⃗ E ⊥ ⃗ B ist ⃗ k · ⃗k = ω 2 εµ.<br />
• Materialeigenschaften stecken alle im Brechungsindex N = n + i k =<br />
c √ εµ<br />
• Entwickle ebene Wellen in Kugelfunktionen (weil wir ja die Streuung<br />
durch eine Kugel betrachten).<br />
• Dies führt zu langen Ausdrücken, die wir hier nicht wiedergeben. . .
170 CHAPTER 11. HELIOSPHERE<br />
• Damit kann das gestreute <strong>und</strong> absorbierte Feld exakt berechnet werden<br />
<strong>und</strong> damit auch C scat , C abs <strong>und</strong> C ext<br />
• Q scat , C abs <strong>und</strong> Q ext geben die Effizienz der Streuung <strong>und</strong> Extinktion,<br />
Q = C/A, wo A die geometrische Querschnittsfläche ist.<br />
• Wegen der Rekursionseigenschaften von Besselfunktionen können Q scat ,<br />
Q abs <strong>und</strong> Q abs durch erstaunlich einfache Rekursionsbeziehungen berechnet<br />
werden.<br />
• Materialeigenschaften fliessen durch den Brechungsindex N = N(λ) ein.<br />
Auf diese Weise können Q scat (λ), C abs (λ) <strong>und</strong> Q ext (λ) <strong>für</strong> eine Kugel mit<br />
Radius s berechnet werden. Bohren and Huffman (1983) geben einen besonders<br />
effizienten Algorithmus zur Berechnung, sowie ein FORTRAN-Programm<br />
<strong>für</strong> die numerische Berechnung der Wirkungsquerschnitte. Abbildung 11.12<br />
zeigt das Verhalten von Q scat (λ) in einer Darstellung, die auch die Grösse der<br />
Teilchen integriert, indem die unabhängige Variable 2πs/λ gewählt wird.<br />
Figure 11.12: Streueffizienz Q scat (λ) <strong>für</strong> Kugeln mit Radius s.
11.2. INTERPLANETARY DUST 171<br />
Die durch das Licht auf das Teilchen ausgeübte Druckkraft setzt sich einerseits<br />
durch das absorbierte Licht, aber auch dem Impulsübertrag aus dem<br />
gestreuten Licht zusammen. Der Ausdruck <strong>für</strong> den Wirkungsquerschnitt Q pr<br />
lautet<br />
Q pr<br />
. = Qabs + Q scat (1 − 〈cos θ〉) . (11.37)<br />
Die Klammer enthält einen Erwartungswert über den Kosinus des Streuwinkels.<br />
Dieser muss ebenfalls mittels Mie-Theorie ermittelt werden. Der Ausdruck<br />
kann aber auch ohne komplizierte Rechnungen verstanden werden. Ist der<br />
Körper ein perfekter Absorber, so streut er kein Licht, Q scat = 0, <strong>und</strong> damit ist<br />
Q pr = Q abs . Man kann auch sagen, der Körper macht perfekte Vorwärtsstreuung.<br />
Streut der Körper isotrop, so ist der Erwartungswert <strong>für</strong> den Kosinus des<br />
Streuwinkels gleich Null, <strong>und</strong> wir haben Q pr = Q abs + Q scat . Streut der Körper<br />
nur nach hinten, wie ein planer Spiegel, ist also ein perfekter Rückwärtsstreuer,<br />
so erhält er mit jedem rückwärts gestreuten Photon den doppelten Impuls, also<br />
haben wir in diesem Fall Q pr = Q abs + 2Q scat .<br />
Für sehr kleine Teilchen wird oft die sogenannte Rayleigh-Gans Theorie<br />
verwendet. Sie gilt <strong>für</strong> |N − 1| ≪ 1 <strong>und</strong> k s |N − 1| ≪ 1. In diesem Fall kann<br />
man <strong>für</strong> Q scat einen einfachen analytischen Ausdruck angeben<br />
Q scat = 128π4 s 4 ( N 2 ) 2<br />
− 1<br />
. (11.38)<br />
3λ 4 N 2 + 2<br />
Dieser Ausdruck wird oft verwendet, um den Strahlungsdruck auf sehr kleine<br />
Teilchen zudiskutieren. Dies ist insofern problematisch, dass N eine starke<br />
Funktion der Wellenlänge sein kann <strong>und</strong> oft nicht wesentlich kleiner als 1 ist,<br />
wie Abb. 11.13 zeigt. Darum sollte die Rayleigh-Gans Theorie nur wohlüberlegt<br />
angewendet werden, <strong>und</strong> insbesondere nicht verwendet werden, um aus dem<br />
Zodiakallicht auf die Grössenverteilung der IDPs zu schliessen.<br />
Um das effektive β, also die mit der Gravitation normierte Druckkraft <strong>für</strong><br />
ein Teilchen zu erhalten, muss Q pr über das Sonnenspektrum integriert werden.<br />
〈Q pr 〉 =<br />
∫ ∞<br />
0<br />
dλ Q pr F ⊙ (λ) (11.39)<br />
Die Integration über das Sonnenspektrum ergibt dann die gesuchte Grösse β.<br />
Diese ist gegeben durch das Verhältnis von Lichtdruckkraft durch Gravitation,<br />
Wit dividieren also die Druckkraft<br />
β . = F r<br />
F G<br />
. (11.40)<br />
( ) 2 R0 π s 2<br />
F r = S 0 〈Q pr 〉 (11.41)<br />
R c
172 CHAPTER 11. HELIOSPHERE<br />
Figure 11.13: Brechungsindex <strong>für</strong> astronomisches Silikat. Nach Draine (1985).<br />
durch die Gravitationskraft<br />
F G = 4π 3 ρs3 GM ⊙<br />
R 2 . (11.42)<br />
Das Verhältnis enthält wie erwartet keine radiale Abhängigkeit mehr,<br />
β = F r<br />
F G<br />
= 3 4<br />
S 0 R0<br />
2 1<br />
c G M ⊙ ρ s 〈Q pr〉 = 5.74 · 10 −4 〈Q pr〉<br />
ρs<br />
(11.43)<br />
Für grosse IDPs wird der die Druckkrafteffizienz Q pr konstant <strong>und</strong> β muss<br />
wie 1/s abnehmen. Bei kleineren Radien s ist das Verhalten komplizierter,<br />
Abbildung 11.14 zeigt β <strong>für</strong> Kügelchen mit Radius s aus astronomischem<br />
Silikat. Offensichtlich kann es im Sonnensystem keine Silikat-IDPs mit Radien<br />
zwischen ca. 0.05 <strong>und</strong> 0.8 µm geben. Diese würden es als sogenannte<br />
β-Meteoren verlassen. In der Tat werden diese gemessen, es handelt sich dabei<br />
um Staubteilchen, die gerade frisch erzeugt worden sind <strong>und</strong> welche das Sonnensystem<br />
nun auf hyperbolischen Bahnen verlasen.<br />
Die Dynamik von Staubteilchen wird durch die vorgängige Diskussion nur<br />
zum Teil abgedeckt. Die Wechselwirkung von kleinen Körpern mit dem Photo-
11.2. INTERPLANETARY DUST 173<br />
Figure 11.14: β <strong>für</strong> astronomisches Silikat.<br />
nenfeld der Sonne bewirkt nicht nur eine Reduktion des scheinbaren Gravitationsfeldes,<br />
sondern auch eine Abbremsung der IDPs. Wir betrachten nun ein<br />
Teilchen, welches sich auf einer Bahn um die Sonne bewegt (Abb. 11.15). Sein<br />
Abstand von der Sonne sei R, seine Geschwindigkeit ⃗v. Der auf das Teilchen<br />
auftreffende Poyntingfluss S ′<br />
= S 0 (1 − ˙⃗ R/c), wo ˙⃗R = ⃗v · ⃗ S/|S| die radiale<br />
Geschwindigkeit des Teilchens ist. Der Ausdruck in Klammern, (1 − ˙⃗ R/c) ist<br />
auf den Dopplereffekt zurückzuführen. Die auf das Teilchen ausgeübte Druckkraft<br />
ist dann, nach Glg. 11.32<br />
F r r = S′ A 〈Q pr 〉<br />
c<br />
⃗S<br />
| S| ⃗ . (11.44)<br />
Die nichtradiale ewegung des Teilchens führt auber zusätzlich zum Auftreten<br />
einer nichtradialen Kraftkomponente. Diese kann auf zwei äquivalente Weisen<br />
verstanden werden. Einerseits führt die nichtradiale Geschwindigkeitskomponente<br />
des Teilchens dazu, dass die Strahlung von der Sonne nicht nur seitlich,<br />
sondern ein wenig von vorne (in Bewegungsrichtung) auf das Teilchen auftrifft.
174 CHAPTER 11. HELIOSPHERE<br />
⃗S<br />
⃗v<br />
Sonne<br />
⃗r<br />
m, A<br />
Bahn<br />
Figure 11.15: Skizze zur Dynamik eines Staubteilchens im Sonnensystem.<br />
Diese Aberration um den Winkel ⃗v ⊥ /c führt zu einer Druckkraft von<br />
F r⊥ = − S′ A 〈Q pr 〉<br />
c 2 ⃗v. (11.45)<br />
Wird die absorbierte Energie S ′ A 〈Q pr 〉 im Ruhesystem des Teilchens isotrop<br />
abgestrahlt (siehe Abb. 11.16), so wirkt keine zusätzliche Kraft auf das Teilchen.<br />
Im Ruhesystem der Sonne bewegt sich das Teilchen <strong>und</strong> die Frequenzen der<br />
vom Teilchen emittierten Strahlung wird Doppler-verschoben, was zu einem<br />
Impulsverlust des Teilchens führt, welcher genau der oben besprochenen Kraft<br />
durch den Aberrationsanteil entspricht. Damit lautet die Nettokraft auf das<br />
Teilchen<br />
m˙⃗v = S′ A 〈Q pr 〉<br />
c<br />
⃗S<br />
| ⃗ S| − S′ A 〈Q pr 〉<br />
c 2 ⃗v. (11.46)<br />
Der erste Ausdruck gibt die radiale Kraft, der zweite resultiert in einer Abremsung<br />
des Teilchens. In der Regel wird der zweite Term Poynting-Robertson<br />
Abbremsung genannt. Er führt zu einer Abnahme der grossen Halbachse der<br />
Bahn, welche nach Burns et al. (1979) eine Zeitkonstante von<br />
τ PR =<br />
s2 mc 2<br />
4Q pr S 0 r0A<br />
2<br />
(11.47)
11.2. INTERPLANETARY DUST 175<br />
Incident radiation<br />
arctan(v/c)<br />
P<br />
v<br />
in particle’s frame<br />
(1 + v/c)P<br />
incident<br />
radiation<br />
(1 − v/c)P<br />
v<br />
in rest frame of Sun<br />
Figure 11.16: Der Poynting-Robertson Effekt<br />
hat. Diese kann durch Einsetzen der verschiedenen auftretenden Grössen durch<br />
eine einfache <strong>und</strong> prägnante Formel ausgedrückt werden:<br />
τ PR = 400 R2<br />
β<br />
in Jahren, (11.48)<br />
wo R in AE gemessen wird. Damit kann die Zeit ausgerechnet werden, welche<br />
ein Teilchen in einem Intervall [R, R + dR] verbringt,<br />
dτ PR = 800 R dR. (11.49)<br />
β(s)<br />
Für grosse Staubteilchen s ≥ 1µm ist nach Abb. 11.14 β(s) ∼ 0.2/s. Der<br />
auf das Teilchen auftreffende Sonnenwind <strong>und</strong> Ultravioletfluss vermag einzelne<br />
Atome aus dem IDP herauszuschlagen. Der prozess heisst englisch “sputtering”.<br />
Er führt mit der Zeit zu einer Verkleinerung des Staubteilchens. Aus
176 CHAPTER 11. HELIOSPHERE<br />
Messungen von Häufigkeiten von Edelgasen in Mondproben, kann die Sputteringrate<br />
bei 1 AE abgeschätzt werden zu ungefähr S 0 ≈ 1 Å pro Jahr (Borg<br />
et al., 1980). Ein bei 2 AE freigesetztes 10 µm Silikatteilchen erreicht nach<br />
Glg. 11.49 nach über 50’000 Jahren die Bahn der Erde. In dieser Zeit hat sein<br />
Radius aber bereits abgenommen, zwar nicht um 50’000 Å, weil bei 2 AE die<br />
Sputteringrate 4 mal kleiner ist, als bei 1 AE. Wir können die Entwicklung der<br />
Grösse der Teilchen aus den bisherigen Gleichungen herleiten. Die Änderung<br />
des Radius ist proportional zur Zeit, die das Teilchen in der Umgebung verbringt,<br />
in der es gesputtert wird <strong>und</strong> zum Sputteringfluss.<br />
( ) 2 R0<br />
ds = −dtS 0 (11.50)<br />
R<br />
Wir können diese Gleichung durch dR dividieren <strong>und</strong> erhalten<br />
ds<br />
dR = − dτ<br />
dR S 0<br />
ds<br />
s<br />
= 800 R<br />
β(s) S 0<br />
( ) 2 R0<br />
,<br />
R<br />
( R0<br />
R<br />
= 800 S 0 s<br />
0.2 R2 0R −1 ,<br />
) 2<br />
,<br />
= 0.4 dR R , (11.51)<br />
wo die numerische Konstante im letzten Schritt durch Abgleich der Einheiten<br />
erreicht wird. Das Vorzeichen verschwindet nach der ersten Zeile, weil dR in<br />
unserem Fall negativ ist, das Teilchen spiralt mit zunehmender Zeit näher zur<br />
Sonne. Dieser Ausdruck kann einfach integriert werden,<br />
ln s = 0.4 ln R + C,<br />
s(R) = s 0 R 0.4 (11.52)<br />
wo die Integrationskonstante zur Normierung auf die Anfangsgrösse des IDP<br />
verwendet wurde. Unser Staubteilchen ist also auf seiner Reise von 2 AE zur<br />
Erde um ca. 30% geschrumpft.<br />
Zur Massenverteilung des interplanetaren Staubes<br />
Laboruntersuchungen von Kollisionen zwischen Körpern verschiedener Grössen<br />
erlauben es, die Massenverteilung von IDPs zu verstehen. Diese Experimente<br />
werden in der Regel nur <strong>für</strong> Situationen durchgeführt werden, bei denen die<br />
Eigengravitation vn Körpern keine Rolle spielt 4 . Bei solchen Experimenten<br />
4 Die Gravitation wird in gewissen Experimenten durch einen erhöhten Umgebungsdruck<br />
simuliert.
11.2. INTERPLANETARY DUST 177<br />
werden sowohl die Zielkörper (target), wie auch die Geschosse (projectile), wie<br />
auch die Projektilenergie variiert. Dabei stellen sich wie in Abb. 11.17 verschiedene<br />
Regimes heraus, in welchen andere Phänomene auftreten. Ist das<br />
Projektil klein oder langsam, so schlägt es in den Körper nur einen Krater.<br />
Wird das Projektil grösser oder schneller, so vermag er den Zielkörper in wenige<br />
grosse Einzelstücke zu zerstören. Nimmt die Projektilenergie weiter zu, so tritt<br />
katastrophale Zerstörung des Zielkörpers auf, der Körper wird in viele kleine<br />
Bruchstücke fragmentiert. Der Gr<strong>und</strong> <strong>für</strong> das verschiedenartige Verhalten in<br />
vorher<br />
nachher<br />
a)<br />
m p<br />
⃗v p<br />
m t<br />
b)<br />
⃗v p<br />
m t<br />
m p<br />
c)<br />
m t<br />
⃗v p<br />
m p<br />
Figure 11.17: Die drei Zerstörungsregimes bei Zusammenstössen zwischen<br />
Staubteilchen verschiedener Grössen <strong>und</strong> Geschwindigkeiten.<br />
den drei Regimes liegt einerseits in Unterschieden der kinetischen Energie der<br />
Projektils, andererseits in der Ausbreitungsgeschwindigkeit der Zerstörung.<br />
Der Einschlag des Projektils führt in jedem Fall zur Ausbildung einer Druck-
178 CHAPTER 11. HELIOSPHERE<br />
welle, die sich durch den Zielkörper hindurch bewegt. Ist die Einschlagsenergie<br />
klein genug, dass sie im Zielkörper dissipiert werden kann, so führt der Einschlag<br />
zur Bildung eines Kraters <strong>und</strong> zum Auswurf von Material, hauptsächlich<br />
des Zielkörpers. Wohl bewegt sich die Druckwelle durch den ganzen Körper<br />
(was manchmal auch zu Kratern auf der dem Einschlag gegenüberliegenden<br />
Seite führen kann), ihr Druck ist aber nirgendwo mehr gross genug, um die<br />
inneren Kräfte der Zielkörpers zu überwinden (Abb. 11.17a).). Dieses Regime<br />
ist <strong>für</strong> Einschläge von Meteoriden in Asteroiden, Monde <strong>und</strong> Planeten wichtig,<br />
in welche Material freigesetzt wird <strong>und</strong> so zum interplanetaren Staub beiträgt.<br />
Der Auswurf von Material bei Einschlägen auf Mars <strong>und</strong> Mond sind dokumentiert<br />
durch F<strong>und</strong>e von Meteoriten, welche anhand ihrer Zusammensetzung<br />
als vom Mond bzw. Mars stammend identifiziert werden konnten. Nimmt die<br />
Projektilenergie zu, so kann die Druckwelle durch den ganzen Körper hindurch<br />
grössere Kräfte auf diesen ausüben, als diesen zusammenhalten <strong>und</strong> ihn somit<br />
zerstören. Läuft diese Druckwelle langsamer als die Schallgeschwindigkeit im<br />
Zielkörper durch diesen, so entstehen nur wenige Bruchstücke (Abb. 11.17b).),<br />
läuft sie schneller, so entstehen sehr viele, die Zerstörung erfolgt “katastrophal”(Abb. 11.17c).).<br />
Bei zusammenstössen von Körpern sind die auftretenden Drucke sehr gross.<br />
Der Druck in der sich durch den Körper ausbreitenden Welle ist nach Mukai<br />
et al. (2001) gegeben durch<br />
P = ρ 0i U si u pi , (11.53)<br />
wo die Indices i = 1 <strong>und</strong> 2 die Grössen des Projektils <strong>und</strong> den Zielkörpers numerieren.<br />
ρ 0 ist die ungestörte dichte der Körper, u p die Anfangsgeschwindigkeiten,<br />
<strong>und</strong> U s die Geschwindigkeit der Druckwelle im Körper. Eine empirische Beziehung<br />
zwischen U s <strong>und</strong> u p gilt <strong>für</strong> viele Materialien <strong>und</strong> lautet<br />
U si = C Bi + S i u pi , (11.54)<br />
wo C Bi die Schallgeschwindigkeit im Körper <strong>und</strong> S i eine dimensionslose Grösse<br />
ist. Aus Experimenten mit basaltischen Körpern kennt man C Bi = 3.17<br />
km/s <strong>und</strong> S i = 1.25. Das Verhalten des Drucks <strong>für</strong> verschiedene Stossgeschwindigkeiten<br />
ist in Abb. 11.18 wiedergegeben. Die Bedeutung der Schallgeschwindigkeit<br />
C Bi liegt offensichtlich daran, dass bei etwa diesem Wert, der Druck dann<br />
wesentlich schneller zuzunehmen beginnt. Ist also die Projektilgeschwindigkeit<br />
grösser als die Schallgeschwindigkeit im Zielkörper, so wird der Druck wesentlich<br />
grösser, als bei niedrigeren Stossgeschwindigkeiten. Im Sonnensystem können,<br />
je nach Ort, Stossgeschwindigkeiten bis zu gut 100 km/s auftreten. Die Druckwelle<br />
muss irgendwann wieder die Oberfläche des Körpers erreichen <strong>und</strong> wird<br />
dort reflektiert. Diese Reflexion ist mit einer Impulsübertragung an geeignete<br />
Oberflächenelemente verb<strong>und</strong>en. Diese können dann aus dem Körper herausgebrochen<br />
werden <strong>und</strong> diesen verlassen. Dieser Effekt scheint bei der Kraterbildung<br />
eine wesentliche Rolle zu spielen <strong>und</strong> ist da<strong>für</strong> verantwortlich, dass
11.2. INTERPLANETARY DUST 179<br />
Figure 11.18: Druck in der die Stosspartner durchlaufenden Druck- oder Stosswelle.<br />
Bruchstücke des Mutterkörpers diesen mit hoher Geschwindigkeit verlassen<br />
können. Im Fall von marsmeteorite haben diese ja offensichtlich die Fluchtgeschwindigkeit<br />
von Mars (immerhin 5 km/s) überschritten. Die Kratergrösse<br />
R C muss mit zunehmender Projektilenergie zunehmen. Mittels Dimensionsanalyse,<br />
welche <strong>für</strong> solche Probleme oft verwendet wird, kann der richtige<br />
Zusammenahng gef<strong>und</strong>en werden. Dazu wird eine weitere wichtige Grösse<br />
eingeführt, die “Stärke” Y t des Körpers (von Englisch “strength”). In den meisten<br />
Situatione, welche wir hier betrachten, ist der Zusammenhalt des Körpers<br />
durch diese Stärke gegeben (strength regime) <strong>und</strong> nicht durch die Eigengravitation<br />
(gravitation regime). Für das Verhalten nach einer Kollision ist das<br />
Verhältnis zwischen Stärke <strong>und</strong> kinetischer Energie des Projektils von Bedeutung.<br />
Die Stärke eines Körpers braucht nicht unbedingt eine konstante Grösse<br />
zu sein, sondern kann von der Grösse des Körpers, wie auch dessen Belastung<br />
abhängen. Bei kleiner Belastung, bzw. genauer Belastungsrate, ist die Stärke<br />
etwa konstant, paradoxerweise nimmt aber die Stärke eines fragmetntierenden<br />
Körpers bei zunehmender Belastungsrate zu! Dies wird durch eine konzeptuell<br />
einfaches Modell des Wachstums von Fehlerstellen im Körper zu Rissen oder
180 CHAPTER 11. HELIOSPHERE<br />
Spalten erklärt. Eine Felherstelle wird bis zu einer gewissen Belatung ɛ stabil<br />
bleiben, steigt die Belastung weiter, wird die Fehlerstelle nachgeben <strong>und</strong><br />
er Körper dort einen Riss erfahren. Nimmt man eine Potenzverteilung der<br />
Belastbarkeit der Fehlerstellen an,<br />
n = kɛ m , (11.55)<br />
so wird klar, dass mit zunehmender Belastung ɛ die Anzahl der reissenden<br />
Fehlerstellen n zunimmt. Andererseits sind die schwächsten Stellen bereits<br />
gerissen, <strong>und</strong> dmait ist die Stärke des verbleibenden Materials gestiegen! Andererseits<br />
nimmt bei wachsender Grösse des Körpers die Wahrscheinlichkeit,<br />
eine sehr schwache Fehlerstelle zu finden, zu, <strong>und</strong> die Stärke des Körpers<br />
nimmt ab. Wiederum aud dimensionsanalytischen überlegungen kann die belastungsratenabhängige<br />
Stärke abgeschätzt werden zu<br />
Y t ∝ ˙ɛ 3<br />
m+3 . (11.56)<br />
Mit dieser Vorbereitung kann nun auch der Unterschied zwischen Regime b)<br />
<strong>und</strong> c) in Abb. 11.17 verstanden werden. Bei niedriger Projektilenergie ist der<br />
Druck, der sich als Welle durch den Körper bewegt, niedrig genug, dass nur die<br />
schwächsten Fehlerstellen des Körpers reissen. Pflanzt sich die Welle langsam<br />
durch den Körper fort, so ist die Belastungsrate niedrig. Nimmt die Projektilenergie<br />
zu, Nimmt auch die Geschwindigkeit der Welle <strong>und</strong> damit die Belastungsrate<br />
zu. Übersteigt die Wellengeschwindigkeit die Schallgeschwindigkeit<br />
im Körper, so steigt der Druck noch schneller (Abb. 11.18.) <strong>und</strong> damit auch die<br />
Belastungsrate. Deshalb wird sich bei Überschreitung der Schallgeschwindigkeit<br />
ein anderes Verhalten einstellen, der Körper fragmentiert in wesentlich mehr<br />
Teilchen.<br />
Im Fall der katastrophalen Zerstörung haben Fujiwara et al. (1977) die<br />
Masse des jeweils grössten übriggebliebenen Teilchens m u gemessen <strong>und</strong> da<strong>für</strong><br />
den empirischen Zusammenhang<br />
m u<br />
m t<br />
= 1.66 × 10 8 ( Ep<br />
m t<br />
) −1.24<br />
, (11.57)<br />
wo E p die projektilenergie in erg <strong>und</strong> m t die Masse des Zielkörpers in g ist.<br />
Die Massen der übriggebliebenen Teilchen sind als Potenzgesetz verteilt. Weil<br />
zur Bestimmung der übriggebliebenen Teilchen ein Sieb verwendet wird, ist es<br />
üblich, wiederum die kumulative Massenverteilung anzugeben. Für die Masse<br />
der Teilchen, welche kleiner sind als s gilt<br />
m(< s)<br />
m t<br />
∼ s k , (11.58)
11.2. INTERPLANETARY DUST 181<br />
wo der Exponent k je nach Material variiert, typischerweise aber etwa die<br />
Grössenordnung von 0.5 hat. Diese sehr nahe am Experiment liegende Grösse<br />
ist <strong>für</strong> weitere Gedankenexperimente nicht besonders gut geeignet, wir bestimmen<br />
im folgenden die Grössenverteilung.<br />
m(< s)<br />
.<br />
=<br />
∫ m(s)<br />
0<br />
= 4 π ∫ s<br />
3 α ρ 0<br />
( 4 π<br />
= 3 ·<br />
dm m n(m),<br />
dm<br />
ds ds s3 n(m) ∼ s k ,<br />
) 2 ∫ s<br />
3 α ρ 0<br />
ds s 5 n(m)<br />
∼<br />
∫ s<br />
0<br />
ds s k−1 , (11.59)<br />
wo α ein dimensionsloser Parameter ist, welcher die Abweichung der Bruchstücke<br />
von der Kugelform berücksichtigt. Damit die Dimension des Integranden auf<br />
beiden Seiten von Glg. 11.59 übereinstimmt, muss gelten<br />
n(m) ∼ s k−6 ∼ m k−6<br />
3 . (11.60)<br />
Um die Grössenverteilung n(s) zu finden, brauchen wir in der zweiten Zeile<br />
von Glg. 11.59 nur n(m) durch n(s) zu ersetzen <strong>und</strong> die Ableitung dm/ds<br />
wegzulassen. Dann muss wiederum gelten<br />
n(s) ∼ s k−4 . (11.61)<br />
Mit diesen Ausdrücken können wir nun auch die Masse des kleinsten Bruchstücks<br />
berechnen, wie auch die erwartete Anzahl Bruchstücke, den Erwartungswert<br />
<strong>für</strong> die Masse der Bruchstücke, etc. In anderen Worten, die Statistik der Kollisionen<br />
ist damit vollständig beschrieben.<br />
Temperatur der IDPs<br />
Die Temperatur von Staubteilchen im interplanetaren Medium berechnet sich<br />
aus dem Gleichgewicht aus absorbierter Strahlung <strong>und</strong> emittierter Strahlung<br />
plus ein eventueller Beitrag zur Kühlung durch die Sublimation von Kornmaterial.<br />
Wir nehmen ferner an, dass das Korn eine gute Wärmeleitfähigkeit<br />
aufweist, also isotrop abstrahlt. Für sehr grosse Körner können wir die Gleichgewichtstemperatur<br />
ohne weiteres ausrechnen. Das Teilchen absorbiert über<br />
seine Querschnittsfläche A die Solarkonstante am jeweiligen heliozentrischen<br />
Abstand <strong>und</strong> emittiert über seine gesamte Oberfläche ( (4A <strong>für</strong> eine Kugel)<br />
nach Stefan-Boltzmann.<br />
A · S 0<br />
( R0<br />
R<br />
) 2<br />
= 4 A σ T 4<br />
T (R) =<br />
[<br />
S0<br />
4 σ<br />
( ) 2<br />
] 1/4<br />
R0<br />
, (11.62)<br />
R
182 CHAPTER 11. HELIOSPHERE<br />
was <strong>für</strong> 1 AE eingesetzt etwa 278 Grad Kelvin ergibt. Bei dieser Temperatur<br />
emitiert ein schwarzer Körper ahuptsächlich bei einer Wellenlänge von ca. 10<br />
µm. Ist das Teilchen kleiner als die Wellenlänge des Lichts, das es nach dem<br />
Wienschen Verschiebungsgesetz emitieren müsste, so wird es schwierig, dieses<br />
Licht abzustrahlen. Das Teilchen wird also heisser, als es nach der einfachen<br />
Abschätzung von Glg. 11.62 würde. Eine korrekte Rechnung muss also die<br />
effektiv abgestrahlte Leistung gebührend berücksichtigen. Die dazu notwendigen<br />
Hilfsmittel haben wir im Abschnitt 11.2.3 über die Mie-Streutheorie bereitgestellt.<br />
Ein IDP absorbiert <strong>und</strong> emitiert Licht mit einer Effizienz Q abs (λ)<br />
die von der Wellenlänge des Lichts abhängt. Die absorbierte Leistung kann aus<br />
dem Integral über das Sonnenspektrum berechnet werden, die emitierte Leistung<br />
aus dem Integral über ein Schwarzkörperspektrum <strong>für</strong> die Temperatur<br />
des Teilchens:<br />
( ) 2 ∫<br />
P abs = π s 2 R0 ∞<br />
dλ Q abs (λ) F ⊙ (λ) (11.63)<br />
R 0<br />
∫ ∞<br />
P em = 4π s 2 dλ Q abs (λ) B ⊙ (λ, T IDP ) (11.64)<br />
0<br />
Durch Gleichsetzen der beiden Ausdrücke kann die Gleichgewichtstemperatur<br />
ermittelt werden. Offensichtlich ist dies nicht mehr geschlossen lösbar, weil die<br />
Temperatur hier in einem doch schon recht komplizierten Integranden, dem<br />
Schwarzkörperspektrum des IDP, steckt. Sie kann aber iterativ ermittelt werden.<br />
Der Einfluss der veränderten Absorption <strong>und</strong> Emission ist in Abb. 11.19<br />
gezeigt. Je kleiner die Teilchen werden, desto schlechter absorbieren sie die von<br />
der Sonne ausgstrahlte Leistung. Sie sind aber noch schlechtere Abstrahler, so<br />
dass sie dazu tendieren, immer heisser zu sein, als man nach der einfachen Abschätzung<br />
aus Glg. 11.62 glauben würde. In wenigen Sonnenradien Abstand<br />
wird dann die Sublimation den hauptanteil zur Kühlung beitragen, er kann<br />
abgeschätzt werden durch<br />
P subl =<br />
( )<br />
dmIDP<br />
wo L die spezifische Sublimationswärme ist.<br />
dt<br />
L, (11.65)<br />
Aufladungseffekte<br />
Ein IDP steht relativ zum Sonnenwind <strong>und</strong> zu solaren Photonen still <strong>und</strong> wechselwirkt<br />
daher mit diesen. Diese Wechselwirkung führt zur Ausbildung einer<br />
Gleichgewichtsladung an der Oberfläche des Staubteilchens. Dazu können verschiedene<br />
Effekte beitragen:
11.2. INTERPLANETARY DUST 183<br />
Figure 11.19: Q abs <strong>für</strong> IDPs verschiedener Grössen <strong>und</strong> <strong>für</strong> verschiedene Temperaturen.<br />
• Absorbtion von Sonnenwindionen <strong>und</strong> -elektronen ist eine naheliegende<br />
Wechselwirkung. Die Ladung des Staubteilchens führt dazu, dass es<br />
<strong>für</strong> Ionen oder Elektronen attraktiv oder abstossend wirken kann. Der<br />
Absorptionsqueschnitt ist aber <strong>für</strong> Sonnenwlektronen <strong>und</strong> -ionen nicht<br />
derselbe. Es ist einfch zu zeigen, dass der Absorptionsquerschnitt σ j (u)<br />
eines Staubteilchens mit Radius s <strong>und</strong> Oberflächenpotential U <strong>für</strong> ein<br />
Sonnenwindteilchen mit Masse m j , Geschwindigkeit u <strong>und</strong> Ladung Z j<br />
gegeben ist durch<br />
(<br />
σ j (u) = πs 2 1 − 2 Z )<br />
j e U<br />
. (11.66)<br />
m j u 2<br />
Weil Elektronen eine negative Ladung haben (Z e = −1) <strong>und</strong> sie eine<br />
ca. 1840 Mal kleinere Masse haben, als Protonen, wird der Ausdruck<br />
in der Klammer <strong>für</strong> positive Oberflächenspannung wesentlich grösser,<br />
als im umgekehrten Fall <strong>für</strong> Protonen. Damit würde man erwarten,<br />
dass eine positive Ladung eines IDP relativ rasch abgebaut wird. Eine
184 CHAPTER 11. HELIOSPHERE<br />
negative Ladung des IDP wäre jedoch stabiler. Wegen ihrer grossen<br />
Masse sind die Ionen von dern in der Regel kleinen (einige wenige Volt)<br />
Oberflächenspannungen nicht besonders beeindruckt <strong>und</strong> fliegen am IDP<br />
vorbei, ohne es zu beachten.<br />
• Sek<strong>und</strong>ärelektronenemission durch die auftreffenden Elektronen <strong>und</strong> Ionen<br />
gleicht den soeben beschriebenen Effekt aus. Weil es wesentlich einfacher<br />
ist, Elektronen aus einem IDP herauszuschlagen, als Ionen, scheint<br />
es wahrscheinlich, dass das IDP positiv geladen wird. Die Sek<strong>und</strong>ärelektronenausbeute<br />
(emittierte vs. auftreffende Elektronen) aus einem Feststoff, welcher dick<br />
genug ist, um Elektronen zu absorbieren, ist stark energiebahängig <strong>und</strong><br />
gegeben durch (Mukai et al., 2001)<br />
δ y (E) = δ M<br />
e 2<br />
( ) [ ( ) E<br />
E 1/2<br />
]<br />
exp −2 , (11.67)<br />
E M E M<br />
wo δ M ein numerischer Wert zwischen 1 <strong>und</strong> 10 ist. Die Ausbeute wird<br />
maximal bei E ∼ E M , wo E M zwischen ∼ 100 <strong>und</strong> ∼ 1000 eV liegt. Die<br />
kinetische Energie von Sonnenwindelektronen liegt deutlich unter diesem<br />
Wert, energetische elektronen können ihn aber mühelos erreichen.<br />
• Photoemission von (hauptsächlich) Elektronen geschieht, wenn auf das<br />
IDP ein Photon auftrifft, welches eine Energie aufweist, welche grösser<br />
ist, als die Austrittsarbeit f¨r das Material, aus dem das IDP besteht. Der<br />
resultierende Strom aus der Oberfläche des IDP ist<br />
( ) 2 ∫<br />
I = 4πs 2 R0 ∞<br />
d(hν) F ∫<br />
⊙(λ)<br />
R hν=ɛ work +ɛ min hν Q ɛmax<br />
absY · dɛf(ɛ), (11.68)<br />
ɛ min<br />
wo ɛ max = hν − ɛ work <strong>und</strong> ɛ min = 0 <strong>für</strong> negativ geladene <strong>und</strong> ɛ min = eU<br />
<strong>für</strong> positiv geladene Staubteilchen.<br />
• Der thermoionische Effekt vermag bei sehr heissen Temperaturen wesentlich<br />
über 1000 K Staubteilchen aufzuladen. Bei dieser Temperatur sind einige<br />
der Elektronen im Festkörper energetisch genug, um diesen zu verlassen,<br />
d. h. haben eine kinetische Energie, welche grösser ist als die Austrittsarbeit.<br />
Dieser Effekt spielt nur in unmittelbarer Sonnennähe eine Rolle.<br />
Alle hier besprochenen Prozesse laden das Staubteilchen durch Emission<br />
von niedrigenergetischen Ladungsträgern auf. In der Regel sind IDPs leicht<br />
positiv geladen, was bedeutet, dass mehr netto Elektronen als Ionen emittiert<br />
worden sind. Weil die emittierten Elektronen aus einer niedrigenergetischen<br />
(〈E〉 ∼ 1 bis 5 eV), wahrscheinlich thermischen Verteilung stammen,<br />
kann sich das Korn nicht bis zu hohen Oberflächenpotentialen aufladen. Die
11.2. INTERPLANETARY DUST 185<br />
niedrigenergetischen Elektronen vermögen das Eigenpotential des IDP nicht<br />
zu überwinden <strong>und</strong> von den höherenergetischen Elektronen hat es zu wenige,<br />
um noch zur Aufladung beizutragen. So stabilisiert sich die Ladung von interplanetaren<br />
Staubkörnern auf wenige Volt, 5 V dürfen als typische Grösse<br />
verwendet werden.<br />
Die Ladung der Staubteilchen beeinflusst auch deren Dynamik. Das an<br />
ihnen mit dem Sonnenwind vorbeikonvektierte interplanetare Magnetfeld ruft<br />
eine Lorentzkraft hervor, welche die Teilchen aus ihrer Bahnebene herausbewegen<br />
kann. Weil das IMF in Sektoren organisiert ist (siehe Absch. ?? <strong>und</strong> ??)<br />
wird die Auslenkung immer wieder korrigiert. Weil die Dauer des Aufenthaltes<br />
im selben Sektor aber nicht immer gleich lang ist, bewirkt die Ladung der<br />
IDPs langfristig eine Diffusion aus der Bahnebene heraus. Weil das IMF in<br />
Sonnennähe grösser ist, als weiter weg, ist dieser Effekt in Sonnennähe auch<br />
wichtiger als in grossen heliozentrischen Abständen.<br />
Die Ladung auf einem IDP kann aus dem Oberflächenpotential leicht hergeleitet<br />
werden.<br />
q = 4 π ε s U (11.69)<br />
Damit kann auch leicht die Lorentzkraft berechnet werden, welche auf das<br />
Teilchen wirkt. Bei etwa 2.5 AE, beim Ateroidengürtel, steht das Magnetfeld<br />
schon fast senkrecht zur Ausbreitungsrichtung des Sonnenwindes <strong>und</strong> die<br />
Lorentzkraft ist dann einfach<br />
F L ≈ q u SW B = 4 π ε s U u SW B ≈ 10 −17 N (11.70)<br />
Dies ist klein im Verhältnis zur Gravitation, F G = GM ⊙ 4πρs 3 /(3r 2 ) ≈ 10 −14<br />
N, <strong>und</strong> wird deshalb in der Regel vernachlässigt. Allerdings ist es die einzige<br />
Kraft, die, abgesehen von komplizierten Dreikörperstössen, ein Staubteilchen<br />
aus der Ekliptik heraus zu bewegen vermag <strong>und</strong> deshalb <strong>für</strong> die Dynamik<br />
von interplanetarem Staub nicht unwichtig. Dass sie die Dynamik aber wenig<br />
beinflusst, ist durch Sekanina (2000) gezeigt worden, der die Staubschweife<br />
von sonnennahen Kometen (die SOHO Kometen) untersucht hat <strong>und</strong> dabei<br />
keine Abweichung von der aufgr<strong>und</strong> von Gravitation <strong>und</strong> Poynting-Robertson<br />
Kraft erwarteten Bahn festgestellt hat.<br />
Messmethoden<br />
Auer (2001) gibt eine Zusammenfassung über die gängigen in-situ Messmethoden<br />
<strong>für</strong> interplanetaren Staub. Abbildung 11.20 (nach Auer (2001)) fasst<br />
verschiedene Methoden zusammen.<br />
• Durch Messung der Intensität des Zodiakallichtes kann durch Inversion<br />
auf die Dichte <strong>und</strong> räumliche Verteilung der IDPs in einer gewissen
186 CHAPTER 11. HELIOSPHERE<br />
Figure 11.20:<br />
(2001).<br />
Verschiedene Methoden der Messung von IDPs nach Auer<br />
Massenverteilung geschlossen werden. Dazu muss das instrumentelle<br />
Streulicht unterhalb von 1% des Zodiakallichtes unterdrückt werden, typisch<br />
werden mehr als 15 Grössenordnungen Unterdrückung angestrebt.<br />
Im Infrarot muss zudem die Emission von warmen Teilen der Raumsonde<br />
unterdrückt werden.<br />
• Abbildende Teleskope detektieren an individuellen IDPs reflektiertes Sonnenlicht<br />
<strong>und</strong> können so die Geschwindigkeit der Teilchen messen. Je<br />
nach Geometrie kann nur die Geschwindigkeitskomponente am Himmel<br />
gemessen werden, die Messung der radialen (vom Beobachter aus) Komponente<br />
muss Annahmen über die Geometrie, bzw. die Stabilität der<br />
Teilchen machen.<br />
• Um IDPs in unmittelbarer Nähe des Instrumentes zu beobachten, wird<br />
ein sog. Lichtvorhang verwendet. Dieser beleuchtet kontinuierlich setilich
11.2. INTERPLANETARY DUST 187<br />
eine kleine Fläche von z. B. 0.01 m 2 <strong>und</strong> einer gewissen Dicke (4 mm im<br />
Falle des Rosetta Staubexperimentes). In Serie sind zwei weitere nichtkontinuierlich<br />
betriebene Vorhänge anebracht, welche durch den ersten<br />
getriggert werden. Das reflektierte Licht wird fokussiert <strong>und</strong> die Flugzeit<br />
<strong>und</strong> Intensität gemessen, um die Geschwindigkeit <strong>und</strong> Grösse zu messen.<br />
• Der durch den Vorbeiflug eines geladenen Teilchens an Leitern induzierte<br />
Spannungpuls kann zur Messung der Geschwindigkeit des IDPs verwendet<br />
werden. Wird zusätzlich eine Beschleunigungs- oder Verzögerungsspannung<br />
angelegt, kann ach auf die Mssse des IDPs geschlossen werden.<br />
• Der beim Aufprall eines IDP im Sensor erzeugte Lichtblitz kann zur<br />
Messung des Flusses verwendet werden. Durch hohe zeitliche Auflösung<br />
kann auch der Lichtblitz des im Sensor auftreffenden Kratermaterials<br />
gemessen werden. Sein zeitlicher Abstand it geschwindigkeitsabhängig.<br />
• Das beim Aufrall erhitzte Material wird zum Teil ionisiert <strong>und</strong> trifft auf<br />
weitere Wände im Sensor, wo es zu weiterer Ionisierung führen kann.<br />
Diese Impactionisation ist sehr sensitiv, auch auf sehr kleine Massen des<br />
Projektils. Allerdings müssen die Instrumente recht aufwendig geeicht<br />
<strong>und</strong> modelliert werden, je nach Zusammensetzung kann ein anderer Teil<br />
des Materials ionisiert werden.<br />
• Das ionisierte Material kann in einem Flugzeitmassenspektrometer gemessen<br />
werden. Bei geeigneter Wahl des angelegten Potentials, kann daraus<br />
sogar auf die Element- <strong>und</strong> Iosotopenzusammensetzung des IDPs geschlossen<br />
werden.<br />
• Treffen die Staubköner auf eine dünne Folie, können sie diese perforieren.<br />
Dabei verlieren sie Energie <strong>und</strong> können, je nach Grösse <strong>und</strong> Geschwindigkeit,<br />
total zerstört werden.<br />
• Die bei der Perforations entstehenden Bruchstücke können in einer zweiten<br />
Folie auf dieselbe Weise festgestellt werden. Dazu kann z. B. ein doppeloder<br />
mehr- <strong>und</strong> dünnwandiger Behälter unter Druck gesetzt werden. Die<br />
Teilchen werden dann über ein Abfallen des Drucks gemessen.<br />
• Alternativ kann die Entladung eines Kondensators verwendet werden,<br />
wenn das zwischen den Elektroden eingebrachte Dieelektrikum durch<br />
die hohe auftretenden Drucke oder Temperaturen leitend wird. Die<br />
impactionisierten Bruchstücke zwischen zwei im Vakuum angebrachten<br />
Elektroden führen an diesen zu einem Spannungspuls, der ebenfalls gemessen<br />
werden kann.
188 CHAPTER 11. HELIOSPHERE<br />
• Der Aufprall eines IDP auf ein geeignetes polarisiertes Material führt zu<br />
dessen permanenter Entpolarisiereng, welche optisch gemessen wird.<br />
11.3 The Heliosphere in 3-d<br />
11.3.1 Ulysses results<br />
11.3.2 Corotating Interaction Regions<br />
11.3.3 Fisks Model<br />
Wir betrachten zunächst die Konfiguration der Korona <strong>und</strong> damit der Heliosphäre<br />
während des solaren Aktivitätsminimums. In dieser Phase ist die<br />
Struktur der Heliosphäre besonders einfach. Die hier besprochene Struktur ist<br />
durch die ESA/NASA Sonde Ulysses experimentell bestätigt worden. Darüber<br />
hinaus hat Ulysses Messungen geliefert, welche das einfache Parkermodell der<br />
heliosphärischen Magnetfeldkonfiguration (siehe Abschnitt ??) in Frage stellen.<br />
11.3.4 Corotating Interaction Regions<br />
Wir haben den einfachsten Fall der heliosphärischen Magnetfeldkonfiguration<br />
bereits andeutungsweise besprochen. Die Beobachtung, dass koronale Löcher<br />
die Quelle des schnellen Sonnenwindes sind (Krieger et al., 1973), impliziert<br />
eine wesentlich kompliziertere Struktur bereits während des topologosch einfachen<br />
<strong>und</strong> überschaubaren Sonnenaktivitätsminimums. Abb. 11.21 zeigt,<br />
wie sich die Sonnenwindgeschwindigkeit mit der Grösse des koronalen Loches<br />
ändert. Während des Aktivitätsminimums der Sonne konzentrieren sich grosse<br />
koronale Löcher an den Polen der Sonne, während der streamer belt entlang<br />
des heliomagnetischen Äquators konzentriert bleibt. Dieser wird allgemein<br />
als die Quelle des langsamen Sonnenwindes angesehen, selbst wenn dessen<br />
Ursprung nach wie vor nicht geklärt ist. Mehrere Signaturen in der Zusammensetzung,<br />
der Temperatur, wie auch anderer kinetischer Eigenschaften des<br />
langsamen Windes werden am besten durch einen Ursprung im streamer belt<br />
erklärt (Borrini et al., 1981; Gosling et al., 1981).<br />
Die Konzentration des langsamen Sonnenwindes um den “streamer belt”<br />
<strong>und</strong> des schnellen Sonnenwindes um die Pole führt dazu, dass eine Messung<br />
der Sonnenwindgeschwindigkeit an einem festgehaltenen Ort verschieden ausfallen<br />
kann. Liegt der Ort in heliomagnetischer Breite innerhalb des streamer<br />
belt, so wird nur langsamer Sonnenwind, allerdings mit wechselnder Polarität<br />
des Magnetfeldes, gemessen. Liegt der Ort in heliomagnetischer Breite leicht
11.3. THE HELIOSPHERE IN 3-D 189<br />
Figure 11.21: Geschwindigkeit im schnellen Sonnenwind als Funktion der<br />
Fläche des koronalen Loches, aus dem der Wind entstammt. Nach Nolte et al.<br />
(1976).<br />
darüber oder darunter, so muss abwechselnd schneller <strong>und</strong> langsamer Sonnenwind<br />
gemessen werden. Liegt der Ort noch weiter nördlich oder südlich,<br />
so wird ausschliesslich schneller Sonnen wind gemessen. Dieses Verhalten<br />
ist durch Messungen von Instrumenten auf der Sonde Ulysses eindrucksvoll<br />
bestätigt worden (Bame et al., 1993). So ist nicht nur ein “Band der Variabilität”<br />
Gosling et al. (1997) in der Sonnenwindgeschwindigkeit gemessen<br />
worden, sondern auch durch Messung der Einfriertemperaturen ein eindeutig<br />
anderer koronaler Ursprung festgestellt worden.<br />
Im Aktivitätsminimum der Sonne darf das “Band der Variabilität” nach<br />
dem besprochenen Modell der Ausbreitung des Sonnenwindes nicht breiter<br />
sein, als die totale Breite des streamer belts plus dessen Neigung gegenüer der<br />
Ekliptik. Auch diese Voraussage hat sich mit Ulysses bestätigt. Was aber<br />
gechieht in den Gebieten, in denen der schnelle Wind auf den langsamen trifft<br />
<strong>und</strong> dort mit ihm zu wechselwirken begiinen muss?<br />
Die grossen polaren koronalen Löcher müssen also Sonnenwind mit einer
190 CHAPTER 11. HELIOSPHERE<br />
sehr hohen Geschwindigkeit emittieren. Dies ist in der Tat der Fall, die<br />
Ulysses-Sonde hat über den Polen der Sonne sehr hohe Gechwindigkeiten mit<br />
einem Mittelwert um 750 km/s gemessen. Während des Aktivitätsminimums<br />
der Sonne, befinden sich die grössten koronalen Löcher über den Polen der<br />
Sonne. Weil der schnellste Sonnenwind also über den Polen entfliehen muss,<br />
der langsame Sonnenwind aber aus den dichteren Regionen um den magnetischen<br />
Äquator (dem sog. ”streamer belt”) stammt <strong>und</strong> die heliosphärische<br />
Stromschicht wie auch der magnetische Äquator gegenüber dem heliographischen<br />
Äquator geneigt ist, muss es Regionen geben, in denen der schnelle Wind<br />
in den langsamen Wind hineinläuft. Diese Situation ist in Abb. 11.22 abgebildet.<br />
Die grau schattierten Regionen sind Gebiete, in denen der schnelle Son-<br />
Figure 11.22: Ausbildung von korotierenden Wechselwirkungsregionen (CIRs).<br />
nenwind den langsamen einholt <strong>und</strong> mit ihm zu wechselwirken beginnt. Weil<br />
sich diese Struktur mit der Sonne mitdrehen muss, heissen sie im Fachjargon<br />
“corotating interaction regions” (CIRs), korotierende Wechselwirkungsregionen.<br />
Es ist offensichtlich, dass in Gebieten, in denen der schnelle <strong>und</strong> der<br />
langsame Sonnenwind aufeinander treffen, das interplanetare Medium komprimiert<br />
wird <strong>und</strong> damit notwendigerweise eine Erhöhung des Drucks <strong>und</strong> der<br />
Temperatur erfolgt. Weil der Wärmetransport nur unbedeutend ist, muss<br />
die Änderung adiabatisch erfolgen. Die entstehende Druckwelle breitet sich<br />
nach beiden Richtungen aus, rückwärts in den schnellen <strong>und</strong> vorwärts in<br />
den langsamen Sonnenwind. Wir werden in Kapitel ??besprechen, wie sich<br />
unter solchen Umst änden Stosswellen bilden <strong>und</strong> wie in diesen Regionen<br />
Teilchen zu hohen Energien beschleunigt werden können. In der Tat haben sich<br />
die Flüsse energetischer Teilchen bei CIRs als erhöht erwiesen, was zunächst<br />
nicht besonders erstaunlich war. Die erhöhten Flüsse energetischer Teilchen<br />
haben sich in den <strong>für</strong> diese Untersuchungen interessanten Zeitperioden der<br />
Ulyssesmission wie ein Uhrwerk wiederholt. Interessanterweise zeigen sich<br />
aber die Erhöhungen der Füsse energetischer Teilchen selbst dann wie ein<br />
korotierendes System, wenn nach dem einfachen Parkermodell der Magnetfeldkonfiguration<br />
der Heliosphäre gar keine magnetische Verbindung mit CIRs<br />
möglich sein sollte! Dieser Sachverhalt ist in Abb. 11.23 dargestellt. Dies im-
11.3. THE HELIOSPHERE IN 3-D 191<br />
Figure 11.23: 3-dimensionale Struktur der Heliosphäre wie sie sich während<br />
des Aktivitätsminimums der Sonne präsentiert.
192 CHAPTER 11. HELIOSPHERE<br />
pliziert, dass mit dem Parkermodell etwas nicht stimmen kann. Verschiedenen<br />
Lösungen sind vorgeschlagen worden, eine definitive Antwort steht noch aus.<br />
Lösungsansätze müssen alle versuchen, Gebiete hoher heliographischer Breite<br />
mit Gebieten niedriger Breite zu verbinden. Dies geschieht entweder durch<br />
ein stochastisches Verdrehen der Fusspunkte der Feldlinien, oder aber durch<br />
einen systematischen Transport der Fusspunkte zwischen den beiden Breitenbereichen.<br />
Beide Ideen können die Beobachtungen energetischer Teilchen<br />
bei den “falschen” Breiten erklären, nur die systematische Änderung ist aber<br />
eine Konsequenz der rigiden Korotation koronaler Löcher. Sie benutzt die<br />
Beobachtung, dass zwar die Photosphäre differentiell rotiert, also in höheren<br />
Breiten langsamer rotiert, als entlang des Äquators, koronale Löcher aber in<br />
allen Breiten gleich schnell zu rotieren scheinen. Dies impliziert einen systematischen<br />
Transport von magnetischen Feldlinien zwischen niedrigen <strong>und</strong> hohen<br />
Breiten in der Region zwischen Photosphäre <strong>und</strong> Korona. Dieser systematische<br />
Transport pflanzt sich auch ins interplanetare Medium fort <strong>und</strong> verbindet<br />
so Regionen niedriger Breite mit Regionen hoher Breiten magnetisch <strong>und</strong> vermag<br />
so auf natürliche Art die Beobachtungen energetischer Teilchen bei hohen<br />
Breiten zu erklären. Darüber hinaus hat diese Idee auch Konsequenzen <strong>für</strong><br />
den bisher ungeklärten Ursprung des langsamen Sonnenwindes.<br />
Es soll aber nicht verschwiegen werden, dass auch die Idee der stochastischen<br />
Bewegung der Fusspunkte ihre pointierten Be<strong>für</strong>worter hat <strong>und</strong> dass die<br />
beiden Ideen heute auf dem Markt aller Ideen die wohl besten sind. Die<br />
Zukunft wird uns lehren, welche der beiden die richtige ist (<strong>und</strong> dann den<br />
schon zu früh verwendeten Namen Theorie verdient). Persönlich glaube ich,<br />
dass die systematische Bewegung den Kern der Sache trifft, allerding basiert<br />
diese Vorliebe auf dem Vorurteil, dass Wahrheiten auch eine gewisse “innere<br />
Schönheit” oder Eleganz aufweisen müssen. Dieses Vorurteil ist nicht im wissenschaftlichen<br />
Bereich der Wissenschaft anzusiedeln.<br />
11.4 Langsame Variationen<br />
Die magnetische Konfiguration der Sonne ändert sich im Laufe ihres Aktivitätszyklus.<br />
Die einfache Dipolkonfiguration neigt sich immer stärker <strong>und</strong><br />
das Quadrupolmoment scheint immer stärker zu werden. Zu einem gewissen<br />
Zeitpunkt ist dann das magnetfeld umgeklappt, <strong>und</strong> es stellt sich eine<br />
Dipolkonfiguration mit umgekehrtem Vorzeichen ein. Diese dreht sich unter<br />
Zunahme des Quadrupolmomentes wieder weiter, bis wieder die ursprüngliche<br />
Konfiguration errreicht ist. Damit ist ein sogenannter Sonnenaktivitätszyklus<br />
durchlaufen. In dieser Zeit hat die Anzahl Sonnenflecken auf der Sonne zweimal<br />
ein Maxiumum <strong>und</strong> ein Minimum erreicht, was gelegentlich zu Verwirrungen
11.4. LANGSAME VARIATIONEN 193<br />
über den Namen Sonnenzyklus führt. Der magnetische Zyklus dauert ca. 22<br />
Jahre <strong>und</strong> beinhaltet 2 Sonnenfleckenzyklen, welche je ca. 11 Jahre dauern.<br />
Der Sonnenfleckenzyklus wird oft auch als Aktivitätszyklus bezeichnet, weil<br />
die Sonne bei hohen Sonnenfleckenzahlen auch aktiver ist.<br />
Das Kippen des Dipols hat natürlich auch seine Auswirkungen auf die<br />
Struktur der Heliosphäre, weil ja das Gebiet um den magnetischen Äquator den<br />
langsamen Sonnenwind ausstösst, die unipolaren koronalen Löcher aber den<br />
schnellen Sonnenwind. Die Neigung der heliosphärischen Stromschicht nimmt<br />
also gegen das Aktivitätsmaximum hin auch zu, genauso nimmt auch die Komplexität<br />
zu, weil diese viel mehr verbogen <strong>und</strong> verbeult ist. Abb. 11.24 zeigt<br />
in stark vereinfachter Weise die magnetische Konfiguration der Sonne über<br />
einen halben magnetischen Aktivitätszyklus, bzw. einen Sonnenfleckenzyklus.<br />
De Wechselwirkung des schnellen <strong>und</strong> des langsamen Sonnenwindes unterschei-<br />
Figure 11.24: Struktur des solaren Magnetfeldes über einen halben magnetischen<br />
Zyklus.<br />
det sich deutlich in verschiedenen Stadien des Sonnenaktivitätszyklus, unter<br />
anderem wegen der verschobenen Quellregionen, der veränderten Neigung der<br />
Stromschicht, aber auch der Abnahme der Fläche der koronalen Löcher <strong>und</strong> der<br />
zunehmenden Bedeutung der Streamers. Gegen das Aktivitätsmaximum hin<br />
erscheint die Heliosphäre grossräumig nahezu strukturlos, sie wird in allen Breiten<br />
von langsamem Sonnenwind <strong>und</strong> vereinzelten schnellen Strömen aufgefüllt.Sporadisch<br />
auftretende koronale Massenauswürfe übernehmen die Rolle der korotierenden<br />
Wechselwirkungsregionen in der Strukturierung <strong>und</strong> in der Beschleunigung energetischer<br />
Teilchen.<br />
Die langsamen Variationen wirken sich auch auf andere Grössen im Sonnensystem<br />
aus, deren Messung aber nicht unbedingt einfach ist. Die leicht<br />
erhöhte Magnetfeldstärke hat z. B. einen Einfluss auf die Alfvéngeschwindigkeit<br />
<strong>und</strong> damit auf die Ausbreitung von Wellen <strong>und</strong> Schocks in der Heliosphäre.<br />
Insbesondere die noch zu behandelnde galaktische kosmische Strahlung wird<br />
auf ganz andere Art <strong>und</strong> Weise moduliert, je nach Aktivitätsstadium. Die<br />
Aktivität der Sonne äussert sich auch in einer wesentlich erhöhten Rate von<br />
koronalen Massenauswürfen (coronal mass ejections, CMEs), welche im kom-
194 CHAPTER 11. HELIOSPHERE<br />
menden Kapitel (??) behandelt werden.<br />
Figure 11.25: Häufigkeit von koronalen Massenauswürfen auf der Sonne in<br />
Funktion der Sonnenfleckenzahl.<br />
11.5 The outer heliosphere<br />
11.5.1 Voyager Results<br />
include termination shock story<br />
11.5.2 Pickup ions<br />
11.5.3 The magnetic field<br />
11.5.4 Energy Considerations
Chapter 12<br />
Solar Terrestrial Physics<br />
12.1 Space Weather<br />
12.2 Solar Activity<br />
12.2.1 Remote Observations<br />
12.2.2 Radio Observations<br />
12.2.3 In-situ Observations<br />
12.2.4 Particle Acceleration at the Sun<br />
• GOES X-ray fluxes<br />
• RHESSI results<br />
• flare accelerated particles (impulsive events) in-situ measurments<br />
• particle transport<br />
• onset times, injection times, solar relrease time<br />
12.3 Magnetospheric Response<br />
• storms<br />
• substorms<br />
• entry through polar cusps<br />
195
196 CHAPTER 12. SOLAR TERRESTRIAL PHYSICS<br />
12.4 Ionospheric response<br />
• aurora<br />
• conductivity, electron content<br />
• problems with radio transmission and GPS encoding<br />
12.5 Heliospheric Response<br />
12.5.1 Shock Formation<br />
12.5.2 Particle Acceleration at Shocks<br />
12.5.3 Forbush Decreases<br />
12.6 Solar Energetic Particles<br />
12.6.1 Properties<br />
• gradual vs. impulsive<br />
• magnetic connection<br />
• distribution functions<br />
• composition<br />
12.6.2 Transport Processes<br />
• Parker transport equation<br />
• focussed transport equation<br />
• Fokker-Planck formalism<br />
12.6.3 Archives for SEPs?<br />
• SEPs in lunar soils, asteroidal regoliths, and IDPs<br />
• quantifications of fluxes<br />
• problems with that interpretation<br />
• open issues and how to address them
12.7. IMPLICATIONS FOR SOCIETY 197<br />
12.7 Implications for Society<br />
• activity in the past?<br />
• ice-core information
198 CHAPTER 12. SOLAR TERRESTRIAL PHYSICS
Chapter 13<br />
Galactic Cosmic Rays<br />
13.1 Discovery of Cosmic Rays<br />
• ?<br />
• ?<br />
• ?<br />
• ?<br />
13.2 Observations of Cosmic Rays<br />
• energetic: tail extends beyond 10 9 GeV<br />
• isotropic outside heliosphere<br />
• modulation: refer to section 13.5<br />
• flux at Earth: 4 cm −2 s −1 at solar activity minimum, 2 cm −2 s −1 at solar<br />
activity maximum<br />
• dose: refer to chapter 14: 10 rad at solar activity minimum, 4 rad at<br />
solar activity maximum<br />
13.2.1 methods<br />
• Earth based methods<br />
– air showers<br />
– neutron monitors<br />
199
200 CHAPTER 13. GALACTIC COSMIC RAYS<br />
– muon telescopes<br />
• space-shuttle based<br />
• ISS based<br />
• satellite based<br />
• interplanetary spacecraft based: refer to section 13.4<br />
13.3 Origin of the GCR<br />
• ?<br />
• ?<br />
• ?<br />
13.3.1 FIP vs. volatility<br />
13.3.2 The Anomalous Component of Cosmic Radiation<br />
(ACR)<br />
13.3.3 Solar Cosmic Rays<br />
refer to chapter on SEPs.<br />
13.3.4 The Greisen-Zatsepin-Kuzmin Cutoff Problem<br />
At energies exceeding sin(3 − 5) · 10 10 GeV, the interaction of the GCR with<br />
the CMBR should lead to a decrease in the GCR intensity. This is not seen<br />
or only very weakly seen. The reason is not <strong>und</strong>erstood.<br />
13.4 Measurements of GCR in the Heliosphere<br />
13.4.1 GCR composition<br />
• hadronic component<br />
– comparison with solar system composition<br />
– interaction in atmosphere: primary and secondary components<br />
– interaction on the way to Earth
13.5. GCR MODULATION 201<br />
• X-rays and γ-rays<br />
• electrons and positrons<br />
• neutrinos and antineutrinos<br />
13.5 GCR Modulation<br />
13.5.1 Modulation Models<br />
Potgieter et al.<br />
Ferreira et al.<br />
13.5.2 Particle Drifts<br />
13.5.3 Diffusion<br />
13.5.4 Mean Free Paths<br />
13.5.5 Microscopic Origin of Transport Parameters<br />
see chapter on kinetic physics:<br />
• waves,<br />
• instabilities<br />
• turbulence<br />
• wave-particle interaction<br />
13.5.6 Kinetic Models<br />
13.6 GCRs at Earth<br />
• neutron monitors<br />
• historical flux?<br />
• cosmogenic isotopes and dating methods<br />
• terminology: pp 20ff in Grieder
202 CHAPTER 13. GALACTIC COSMIC RAYS
Chapter 14<br />
Dosimetry<br />
14.1 Interaction of Charged Particles with Matter<br />
14.1.1 Ionization: Bethe-Bloch<br />
minimally ionizing particles, MIPs<br />
muons<br />
Exercise 14.1 Using the expression for Bethe-Bloch, calculate the location<br />
and extent of the Pfotzer maximum on Earth and on Mars. Hint: Use COSPAR<br />
standard atmosphere as introduced in section 6.5.<br />
14.1.2 Other Interactions<br />
• Bremsstrahlung<br />
• Pair-production<br />
• nuclear interactions<br />
203
204 CHAPTER 14. DOSIMETRY<br />
14.1.3 cascades<br />
14.1.4 air showers<br />
14.1.5 GEANT<br />
14.2 Ionizing Radiation<br />
14.2.1 Biological Effects<br />
14.2.2 Dosimetry<br />
• Dose<br />
• Effective Dose<br />
14.2.3 Measurement Techniques<br />
• MSL/RAD<br />
• Dostel<br />
• TEPC<br />
• Matroshka<br />
• other?<br />
14.3 Example: A Manned Mission to Mars<br />
• Is there time to hide?<br />
• shielding<br />
– from SEPs<br />
– From GCR<br />
• Total Dose as a function of solar cycle<br />
• Exposure at the Martian Surface<br />
– Pfotzer-Maximum<br />
– Digging Under<br />
– Life Expectancy
14.3. EXAMPLE: A MANNED MISSION TO MARS 205<br />
Exercise 14.2 Calculate the radiation exposure for an astronaut on a journey<br />
from Earth to Mars. Should shielding from GCR be attempted? Should it be<br />
attempted for solar energetic particle events?
206 CHAPTER 14. DOSIMETRY
Bibliography<br />
Arnaud, M. and J. Raymond: “Iron ionization and recombination rates and<br />
ionization equilibrium”. Astrophysical Journal, 398, (1992), 394–406.<br />
Arnaud, M. and R. Rothenflug: “An updated evaluation of recombination and<br />
ionization rates”. Astron. Astrophys. Suppl. Ser., 60, (1985), 425 – 457.<br />
Auer, S.: “Instrumentation”. In “Interplanetary Dust”, edited by E. Grün,<br />
S. G. B. Å S. F. Dermott, and H. Fechtig. Springer (2001). 385 – 444.<br />
Bame, S. J., J. R. Asbridge, W. C. Feldman, and J. T. Gosling: “Evidence<br />
for a structure-free state at high solar wind speeds”. J. Geophys. Res., 82,<br />
(1977), 1487 – 1492.<br />
Bame, S. J., B. E. Goldstein, J. T. Gosling, J. W. Harvey, D. J. McComas,<br />
M. Neugebauer, and J. L. Phillips: “Ulysses observations of a recurrent high<br />
speed solar wind stream and the heliomagnetic streamer belt”. Geophys. Res.<br />
Lett., 20, (1993), 2323 – 2326.<br />
Binney, J. and M. Merrifield: Galactic Astronomy. Princeton University Press,<br />
Princeton, New Jersey (1998).<br />
Bohren, C. F. and D. R. Huffman: Absorption and Scattering of Light by Small<br />
Particles. John Wiley & Sons, New York, USA (1983).<br />
Bonetti, A., H. S. Bridge, A. J. Lazarus, E. F. Rossi, and F. Scherb: “Explorer<br />
10 plasma measurements”. J. Geophys. Res., 68, (1963), 4017 – 4063.<br />
Borg, J., J. Chaumont, C. jouret, Y. Langevin, and M. Maurette: “Solar wind<br />
radiation damage in lunar dust grains and the characteristics of the ancient<br />
solar wind”. In “The Ancient Sun”, edited by R. O. Pepin, J. A. Eddy, and<br />
R. B. Merrill, Geochim. Cosmochim. Acta Suppl. 13 (1980). 431 – 461.<br />
Borrini, G., J. M. Wilcox, J. T. Gosling, S. J. Bame, and W. C. Feldman:<br />
“Solar wind helium and hydrogen structure near the heliospheric current<br />
207
208 BIBLIOGRAPHY<br />
sheet: A signal of coronal streamers at 1 AU”. J. Geophys. Res., 86, (1981),<br />
4565 – 4573.<br />
Burbridge, E. M., G. R. Burbridge, W. F. Fowler, and F. Hoyle: “Synthesis of<br />
the elements in stars”. Rev. Mod. Phys., 29, (1957), 547 – 650.<br />
Burns, J. A., P. H. Lamy, and S. Soter: “Radiation forces on small particles<br />
in the solar system”. Icarus, 40, (1979), 1 – 48.<br />
Cameron, A. G. W.: “Chalk river report, CRL-41”. Technical report, Atomic<br />
Energy of Canada (1957).<br />
Del Zanna, G., B. J. I. Bromage, and H. E. Mason: “Elemental ab<strong>und</strong>ances of<br />
the low corona as derived from soho/cds observations”. In “Solar and Galactic<br />
Composition”, edited by R. F. Wimmer-Schweingruber. AIP conference<br />
proceedings, Melville, NY (2001). 59 – 64.<br />
Draine, B. T.: “Tabulated optical properties of graphite and silicate grains”.<br />
Astrophys. J. Suppl. Ser., 57, (1985), 587 – 594.<br />
Fechtig, H., C. Leinert, and O. E. Berg: “Historical perspectives”. In “Interplanetary<br />
Dust”, edited by E. Grün, S. G. B. Å S. F. Dermott, and<br />
H. Fechtig. Springer (2001). 1 – 55.<br />
Field, G. B.: “Interstellar ab<strong>und</strong>ances: Gas and dust”. Astrophys. J., 187,<br />
(1974), 453 – 459.<br />
Fujiwara, A., G. Kamimoto, and A. Tsukamoto: “Destruction of basaltic bodies<br />
by high-velocity impact”. Icarus, 31, (1977), 277 – 288.<br />
Golub, L. and J. M. Pasachoff: The Solar Corona.<br />
Press, Cambridge, UK (1997).<br />
Cambridge University<br />
Gosling, J. T., S. J. Bame, W. C. Feldman, D. J. McComas, P. Riley, B. E.<br />
Goldstein, and M. Neugebauer: “The nothern edge of the band of solar<br />
variability: Ulysses at ∼ 4.5 AU”. Geophys. Res. Lett., 24, (1997), 309 –<br />
312.<br />
Gosling, J. T., G. Borrini, J. R. Asbridge, S. J. Bame, W. C. Feldman, and<br />
R. F. Hansen: “Coronal streamers in the solar wind at 1 AU”. J. Geophys.<br />
Res., 86, (1981), 5438 – 5448.<br />
Grevesse, N. and A. J. Sauval: “Standard solar composition”. Space Sci. Rev.,<br />
85, (1998), 161 – 174.
BIBLIOGRAPHY 209<br />
Gringauz, K. I.: “Some results of experiments in interplanetary space by means<br />
of charged particle traps on Soviet space probes”. Space Res., 2, (1961), 539<br />
– 553.<br />
Gringauz, K. I., V. V. Bezrikikh, and L. S. Musatov: “Solar wind observations<br />
with the Venus 3 probe”. Cosmic Research, 5, (1967), 216 – 222.<br />
Gringauz, K. I., V. V. Bezrukikh, V. D. Ozerov, and R. E. Rybchinskyi: “Study<br />
of the interplanetary ionized gas, high energy electrons, and solar corpuscular<br />
radiation by means of three electrode traps for charged particles on the<br />
second Soviet cosmic rocket”. Soviet Physics Doklady, 5, (1960), 361 – 364.<br />
Grün, E., H. A. Zook, H. Fechtig, and R. H. Giese: “Collisional balance of the<br />
meteoritic complex”. Icarus, 62, (1985), 244 – 272.<br />
Hirzberger, J., J. A. Bonet, M. Vasquez, and A. Hanslmeier: “Time series of<br />
solar granulation images. ii. evolution of individual granules”. Astrophys. J.,<br />
515, (1999), 441 – 454.<br />
Hirzberger, J., M. Vazquez, J. A. Bonet, A. Hanslmeier, and M. Sobotka:<br />
“Time Series of Solar Granulation Images. I. Differences between Small and<br />
Large Granules in Quiet Regions”. Astrophys. J., 480, (1997), 406 – 419.<br />
Holweger, H.: “Photospheric ab<strong>und</strong>ances: Problems, updates, implications”.<br />
In “Solar and Galactic Composition”, edited by R. F. Wimmer-<br />
Schweingruber. AIP conference proceedings, Melville, NY (2001). 23 – 30.<br />
H<strong>und</strong>hausen, A. J.: Coronal Expansion and Solar Wind.<br />
Berlin, Heidelberg, New York (1972).<br />
Springer Verlag,<br />
Krieger, A. S., A. F. Timothy, and E. C. Roelof: “A coronal hole and its<br />
identification as the source of a high velocity solar wind stream”. Sol. Phys.,<br />
29, (1973), 505 – 525.<br />
Landau, L. D. and E. M. Lifschitz:<br />
Akademie Verlag Berlin (1981).<br />
Lehrbuch der theoretischen <strong>Physik</strong>.<br />
Leighton, R. B.: “The solar granulation”. Annu. Rev. Astron. Astrophys., 1,<br />
(1963), 19 – 40.<br />
Lodders, K. and B. Fegely, Jr. (eds.): The planetary scientist’s companion.<br />
Oxford University Press, Oxford (1998).<br />
Mazzotta, P., G. Mazzitelli, S. Colafrancesco, and N. Vittorio: “Ionization<br />
balance for optically thin plasmas: Rate coefficients for all atoms and ions<br />
of the elements h to ni”. Astron. Astrophys. Suppl., 133, (1998), 403 – 409.
210 BIBLIOGRAPHY<br />
Morton, D. C.: “Interstellar ab<strong>und</strong>ances toward ζ Ophiuci”. Astrophys. J.,<br />
193, (1974), L35 – L39.<br />
Morton, D. C.: “Interstellar absorption lines in the spectrum of zeta Ophiuci”.<br />
Astrophys. J., 197, (1975), 85 – 115.<br />
Mukai, T., J. Blum, A. M. Nakamura, R. J. Johnson, and O. Havnes: “Physical<br />
processes on interplanetary dust”. In “Interplanetary Dust”, edited by<br />
E. Grün, S. G. B. Å S. F. Dermott, and H. Fechtig. Springer (2001). 445 –<br />
507.<br />
Nesis, A., R. Hammer, M. Roth, and H. Schleicher: “Dynamics of the solar<br />
granulation”. Astron. Astrophys., 317, (2001), 307 – 317.<br />
Neugebauer, M. and C. W. Snyder: “Mariner 2 observations of the solar wind,<br />
1, average properties”. J. Geophys. Res., 71, (1966), 4469 – 4484.<br />
Nolte, J. T., A. S. Krieger, A. F. Timothy, R. E. Gold, E. C. Roelof, G. Vaiana,<br />
A. J. Lazarus, J. D. Sullivan, and P. S. McIntosh: “Coronal holes as sources<br />
of solar wind”. Sol. Phys., 46, (1976), 303 – 322.<br />
Pagel, B. E.: Nucleosynthesis and chemical evolution of galaxies. Cambridge<br />
University Press, Cambridge, UK (1997).<br />
Rieutord, M., T. Roudier, J. M. Malherbe, and F. Rincon: “On mesogranulation,<br />
network formation and supergranulation”. Astron. Astrophys., 357,<br />
(2000), 1063 – 1072.<br />
Scherb, F.: “Velocity distributions of the interplanetary plasma detected by<br />
Explorer 10”. Space Res., 4, (1964), 797 – 818.<br />
Sekanina, Z.: “Solar and heliospheric observatory sungrazing comets with<br />
prominent tails: Evidence on dust-production peculiarities”. Astrophys. J.,<br />
545, (2000), L69 – L72.<br />
Snyder, C. W. and M. Neugebauer: “Interplanetary solar wind measurements<br />
by Mariner 2”. Space Res., 4, (1964), 89 – 113.<br />
Stix, M.: The Sun. Springer, Berlin (2002). Second edition.<br />
Wallerstein, G., I. Iben Jr., P. Parker, A. M. B. G. M. Hale, A. E. Champagne,<br />
C. A. Barnes, F. Käppeler, V. V. Smith, R. D. Hoffman, F. X. Timmes, et al.:<br />
“Synthesis of the elements in stars: forty years of progress”. Rev. Mod. Phys.,<br />
69, (1997), 995 – 1084.
BIBLIOGRAPHY 211<br />
Wilson, T. L. and F. Matteucci: “Ab<strong>und</strong>ances in the interstellar medium”.<br />
Astron. Astrophys. Rev., 4, (1992), 1 – 33.<br />
Wilson, T. L. and R. T. Rood: “Ab<strong>und</strong>ances in the interstellar medium”.<br />
Annu. Rev. Astron. Astrophys., 32, (1994), 191 – 226.