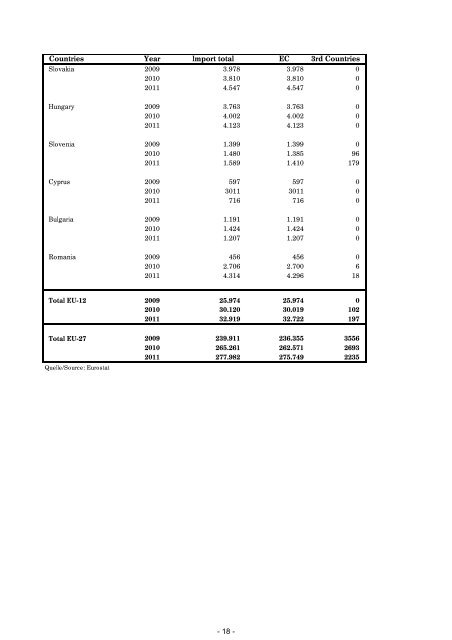
Countries Year Import total EC 3rd Countries Slovakia 2009 3.978 3.978 0 2010 3.810 3.810 0 <strong>2011</strong> 4.547 4.547 0 Hungary 2009 3.763 3.763 0 2010 4.002 4.002 0 <strong>2011</strong> 4.123 4.123 0 Slovenia 2009 1.399 1.399 0 2010 1.480 1.385 96 <strong>2011</strong> 1.589 1.410 179 Cyprus 2009 597 597 0 2010 3011 3011 0 <strong>2011</strong> 716 716 0 Bulgaria 2009 1.191 1.191 0 2010 1.424 1.424 0 <strong>2011</strong> 1.207 1.207 0 Romania 2009 456 456 0 2010 2.706 2.700 6 <strong>2011</strong> 4.314 4.296 18 Total EU-12 2009 25.974 25.974 0 2010 30.120 30.019 102 <strong>2011</strong> 32.919 32.722 197 Total EU-27 2009 239.911 236.355 3556 2010 265.261 262.571 2693 <strong>2011</strong> 277.982 275.749 2235 Quelle/Source: Eurostat - 18 -
EU 27 EXPORTS OF PROCESSED CHEESE - 2010:<strong>2011</strong> - in tons France Germany Netherlands Belgium Luxembourg 2010 <strong>2011</strong> % 2010 <strong>2011</strong> % 2010 <strong>2011</strong> % 2010 <strong>2011</strong> % 2010 <strong>2011</strong> % France 19.556 20.381 4,2 58 43 100,0 664 862 29,8 9 176 100,0 Germany 3.577 5.746 60,6 246 214 -13,0 52 394 657,7 3.865 2.133 -44,8 Belgium 6.876 7.784 13,2 5.853 5.077 -13,3 1.035 1.293 24,9 21 18 -14,3 Luxembourg 3.920 2.292 -41,5 104 98 -5,8 2 1 100,0 738 754 2,2 Netherlands 276 292 5,8 4.377 4.919 12,4 3.186 2.600 -18,4 0 0 Italy 2.680 2.685 0,2 6.123 5.615 -8,3 580 520 -10,3 26.762 25.990 -2,9 0 0 United Kingdom 6.092 7.295 19,7 5.524 5.904 6,9 44 61 38,6 17.421 16.014 -8,1 0 0 Ireland 6 5 -16,7 1.033 1.061 2,7 5 9 80,0 0 0 0 0 Denmark 59 79 33,9 936 827 -11,6 10 4 -60,0 355 382 7,6 0 0 Spain 10.414 11.591 11,3 6.993 7.335 4,9 37 30 -18,9 5.577 7.762 39,2 0 0 Portugal 1.233 1.205 -2,3 1.125 1.084 -3,6 155 134 -13,5 0 0 0 0 Greece 1.589 1.458 -8,2 1.894 1.659 -12,4 52 0 -100,0 40 44 10,0 0 0 Sweden 960 1.003 4,5 1.119 2.473 121,0 27 50 85,2 0 0 0 0 Finland 11 12 9,1 1.328 1.513 13,9 14 20 42,9 0 0 0 0 Austria 165 1.165 606,1 4.631 3.944 -14,8 0 0 19 0 -100,0 0 0 Malta 365 614 68,2 101 135 33,7 3 4 33,3 15 11 -26,7 0 0 Estonia 1 1 0,0 0 95 2 3 0 0 0 0 Latvia 1 1 0,0 207 289 39,6 0 0 0 0 0 0 Lithuania 55 66 20,0 2 4 100,0 0 0 0 0 0 0 Poland 83 15 100,0 3.127 3.258 4,2 1 3 200,0 0 0 0 0 Czech. Republic 357 510 42,9 2.216 2.439 10,1 8 23 187,5 0 0 0 0 Slovakia 25 8 -68,0 970 1.228 100,0 0 0 0 0 0 0 Hungary 49 138 181,6 2.170 2.268 4,5 5 7 100,0 0 0 0 0 Slovenia 22 18 -18,2 588 635 8,0 1 11 1.000,0 1 0 -100,0 0 0 Cyprus 484 609 25,8 121 226 86,8 10 17 70,0 0 0 0 0 Bulgaria 145 120 -17,2 472 761 61,2 8 23 187,5 0 0 0 0 Romania 50 57 14,0 849 1.311 54,4 0 0 11 8 0 0 EC-15 total 37.858 42.612 12,6 60.596 61.890 2,1 2.265 2.379 5,0 54.814 54.802 0,0 3.895 2.327 -40,3 EC-12 total 1.637 2.157 31,8 10.823 12.649 16,9 38 91 139,5 27 19 -29,6 0 0 EC-27 total 39.495 44.769 13,4 71.419 74.539 4,4 2.303 2.470 7,3 54.841 54.821 0,0 3.895 2.327 -40,3 Switzerland 1181 1124 -4,8 1.443 1.693 17,3 0 6 0 1 100,0 0 0 Russian Fed. 11 22 100,0 867 1.600 100,0 18 26 44,4 0 0 0 0 Algeria 4 75 100,0 13 0 100,0 9 17 88,9 0 0 0 0 Libya 368 503 36,7 306 128 -58,2 13 6 -53,8 0 0 0 0 Egypt 0 2 4 0 100,0 38 31 -18,4 0 0 0 0 Lebanon 1245 575 -53,8 4 6 50,0 43 18 -58,1 0 0 0 0 Jordan 4 2 -50,0 0 0 753 667 -11,4 0 0 0 0 Saudi Arabia 3271 2556 -21,9 3 0 100,0 69 25 -63,8 0 0 0 0 Kuwait 686 425 -38,0 4 2 100,0 103 126 22,3 0 0 0 0 Unit. Arab. Emirates 623 645 3,5 0 3 297 192 -35,4 0 0 0 0 USA 288 1334 363,2 698 751 7,6 1.124 1.103 -1,9 0 16 100,0 0 0 Canada 265 247 -6,8 1 0 -100,0 165 181 9,7 0 0 0 0 Japan 6346 6713 5,8 6 8 33,3 140 114 -18,6 0 0 0 0 3rd Countries total 19.212 19.658 2,3 5.180 6.045 16,7 5.519 5.345 -3,2 11 48 336,4 0 0 Total 58.707 64.427 9,7 76.599 80.584 5,2 7.822 7.815 -0,1 54.852 54.869 0,0 3.895 2.327 -40,3 - 19 -
- Seite 1 und 2: RAPPORT ANNUEL ANNUAL REPORT JAHRES
- Seite 3 und 4: INHALTSVERZEICHNIS Seite Zum Geleit
- Seite 5 und 6: 1 INTERNATIONALE WIRTSCHAFTLICHE EN
- Seite 7 und 8: • Der Kurs des Dollars Der Kurs d
- Seite 9 und 10: • Milchmarktausgaben Die Milchmar
- Seite 11 und 12: 3 EUROPÄISCHE UNION • Der Lissab
- Seite 13 und 14: • Beratender Ausschuss „Milch
- Seite 15 und 16: ASSIFONTE Association de l´industr
- Seite 17 und 18: Countries Year Export total EC 3rd
- Seite 19: Countries Year Import total EC 3rd
- Seite 23 und 24: EU 27 EXPORTS OF PROCESSED CHEESE -
- Seite 25 und 26: EU 27 EXPORTS OF PROCESSED CHEESE -
- Seite 27 und 28: EU 27 IMPORTS OF PROCESSED CHEESE -
- Seite 29 und 30: EU 27 IMPORTS OF PROCESSED CHEESE -
- Seite 31 und 32: EU 27 IMPORTS OF PROCESSED CHEESE -
- Seite 33 und 34: Austria Exports, in t 2010 2011 Cou
- Seite 35 und 36: 2010 2011 Countries Processed Proce
- Seite 37 und 38: Belgium Imports, in t 2010 2011 Cou
- Seite 39 und 40: Cyprus Imports, in t 2010 2011 Coun
- Seite 41 und 42: Denmark Exports, in t 2010 2011 Cou
- Seite 43 und 44: Germany Exports, in t 2010 2011 Cou
- Seite 45 und 46: Germany Imports, in t 2010 2011 Cou
- Seite 47 und 48: Finland Exports, in t 2010 2011 Cou
- Seite 49 und 50: Countries Processed Processed Emmen
- Seite 51 und 52: Greece Imports, in t 2010 2011 Proc
- Seite 53 und 54: Ireland Exports, in t 2010 2011 Cou
- Seite 55 und 56: Italy Exports, in t 2010 2011 Count
- Seite 57 und 58: Latvia Imports, in t Countries Proc
- Seite 59 und 60: Luxembourg Imports, in t 2010 2011
- Seite 61 und 62: Netherlands Imports, in t 2010 2011
- Seite 63 und 64: Countries Processed Processed Emmen
- Seite 65 und 66: Countries Processed Processed Emmen
- Seite 67 und 68: Romania Imports, in t 2010 2011 Cou
- Seite 69 und 70: Slovenia Imports, in t 2010 2011 Co
- Seite 71 und 72:
Sweden Imports, in t 2010 2011 Coun
- Seite 73:
Countries Processed Processed Emmen