Wasserversorgung und Abwasserbeseitigung im ... - Brandenburg.de
Wasserversorgung und Abwasserbeseitigung im ... - Brandenburg.de
Wasserversorgung und Abwasserbeseitigung im ... - Brandenburg.de

Sie wollen auch ein ePaper? Erhöhen Sie die Reichweite Ihrer Titel.
YUMPU macht aus Druck-PDFs automatisch weboptimierte ePaper, die Google liebt.
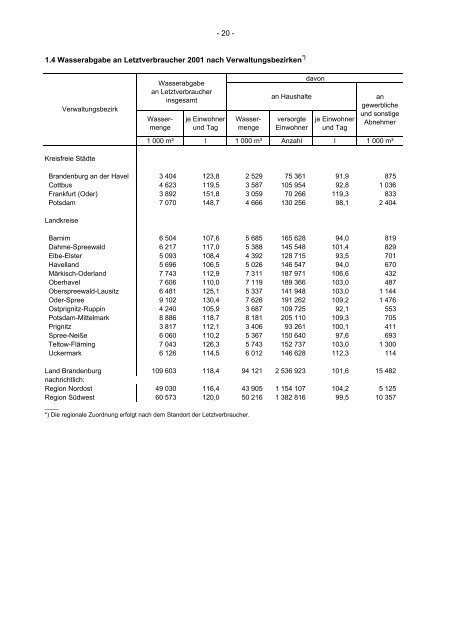
- 20 -<br />
1.4 Wasserabgabe an Letztverbraucher 2001 nach Verwaltungsbezirken *)<br />
Kreisfreie Städte<br />
1 000 m³ l 1 000 m³ Anzahl l 1 000 m³<br />
<strong>Bran<strong>de</strong>nburg</strong> an <strong>de</strong>r Havel 3 404 123,8 2 529 75 361 91,9 875<br />
Cottbus 4 623 119,5 3 587 105 954 92,8 1 036<br />
Frankfurt (O<strong>de</strong>r) 3 892 151,8 3 059 70 266 119,3 833<br />
Potsdam 7 070 148,7 4 666 130 256 98,1 2 404<br />
Landkreise<br />
Verwaltungsbezirk<br />
Wasserabgabe<br />
an Letztverbraucher<br />
insgesamt<br />
Wassermenge<br />
je Einwohner<br />
<strong>und</strong> Tag<br />
Wassermenge<br />
an Haushalte<br />
versorgte<br />
Einwohner<br />
davon<br />
je Einwohner<br />
<strong>und</strong> Tag<br />
an<br />
gewerbliche<br />
<strong>und</strong> sonstige<br />
Abnehmer<br />
Barn<strong>im</strong> 6 504 107,6 5 685 165 628 94,0 819<br />
Dahme-Spreewald 6 217 117,0 5 388 145 548 101,4 829<br />
Elbe-Elster 5 093 108,4 4 392 128 715 93,5 701<br />
Havelland 5 696 106,5 5 026 146 547 94,0 670<br />
Märkisch-O<strong>de</strong>rland 7 743 112,9 7 311 187 971 106,6 432<br />
Oberhavel 7 606 110,0 7 119 189 366 103,0 487<br />
Oberspreewald-Lausitz 6 481 125,1 5 337 141 948 103,0 1 144<br />
O<strong>de</strong>r-Spree 9 102 130,4 7 626 191 262 109,2 1 476<br />
Ostprignitz-Ruppin 4 240 105,9 3 687 109 725 92,1 553<br />
Potsdam-Mittelmark 8 886 118,7 8 181 205 110 109,3 705<br />
Prignitz 3 817 112,1 3 406 93 261 100,1 411<br />
Spree-Neiße 6 060 110,2 5 367 150 640 97,6 693<br />
Teltow-Fläming 7 043 126,3 5 743 152 737 103,0 1 300<br />
Uckermark 6 126 114,5 6 012 146 628 112,3 114<br />
Land <strong>Bran<strong>de</strong>nburg</strong> 109 603 118,4 94 121 2 536 923 101,6 15 482<br />
nachrichtlich:<br />
Region Nordost 49 030 116,4 43 905 1 154 107 104,2 5 125<br />
Region Südwest 60 573 120,0 50 216 1 382 816 99,5 10 357<br />
____<br />
*) Die regionale Zuordnung erfolgt nach <strong>de</strong>m Standort <strong>de</strong>r Letztverbraucher.