Annual Report (PDF) - Feintool
Annual Report (PDF) - Feintool
Annual Report (PDF) - Feintool

You also want an ePaper? Increase the reach of your titles
YUMPU automatically turns print PDFs into web optimized ePapers that Google loves.
26<br />
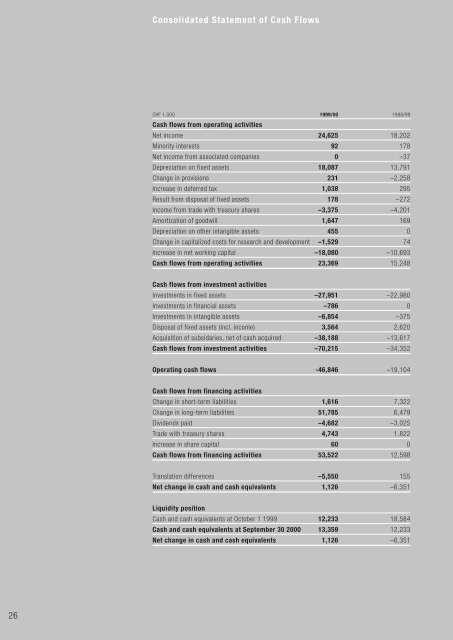
Consolidated Statement of Cash Flows<br />
CHF 1,000 1999/00 1998/99<br />
Cash flows from operating activities<br />
Net income 24,625 18,202<br />
Minority interests 92 178<br />
Net income from associated companies 0 –37<br />
Depreciation on fixed assets 18,087 13,791<br />
Change in provisions 231 –2,258<br />
Increase in deferred tax 1,038 295<br />
Result from disposal of fixed assets 178 –272<br />
Income from trade with treasury shares –3,375 –4,201<br />
Amortization of goodwill 1,647 169<br />
Depreciation on other intangible assets 455 0<br />
Change in capitalized costs for research and development –1,529 74<br />
Increase in net working capital –18,080 –10,693<br />
Cash flows from operating activities 23,369 15,248<br />
Cash flows from investment activities<br />
Investments in fixed assets –27,951 –22,980<br />
Investments in financial assets –786 0<br />
Investments in intangible assets –6,854 –375<br />
Disposal of fixed assets (incl. income) 3,564 2,620<br />
Acquisition of subsidaries, net of cash acquired –38,188 –13,617<br />
Cash flows from investment activities –70,215 –34,352<br />
Operating cash flows -46,846 –19,104<br />
Cash flows from financing activities<br />
Change in short-term liabilities 1,616 7,322<br />
Change in long-term liabilities 51,785 6,479<br />
Dividends paid –4,682 –3,025<br />
Trade with treasury shares 4,743 1,822<br />
Increase in share capital 60 0<br />
Cash flows from financing activities 53,522 12,598<br />
Translation differences –5,550 155<br />
Net change in cash and cash equivalents 1,126 –6,351<br />
Liquidity position<br />
Cash and cash equivalents at October 1 1999 12,233 18,584<br />
Cash and cash equivalents at September 30 2000 13,359 12,233<br />
Net change in cash and cash equivalents 1,126 –6,351