Annual Report (PDF) - Feintool
Annual Report (PDF) - Feintool
Annual Report (PDF) - Feintool

You also want an ePaper? Increase the reach of your titles
YUMPU automatically turns print PDFs into web optimized ePapers that Google loves.
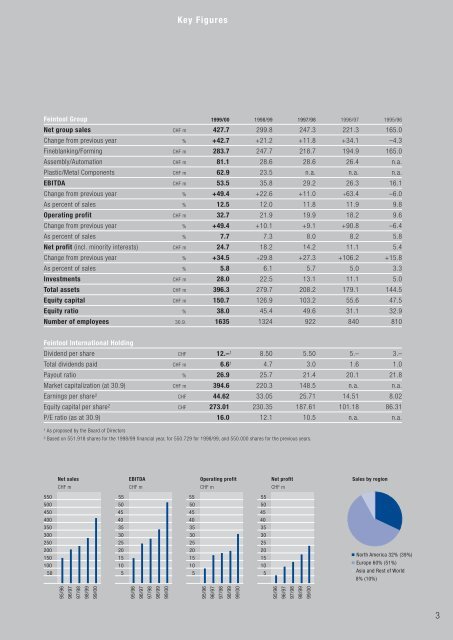
<strong>Feintool</strong> Group 1999/00 1998/99 1997/98 1996/97 1995/96<br />
Net group sales CHF m 427.7 299.8 247.3 221.3 165.0<br />
Change from previous year % +42.7 +21.2 +11.8 +34.1 –4.3<br />
Fineblanking/Forming CHF m 283.7 247.7 218.7 194.9 165.0<br />
Assembly/Automation CHF m 81.1 28.6 28.6 26.4 n.a.<br />
Plastic/Metal Components CHF m 62.9 23.5 n.a. n.a. n.a.<br />
EBITDA CHF m 53.5 35.8 29.2 26.3 16.1<br />
Change from previous year % +49.4 +22.6 +11.0 +63.4 –6.0<br />
As percent of sales % 12.5 12.0 11.8 11.9 9.8<br />
Operating profit CHF m 32.7 21.9 19.9 18.2 9.6<br />
Change from previous year % +49.4 +10.1 +9.1 +90.8 –6.4<br />
As percent of sales % 7.7 7.3 8.0 8.2 5.8<br />
Net profit (incl. minority interests) CHF m 24.7 18.2 14.2 11.1 5.4<br />
Change from previous year % +34.5 +29.8 +27.3 +106.2 +15.8<br />
As percent of sales % 5.8 6.1 5.7 5.0 3.3<br />
Investments CHF m 28.0 22.5 13.1 11.1 5.0<br />
Total assets CHF m 396.3 279.7 208.2 179.1 144.5<br />
Equity capital CHF m 150.7 126.9 103.2 55.6 47.5<br />
Equity ratio % 38.0 45.4 49.6 31.1 32.9<br />
Number of employees 30.9. 1635 1324 922 840 810<br />
<strong>Feintool</strong> International Holding<br />
Dividend per share CHF 12.– 1 8.50 5.50 5.– 3.–<br />
Total dividends paid CHF m 6.6 1 4.7 3.0 1.6 1.0<br />
Payout ratio % 26.9 25.7 21.4 20.1 21.8<br />
Market capitalization (at 30.9) CHF m 394.6 220.3 148.5 n.a. n.a.<br />
Earnings per share 2 CHF 44.62 33.05 25.71 14.51 8.02<br />
Equity capital per share 2 CHF 273.01 230.35 187.61 101.18 86.31<br />
P/E ratio (as at 30.9) 16.0 12.1 10.5 n.a. n.a.<br />
1 As proposed by the Board of Directors<br />
2 Based on 551.918 shares for the 1998/99 financial year, for 550.729 for 1998/99, and 550.000 shares for the previous years.<br />
550<br />
500<br />
450<br />
400<br />
350<br />
300<br />
250<br />
200<br />
150<br />
100<br />
50<br />
Net sales<br />
CHF m<br />
95/96<br />
96/97<br />
97/98<br />
98/99<br />
99/00<br />
55<br />
50<br />
45<br />
40<br />
35<br />
30<br />
25<br />
20<br />
15<br />
10<br />
5<br />
EBITDA<br />
CHF m<br />
95/96<br />
96/97<br />
97/98<br />
98/99<br />
99/00<br />
Key Figures<br />
55<br />
50<br />
45<br />
40<br />
35<br />
30<br />
25<br />
20<br />
15<br />
10<br />
5<br />
Operating profit<br />
CHF m<br />
95/96<br />
96/97<br />
97/98<br />
98/99<br />
99/00<br />
55<br />
50<br />
45<br />
40<br />
35<br />
30<br />
25<br />
20<br />
15<br />
10<br />
5<br />
Net profit<br />
CHF m<br />
95/96<br />
96/97<br />
97/98<br />
98/99<br />
99/00<br />
Sales by region<br />
� North America 32% (39%)<br />
� Europe 60% (51%)<br />
� Asia and Rest of World<br />
8% (10%)<br />
3