Annual Report (PDF) - Feintool
Annual Report (PDF) - Feintool
Annual Report (PDF) - Feintool

You also want an ePaper? Increase the reach of your titles
YUMPU automatically turns print PDFs into web optimized ePapers that Google loves.
36<br />
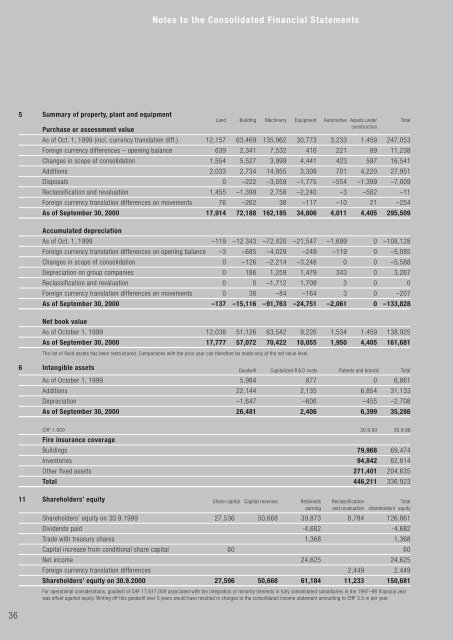
5 Summary of property, plant and equipment<br />
Notes to the Consolidated Financial Statements<br />
Land Building Machinery Equipment Automotive Assets under Total<br />
construction<br />
Purchase or assessment value<br />
As of Oct. 1, 1999 (incl. currency translation diff.) 12,157 63,469 135,962 30,773 3,233 1,459 247,053<br />
Foreign currency differences – opening balance 639 2,341 7,532 416 221 89 11,238<br />
Changes in scope of consolidation 1,554 5,527 3,999 4,441 423 597 16,541<br />
Additions 2,033 2,734 14,955 3,308 701 4,220 27,951<br />
Disposals 0 –222 –3,059 –1,775 –554 –1,399 –7,009<br />
Reclassification and revaluation 1,455 –1,399 2,758 –2,240 –3 –582 –11<br />
Foreign currency translation differences on movements 76 –262 38 –117 –10 21 –254<br />
As of September 30, 2000 17,914 72,188 162,185 34,806 4,011 4,405 295,509<br />
Accumulated depreciation<br />
As of Oct. 1, 1999 –119 –12 343 –72,420 –21,547 –1,699 0 –108,128<br />
Foreign currency translation differences on opening balance –3 –685 –4,029 –249 –119 0 –5,085<br />
Changes in scope of consolidation 0 –126 –2,214 –3,248 0 0 –5,588<br />
Depreciation on group companies 0 186 1,259 1,479 343 0 3,267<br />
Reclassification and revaluation 0 0 –1,712 1,709 3 0 0<br />
Foreign currency translation differences on movements 0 38 –84 –164 3 0 –207<br />
As of September 30, 2000 –137 –15,116 –91,763 –24,751 –2,061 0 –133,828<br />
Net book value<br />
As of October 1, 1999 12,038 51,126 63,542 9,226 1,534 1,459 138,925<br />
As of September 30, 2000 17,777 57,072 70,422 10,055 1,950 4,405 161,681<br />
The list of fixed assets has been restructured. Comparisons with the prior year can therefore be made only at the net value level.<br />
6 Intangible assets Goodwill Capitalized R & D costs Patents and brands Total<br />
As of October 1, 1999 5,984 877 0 6,861<br />
Additions 22,144 2,135 6,854 31,133<br />
Depreciation –1,647 –606 –455 –2,708<br />
As of September 30, 2000 26,481 2,406 6,399 35,286<br />
CHF 1.000 30.9.00 30.9.99<br />
Fire insurance coverage<br />
Buildings 79,968 69,474<br />
Inventories 94,842 62,814<br />
Other fixed assets 271,401 204,635<br />
Total 446,211 336,923<br />
11 Shareholders’ equity Share capital Capital reserves Retaineds Reclassification Total<br />
earning and revaluation shareholders’ equity<br />
Shareholders’ equity on 30.9.1999 27,536 50,668 39,873 8,784 126,861<br />
Dividends paid -4,682 -4,682<br />
Trade with treasury shares 1,368 1,368<br />
Capital increase from conditional share capital 60 60<br />
Net income 24,625 24,625<br />
Foreign currency translation differences 2,449 2,449<br />
Shareholders’ equity on 30.9.2000 27,596 50,668 61,184 11,233 150,681<br />
For operational considerations, goodwill of CHF 17,617,000 associated with the integration of minority interests in fully consolidated subsidiaries in the 1997–98 financial year<br />
was offset against equity. Writing off this goodwill over 5 years would have resulted in charges to the consolidated income statement amounting to CHF 3.5 m per year.