Annual Report (PDF) - Feintool
Annual Report (PDF) - Feintool
Annual Report (PDF) - Feintool

You also want an ePaper? Increase the reach of your titles
YUMPU automatically turns print PDFs into web optimized ePapers that Google loves.
32<br />
Notes to the Consolidated Financial Statements<br />
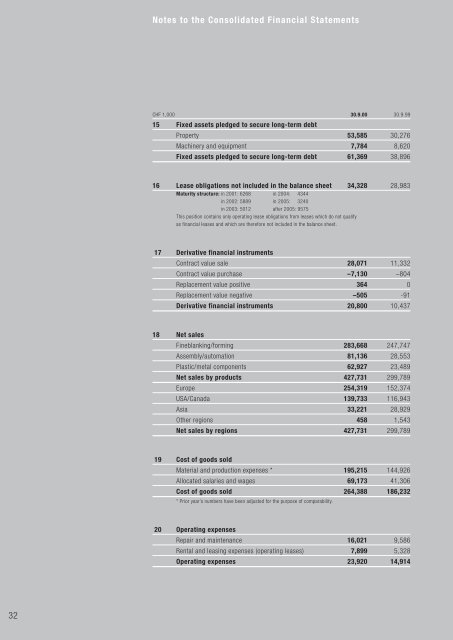
CHF 1,000 30.9.00 30.9.99<br />
15 Fixed assets pledged to secure long-term debt<br />
Property 53,585 30,276<br />
Machinery and equipment 7,784 8,620<br />
Fixed assets pledged to secure long-term debt 61,369 38,896<br />
16 Lease obligations not included in the balance sheet 34,328 28,983<br />
Maturity structure: in 2001: 6268 in 2004: 4344<br />
in 2002: 5889 in 2005: 3240<br />
in 2003: 5012 after 2005: 9575<br />
This position contains only operating lease obligations from leases which do not qualify<br />
as financial leases and which are therefore not included in the balance sheet.<br />
17 Derivative financial instruments<br />
Contract value sale 28,071 11,332<br />
Contract value purchase –7,130 –804<br />
Replacement value positive 364 0<br />
Replacement value negative –505 -91<br />
Derivative financial instruments 20,800 10,437<br />
18 Net sales<br />
Fineblanking/forming 283,668 247,747<br />
Assembly/automation 81,136 28,553<br />
Plastic/metal components 62,927 23,489<br />
Net sales by products 427,731 299,789<br />
Europe 254,319 152,374<br />
USA/Canada 139,733 116,943<br />
Asia 33,221 28,929<br />
Other regions 458 1,543<br />
Net sales by regions 427,731 299,789<br />
19 Cost of goods sold<br />
Material and production expenses * 195,215 144,926<br />
Allocated salaries and wages 69,173 41,306<br />
Cost of goods sold 264,388 186,232<br />
* Prior year’s numbers have been adjusted for the purpose of comparability.<br />
20 Operating expenses<br />
Repair and maintenance 16,021 9,586<br />
Rental and leasing expenses (operating leases) 7,899 5,328<br />
Operating expenses 23,920 14,914