a n a ly s i s
a n a ly s i s
a n a ly s i s

Create successful ePaper yourself
Turn your PDF publications into a flip-book with our unique Google optimized e-Paper software.
© 2010 Nature America, Inc. All rights reserved.<br />
a n a <strong>ly</strong> s i s<br />
RNA sequencing shows no dosage compensation of the<br />
active X-chromosome<br />
Yuanyan Xiong 1,6 , Xiaoshu Chen 1,6 , Zhidong Chen 1 , Xunzhang Wang 1 , Suhua Shi 1 , Xueqin Wang 2,3 ,<br />
Jianzhi Zhang 4 & Xionglei He 1,5<br />
Mammalian cells from both sexes typical<strong>ly</strong> contain one active<br />
X chromosome but two sets of autosomes. It has previous<strong>ly</strong><br />
been hypothesized that X-linked genes are expressed at twice<br />
the level of autosomal genes per active allele to balance the<br />
gene dose between the X chromosome and autosomes (termed<br />
‘Ohno’s hypothesis’). This hypothesis was supported by the<br />
observation that microarray-based gene expression levels<br />
were indistinguishable between one X chromosome and two<br />
autosomes (the X to two autosomes ratio (X:AA) ~1). Here<br />
we show that RNA sequencing (RNA-Seq) is more sensitive<br />
than microarray and that RNA-Seq data reveal an X:AA ratio<br />
of ~0.5 in human and mouse. In Caenorhabditis elegans<br />
hermaphrodites, the X:AA ratio reduces progressive<strong>ly</strong> from<br />
~1 in larvae to ~0.5 in adults. Proteomic data are consistent<br />
with the RNA-Seq results and further suggest the lack of X<br />
upregulation at the protein level. Together, our findings reject<br />
Ohno’s hypothesis, necessitating a major revision of the<br />
current model of dosage compensation in the evolution<br />
of sex chromosomes.<br />
The mammalian X chromosome and its much degenerated counterpart Y<br />
originated from a pair of autosomes 1 . Upon X inactivation in females,<br />
both sexes have one active allele per X-linked gene but two active<br />
alleles per autosomal gene. In 1967, it was hypothesized that X-linked<br />
genes are expressed at twice the level of autosomal genes per active<br />
allele to regain dosage balance (Ohno’s hypothesis) 1 . This hypothesis<br />
is the cornerstone of the current evolutionary model of dosage compensation<br />
1–4 and was supported by two recent microarray studies 5,6<br />
in which the X:AA expression ratio was found to be ~1. However, this<br />
result could be an artifact of the insensitivity of microarray in detecting<br />
small expression differences between genes, because microarray<br />
was designed primari<strong>ly</strong> for comparing expressions of the same genes<br />
across different conditions rather than the expressions of different<br />
1 State Key Laboratory of Biocontrol, College of Life Sciences, Sun Yat-sen<br />
University, Guangzhou, China. 2 School of Mathematics and Computational<br />
Science, Sun Yat-sen University, Guangzhou, China. 3 Zhongshan Medical<br />
School, Sun Yat-sen University, Guangzhou, China. 4 Department of Ecology<br />
and Evolutionary Biology, University of Michigan, Ann Arbor, Michigan, USA.<br />
5 State Key Laboratory of Genetic Resources and Evolution, Kunming Institute<br />
of Zoology, Chinese Academy of Sciences, Kunming, China. 6 These authors<br />
contributed equal<strong>ly</strong> to this work. Correspondence should be addressed to X.H.<br />
(hexiongl@mail.sysu.edu.cn) or J.Z. (jianzhi@umich.edu).<br />
Published online 21 November 2010; doi:10.1038/ng.711<br />
genes. Direct comparison of hybridization signals from different<br />
genes, which necessari<strong>ly</strong> have different probes, is often inappropriate<br />
7–10 . Below, we demonstrate this point by reana<strong>ly</strong>zing the human<br />
and mouse microarray data 6 previous<strong>ly</strong> used to support Ohno’s<br />
hypothesis 1 (Supplementary Table 1). We then show that RNA-Seq<br />
is more sensitive than microarray in detecting expression differences<br />
between genes and that RNA-Seq data reject Ohno’s hypothesis.<br />
RESULTS<br />
RNA-Seq outperforms microarray in measuring gene expression<br />
There are ~5,000 genes each represented by at least two probesets in<br />
the Affymetrix array HG-U133 Plus 2.0, the platform used in ref. 6<br />
and one of the most comprehensive human gene expression microarrays.<br />
Ideal<strong>ly</strong>, hybridization intensities of different probesets targeting<br />
the same gene should be the same. However, ana<strong>ly</strong>sis of the human<br />
liver gene expression data reported in ref. 6 shows that a large fraction<br />
of these same-gene probesets generated radical<strong>ly</strong> different signals.<br />
The median intensity difference between two same-gene probesets is<br />
3.9-fold, and the estimated expression levels from different same-gene<br />
probesets vary >10-fold in 27% of genes (Fig. 1a), even when on<strong>ly</strong> reliable<br />
probesets are considered. We observed a similar pattern upon ana<strong>ly</strong>sis<br />
of the mouse gene expression microarray data ana<strong>ly</strong>zed in ref. 6,<br />
which was generated on the Affymetrix GNF1M platform (Fig. 1b).<br />
These expression-signal discrepancies are not due to alternative splicing<br />
that could lead to different expression levels of multiple exons of<br />
the same genes because different expression signals were also generated<br />
from probesets of the same exons (Supplementary Fig. 1).<br />
The new<strong>ly</strong> developed RNA-Seq technique, based on highthroughput<br />
DNA sequencing, can generate digital counts of transcripts<br />
in a large<strong>ly</strong> unbiased fashion 11 . When an RNA-Seq read is<br />
mapped to a gene, on<strong>ly</strong> the first nucleotide from the 5′ end of the<br />
aligned region is counted once. The expression level of the gene is<br />
the average number of mapped reads of all positions. This way, every<br />
nucleotide of a gene is considered independent<strong>ly</strong>. The reliability of<br />
RNA-Seq–based measures of gene expression level can be assessed<br />
by examining the internal consistency of different positions of the<br />
same gene. Our ana<strong>ly</strong>sis of RNA-Seq data in refs. 12 and 13 shows<br />
that variation in expression signals estimated from RNA-Seq reads<br />
of two halves of the same transcript is much lower than that from<br />
two probesets targeting the same gene (Fig. 1a,b; P < 2.2 × 10 −16 for<br />
both panels, Mann-Whitney U test). Further, when two genes show<br />
a twofold expression difference based on the RNA-Seq reads from<br />
one half of the transcripts, reads from the other half also show an<br />
Nature GeNetics VOLUME 42 | NUMBER 12 | DECEMBER 2010 1043
© 2010 Nature America, Inc. All rights reserved.<br />
a n a <strong>ly</strong> s i s<br />
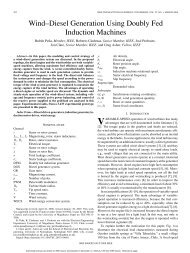
Figure 1 Comparison of gene expressions measured by microarray<br />
and RNA-Seq 6,11–13 . Human liver is considered unless otherwise noted.<br />
(a) Estimation variation measured by the fold difference of microarray<br />
intensities of two same-target probesets or of RNA-Seq signals from two<br />
halves of the same gene. (b) Identical to a, except that mouse liver is<br />
considered here. (c) Comparison of the internal consistency of RNA-Seq<br />
data and microarray data. The expression differences from one-half of the<br />
nucleotides (RNA-Seq) or a probeset (microarray) are shown for 1,000<br />
random<strong>ly</strong> picked gene pairs each with twofold ± 0.01-fold expression<br />
difference from the other half of nucleotides (RNA-Seq) or from the other<br />
probeset (microarray). The central bold line shows the median, the box<br />
encompasses 50% of data points and the error bars include 90% of data<br />
points. (d) Pearson’s correlation (r) of microarray and RNA-Seq expression<br />
signals (gray) and of RNA-Seq signals from two independent experiments<br />
(black). A certain fraction of genes (x axis) with the highest expression<br />
according to one of the RNA-Seq datasets are examined. Error bars show<br />
95% confidence intervals estimated by bootstrapping. (e) Microarray<br />
consistent<strong>ly</strong> underestimates expression differences between genes.<br />
The microarray expression differences of 1,000 random<strong>ly</strong> picked gene pairs<br />
each with x-fold (x = 2 ± 0.01, 4 ± 0.02, 8 ± 0.04, 16 ± 0.08, 32 ± 0.16,<br />
and 64 ± 0.32) RNA-Seq expression difference are shown. The central bold<br />
line shows the median, the box encompasses 50% of data points and the<br />
error bars include 90% of data points. (f) Relative liver expressions of 55<br />
mouse genes, measured by RNA-Seq, microarray and qRT-PCR.<br />
approximate<strong>ly</strong> twofold difference with a narrow standard deviation<br />
(s.d). (P = 0.24, Mann-Whitney U test), whereas we observed an average<br />
1.36-fold difference and a much larger s.d for the corresponding<br />
microarray ana<strong>ly</strong>sis of different probesets of the same transcripts<br />
(P = 4.1 × 10 −7 , Mann-Whitney U test) (Fig. 1c). Because of the huge<br />
among-gene variation in expression, the overall correlation of expression<br />
levels measured by microarray and RNA-Seq is not low (Fig. 1d).<br />
However, this correlation decreases drastical<strong>ly</strong> when on<strong>ly</strong> genes with<br />
similar expression levels are considered (Fig. 1d). By contrast, the<br />
correlation of RNA-Seq signals between two independent experiments<br />
remains reasonab<strong>ly</strong> high for genes with similar expression<br />
levels (Fig. 1d). RNA-Seq also substantial<strong>ly</strong> outperforms microarray<br />
in the dynamic range of expression levels over which transcripts can<br />
be accurate<strong>ly</strong> counted 14 . For example, an expression range spanning<br />
five orders of magnitude was achieved in a recent RNA-Seq ana<strong>ly</strong>sis<br />
a<br />
Median expression levels<br />
b<br />
X:AA<br />
1.00<br />
0.75<br />
0.50<br />
0.25<br />
0<br />
1.00<br />
0.75<br />
0.50<br />
0.25<br />
0<br />
Human Mouse<br />
Human autosomes<br />
80% RNA-Seq 80%<br />
RNA-Seq<br />
Microarray Microarray<br />
60% 60%<br />
40% 40%<br />
20% 20%<br />
0 0<br />
1∼1.5 1.5∼2 2∼4 4∼10 >10 1∼1.5 1.5∼2 2∼4 4∼10 >10<br />
Estimation variation<br />
Estimation variation<br />
of mouse transcriptomes, in contrast to on<strong>ly</strong> two to three orders of<br />
magnitude in typical microarray ana<strong>ly</strong>sis 12,14 . Thus, similar to what<br />
was recent<strong>ly</strong> demonstrated in the comparison between microarray<br />
and barcode ana<strong>ly</strong>sis by sequencing (Bar-Seq) in detecting a known<br />
difference in DNA concentration 15 , we predict that, compared to<br />
RNA-Seq, microarray tends to compress expression differences among<br />
genes. Indeed, we found that the median microarray expression<br />
difference is 1.48-fold for gene pairs having twofold RNA-Seq expression<br />
differences (P = 2.5 × 10 −8 , Mann-Whitney U test) (Fig. 1e).<br />
We confirmed the above findings by measuring the liver expressions<br />
of 55 mouse genes (Supplementary Table 2) using real-time<br />
quantitative RT-PCR (qRT-PCR), a method general<strong>ly</strong> regarded as the<br />
gold standard for gene expression quantification. We found that the<br />
expression levels determined by RNA-Seq (Pearson’s correlation r 2 =<br />
0.56) were substantial<strong>ly</strong> better than those determined by microarray<br />
(r 2 = 0.13) in correlating with the expression levels determined by<br />
qRT-PCR (Fig. 1f). We further verified this result by an independent<br />
qRT-PCR study of 120 random<strong>ly</strong> chosen genes (Supplementary Table<br />
2) from the mouse chromosome 13 (Supplementary Fig. 2). The<br />
comparison with qRT-PCR results also verified the aforementioned<br />
compression problem of microarray (Fig. 1f). This compression<br />
serious<strong>ly</strong> undermines the capability of microarray in differentiating<br />
Ohno’s hypothesis of twofold upregulation of X-linked genes (that is,<br />
the expression ratio between one active X chromosome and two autosomes<br />
being X:AA = 1) from no upregulation (X:AA = 0.5).<br />
1044 VOLUME 42 | NUMBER 12 | DECEMBER 2010 Nature GeNetics<br />
a<br />
Frequency<br />
c<br />
Expression ratio<br />
Expression ratio<br />
from microarray<br />
16.00<br />
4.00<br />
2.00<br />
1.00<br />
0.25<br />
512.000<br />
64.000<br />
16.000<br />
4.000<br />
1.000<br />
0.125<br />
Brain (M)<br />
Heart (M)<br />
Liver (M)<br />
Muscle (M)<br />
Testis (M)<br />
Kidney (M)<br />
Breast (F)<br />
Adipose (F)<br />
Colon (F)<br />
Lymph node (F)<br />
1<br />
Cerebral cortex (NA)<br />
2<br />
Lung (NA)<br />
3<br />
Average of 8<br />
4<br />
tissues<br />
5<br />
6<br />
Liver (NA)<br />
7<br />
Brain (NA)<br />
8<br />
9<br />
Muscle (NA)<br />
10<br />
11<br />
12<br />
13<br />
14<br />
15<br />
16<br />
17<br />
18<br />
19<br />
20<br />
21<br />
22<br />
RNA-Seq Microarray<br />
e f<br />
2 4 8 16 32 64<br />
Expression ratio from RNA-Seq<br />
b<br />
Frequency<br />
d<br />
r<br />
Microarray<br />
0.9<br />
0.6<br />
0.3<br />
0<br />
100.00<br />
10.00<br />
1.58<br />
1.00<br />
0.63<br />
0.10<br />
0.01<br />
0.01<br />
1.0<br />
0.8<br />
0.6<br />
0.4<br />
Fraction of genes<br />
qRT-PCR vs microarray<br />
qRT-PCR vs RNA-Seq<br />
0.1 1 10 100<br />
qRT-PCR<br />
0.2<br />
0.1<br />
0.05<br />
0.01<br />
Figure 2 Comparisons of RNA-Seq gene expression levels between the<br />
X chromosome and autosomes in 12 human tissues and 3 mouse<br />
tissues 11–13,16 . (a) The median expression levels of X-linked genes<br />
(closed diamonds) and autosomal genes (open circles) are compared.<br />
Median expressions of autosomal genes were normalized to 1. Error bars<br />
show 95% bootstrap confidence intervals. Sex information is listed in the<br />
parantheses after the tissue names (M, male; F, female; NA, unknown).<br />
(b) X:AA ratios of median expressions from the human liver when X<br />
is compared to individual autosomes. Error bars show 95% bootstrap<br />
confidence intervals.<br />
100<br />
10<br />
1<br />
0.1<br />
0.01<br />
RNA-Seq
© 2010 Nature America, Inc. All rights reserved.<br />
Figure 3 Comparison of RNA-Seq gene<br />
expression levels of the X chromosome and<br />
autosomes in C. elegans 19 . (a) X:AA expression<br />
ratios at four developmental stages estimated<br />
by Miller’s jackknife method. Error bars show<br />
95% confidence intervals. (b) Gene expression<br />
levels of later developmental stages relative<br />
to L2. The overall expressions of autosomal<br />
genes at different stages relative to L2 are<br />
large<strong>ly</strong> the same, with the medians being<br />
Mammalian X:AA expression ratios estimated by RNA-Seq<br />
We used public<strong>ly</strong> available RNA-Seq data 11,15,16 to compare expression<br />
levels of X-linked and autosomal genes in 12 human tissues<br />
(Supplementary Table 1). The expressions of X-linked genes are<br />
significant<strong>ly</strong> (P < 0.05) lower than those of autosomal genes in all<br />
male and female samples (Fig. 2a and Supplementary Table 3).<br />
The ratio of the median expression level of X-linked genes to that<br />
of autosomal genes (X:AA) ranges from 0.34 to 0.70 in the 12 tissues<br />
(Supplementary Table 3). Using Miller’s jackknife method and a<br />
method modified from the Mann-Whitney U test (Online Methods)<br />
gave similar results (Supplementary Table 3). Furthermore, the X:<br />
AA ratio is almost always lower than 1, even when the 22 pairs of<br />
autosomes are compared individual<strong>ly</strong> (Supplementary Table 4) (see<br />
Fig. 2b for the result from the liver) or when different gene functional<br />
categories are considered separate<strong>ly</strong> (Supplementary Table 5).<br />
Consistent with previous findings 6 , brain and testis showed higher<br />
X:AA ratios than other tissues. For each human gene, we computed<br />
the average expression in eight tissues excluding sex-specific tissues<br />
(testis and breast) and brain regions (brain and cerebral cortex) and<br />
found the overall human X:AA ratio to be 0.49 by a direct comparison<br />
of two medians, 0.64 by Miller’s jackknife method, and 0.45 by the<br />
modified Mann-Whitney method (Supplementary Table 3). Thus,<br />
unlike the insensitive microarray method (Supplementary Table 6),<br />
RNA-Seq shows an X:AA ratio of ~0.5 in humans. We conducted a<br />
similar ana<strong>ly</strong>sis of public<strong>ly</strong> available RNA-Seq data of three mouse<br />
tissues 12 and observed the X:AA ratio to be significant<strong>ly</strong> (P < 0.05)<br />
lower than 1 in each of them (Fig. 2a and Supplementary Table 3).<br />
Of note, the X:AA ratio is general<strong>ly</strong> smaller in mouse than in human<br />
(Fig. 2a), a pattern not previous<strong>ly</strong> known. A previous microarray<br />
study found an X:A ratio of ~0.5 from an equal mixture of X-bearing<br />
and Y-bearing mouse spermatids and suggested that X-linked genes<br />
are ful<strong>ly</strong> active but are not upregulated in spermatids 6 . Although<br />
RNA-Seq data from spermatids are unavailable at this time, given<br />
the properties of microarray shown in Figure 1, we predict that the<br />
true X:A ratio is much lower than 0.5 in spermatids, consistent with<br />
the known paucity of post-meiotic X expression 17 .<br />
In Ohno’s hypothesis, upregulation is needed for those X-linked<br />
genes that had existed in the genome before the emergence of the<br />
X chromosome; X-linked genes that originated de novo on X presumab<strong>ly</strong><br />
do not require upregulation. We estimated the X:AA expression ratio<br />
in human and mouse by using on<strong>ly</strong> those genes that have orthologous<br />
genes in chicken and found the results to be similar to those obtained<br />
from all genes (Supplementary Table 7). Hence, even for the X-linked<br />
genes that had existed in the genome before the emergence of the mammalian<br />
X chromosome, no doubling of expression was found.<br />
Nematode X:AA expression ratios estimated by RNA-Seq<br />
The nematode C. elegans has been subject to intense studies of dosage<br />
compensation. C. elegans hermaphrodites have two X chromosomes<br />
a b<br />
X:AA<br />
1.00<br />
0.75<br />
0.50<br />
0.25<br />
0<br />
L2 L3 L4 Adult<br />
C.elegans hermaphrodite developmental stages<br />
a n a <strong>ly</strong> s i s<br />
0.98, 0.93 and 0.97 for L3/L2, L4/L2 and adult/L2 C. elegans, respective<strong>ly</strong>. X-linked genes show an overall approximate twofold downregulation,<br />
with the median relative expressions being 0.71, 0.55 and 0.43 for L3/L2, L4/L2 and adult/L2 C. elegans, respective<strong>ly</strong>.<br />
and males have one X chromosome. Dosage compensation between<br />
the two sexes is achieved by halving the expression of each X in<br />
hermaphrodites through the action of a protein complex known as<br />
the dosage compensation complex 18 . We still use X:AA to denote<br />
the expression ratio between X and autosomes because although<br />
hermaphrodites have two Xs, their total expression is equivalent to<br />
one X. Hence, without twofold upregulation of X-linked genes in<br />
both sexes, X:AA = 0.5 and gene dosage is expected to be imbalanced<br />
between X and autosomes. A previous microarray study showed an<br />
X:AA ratio of ~1 in both males and hermaphrodites 5 , but the finding<br />
could again be an artifact of microarray insensitivity. Ana<strong>ly</strong>zing new<strong>ly</strong><br />
published C. elegans RNA-Seq data 19 , we observed X:AA ratios of<br />
0.92, 0.84, 0.69 and 0.41 for hermaphrodites at the L2, L3, L4 and adult<br />
stages, respective<strong>ly</strong> (Fig. 3a and Supplementary Table 3). Subsequent<br />
ana<strong>ly</strong>sis showed that the overall expression level of autosomal genes<br />
remains large<strong>ly</strong> constant during the four developmental stages,<br />
whereas X-linked genes are on average downregulated by twofold<br />
from the L2 to the adult stage (Fig. 3b), causing the gradual decline<br />
of the X:AA ratio during development. Acquisition of corresponding<br />
RNA-Seq data throughout male development can help discern the<br />
under<strong>ly</strong>ing mechanism of this phenomenon.<br />
DISCUSSION<br />
There are three caveats in our RNA-Seq ana<strong>ly</strong>sis and one in a previous<br />
microarray study 20 that warrant discussion. First, the Illumina<br />
sequencing that generated the RNA-Seq data used here may be<br />
biased toward certain sequences or nucleotides 21 . This potential<br />
bias can be evaluated by examining the distribution of Illuminaderived<br />
sequence reads generated by genome re-sequencing projects<br />
(DNA-Seq) 22,23 . Ideal<strong>ly</strong>, all nucleotides in a genome should have the<br />
same probability of being included in DNA-Seq data. We calculated<br />
for each gene an Illumina sequencing preference index (ISPI) using<br />
DNA-Seq data and draw the distributions of ISPI for human and<br />
C. elegans (Supplementary Fig. 3). On average, ISPI of an X-linked<br />
gene is 1.1 times that of an autosomal gene in human and is 0.96 times<br />
that of an autosomal gene in C. elegans. Our results of X:AA expression<br />
ratios remained large<strong>ly</strong> unchanged when ISPI was considered<br />
(Supplementary Table 8).<br />
Second, reverse transcription during complementary DNA (cDNA)<br />
library preparation is like<strong>ly</strong> to be less efficient for longer transcripts,<br />
which could lead to underestimation of expression levels of genes with<br />
long transcripts. However, there is no significant difference in transcript<br />
length between X-linked genes and autosomal genes in human<br />
(P = 0.72; Supplementary Fig. 4) or mouse (P = 0.17; Supplementary<br />
Fig. 4). In C. elegans, transcript length is on average longer for<br />
X-linked genes than for autosomal genes (P = 0.02; Supplementary<br />
Fig. 4), but the X:AA ratios of median expression remain qualitative<strong>ly</strong><br />
unchanged when the transcript length is controlled<br />
for (Supplementary Table 9). The three mouse RNA-Seq datasets<br />
Nature GeNetics VOLUME 42 | NUMBER 12 | DECEMBER 2010 1045<br />
Relative<br />
expression levels<br />
>8 421<br />
0.5<br />
0.25<br />
© 2010 Nature America, Inc. All rights reserved.<br />
a n a <strong>ly</strong> s i s<br />
were generated from libraries prepared by shearing mRNA before<br />
reverse transcription 12 and thus should be immune to the potential<br />
length bias.<br />
Third, GC content may affect RNA-Seq results. We found that the<br />
median GC percentage is slight<strong>ly</strong>, but significant<strong>ly</strong>, higher for autosomal<br />
genes (46.96% ± 0.06%) than for X-linked genes (45.27% ±<br />
0.26%) in humans (P < 1.6 × 10 −7 , Mann-Whitney U test). However,<br />
the estimate of the X:AA ratio remained unchanged even when<br />
genes of similar GC percentages were compared (Supplementary<br />
Table 10).<br />
Fourth, a recent study traced the shift of X:AA expression ratios<br />
during mouse embryonic stem cell differentiation using time-course<br />
microarray data and detected an approximate<strong>ly</strong> twofold upregulation<br />
of the single active X chromosome 20 . The authors excluded low<strong>ly</strong><br />
expressed genes which could not produce reliable above-background<br />
signals and compared 180 X-linked genes with ~5,100 autosomal<br />
genes. This treatment, although justifiable for comparing X:AA<br />
ratios among developmental stages, is inappropriate for measuring<br />
the absolute value of the X:AA ratio because a higher fraction of low<strong>ly</strong><br />
expressed genes on X than on autosomes is excluded from the comparison.<br />
Gene expression approximate<strong>ly</strong> follows a power-law distribution,<br />
with a high proportion of low<strong>ly</strong> expressed genes 24 . For example,<br />
~45% of genes have
© 2010 Nature America, Inc. All rights reserved.<br />
required to explain the between-sex dosage compensation observed in<br />
mammals, C. elegans and D. melanogaster. In this context, it is intriguing<br />
to note that two (birds and moths) of the five examined systems<br />
with independent origins of sex chromosomes do not need effective<br />
dosage compensation between sexes. It remains to be seen whether<br />
between-sex dosage compensation is the rule or the exception 35 .<br />
URLs. NCBI, http://www.ncbi.nlm.nih.gov/; UCSC database, http://<br />
genome.ucsc.edu/; Ensembl, http://www.ensembl.org/; BioMart,<br />
http://www.biomart.org/; Affymetrix, www.affymetrix.com/; BLAST,<br />
http://www.ncbi.nlm.nih.gov/tools/primer-blast/.<br />
METHODS<br />
Methods and any associated references are available in the online<br />
version of the paper at http://www.nature.com/naturegenetics/.<br />
Accession codes. Human RNA-Seq data is deposited under the<br />
accession codes GSE12946, GSE13652 and SRA000299. Human microarray<br />
data is deposited under the accession code GSE3413. Mouse<br />
RNA-Seq data is deposited under the accession code SRA001030,<br />
C. elegans RNA-Seq data is depostied under the accession code<br />
SRA003622 and C. elegans genome resequencing data is deposited<br />
under the accession codes SRR003808 and SRR003809. All data are<br />
available from NCBI.<br />
Note: Supplementary information is available on the Nature Genetics website.<br />
ACknoWledgmentS<br />
We thank B.-Y. Liao for sharing his processed mouse proteomic data, Y. Jiang for<br />
assistance in statistical ana<strong>ly</strong>sis and B.-Y. Liao, J. Lu, O. Podlaha, P. Shi, W. Qian,<br />
C.-I. Wu and Y. Xing for valuable comments. Part of the work was conducted in<br />
the laboratory of Peng Shi at the State Key Laboratory of Genetic Resources and<br />
Evolution, Kunming Institute of Zoology. This work was supported by research<br />
grants from the US National Institutes of Health (to J.Z.), the National Natural<br />
Science Foundation of China (90717115 and 30871371 to X.H.; 11001280 to<br />
Xueqin Wang) and the Tianyuan Fund for Mathematics (10926200 to<br />
Xueqin Wang).<br />
AUtHoR ContRIBUtIonS<br />
X.H. and J.Z. conceived the study. Y.X., X.C. and Z.C. produced data. X.H., X.C.,<br />
Y.X., J.Z., Xunzhang Wang, S.S. and Xueqin Wang ana<strong>ly</strong>zed data. X.H., Xunzhang<br />
Wang and S.S. provided reagents. X.H. and J.Z. wrote the paper.<br />
ComPetIng FInAnCIAl InteReStS<br />
The authors declare no competing financial interests.<br />
Published online at http://www.nature.com/naturegenetics/.<br />
Reprints and permissions information is available online at http://npg.nature.com/<br />
reprintsandpermissions/.<br />
1. Ohno, S. Sex Chromosomes and Sex Linked Genes (Springer Verlag, Berlin, Germany,<br />
1967).<br />
2. Payer, B. & Lee, J.T. X chromosome dosage compensation: how mammals keep the<br />
balance. Annu. Rev. Genet. 42, 733–772 (2008).<br />
3. Charlesworth, B. The evolution of chromosomal sex determination and dosage<br />
compensation. Curr. Biol. 6, 149–162 (1996).<br />
4. Straub, T. & Becker, P.B. Dosage compensation: the beginning and end of<br />
generalization. Nat. Rev. Genet. 8, 47–57 (2007).<br />
a n a <strong>ly</strong> s i s<br />
5. Gupta, V. et al. Global ana<strong>ly</strong>sis of X-chromosome dosage compensation. J. Biol. 5,<br />
3 (2006).<br />
6. Nguyen, D.K. & Disteche, C.M. Dosage compensation of the active X chromosome<br />
in mammals. Nat. Genet. 38, 47–53 (2006).<br />
7. Draghici, S., Khatri, P., Eklund, A.C. & Szallasi, Z. Reliability and reproducibility<br />
issues in DNA microarray measurements. Trends Genet. 22, 101–109 (2006).<br />
8. Liao, B.Y. & Zhang, J. Evolutionary conservation of expression profiles between<br />
human and mouse orthologous genes. Mol. Biol. Evol. 23, 530–540 (2006).<br />
9. Fu, X. et al. Estimating accuracy of RNA-Seq and microarrays with proteomics.<br />
BMC Genomics 10, 161 (2009).<br />
10. Held, G.A., Grinstein, G. & Tu, Y. Modeling of DNA microarray data by using<br />
physical properties of hybridization. Proc. Natl. Acad. Sci. USA 100, 7575–7580<br />
(2003).<br />
11. Marioni, J.C., Mason, C.E., Mane, S.M., Stephens, M. & Gilad, Y. RNA-seq: an<br />
assessment of technical reproducibility and comparison with gene expression arrays.<br />
Genome Res. 18, 1509–1517 (2008).<br />
12. Mortazavi, A., Williams, B.A., McCue, K., Schaeffer, L. & Wold, B. Mapping and<br />
quantifying mammalian transcriptomes by RNA-Seq. Nat. Methods 5, 621–628<br />
(2008).<br />
13. Wang, E.T. et al. Alternative isoform regulation in human tissue transcriptomes.<br />
Nature 456, 470–476 (2008).<br />
14. Wang, Z., Gerstein, M. & Snyder, M. RNA-Seq: a revolutionary tool for transcriptomics.<br />
Nat. Rev. Genet. 10, 57–63 (2009).<br />
15. Smith, A.M. et al. Quantitative phenotyping via deep barcode sequencing. Genome<br />
Res. 19, 1836–1842 (2009).<br />
16. Pan, Q., Shai, O., Lee, L.J., Frey, B.J. & Blencowe, B.J. Deep surveying of alternative<br />
splicing complexity in the human transcriptome by high-throughput sequencing.<br />
Nat. Genet. 40, 1413–1415 (2008).<br />
17. Namekawa, S.H. et al. Postmeiotic sex chromatin in the male germline of mice.<br />
Curr. Biol. 16, 660–667 (2006).<br />
18. Meyer, B.J., McDonel, P., Csankovszki, G. & Ralston, E. Sex and X-chromosomewide<br />
repression in Caenorhabditis elegans. Cold Spring Harb. Symp. Quant. Biol.<br />
69, 71–79 (2004).<br />
19. Hillier, L.W. et al. Massive<strong>ly</strong> parallel sequencing of the po<strong>ly</strong>adenylated transcriptome<br />
of C. elegans. Genome Res. 19, 657–666 (2009).<br />
20. Lin, H. et al. Dosage compensation in the mouse balances up-regulation and<br />
silencing of X-linked genes. PLoS Biol. 5, e326 (2007).<br />
21. Dohm, J.C., Lottaz, C., Borodina, T. & Himmelbauer, H. Substantial biases in<br />
ultra-short read data sets from high-throughput DNA sequencing. Nucleic Acids<br />
Res. 36, e105 (2008).<br />
22. Wang, J. et al. The diploid genome sequence of an Asian individual. Nature 456,<br />
60–65 (2008).<br />
23. Hillier, L.W. et al. Whole-genome sequencing and variant discovery in C. elegans.<br />
Nat. Methods 5, 183–188 (2008).<br />
24. Nacher, J.C. & Akutsu, T. Recent progress on the ana<strong>ly</strong>sis of power-law features in<br />
complex cellular networks. Cell Biochem. Biophys. 49, 37–47 (2007).<br />
25. Kislinger, T. et al. Global survey of organ and organelle protein expression in<br />
mouse: combined proteomic and transcriptomic profiling. Cell 125, 173–186<br />
(2006).<br />
26. Schrimpf, S.P. et al. Comparative functional ana<strong>ly</strong>sis of the Caenorhabditis elegans<br />
and Drosophila melanogaster proteomes. PLoS Biol. 7, e48 (2009).<br />
27. Deutschbauer, A.M. et al. Mechanisms of haploinsufficiency revealed by genomewide<br />
profiling in yeast. Genetics 169, 1915–1925 (2005).<br />
28. Qian, W. & Zhang, J. Gene dosage and gene duplicability. Genetics 179,<br />
2319–2324 (2008).<br />
29. Lahn, B.T., Pearson, N.M. & Jegalian, K. The human Y chromosome, in the light<br />
of evolution. Nat. Rev. Genet. 2, 207–216 (2001).<br />
30. Adler, D.A. et al. Evidence of evolutionary up-regulation of the single active<br />
X chromosome in mammals based on Clc4 expression levels in Mus spretus and<br />
Mus musculus. Proc. Natl. Acad. Sci. USA 94, 9244–9248 (1997).<br />
31. Vicoso, B. & Charlesworth, B. Evolution on the X chromosome: unusual patterns<br />
and processes. Nat. Rev. Genet. 7, 645–653 (2006).<br />
32. Ellegren, H. et al. Faced with inequality: chicken do not have a general dosage<br />
compensation of sex-linked genes. BMC Biol. 5, 40 (2007).<br />
33. Itoh, Y. et al. Dosage compensation is less effective in birds than in mammals.<br />
J. Biol. 6, 2 (2007).<br />
34. Zha, X. et al. Dosage ana<strong>ly</strong>sis of Z chromosome genes using microarray in silkworm,<br />
Bombyx mori. Insect Biochem. Mol. Biol. 39, 315–321 (2009).<br />
35. Mank, J.E. The W, X, Y and Z of sex-chromosome dosage compensation. Trends<br />
Genet. 25, 226–233 (2009).<br />
Nature GeNetics VOLUME 42 | NUMBER 12 | DECEMBER 2010 1047
© 2010 Nature America, Inc. All rights reserved.<br />
ONLINE METHODS<br />
Genomic data. Genome information for human (hg18), mouse (mm9) and<br />
C. elegans (ce6) was downloaded from the UCSC database (see URLs). There<br />
are 20,463; 23,147; and 20,176 known protein-coding autosomal or X-linked<br />
genes for human, mouse and C. elegans, respective<strong>ly</strong>, according to the annotations<br />
in Ensembl (see URLs). The longest transcript was considered for each<br />
gene in determining gene expression levels. Sources of microarray, RNA-Seq,<br />
genome re-sequencing and proteomic data are summarized in Supplementary<br />
Table 1. Human and mouse genes that have chicken orthologs were retrieved<br />
from Ensembl using BioMart (see URLs).<br />
Quantifying gene expression level using RNA-Seq data. We adopted an<br />
approach similar to that used in a recent study 36 to determine gene expression<br />
levels. Taking mouse as an example, we mapped all 25-mer RNA-Seq<br />
reads to the genome sequence. On<strong>ly</strong> those reads unique<strong>ly</strong> mapped to exons<br />
were considered as valid hits for a given gene. The expression level of a gene is<br />
defined by the number of valid hits to the gene divided by the effective length<br />
of the gene, which is the total number of 25-mers in the DNA sequences of<br />
the exons of the gene that have no other matches anywhere in the genome. For<br />
comparisons between tissues or developmental stages, expression levels were<br />
normalized by dividing the total number of valid hits in the sample. Reads<br />
were mapped using SOAP 37 , allowing a maximum of two mismatches per read.<br />
Use of different mismatch cutoffs or different mapping software gave similar<br />
results (Supplementary Fig. 5 and Supplementary Table 13). To ensure the<br />
reliability of expression estimation, we excluded genes with effective length<br />
smaller than 100, resulting in 19,800 (human), 21,470 (mouse) and 19,507<br />
(C. elegans) nuclear genes for subsequent ana<strong>ly</strong>ses.<br />
The Illumina sequencing preference index (ISPI) was computed using the<br />
same approach. Because the genome re-sequencing data of mouse were unavailable,<br />
we computed ISPI for human and C. elegans genes. Note that the<br />
human individual from which the DNA-Seq was collected is a male 22 , so the<br />
obtained ISPI values for human X-linked genes were multiplied by 2.<br />
About 15% of human X-linked genes are known to escape X inactivation 38 ,<br />
but we found that these genes are heavi<strong>ly</strong> biased toward high expression in<br />
both male and female tissues. This may have been caused by an ascertainment<br />
bias, because high<strong>ly</strong> expressed genes that escape inactivation are more<br />
like<strong>ly</strong> to be detected than low<strong>ly</strong> expressed genes that escape inactivation 38 .<br />
Thus, exclusion of this set of genes from X could cause underestimation<br />
of X:AA. Further, even when a gene escapes X inactivation, its expression<br />
from the allele on the inactivated X is usual<strong>ly</strong> much lower than that from the<br />
allele on the activated X 38 . Consistent with this result, we found comparable<br />
expression levels for these 15% of genes between male and female tissues.<br />
Thus, we did not exclude from our ana<strong>ly</strong>sis the 15% of X-linked genes that<br />
escape inactivation.<br />
Evaluating gene expression estimates from microarray and RNA-Seq. The<br />
microarray data we used in comparison with RNA-Seq data (Fig. 1) were<br />
previous<strong>ly</strong> generated and processed 6 . The original authors ana<strong>ly</strong>zed the raw<br />
data using Affymetrix software GCOS 1.1. After the elimination of background<br />
signals and genes with a low level of expression, the mean fluorescence<br />
intensity of duplicated spots representing the same gene was calculated<br />
and normalized to the mean fluorescence intensity of the whole array by the<br />
original authors 6 . We used the expression signals reported by these authors 6 .<br />
For microarray data, inferior probesets with suffixes like _x_at, _s_at and _a_at<br />
were not considered in our estimation of the fold differences of hybridization<br />
intensities between two same–target-gene probesets. To locate the target<br />
of a probeset, blastn was used to map the probe sequences obtained from<br />
Affymetrix (see URLs) to specific exons of a gene under the E-value cutoff of<br />
1 × 10 −20 . A probeset is usual<strong>ly</strong> composed of 16 pairs of perfect-match and<br />
mismatch probes for Affymetrix chips, and the final intensity of a probeset<br />
is derived from 16 signals generated by the 16 pairs of probes. Thus, in the<br />
ana<strong>ly</strong>sis of RNA-Seq data, each gene was divided into 32 equal-size windows<br />
and the RNA-Seq signals from two random<strong>ly</strong> chosen nonoverlapping sets of<br />
16 windows were compared.<br />
Ana<strong>ly</strong>sis of proteomic data. The processed mouse protein abundance<br />
data original<strong>ly</strong> generated by Kislinger and colleagues 25 were provided by<br />
Dr. Ben-Yang Liao of National Health Research Institutes in Taiwan. The<br />
C. elegans protein abundance data 26 were provided by the authors. Brief<strong>ly</strong>,<br />
proteins were denatured and digested using trypsin and then subjected to<br />
mass spectrometry ana<strong>ly</strong>sis. The relative concentration of a protein was calculated<br />
by the mean abundance of its constituent amino acids in the mass<br />
spectrometric data 26 . The longest isoform was considered for genes with<br />
multiple isoforms.<br />
Statistical ana<strong>ly</strong>ses. Let the expression level of a gene be a random variable<br />
P and let Q = nP. Thus, S Q = nS P , where S P and S Q are the s.d. of P and Q,<br />
respective<strong>ly</strong>. Because P follows approximate<strong>ly</strong> a power-law distribution 24 , the<br />
median is a better statistic than the mean in characterizing the distribution.<br />
We thus use either median (Q)/median (P) or S Q /S P to estimate n.<br />
We applied a modified Mann-Whitney U test to compare the expression<br />
levels of X-linked genes and autosomal genes. We multiplied the expression<br />
levels of all X-linked genes by a, which is a number between 0.5 and 10,<br />
and then compared these modified expression levels of X-linked genes with<br />
the original expression levels of autosomal genes using Mann-Whitney’s<br />
U test. The 1/a value resulting in the largest P value in Mann-Whitney’s<br />
U test became our estimate of the X:AA ratio. We could also find a range<br />
of a values for which the Mann-Whitney test is not significant at the 5%<br />
level (one-tail). We regarded this range of 1/a as the probable range of the<br />
X:AA ratio.<br />
We also applied Miller’s jackknife test to compare the variances in expression<br />
levels of X-linked and autosomal genes (an in-house R script of the Miller’s<br />
jackknife test is available upon request). Of note, there are a large number of<br />
zero values (often 10%–25%) for RNA-Seq–based expression levels, which<br />
makes the distributions of gene expression levels discontinuous. More important<strong>ly</strong>,<br />
these zeros apparent<strong>ly</strong> carry inaccurate information because many of<br />
them will become nonzeros if more reads were sequenced. To avoid the confounding<br />
effect of zeros, we excluded equal proportions of low<strong>ly</strong> expressed<br />
genes from X and from autosomes to ensure no zeros. To keep the medians of<br />
the distributions unchanged, the same proportion of genes at the other end of<br />
the distribution (that is, the most high<strong>ly</strong> expressed genes) were also deleted<br />
from both X and autosomes. Our results are robust when different proportions<br />
of genes were excluded (Supplementary Tables 14 and 15). All statistical<br />
ana<strong>ly</strong>ses were performed in R.<br />
Real-time quantitative RT-PCR (qRT-PCR). We used the RNeasy Mini<br />
Kit (Qiagen) to extract the total RNA from the liver of an eight-week-old<br />
C57BL/6 male mouse. The total RNA (450 ng) was reverse transcribed using<br />
the PrimeScript RT reagent Kit (Takara) using 50 picomoles of random hexamer<br />
primers (Takara). Genomic DNA was also extracted from the same<br />
mouse using the QIAamp DNA Micro kit (Qiagen).<br />
Sixty-two mouse genes with poor correlation (Pearson’s correlation<br />
r 2 = 0.13) between published RNA-Seq and microarray-measured liver<br />
expressions were selected. Primers for qRT-PCR were designed using<br />
NCBI/Primer3-BLAST (see URLs) and the primer sequences are shown in<br />
Supplementary Table 2. qRT-PCR was carried out on a Roche LightCycler<br />
480 with a 10 μL reaction volume containing cDNAs corresponding to 0.1 ng,<br />
1.0 ng or 10 ng of total RNA, depending on the RNA-Seq–based expression<br />
level of the gene, 1X SYBR Premix Ex Taq (Takara), and 1 picomole each<br />
of forward and reverse primers. The reaction was replicated three times<br />
for each of the 62 genes. The standard curve was prepared using the same<br />
approach, but with a dilution series of 0.1 ng, 1.0 ng, 5.0 ng, 10.0 ng, 50.0 ng<br />
and 100.0 ng of genomic DNA instead of cDNA; a negative control was<br />
included with water instead of cDNA. The crossing point values were determined<br />
with the second derivative max method in the supplied software of the<br />
instrument. The mean and s.d. of the crossing point values from the three technical<br />
replicates of the cDNA and the slope and correlation coefficient of the<br />
standard curve for each gene were calculated. Primer efficiency (E) for each<br />
gene was then calculated as E = 10 −slope . Among the 62 genes examined, 2 had<br />
no amplification and 5 had multiple melting points. These 7 genes were excluded<br />
from further ana<strong>ly</strong>ses, leaving 55 genes, all having s.d. of cDNA’s crossing point<br />
values lower than 0.6, E between 1.8 and 2.3, and correlation coefficients of<br />
the standard curve lower than −0.98. The relative gene expression levels were<br />
calculated from L = 10 slope × ΔCP , where ΔCP is the difference between the mean<br />
Nature GeNetics doi:10.1038/ng.711
© 2010 Nature America, Inc. All rights reserved.<br />
crossing point for the cDNA and the crossing point value for 1 ng of genomic<br />
DNA. L was then normalized to correspond to 1.0 ng of total RNA.<br />
In a second experiment, we examined the qRT-PCR expression levels of<br />
120 random<strong>ly</strong> chosen genes from chromosome 13 (Supplementary Table 2)<br />
using RNAs prepared from another eight-week-old C57BL/6 male mouse. The<br />
experimental procedure was the same as described above.<br />
doi:10.1038/ng.711<br />
36. Sultan, M. et al. A global view of gene activity and alternative splicing<br />
by deep sequencing of the human transcriptome. Science 321, 956–960<br />
(2008).<br />
37. Li, R., Li, Y., Kristiansen, K. & Wang, J. SOAP: short oligonucleotide alignment<br />
program. Bioinformatics 24, 713–714 (2008).<br />
38. Carrel, L. & Willard, H.F. X-inactivation profile reveals extensive variability in<br />
X-linked gene expression in females. Nature 434, 400–404 (2005).<br />
Nature GeNetics
SUPPLEMENTARY INFORMATION FOR<br />
RNA sequencing reveals no X-chromosome dosage compensation relative to autosomes<br />
Y. Xiong, X. Chen, Z. Chen, X. Wang, S. Shi, X. Wang, J. Zhang & X. He<br />
Supplementary information includes:<br />
Table S1-S15<br />
Figure S1-S5<br />
Nature Genetics: doi:10.1038/ng.711<br />
1
Table S1. RNA-Seq, DNA-Seq, microarray, and proteomic datasets used in this work<br />
Species Tissue/stage Sex Data type Data<br />
accession<br />
References<br />
Human Brain Male RNA-Seq GSE12946 ref. 15<br />
Human Heart Male RNA-Seq GSE12946 ref. 15<br />
Human Liver Male RNA-Seq GSE12946 ref. 15<br />
Human Muscle Male RNA-Seq GSE12946 ref. 15<br />
Human Testis Male RNA-Seq GSE12946 ref. 15<br />
Human Adipose Female RNA-Seq GSE12946 ref. 15<br />
Human Breast Female RNA-Seq GSE12946 ref. 15<br />
Human Colon Female RNA-Seq GSE12946 ref. 15<br />
Human Lymph node Female RNA-Seq GSE12946 ref. 15<br />
Human Kidney Male RNA-Seq SRA000299 ref. 11<br />
Human Liver Male RNA-Seq SRA000299 ref. 11<br />
Human Cerebral<br />
cortex<br />
N/A RNA-Seq GSE13652 ref. 16<br />
Human Lung N/A RNA-Seq GSE13652 ref. 16<br />
Mouse Brain N/A RNA-Seq SRA001030 ref. 13<br />
Mouse Liver N/A RNA-Seq SRA001030 ref. 13<br />
Mouse Muscle N/A RNA-Seq SRA001030 ref. 13<br />
Worm L2 Hermaphrodite RNA-Seq SRA003622 ref. 19<br />
Worm L3 Hermaphrodite RNA-Seq SRA003622 ref. 19<br />
Worm L4 Hermaphrodite RNA-Seq SRA003622 ref. 19<br />
Worm Adult Hermaphrodite RNA-Seq SRA003622 ref. 19<br />
Human 1 Genome Male DNA-Seq yh.genomics ref. 22<br />
resequencing<br />
.org.cn/dow<br />
nload.jsp<br />
Worm 1 Genome Wild-type strain DNA-Seq SRR003808 ref. 23<br />
resequencing N2 (Bristol)<br />
SRR003809<br />
human 5 tissues Both microarray GSE3413 ref. 6<br />
human 8 tissues Both microarray wombat.gnf. Su et. al.,<br />
org/index.ht 2004,<br />
ml PNAS<br />
mouse 5 tissues Both microarray wombat.gnf. Su et. al.,<br />
org/index.ht 2004,<br />
ml PNAS<br />
Worm Mixed stages Wild-type strain Proteome www.peptid ref. 26<br />
N2 (Bristol)<br />
eatlas.org<br />
Mouse 6 tissues N/A Proteome Supplement<br />
al Data<br />
ref. 25<br />
1<br />
On<strong>ly</strong> single-end reads were used for computing the ISPI of each gene.<br />
Nature Genetics: doi:10.1038/ng.711<br />
2
Table S2. Genes ana<strong>ly</strong>zed by qRT-PCR in our study.<br />
Genes Chr RNA-seq 1 Microarray 1 qRT-PCR 1<br />
First set of 55 genes<br />
Forward primers Reverse primers<br />
ENSMUSG00000003458 1 0.62 884.65 0.52 AAGAGCGGTGCTGGTGTCCCTGAA TGTGGAAGGAGCCAGAGTGGTCAGC<br />
ENSMUSG00000026691 1 0.04 939 0.04 AAAGGCAAATGCTTCCACAGCAGGG CCCAGGCCAATCACCAGGACTCGTT<br />
ENSMUSG00000026715 1 56.25 939.5 85.04 TCATCGGTGCCTTGGGCTGTGCTA ATCCTCCTCGGTGGCCTTCTTCCCA<br />
ENSMUSG00000046062 1 0.64 903.25 1.74 TGGCTACTGCTTGGCCTTTGAGCAC AAGAGACAGAGTGGGCACGGGTTGC<br />
ENSMUSG00000002455 2 0.61 855.8 1.07 TTACTGCTGCGACACCCGGAGGACT TGCCCAGGAACGGCTTCTTCTTCT<br />
ENSMUSG00000014867 2 3.74 981.1 7.18 TTGCTGGTGTCCCAACCATGCG AGCTGGCATCAAAGTGAAGGAGGGT<br />
ENSMUSG00000055943 2 2.08 1326.1 7.63 AGATCGAGGGACGTGCGGTTGTTCC GGAAGCCGACATGCTCTTCTCCGTC<br />
ENSMUSG00000033308 3 3.04 1165.33 3.69 CACAGATCAGAAACCCATCGCTGCC AGGAGGCACAGCTTATACTCGCAGG<br />
ENSMUSG00000028419 4 0.75 1099.65 17.43 AGTGTTTGGGTTTCCTCGCAGCCG ATGCAGTCCGTCAAGCTAGGTGGC<br />
ENSMUSG00000028684 4 2.64 918.45 7.1 ACCTGGCAAAGGACCCAGCTTTCC GCCGTTGTCGAGTAAGGGTGATGGC<br />
ENSMUSG00000033379 4 2.05 1233 27.64 TGGACGCGGTTTAGCTCAGGTCCCA TGCAGGCCCAGAAGGCCACAAAGA<br />
ENSMUSG00000019179 5 4.49 1395.93 3.08 TGGCTTATGCTGGAGCCCGCTTTG CCCAAGAGCAAGGGCGTAGAGAAGT<br />
ENSMUSG00000029482 5 0.83 930.95 1.93 TTGCGCTCTCCGCTCTCAGCCAAA ACCTGGCACTCCATGATCTCCTCGC<br />
ENSMUSG00000034245 6 0.74 947.75 1.8 ACCAGAAGCGCACAGCCCGTATT AGACGCAGGGAAACTCAGGCCCAA<br />
ENSMUSG00000034456 6 4.58 798.85 5.57 TGTGCTGAATGCTGGTCGTCGGTA ATCCCGCCAAGCCCAGAGGTGACAA<br />
ENSMUSG00000072772 6 6.15 805.05 14.19 GCGCATGGACGAGGCTAGAGACAA TTGGATCTGTGTGGCTACGGGCA<br />
ENSMUSG00000030647 7 3.32 1269.7 32.08 GGTCAAACCTCTCGTGGAACCTGCC GCCCAACAAGCCCATGTAGACAAGC<br />
ENSMUSG00000030894 7 1.01 1405.7 0.78 TGAGTTCATGCGCCTATTCGGTGGC GGCCTCGCCCTTGCTTTCCAACAAC<br />
ENSMUSG00000039018 7 0.5 878.2 0.03 GGCCAGCGCCTGTGACCAAATAGA GCCTGTGAGAACCTTCACTTTCCGC<br />
ENSMUSG00000045948 7 1.77 946.4 3.53 CACCCTGAACCAGATGCACCGCTTA GCGGAGTTGGGCTTCTTCGGCTTTC<br />
ENSMUSG00000015994 8 0.81 775.8 0.86 TACCGGCGAGTGTATAGCAGCGAGG TGGACAGCTTTAGCGCACAGGCA<br />
ENSMUSG00000031782 8 2.36 797.4 4.5 TTAACTGGTACACCCGCCGTGCAG GCGCCACGTATCTTCAAAGTCTGGG<br />
ENSMUSG00000074064 8 1.94 986.1 3.43 TACCGGCAACCCTGTTCACGAGAG ACCAGGCACACAGCCTCATTAGTGG<br />
ENSMUSG00000019039 9 0.71 855.35 1.15 GAGCACCTCGACCGAAACACTGAGA ACCAGTTCCTTCAGACACAGTCGGC<br />
ENSMUSG00000032018 9 3.64 1224.43 22.15 CCTGGTTCTCAGTGCCGCCGATTA TGTCGGATGATGTTGTCCTCGGGC<br />
ENSMUSG00000015890 10 3.17 1253.45 2.02 TGGTGGAGTGCAAGAGCGGATATGG CGCAGTAAGTGGCTGAGAGGCTGA<br />
ENSMUSG00000049858 10 1.7 1180.85 1.66 TGGTTCCTGGTGTAGTAGGTGCCCG AGCCTTTGTAATCCCGCCTCTGCC<br />
ENSMUSG00000069520 10 1.05 915.8 2.09 ACAGCAGTGGGACTTGCCTCCA ACCCAGCCACACCACCAAATGCAA<br />
ENSMUSG00000000594 11 2.45 1093.35 7.59 ATCTTGAGCAGTGGTGGGAAGCGCC GGGCACCGGAACACAGAAGAAGAGG<br />
ENSMUSG00000020477 11 2.9 1360.55 5.36 AACTGTGCCCTCCAAGGTCGTGT TTGGTCTCCTGCACCTCTGTGACC<br />
ENSMUSG00000039640 11 2.71 1085.1 22.06 TCAAAGCCAACGTCGCCAAAGCTGA ACCATGCCTCACTCCAGAACCACGG<br />
ENSMUSG00000002804 12 0.56 888.05 0.54 GGCCTTCGCAGACAACCCTGACAT AGGGCAGGAGGATGAGTGGATGGGA<br />
ENSMUSG00000021067 12 0.16 748.2 0.59 AGCCTCCACCCATCACGTATCAGC GCTCGGGCATAAACCTGAAGCCAGT<br />
ENSMUSG00000021069 12 8.96 1282.78 7.62 GGCTCAGGCATGGAAACCCTTGGGA CGTCTGGGTGTGCTCTACTCTTCCG<br />
ENSMUSG00000006717 13 2.38 1235.85 7.84 CGGGCTTGCAGACTTGACCTTCCA CATGCTGCTCATCGTGGACGCAAA<br />
ENSMUSG00000021607 13 0.88 978.75 4.33 TCAGTTCTCTGTGGCCGTCCCTTG GCCCACGCCTCTTCACCTTGTAGCA<br />
ENSMUSG00000038175 13 0.13 782.2 0.2 TGTGTCAGCGATGGAGAACTACGGC ACAGATCGAGATGCCTTCAGGTCCG<br />
ENSMUSG00000002332 14 3.1 1010.95 2.26 AGCGCCTATGAAGGGCCAAGTGTG AGCTCTAAGCGTATCCAGATGGCGG<br />
ENSMUSG00000021273 14 0.65 936.88 1.15 TCTAAACACAGGTGGGAGCGGGAGA TCCGGGTGGCCTAGACACTTGACGA<br />
ENSMUSG00000016541 15 1.27 1004.35 1.54 TGCAGTGGGTGGTGTATGCTGTGC TCAGTAGGGATGCGTCTGCCAAGCC<br />
ENSMUSG00000022574 15 2.36 1214.65 1.02 CAAGGCTGGGCAGGAACTGAGGGTT ATGGCTCCACTTGGGCTGGCTTCA<br />
ENSMUSG00000006998 16 1.46 839.55 6.04 ACGAGACAAGACACCCGTGCAGTCC ATCCCTTCGCTCCTTGCCACTCGAC<br />
ENSMUSG00000022742 16 1.26 1028.15 6.5 AGGAGGCCGGAGGACATGAAGACCA AAGTCGGCAACGCCATCTACCTGC<br />
ENSMUSG00000054604 16 0.37 838.5 1.81 TGCATCGCTTCAGTGCAACAGTCC TCTTCACATGCCGGGACAGGAACG<br />
ENSMUSG00000024181 17 1.58 930.95 15.33 ACTGGAAGAAGAACGGACGCCGA TGCTGGGACTCTGGAGGGTAGTGA<br />
ENSMUSG00000040048 17 7.87 1222.18 8.34 ACCGTCGAGTGCCAGACATCACA GTCCCTTCTCCACTGCATCTCAGCC<br />
ENSMUSG00000040356 17 0.55 756.45 0.06 AGCCAGGACGGTGGTGTTTGACT CGGCCCTTACAGAGAAGGATGACGG<br />
Nature Genetics: doi:10.1038/ng.711<br />
3
ENSMUSG00000006050 18 2.34 1042.45 4.55 GGAGCTGTCCTGCTACTGGTGTGGA GTCCTCCAATGCCTGTTCCAGAGGT<br />
ENSMUSG00000024587 18 2.27 923.65 1.9 AGCTGTGACTTCTGGGAACTGGTGG TCATGTGCCGGTTGTTGAGCTGGA<br />
ENSMUSG00000024853 19 1.25 761.65 1.47 GAGCATCCCGAACCTCCCAAAGGA TCGGCGCTCCTATCTCTGCCAATC<br />
ENSMUSG00000034371 19 16.62 783.95 10.64 ATGCACCACCCTCATCGGACTGGA TGGCAGCACGGCTATGGGTAGAAC<br />
ENSMUSG00000002010 X 1.69 905.95 3.73 CGTAGCAGGAGTGGTGGAGAGCTTG TGCACAGCCGTCACTTTCTTACGCC<br />
ENSMUSG00000025151 X 1.33 879.7 1.91 GGCACGTAATGCCAAGGAGATGCCC TGATTTGCCTGTGGGTGCTGCCTG<br />
ENSMUSG00000031299 X 1.52 1108.8 2 CCCAGTTTGCCACGGCTGATCCTGA GGCACCACGCACTTCAAAGGGAGGA<br />
ENSMUSG00000044206 X 0.54 747.45 1.64 GGTGAAATGGCTGGTAAGACACGGC CGGCCTCTGTACTTTGCCTGCTGGA<br />
Second set of 120 genes<br />
ENSMUSG00000000253 13 0.02 42.35 0.0054 CGGATGAACGTGGCTCTCCTGCTGA GGGCAAGACCGTGGAAGTGCCTTA<br />
ENSMUSG00000001504 13 0 88.95 0 AGGCTTTCAGTGTGGCAGTGGCGTC GTGCGGCCTATCCATACCAGCTCA<br />
ENSMUSG00000001542 13 0.61 333.68 0.5615 GATGACCCTGTCCCTGTATGGCCTC GTCAACGCCCATGAACCCTGCAA<br />
ENSMUSG00000005583 13 0.01 151 0.0197 TCTGAGTTTGTCCGGCTCTCGTGCG TGAGCGTGCTGTGCGACTGTGAGA<br />
ENSMUSG00000006711 13 0.02 144.85 0.0007 GGGCCTGCGAACCACTCATAGAGA ATCCGTGATGCCGTGGACTACCCA<br />
ENSMUSG00000006717 13 2.38 1235.85 1.1122 CATGCTGCTCATCGTGGACGCAAA CGGGCTTGCAGACTTGACCTTCCA<br />
ENSMUSG00000019726 13 0.04 12.75 0.0972 TTAGTGAAAGGCGGCATCCTGACCA TGGAGGAGGAGTATCGCAAGGGAGC<br />
ENSMUSG00000021147 13 0.06 170.75 0.0778 TTCCCACCAACCAGCCAGTCAGCA TGTCCTACTGTCCGAGTCCCACTGA<br />
ENSMUSG00000021196 13 0.04 32.75 0 CCAGAAGTCCGCTCCACTCCTTTCG AACCAATCTGTGCGTGATCGGCGGG<br />
ENSMUSG00000021216 13 0 213.75 0.0005 GGCATTGTACGGTTCTACCACGGCA GGAGGAGGCACAGGGTCGGGATTTA<br />
ENSMUSG00000021314 13 0 233.3 0 TGCAGACAGCGAGGCATCCACAGCA GCGGGTGAGAAGCAGGAAGTGGCTA<br />
ENSMUSG00000021356 13 0 246.6 0 TGTCGTCCGGGTAGGGAAACAGGA CGGGACATCCTCGTGAAAGAGCTGA<br />
ENSMUSG00000021359 13 0 77.28 0 GCGTTAAGACACTCGGGCGGTGAGA AAGGACAACCTCTTCGGTGGCGTGG<br />
ENSMUSG00000021363 13 0 109.5 0 CCGTTCAGAGGAAGATGGCTTTGGC TCCAAGTCGGTCAGGTACTGGGCTC<br />
ENSMUSG00000021365 13 0.04 52.65 0.0402 GCTCAGAACCGTCACTGCTACCGCA AAGCGAGTACACACATCCGGGCTCC<br />
ENSMUSG00000021366 13 0.04 277.55 0.0407 TTCTGACGCTGGGCATGGATCTGC AGGGTTGCTCTGCTCCTCTGCGTTC<br />
ENSMUSG00000021367 13 0.01 346.2 0 ACCCAGATGATGTCCAGGTGGCAG AGCTGAGAATGGAGTGCAGAGCCC<br />
ENSMUSG00000021374 13 0.17 238.5 0.1798 ACTGGACACTCCCAAGAGCCCACAG GGCACTGGTGTGAAGCGAGCCCTTA<br />
ENSMUSG00000021385 13 0.11 267.7 0.0546 ACTCCTCCAGGTATTGCTCAACCCG ACCCTCCAGGTGCAGATGTTGGAC<br />
ENSMUSG00000021396 13 0 49.85 0 ACATCGGCTGCTTCCACCCAGTTC GCTGTCATCACCAACAAAGGGCGG<br />
ENSMUSG00000021400 13 0.63 188.18 0.2103 TCTCATTGGCCTCCAGTAGCGAGCG GGCTGACAAGATGCGTCCAGACACG<br />
ENSMUSG00000021416 13 0.69 31.95 0 TGCCCGCTCTGGTGGTCTTCATAG AGCCCTGGAAAGGATGCCGAGAGA<br />
ENSMUSG00000021418 13 0.28 180.55 0.1249 GCAGAAGACAGCACCAAGCCAGTCA TCAGGAGCATCAGCCCAAAGTGGC<br />
ENSMUSG00000021423 13 0.15 211.9 0.1098 ACTGTTGCAGGCCGTGTGCTTG AGCTGCCCTCCTTGTGTGGATTCTG<br />
ENSMUSG00000021428 13 0.07 311.5 0.0811 ACTGCCGCCATTCCAGGTACAACCC ACGCTGAGACCGATGAGGAAGACGA<br />
ENSMUSG00000021448 13 0 223.45 0.0012 TGGGCAAGCTCAGGGTTTCCTCTCC AGGGTCTTTGACAGCATCAGCCACC<br />
ENSMUSG00000021458 13 0.04 129.2 0.013 AGCCGGGAGAAAGGGTGTGTTCCCA TGTGCCTTGAGGGTGCCTGCCAAGA<br />
ENSMUSG00000021466 13 0.11 322.98 0.0808 GCACCCTGCTGTGCTTCGTATTGCC TCCAAGTGTCGTCCGGTTTGCCGTG<br />
ENSMUSG00000021469 13 0 41.9 0 GGTTCAGAGAGCTGGAGAACTCGGC AAGACCAACCGGAAGCCACGCACA<br />
ENSMUSG00000021474 13 1.26 623.65 0.7241 TCCGGCCTCCAGCACTTGATCTTG TGCAAGCCAGCATCCAAAGGACTCA<br />
ENSMUSG00000021481 13 0.04 7.95 0.0163 AAGTCAGAGACAGCAGGGTCCGCCA GGCAAGAGACACAGGAAGCAGGAGA<br />
ENSMUSG00000021485 13 0.01 65.2 0.0083 TGCTGTGTGAGTAGCTGTGCTCCCG TGTGGAGAGCCTGGTGTTTGGGAC<br />
ENSMUSG00000021494 13 0.4 57.9 0.1578 CCGGGAGGCTGGCTTCTTGTCTTGA GGTCAGCAACATTGGCCGCAAGGA<br />
ENSMUSG00000021495 13 0.09 551.6 0.044 TCCATGCTCTTTCGGCAGCTCTGG GGACTGGTGTTGCAGGGTGAGAAGC<br />
ENSMUSG00000021499 13 0.01 18.35 0.0011 AGCCTGTTGACCTCCTCTTGCTGGC TGAGCGGGATCTGACGTTGGAGAG<br />
ENSMUSG00000021501 13 0.46 509.9 0.127 CGCGGTACTTCCATCTTCCTGGCT AGGGCTTCTCACCACGGCCTAGAAC<br />
ENSMUSG00000021518 13 0.79 730.05 0.3068 TCCTCTCGGGTCTAGGCACTCTGGA ACAGCCCACCGAAGCATTCAAGCA<br />
ENSMUSG00000021534 13 0 171.3 0 TGGTGCCTTGGTGGGATGTAGCTG TCCGAAACCCTGCGTGGCAAAC<br />
ENSMUSG00000021540 13 0.07 209.45 0.3034 AGGAGCGTTGTTGGGTTGGTGGA GGAACCTGAGCCACAATGAACCGCA<br />
ENSMUSG00000021541 13 0 120.5 0.0003 TCCGGTGGAAGTGAGACGTTGTGC ACTGCGAGGTTCATGGCTTTCCTCA<br />
Nature Genetics: doi:10.1038/ng.711<br />
4
ENSMUSG00000021557 13 0.09 164.38 0.058 AGCTTCCCAAGATGTACCGTCCGCC GCCTCGGGCTTGAACGCAGGAATGA<br />
ENSMUSG00000021559 13 0.31 535.65 0.296 AGGTGGTGAGACGGAGCCACGAACA TGAGCGTAAGGAGCCGCAGCATGA<br />
ENSMUSG00000021573 13 0.07 59.6 0.0497 CCAGCTTTGCCCTTGCCCTTTCCTG TGTCACGGCTCACAGACACAAGCA<br />
ENSMUSG00000021577 13 6.33 1975.1 2.4108 GTCCGATCAGCCACACAGCAACACC CAGCGTGCATTTGGTGGACAGAGCC<br />
ENSMUSG00000021587 13 0 114.8 0.0014 TCGGCTGTTCACCATCAAGCCTGC GCAGCATCTGGTTGTCTGGACCTCT<br />
ENSMUSG00000021589 13 0.04 159.8 0.0501 TGGCCGCGTTCAGCAACAAGCTAC AGGGCGACACGTTCCACCAGGACAA<br />
ENSMUSG00000021591 13 1.1 474.65 0.6883 CGCACTGGTGTTGTTAGTGGCTGTG TCGTGTTCATCAAGCCCACCTGCCC<br />
ENSMUSG00000021595 13 1.1 112.05 0.524 TCCAGGTCCGTTGGTGGGAACATGG ACTAGAGACGGGCAGTGGTTTGCAG<br />
ENSMUSG00000021597 13 0.02 78.05 0.014 GCAGATCCACCTCTGGACAACGCT ATGCTGGCTGGACGCCTTTGCAT<br />
ENSMUSG00000021598 13 0.35 600.15 0 TGACGATGATGCCGAGCTGCCGAA GGCGATGGCGGAGAAGTTTGACCA<br />
ENSMUSG00000021600 13 0 170.6 0.0004 TCATGGCAGGGCTTACAGCAGCGA TTGGCGTTCTAGCGGTGTCTGGGA<br />
ENSMUSG00000021604 13 0 14.3 0.0003 TCGTCGCAGATACACCCGTTGGAC TCTGGTCCTTGGCACACACAGCCA<br />
ENSMUSG00000021607 13 0.88 978.75 1.0503 AGCAGGAACGAGGAGAAGACTCGGG TGCTTGTACGGAGCGTGGTGGCTTC<br />
ENSMUSG00000021608 13 0.02 223.9 0.0043 GGAGGAATGTGGAGCCAAGGTGAGG ATGTGGTTTGCTGGCGGCTTCC<br />
ENSMUSG00000021610 13 1.44 1513.85 1.116 TGCAGGCAGGGAGGAACCATCAA GCCGAGAAGAAGCCATCAAACGCCC<br />
ENSMUSG00000021611 13 0.02 26.2 0.0129 CACCTTGCAGAGACAGGCCCGAAGA AGATGCCTTGAACACCAGCCCACCG<br />
ENSMUSG00000021614 13 0 102.25 0.0009 ATCCGACAGCCAGCCGTAATCGCA TCGAGGAGGCCGAAGCAGAGTGTA<br />
ENSMUSG00000021622 13 0 220.25 0.0008 TCTCCACCTCCCTTCTCTCTGCTCG TGTTGTCCTCTCGGGTACGCACTGG<br />
ENSMUSG00000021629 13 0.44 206.43 0.3001 ACGTGCTCTGTGCTCTCCTGGTGT TGTGCCCGCTATGGGTCCTTTCCCA<br />
ENSMUSG00000021636 13 0.12 162.8 0.1458 TTTGCCCTTGCTGGAGAGGCTGGA GCCGGTAAGACGCTTTGTTCCCGA<br />
ENSMUSG00000021638 13 0.17 142.55 0.1715 TAGTGGTCAGGGTCCGTCCTCTTGC AGCCTCGGTACAGCAGCAATGGTAA<br />
ENSMUSG00000021647 13 0 12.4 0 AGCAACAGGGAAAGAGCCCATCCGC AGTGCTTGTGAAGGGACGACAGCC<br />
ENSMUSG00000021666 13 0.46 194.8 0.1898 GGTGCAGAAGAAGACAGGCTCTGGG AGCCGGACGAGGAGAAAGGGAGCAT<br />
ENSMUSG00000021670 13 0.57 291.9 0 TCTCACCACCTTGGCTGGAATGACG GCAGTCAGTGGGAACTATTGCACCG<br />
ENSMUSG00000021676 13 1.87 299.08 1.3033 AGCTTGTTGGAGGCTGCGTGTTGC CATTGTGGCTCCCGATGGCTTTGAC<br />
ENSMUSG00000021680 13 0 132.55 0.0003 TCGGTGACATGCTGGCCTTGTGTC TCAGTGTGGGCGAAGGTGTGGGAA<br />
ENSMUSG00000021681 13 0.28 107.4 0.1457 CGGCGTCCTCCTGTCTATGGCTAAC AGTCAGTGTGCTCAGGCTTCCGCTC<br />
ENSMUSG00000021686 13 0.4 1187.7 0.2493 AGATGCAGGGCTGTCTTGGGAAGC CAGTACGCCTGTCTTCGTGCCAAC<br />
ENSMUSG00000021696 13 0 205.95 0.0048 AAGGGCTTCCGGTTCTCCATGAGC TGTCCTCGCCTCTGCCACAAACCA<br />
ENSMUSG00000021697 13 0 429.05 0.0008 AGCCACACGCTCTTCTATGGAGGTC TCCCGGTGCATCCTGTGCTCTAAGG<br />
ENSMUSG00000021701 13 0.09 138.6 0.2365 AAGGCTGCTGCGGTCGCTTCTTCT GCTCCTGCGGACTATCACCTACCAG<br />
ENSMUSG00000021703 13 0.22 286.9 0.2 ACGCAGGGTGAGATGGCTACCAGA TCCGTTGCTGTTGGAGGCTTGGCT<br />
ENSMUSG00000021706 13 0.04 76.28 0 AGACTAGAGTTGGAGGTCCCGCCGT GGCCAGCTTCTGCCTCAGCATTACC<br />
ENSMUSG00000021754 13 0.04 268.25 0.0759 TGTCTCTTCGCTGGGTATGACGGC CCGTTCCGGGCAGTACAAGCAAAC<br />
ENSMUSG00000021756 13 0.69 389.25 0.5538 AGACGGCCCAGGTGTGACTTTGT CCGCAGTGAAGGACTGGCTCCTGAA<br />
ENSMUSG00000021759 13 0.26 301.5 0.1072 AGCTGTTGCCTTTGAAGCGGGCCA ACACGACTCTCCATGAAACCGCCA<br />
ENSMUSG00000021760 13 0.02 198.55 0.0173 AGCTGTTGGTTCTCGGCTTCAGGA GGAGCCTTTCGCTGCCTACCCATTA<br />
ENSMUSG00000025868 13 3.7 1654.05 2.1814 TGGCTACGACCGTGAAACCCTGTGC TGCCCTCACCTATGGCCTTTACTGC<br />
ENSMUSG00000025869 13 0.71 217.35 0.5645 TCCGACGAGCATTCCGGTTCAGACG GCGAGATGCCCAAGGCTAAGGGAAA<br />
ENSMUSG00000025876 13 0.01 18.55 0.0083 TGCTTTGCTGGGCTTGATGCTGAC ATCTTGCTGCTGCTGGTCCTCGTCC<br />
ENSMUSG00000032621 13 0.09 218.1 0.0531 AACGCTTTGGGTTTGATCCCGCC ACAGCACAATGGGAACTGCCAACCA<br />
ENSMUSG00000033781 13 0.29 533 0.2474 ACGTGTAGTCCGAGGGCTTCTTGCC GGGCCAATGTGAACGCAGCCAAA<br />
ENSMUSG00000034152 13 0.39 22.65 0.2654 TGTCCCGTTTGTTCCCACTGTCCA TCCTGCAAGCCCACCGGAAGCTAA<br />
ENSMUSG00000034334 13 0.09 75.05 0.0533 ACTTTGCTGCTCCCATTTGGCCCG AGTCAGAGCGTCCATGCTGTTCCTG<br />
ENSMUSG00000034488 13 0 75 0 TTGTGACTGGTCGTTATGGCCGGA AGATCACTGCCTCCAGCGTCTTCAG<br />
ENSMUSG00000034525 13 0.07 45.95 0 ACAGCAGGGCTCAGTGTGTTCCCA AAGCAGGCAAGACCAAGGAGGGTGC<br />
ENSMUSG00000034617 13 0.06 50.9 0.0264 AGTCTTCGATCCGACCCTGCTGACC TGCCATGAAGCCGGAGTTGTTGC<br />
ENSMUSG00000034686 13 0 187.55 0 GGGCACGCAAGTTCTGCTCCCTTA ATCGTCCTGCTCTGCTGCTTCTGC<br />
ENSMUSG00000034751 13 0.01 31.48 0.0146 TGGAACTGCTGATGGTGCTGGCTGG TGAGGCTGTCCCTTGCTCTGGAGAC<br />
ENSMUSG00000034789 13 0.64 139.88 0.2046 ACGCTTGACCATTCCAGCCCAGACA AGGTGTGGATTTGAGCCAGAAGGCA<br />
Nature Genetics: doi:10.1038/ng.711<br />
5
ENSMUSG00000034928 13 0.45 660.45 0.7322 TCAACCATGAACGGGCTCTGCTGG TGCTGCCCAGACCATCAAACCTCTC<br />
ENSMUSG00000035248 13 0.33 456.35 0.3351 TGCAGTTCTGGGTGCTTGCTGCTG TGTGAGGGTTTGGAGGATGCCACA<br />
ENSMUSG00000035493 13 0.53 463.05 0 AGGATGCGGTTCAAGGTCTCGGCA ACTCAATACCGTGCTGGAGGGCGA<br />
ENSMUSG00000035711 13 0.02 178.15 0.0054 AACAGGTGGCTTCGCTCAGTGGTGG TATCTGTCCTGCCTGCGGATGGCGA<br />
ENSMUSG00000035834 13 0.08 230.5 0.0786 TGGGTCCAAACGCTCGAAGCTGA GCGACGACAACATGGATGAAGCCAC<br />
ENSMUSG00000036006 13 0.01 14.15 0.016 GCCTCGGCCACACTACTCTCCAGAA ACCATGAGCCCAAGTCCCACCCAA<br />
ENSMUSG00000036211 13 0 28.8 0.0014 TTGCCCTTGCCCTTGTCGTTCCCA ACAGCCGTATCAAGCTGGCCCTCA<br />
ENSMUSG00000036376 13 0.11 366.3 0.1403 TGGTCCTCGACATTAGCCAGCCGTG ATTCACCCAGCGTCCCACTGAGCA<br />
ENSMUSG00000037851 13 0.35 379.7 0.3665 TGTCAACGTGAAACCCGCTCTGGTG CCTCCCTTTGCTACTGGACTGCCTC<br />
ENSMUSG00000037933 13 0.08 100.05 0.0332 ACTGGGTGTTGGTGAGGACGTTGCG ACAAGAAGGTGGCTGCTGATGGTGA<br />
ENSMUSG00000038025 13 0.15 81.1 0.081 TGCTCCTCGTAGTCCTCCAGATCCA GGTGGCAACAAAGGCACAGGCAAGC<br />
ENSMUSG00000038042 13 0.01 104.53 0.0046 AGCCACAGTTCAGAGGGCTACAGGG GAGCCAGTGCCGCCCAACTTCACAA<br />
ENSMUSG00000038152 13 0.02 107.2 0.0251 GCTGCAAAGAGAACGCGGCACTGA CCGGCTACACCTCAGCCAAGCGTAA<br />
ENSMUSG00000038267 13 0.48 238.58 0.3262 AGCTGTAGAAGTGAGGCCAGGGCA GTCTGGTAGTCAAGTTCCTCGGGCG<br />
ENSMUSG00000038518 13 0.05 182.83 0.0546 TGCCATGTGCTTGTTTGCCCAGC ACGTGAAGAAGGAAGTGCCCGAGCG<br />
ENSMUSG00000038546 13 0.42 371.2 0.7321 TCTGCGAGAGGCCGATGTAGCTGA TACCCGGCTGTGGATGAGCAGGAGA<br />
ENSMUSG00000038732 13 0 179.05 0.0046 TTGGGCTTTGCGGCTTGCATGA ACGCTCTCCAAGTCCTTTCCCGTC<br />
ENSMUSG00000039109 13 0 50.95 0.003 GAAGACTGAACGGAAAGTCGCACCG AAAGAGCTGCAAAGCGGAAAGTGGG<br />
ENSMUSG00000039182 13 0.3 270.8 0.1275 TGGCTTTCAGGGTGTCTCCTGTCCC ACCAGCCTTCTGAGCGTGCCTTGA<br />
ENSMUSG00000039309 13 0 166.68 0 CCGGAGAAGCCATGAAGACCAGGAG CGCATTACCACGCAAGAGGTTGGG<br />
ENSMUSG00000041236 13 0.54 459.2 0.2449 ACACGTCACTCAACAGCACTGGCG TGCTAAGAACCGTGGGCCTGGAAG<br />
ENSMUSG00000041297 13 0.16 209.03 0.1733 GCATGGGAGGCAAAGGTAATGGCGG AGCCACTCACACCAAGCACAGGAGC<br />
ENSMUSG00000046957 13 0 102.8 0.0005 ACGGGCGTTGAAGCGGTTATTCC TAGCGGAAGCAGACAAGACGGACGC<br />
ENSMUSG00000049625 13 0.02 417.1 0.017 AGCTCTTGCGGGTCAGCACCTTGA GGCTGTTGGTTGGGCGAGGACAGAA<br />
ENSMUSG00000050244 13 0.12 245.1 0.0972 GTTCACTGCTTTGGTCTGGACGCTG GGAGCTTCTTGGGATTGACCCTGCC<br />
ENSMUSG00000053181 13 0 28.6 0.0006 AACGCCCGAGGAAGGAGCCACTGAA AAGGGAGACCCGAGCAAGACCTGGA<br />
ENSMUSG00000056257 13 0 265.45 0 GGCACTCCTGGCTAGATGCAGTCCT AAGAGTCCACAGCGGTCAGGGATCA<br />
ENSMUSG00000056749 13 0.35 75.85 0 ACCTCTGACACATCGGAGAGCGAGC TTGTGGACGAGCATGAGCCTGCGA<br />
ENSMUSG00000063529 13 0 33.3 0 CCTCTTCAGTGGCTCTCCTTCCTGC TGACCGGCTTCTGCCCACAGCTAA<br />
ENSMUSG00000071451 13 0.56 24.2 0 AGGTTGCGTAGATGCGGCGTTG TTCAGTGCAAGGCTGTGGGAGCA<br />
1 Expression signals. Note that different methods use different expression level units.<br />
Nature Genetics: doi:10.1038/ng.711<br />
6
Table S3. Comparison of RNA-Seq gene expression levels of X-linked and autosomal genes<br />
Tissues/stages P-value 1 X:AA X:AA<br />
(median)<br />
2<br />
X:AA<br />
(Miller’s jackknife)<br />
3<br />
Human<br />
(Mann-Whitney)<br />
(734 X-linked genes and 19066 autosomal genes)<br />
Brain 4.1E-04 0.63 0.79 (0.73, 0.84) 0.67 (0.59, 0.77)<br />
Heart 1.6E-07 0.56 0.63 (0.59, 0.67) 0.51 (0.45, 0.59)<br />
Liver 8.9E-12 0.34 0.53 (0.49, 0.57) 0.36 (0.31, 0.42)<br />
Muscle 1.4E-08 0.42 0.52 (0.48, 0.56) 0.41 (0.36, 0.48)<br />
Testis 8.1E-05 0.70 0.77 (0.69, 0.85) 0.71 (0.63, 0.83)<br />
Kidney 1.0E-09 0.49 0.75 (0.70, 0.80) 0.50 (0.43, 0.59)<br />
Breast 3.3E-12 0.42 0.58 (0.55, 0.63) 0.43 (0.38, 0.50)<br />
Adipose 1.0E-09 0.45 0.57 (0.53, 0.61) 0.43 (0.37, 0.50)<br />
Colon 8.3E-10 0.47 0.63 (0.58, 0.68) 0.45 (0.40, 0.53)<br />
Lymph node 6.1E-12 0.47 0.56 (0.52, 0.60) 0.43 (0.38, 0.50)<br />
Cerebral cortex 3.5E-07 0.58 0.76 (0.71, 0.82) 0.57 (0.50, 0.67)<br />
Lung 1.6E-16 0.42 0.56 (0.52, 0.60) 0.42 (0.37, 0.48)<br />
Average 4 Mouse<br />
1.9E-15 0.49 0.64 (0.59, 0.70) 0.45 (0.40, 0.53)<br />
(811 X-linked genes and 20659 autosomal genes)<br />
Liver 1.3E-28 0.13 0.21 (0.20, 0.24) 0.18 (0.16, 0.21)<br />
Brain 2.5E-21 0.25 0.47 (0.44, 0.50) 0.27 (0.24, 0.32)<br />
Muscle<br />
C. elegans<br />
6.0E-24 0.20 0.34 (0.32, 0.37) 0.24 (0.21, 0.28)<br />
(2729 X-linked genes and 16778 autosomal genes)<br />
L2 6.3E-09 1.29 0.92 (0.85, 0.99) 1.25 (1.11, 1.43)<br />
L3 3.7E-01 0.90 0.84 (0.81, 0.88) 0.95 (0.83, 1.11)<br />
L4 1.0E-14 0.54 0.69 (0.66, 0.72) 0.65 (0.59, 0.71)<br />
Adult 3.0E-23 0.57 0.41 (0.39, 0.43) 0.56 (0.50, 0.63)<br />
1<br />
From Mann-Whitney’s U test of the equality of expression levels between X and autosomes.<br />
2<br />
Numbers in parentheses show 95% confidence intervals.<br />
3<br />
Numbers in parentheses show probable ranges (see Online Methods).<br />
4<br />
Average of eight non-brain non-sex-specific tissues.<br />
Nature Genetics: doi:10.1038/ng.711<br />
7
Table S4. X:AA ratios when individual autosomes are considered. Bootstrap is used to compare the median expressions, with 95% confidence intervals shown in<br />
parentheses.<br />
Gene<br />
no.<br />
chr1 2006<br />
chr2 1269<br />
chr3 1077<br />
chr4 744<br />
chr5 858<br />
Brain(M) Heart(M) Liver(M) Muscle(M) Testis(M) Kidney(M) Breast(F) Adipose(F) Colon(F) Lymph Cerebral Lung(NA) Average<br />
node(F) cortex(NA)<br />
1<br />
0.68(0.55,0.97) 0.54(0.36,0.77) 0.31(0.19,0.43) 0.39(0.25,0.55) 0.69(0.53,0.87) 0.49(0.33,0.69) 0.39(0.3,0.56) 0.53(0.34,0.72) 0.47(0.35,0.67) 0.45(0.28,0.59) 0.58(0.44,0.74) 0.4(0.27,0.55) 0.46(0.35,0.6)<br />
0.6(0.43,0.92) 0.56(0.38,0.85) 0.38(0.28,0.6) 0.44(0.25,0.66) 0.77(0.61,0.98) 0.43(0.3,0.61) 0.52(0.37,0.73) 0.53(0.33,0.75) 0.51(0.35,0.69) 0.57(0.41,0.75) 0.59(0.43,0.72) 0.46(0.34,0.63) 0.52(0.43,0.63)<br />
0.54(0.4,0.73) 0.43(0.28,0.58) 0.33(0.23,0.51) 0.38(0.23,0.59) 0.77(0.58,0.91) 0.39(0.24,0.53) 0.39(0.3,0.51) 0.4(0.24,0.56) 0.5(0.38,0.64) 0.49(0.31,0.63) 0.55(0.41,0.67) 0.41(0.29,0.56) 0.47(0.37,0.61)<br />
1(0.71,1.39) 0.83(0.54,1.3) 0.54(0.36,0.82) 0.85(0.51,1.3) 1.14(0.91,1.47) 0.47(0.33,0.74) 0.88(0.67,1.23) 0.93(0.63,1.49) 0.89(0.58,1.24) 0.87(0.59,1.27) 0.96(0.7,1.28) 0.71(0.46,1.01) 0.71(0.52,0.95)<br />
0.55(0.41,0.77) 0.46(0.29,0.68) 0.42(0.28,0.74) 0.49(0.3,0.79) 0.94(0.7,1.17) 0.5(0.36,0.74) 0.44(0.34,0.6) 0.49(0.31,0.71) 0.53(0.38,0.76) 0.61(0.37,0.76) 0.58(0.43,0.71) 0.56(0.35,0.76) 0.55(0.44,0.72)<br />
chr6 1068 0.84(0.57,1.26) 0.62(0.37,1.09) 0.52(0.36,0.76) 0.64(0.39,0.93) 1.04(0.75,1.34) 1.36(0.78,1.95) 0.67(0.49,0.89) 0.7(0.4,0.96) 0.71(0.52,1.02) 0.62(0.41,0.83) 0.84(0.57,1.03) 0.54(0.33,0.8) 0.64(0.47,0.87)<br />
chr7 941 0.63(0.44,0.82) 0.6(0.37,0.84) 0.33(0.21,0.53) 0.44(0.25,0.67) 0.79(0.6,0.95) 0.47(0.34,0.64) 0.41(0.27,0.56) 0.47(0.28,0.71) 0.48(0.32,0.65) 0.49(0.35,0.66) 0.52(0.38,0.67) 0.46(0.31,0.64) 0.57(0.39,0.7)<br />
chr8 687 0.65(0.48,0.92) 0.54(0.31,0.89) 0.42(0.24,0.69) 0.45(0.25,0.68) 0.86(0.67,1.04) 0.56(0.34,0.81) 0.49(0.36,0.7) 0.54(0.31,0.71) 0.51(0.36,0.79) 0.51(0.32,0.66) 0.57(0.42,0.81) 0.53(0.34,0.74) 0.56(0.42,0.7)<br />
chr9 795 0.67(0.45,0.88) 0.45(0.32,0.68) 0.36(0.23,0.56) 0.38(0.25,0.61) 0.59(0.46,0.75) 0.5(0.32,0.69) 0.38(0.29,0.49) 0.42(0.26,0.66) 0.4(0.27,0.57) 0.44(0.3,0.59) 0.56(0.36,0.73) 0.38(0.27,0.57) 0.50(0.36,0.64)<br />
chr10 772 0.63(0.44,0.91) 0.55(0.34,0.79) 0.33(0.21,0.55) 0.36(0.21,0.66) 0.72(0.55,0.87) 0.46(0.32,0.7) 0.5(0.33,0.71) 0.62(0.33,0.92) 0.65(0.44,0.94) 0.6(0.35,0.84) 0.58(0.4,0.75) 0.49(0.33,0.73) 0.48(0.35,0.6)<br />
chr11<br />
chr12<br />
chr13<br />
chr14<br />
chr15<br />
1299<br />
1037<br />
338<br />
624<br />
601<br />
0.89(0.65,1.37)<br />
0.56(0.4,0.73)<br />
0.63(0.39,0.91)<br />
0.51(0.37,0.72)<br />
0.63(0.43,0.82)<br />
0.81(0.49,1.36)<br />
0.5(0.33,0.82)<br />
0.52(0.32,0.72)<br />
0.42(0.24,0.61)<br />
0.5(0.31,0.73)<br />
0.49(0.29,0.76)<br />
0.3(0.2,0.5)<br />
0.39(0.22,0.61)<br />
0.25(0.16,0.38)<br />
0.36(0.2,0.64)<br />
0.66(0.41,1)<br />
0.37(0.23,0.57)<br />
0.44(0.26,0.73)<br />
0.29(0.18,0.45)<br />
0.34(0.19,0.54)<br />
0.78(0.62,1.02)<br />
0.67(0.5,0.83)<br />
1.03(0.67,1.28)<br />
0.56(0.4,0.74)<br />
0.65(0.49,0.82)<br />
0.68(0.41,1.02)<br />
0.42(0.24,0.67)<br />
0.44(0.29,0.63)<br />
0.38(0.27,0.51)<br />
0.46(0.29,0.69)<br />
0.45(0.31,0.65)<br />
0.39(0.31,0.57)<br />
0.64(0.48,0.84)<br />
0.34(0.24,0.48)<br />
0.4(0.29,0.59)<br />
0.56(0.36,0.85)<br />
0.4(0.25,0.56)<br />
0.75(0.49,1.1)<br />
0.35(0.26,0.51)<br />
0.42(0.29,0.62)<br />
0.53(0.37,0.82)<br />
0.43(0.29,0.6)<br />
0.73(0.43,1.1)<br />
0.42(0.29,0.58)<br />
0.43(0.31,0.62)<br />
0.59(0.41,0.87)<br />
0.44(0.26,0.57)<br />
0.71(0.43,1.04)<br />
0.38(0.26,0.5)<br />
0.48(0.3,0.69)<br />
0.73(0.54,0.96)<br />
0.57(0.38,0.73)<br />
0.7(0.49,1.03)<br />
0.47(0.3,0.55)<br />
0.53(0.35,0.7)<br />
0.55(0.28,0.76)<br />
0.41(0.27,0.58)<br />
0.65(0.37,0.88)<br />
0.4(0.31,0.55)<br />
0.45(0.3,0.64)<br />
0.56(0.38,0.74)<br />
0.46(0.36,0.59)<br />
0.65(0.44,0.87)<br />
0.46(0.34,0.59)<br />
0.52(0.34,0.66)<br />
chr16 824 0.43(0.33,0.59) 0.45(0.28,0.65) 0.19(0.13,0.29) 0.22(0.11,0.32) 0.36(0.26,0.46) 0.38(0.26,0.57) 0.2(0.15,0.26) 0.24(0.14,0.34) 0.23(0.17,0.31) 0.24(0.17,0.34) 0.34(0.26,0.42) 0.24(0.17,0.34) 0.31(0.24,0.38)<br />
chr17 1181 0.55(0.42,0.76) 0.4(0.25,0.57) 0.23(0.13,0.34) 0.25(0.13,0.38) 0.42(0.33,0.51) 0.41(0.28,0.63) 0.23(0.18,0.32) 0.24(0.15,0.33) 0.26(0.14,0.34) 0.28(0.18,0.38) 0.41(0.31,0.5) 0.29(0.21,0.4) 0.35(0.29,0.45)<br />
chr18 282 0.71(0.44,1.03) 0.8(0.47,1.46) 0.61(0.36,1.07) 0.71(0.31,1.22) 1.1(0.8,1.34) 0.68(0.35,1.03) 0.68(0.47,0.94) 0.71(0.51,1.01) 0.87(0.6,1.23) 0.86(0.5,1.31) 0.67(0.44,0.94) 0.6(0.38,1.01) 0.81(0.48,1.19)<br />
chr19 1390 0.73(0.52,1.03) 0.72(0.44,1.06) 0.39(0.25,0.63) 0.6(0.4,0.89) 0.56(0.42,0.72) 0.6(0.41,0.83) 0.37(0.23,0.52) 0.39(0.22,0.59) 0.41(0.26,0.53) 0.34(0.21,0.49) 0.53(0.38,0.72) 0.33(0.22,0.49) 0.48(0.34,0.62)<br />
chr20 568 0.65(0.4,1.04) 0.69(0.48,1.02) 0.43(0.2,0.74) 0.53(0.24,1.12) 0.46(0.33,0.58) 0.78(0.39,1.23) 0.37(0.26,0.53) 0.41(0.24,0.65) 0.39(0.29,0.54) 0.39(0.27,0.62) 0.52(0.37,0.67) 0.38(0.26,0.64) 0.52(0.39,0.72)<br />
chr21 232 1.03(0.66,2.49) 1.18(0.6,3.3) 0.62(0.31,1.19) 1.37(0.46,5.41) 1.55(0.82,2.17) 0.81(0.4,1.53) 0.76(0.38,1.38) 1.03(0.36,2.6) 1.15(0.52,1.96) 1.08(0.45,2.09) 1.06(0.58,1.74) 0.74(0.46,1.82) 0.91(0.56,1.23)<br />
chr22 473<br />
0.42(0.29,0.56) 0.39(0.24,0.77) 0.22(0.12,0.33) 0.27(0.16,0.48) 0.35(0.25,0.47) 0.43(0.29,0.72) 0.21(0.16,0.3) 0.22(0.14,0.33) 0.26(0.17,0.4) 0.22(0.14,0.31) 0.28(0.21,0.37) 0.27(0.17,0.4) 0.33(0.25,0.49)<br />
1 Average of eight non-brain non-sex-specific tissues.<br />
Nature Genetics: doi:10.1038/ng.711<br />
8
Table S5. X:AA ratios for human genes of the same functional categories based on Gene Ontology (GO) classifications. On<strong>ly</strong> GO categories with at least 50 X-linked and 50<br />
autosomal genes are compared. Bootstrap is used to compare the median expressions with 95% confidence intervals shown in the parentheses.<br />
# of<br />
genes<br />
(A)<br />
# of<br />
genes<br />
(X)<br />
Brain(M) Heart(M) Liver(M) Muscle(M) Testis(M) Kidney(M) Breast(F) Adipose(F) Colon(F) Lymph<br />
node(F)<br />
9<br />
Cerebral<br />
cortex(NA)<br />
Lung(NA) Average 1<br />
GO:0003674 molecular_function GO:0005488 binding 12053 451 0.62(0.47,0.78) 0.55(0.39,0.68) 0.45(0.31,0.56) 0.35(0.2,0.52) 0.5(0.39,0.62) 0.45(0.32,0.61) 0.38(0.29,0.59) 0.43(0.26,0.58) 0.42(0.27,0.53) 0.42(0.35,0.5) 0.52(0.4,0.68) 0.4(0.28,0.51) 0.4(0.3,0.49)<br />
GO:0003674 molecular_function GO:0003824 cata<strong>ly</strong>tic<br />
activity<br />
5383 199 0.66(0.49,0.84) 0.6(0.44,0.88) 0.68(0.33,0.91) 0.56(0.32,0.92) 0.45(0.36,0.64) 0.54(0.36,0.73) 0.48(0.29,0.65) 0.61(0.36,0.85) 0.5(0.33,0.71) 0.54(0.34,0.81) 0.63(0.42,0.77) 0.6(0.37,0.75) 0.51(0.38,0.74)<br />
GO:0003674 molecular_function GO:0030528 transcription<br />
regulator<br />
activity<br />
1451 55 0.52(0.18,1.76) 0.39(0.14,1.02) 0.66(0.03,1.27) 0.32(0.06,0.89) 0.86(0.52,1.38) 0.74(0.22,1.29) 0.48(0.19,1.24) 0.27(0.07,0.63) 0.39(0.11,0.65) 0.44(0.12,0.67) 0.69(0.28,1.27) 0.36(0.1,0.79) 0.36(0.15,0.95)<br />
GO:0003674 molecular_function GO:0005215 transporter<br />
activity<br />
1394 55 0.54(0.15,1.16) 0.8(0.2,1.73) 0.44(0.08,1.2) 0.92(0.18,1.78) 0.53(0.24,1.13) 0.38(0.11,0.75) 0.42(0.25,1.52) 0.74(0.35,1.64) 0.65(0.24,1.09) 0.73(0.24,1.15) 0.39(0.14,1.26) 0.66(0.15,1.45) 0.31(0.16,0.65)<br />
GO:0005575 cellular_component GO:0044464 cell part 13898 553 0.64(0.49,0.81) 0.56(0.36,0.72) 0.39(0.23,0.5) 0.41(0.22,0.55) 0.57(0.47,0.69) 0.48(0.33,0.59) 0.36(0.28,0.51) 0.43(0.29,0.57) 0.47(0.3,0.54) 0.46(0.34,0.55) 0.52(0.41,0.63) 0.4(0.29,0.49) 0.47(0.33,0.53)<br />
GO:0005575 cellular_component GO:0043226 organelle 7816 377 0.54(0.38,0.72) 0.39(0.26,0.44) 0.33(0.22,0.49) 0.28(0.15,0.51) 0.45(0.36,0.61) 0.42(0.28,0.55) 0.37(0.17,0.5) 0.33(0.2,0.45) 0.36(0.26,0.47) 0.34(0.25,0.42) 0.5(0.38,0.7) 0.36(0.27,0.5) 0.38(0.3,0.45)<br />
GO:0005575 cellular_component GO:0044422 organelle part 3801 148 0.73(0.54,0.88) 0.54(0.32,0.87) 0.44(0.29,0.75) 0.6(0.38,0.76) 0.44(0.28,0.66) 0.5(0.34,0.71) 0.66(0.33,0.81) 0.55(0.41,0.96) 0.53(0.35,0.92) 0.51(0.33,0.89) 0.64(0.44,0.87) 0.55(0.34,0.81) 0.47(0.33,0.76)<br />
GO:0005575 cellular_component GO:0032991 macromolecular<br />
complex<br />
2462 85 0.48(0.24,0.73) 0.36(0.19,0.54) 0.47(0.28,0.67) 0.36(0.13,0.58) 0.32(0.23,0.49) 0.44(0.25,0.67) 0.3(0.17,0.45) 0.36(0.17,0.49) 0.37(0.21,0.46) 0.34(0.21,0.58) 0.39(0.17,0.56) 0.43(0.25,0.52) 0.31(0.2,0.44)<br />
GO:0008150 biological_process GO:0009987 cellular process 10987 397 0.66(0.49,0.92) 0.62(0.41,0.72) 0.5(0.34,0.79) 0.45(0.32,0.66) 0.52(0.41,0.64) 0.57(0.39,0.73) 0.43(0.28,0.61) 0.52(0.37,0.69) 0.51(0.26,0.61) 0.45(0.33,0.53) 0.56(0.4,0.75) 0.45(0.31,0.6) 0.47(0.41,0.57)<br />
GO:0008150 biological_process GO:0065007 biological<br />
regulation<br />
7181 275 0.62(0.38,0.82) 0.47(0.25,0.73) 0.4(0.27,0.73) 0.38(0.24,0.72) 0.59(0.41,0.68) 0.4(0.2,0.59) 0.34(0.28,0.55) 0.38(0.21,0.6) 0.35(0.24,0.57) 0.36(0.19,0.47) 0.53(0.3,0.64) 0.34(0.25,0.47) 0.4(0.26,0.54)<br />
GO:0008150 biological_process GO:0008152 metabolic<br />
process<br />
7002 266 0.61(0.47,0.77) 0.52(0.42,0.68) 0.55(0.4,0.76) 0.52(0.28,0.77) 0.49(0.33,0.67) 0.53(0.42,0.68) 0.44(0.3,0.67) 0.46(0.28,0.67) 0.47(0.31,0.62) 0.43(0.34,0.54) 0.54(0.37,0.7) 0.45(0.33,0.62) 0.48(0.38,0.6)<br />
GO:0008150 biological_process GO:0032502 developmental<br />
process<br />
2635 110 0.97(0.28,1.5) 0.58(0.26,1.21) 0.37(0.18,0.74) 0.46(0.17,1.44) 0.56(0.32,1.03) 0.54(0.13,0.9) 0.46(0.27,0.87) 0.47(0.23,0.82) 0.51(0.25,1.12) 0.34(0.15,0.53) 0.79(0.35,1.35) 0.4(0.17,0.73) 0.47(0.2,0.65)<br />
GO:0008150 biological_process GO:0051234 establishment<br />
of localization<br />
2714 100 0.33(0.12,0.58) 0.46(0.08,0.67) 0.2(0.08,0.42) 0.3(0.16,0.58) 0.34(0.21,0.51) 0.22(0.09,0.36) 0.24(0.12,0.49) 0.29(0.07,0.5) 0.3(0.11,0.47) 0.37(0.13,0.49) 0.23(0.11,0.38) 0.32(0.16,0.48) 0.22(0.12,0.43)<br />
GO:0008150 biological_process GO:0032501 multicellular<br />
organismal<br />
process<br />
2200 94 1.35(0.31,3.55) 0.96(0.12,2.37) 0.69(0,1.77) 0.62(0.13,1.81) 0.89(0.6,1.35) 0.57(0.27,1.8) 1.07(0.26,1.8) 0.81(0.15,2.05) 0.49(0.19,1.65) 0.61(0.32,1.26) 1.25(0.63,2.5) 0.94(0.44,1.35) 0.59(0.24,0.98)<br />
GO:0008150 biological_process GO:0050896 response<br />
stimulus<br />
to 2770 93 0.76(0.52,2.31) 0.6(0.22,1.15) 0.21(0.1,0.53) 0.27(0.05,1.01) 0.88(0.31,1.25) 0.24(0.06,0.94) 0.42(0.19,0.86) 0.28(0.08,0.78) 0.35(0.15,0.98) 0.3(0.14,0.55) 0.93(0.46,1.72) 0.45(0.23,0.8) 0.3(0.12,0.54)<br />
1 Average of eight non-brain non-sex-specific tissues.<br />
Nature Genetics: doi:10.1038/ng.711
Table S6. Comparison of expression levels of X-linked and autosomal genes using microarray<br />
data. The mean is similar between X and autosomes in various tissues, consistent with the<br />
observations in ref. 6. But, the variance-based comparison (Miller’s jackknife method), which<br />
is expected to be more robust against data noise, revealed significant difference (X:AA < 0.75) in<br />
~50% of tissues. We here considered on<strong>ly</strong> tissues with corresponding RNA-Seq data.<br />
Platform Tissue P 1 X:AA 2<br />
X:AA X:AA<br />
(mean) (median)<br />
3<br />
X:AA<br />
(Mann-Whit<br />
ney)<br />
4<br />
(Jackknife)<br />
Human Male 0.28 0.99 0.92 0.95 1.32<br />
HG-U133<br />
Plus 2.0<br />
brain<br />
(0.78,1.11) (1.02,1.70)<br />
Human Male liver 1.9E 0.93 0.70 0.79 0.90<br />
HG-U133<br />
Plus 2.0<br />
-05<br />
(0.70,0.88) (0.64,1.28)<br />
Human Female 0.11 0.99 0.85 0.92 1.27<br />
HG-U133<br />
Plus 2.0<br />
brain<br />
(0.79,1.05) (0.99,1.64)<br />
Human Female 1.7E 0.97 0.84 0.85 1.02<br />
HG-U133<br />
Plus 2.0<br />
heart -03<br />
(0.74,0.96) (0.69,1.51)<br />
Human Male heart 1.7E 0.97 0.83 0.87 0.65<br />
HG-U133<br />
Plus 2.0<br />
-03<br />
(0.76,0.97) (0.46,0.92)<br />
Human Lymph 2.2E 0.87 0.82 0.86 1.11<br />
U133A<br />
/GNF1H<br />
node -03<br />
(0.75,0.97) (0.61,2.02)<br />
Human Brain 0.05 0.91 0.83 0.90 1.02<br />
U133A<br />
/GNF1H<br />
(0.76,1.03) (0.73,1.42)<br />
Human Lung 7.4E 0.84 0.77 0.83 0.67<br />
U133A<br />
/GNF1H<br />
-04<br />
(0.71,0.95) (0.47,0.95)<br />
Human Hear 0.02 0.89 0.85 0.90 0.47<br />
U133A<br />
/GNF1H<br />
(0.78,1.01) (0.35,0.63)<br />
Human Liver 1.7E 0.84 0.84 0.85 0.40<br />
U133A<br />
/GNF1H<br />
-03<br />
(0.74,0.96) (0.28,0.58)<br />
Human Kidney 0.02 0.88 0.89 0.89 0.65<br />
U133A<br />
/GNF1H<br />
(0.77,1.01) (0.46,0.91)<br />
Human Testis 0.02 0.89 0.85 0.89 0.72<br />
U133A<br />
/GNF1H<br />
(0.77,1.01) (0.53,0.98)<br />
Human Muscle 0.28 0.96 0.94 0.967 0.68<br />
U133A<br />
(0.87,1.06) (0.36,1.30)<br />
Nature Genetics: doi:10.1038/ng.711<br />
10
GNF1H<br />
Mouse<br />
GNF1M<br />
array<br />
Mouse<br />
GNF1M<br />
array<br />
Mouse<br />
GNF1M<br />
array<br />
Mouse<br />
GNF1M<br />
array<br />
Mouse<br />
GNF1M<br />
array<br />
Frontal<br />
cortex<br />
Cerebral<br />
cortex<br />
Cerebellu<br />
m<br />
3.2E<br />
-03<br />
2.2E<br />
-04<br />
7.8E<br />
-04<br />
Muscle 5.5E<br />
-06<br />
Liver 7.4E<br />
-07<br />
0.97 0.84 0.86<br />
(0.75,0.97)<br />
0.96 0.80 0.83<br />
(0.72,0.94)<br />
0.97 0.82 0.84<br />
(0.73,0.95)<br />
0.96 0.75 0.80<br />
(0.70,0.90)<br />
0.95 0.77 0.79<br />
(0.70,0.88)<br />
11<br />
1.14<br />
(0.89,1.46)<br />
1.00<br />
(0.79,1.28)<br />
1.01<br />
(0.79,1.29)<br />
0.68<br />
(0.46,1.02)<br />
0.57<br />
(0.37,0.86)<br />
1 From Mann-Whitney’s U test of the equality of expression levels between X and autosomes.<br />
2 Data were log2-transformed before the mean expression is calculated.<br />
3 Numbers in parentheses show probable ranges (see Online Methods).<br />
4 Numbers in parentheses show 95% confidence intervals.<br />
Nature Genetics: doi:10.1038/ng.711
Table S7: X:AA expression ratios of human and mouse genes with orthologs in chicken.<br />
Tissues X:AA (median)<br />
X:AA 1<br />
(Miller’s jackknife)<br />
12<br />
X:AA 2<br />
(Mann-Whitney)<br />
Human<br />
(411 X-linked genes vs 12426 autosomal gene)<br />
Brain 0.52 0.61 (0.56,0.66) 0.53 (0.45,0.63)<br />
Heart 0.54 0.58 (0.53,0.64) 0.48 (0.42,0.56)<br />
Liver 0.40 0.46 (0.42,0.50) 0.37 (0.32,0.43)<br />
Muscle 0.38 0.47 (0.43,0.51) 0.37 (0.31,0.45)<br />
Testis 0.46 0.45 (0.39,0.51) 0.44 (0.38,0.53)<br />
Kidney 0.49 0.72 (0.65,0.79) 0.49 (0.42,0.59)<br />
Breast 0.37 0.53 (0.48,0.59) 0.42 (0.36,0.50)<br />
Adipose 0.39 0.48 (0.44,0.53) 0.38 (0.33,0.45)<br />
Colon 0.43 0.49 (0.45,0.55) 0.42 (0.36,0.50)<br />
Lymph node 0.45 0.45 (0.41,0.50) 0.41 (0.36,0.48)<br />
Cerebral cortex 0.44 0.62 (0.55,0.70) 0.47 (0.40,0.56)<br />
Lung 0.46 0.54 (0.49,0.59) 0.41 (0.36,0.48)<br />
Average 3 0.47 0.61 (0.51,0.72) 0.43 (0.37,0.53)<br />
Mouse<br />
(426 X-linked genes vs 12504 autosomal gene)<br />
Liver 0.17 0.36 (0.31,0.41) 0.18 (0.15,0.22)<br />
Brain 0.24 0.39 (0.35,0.44) 0.25 (0.22,0.30)<br />
Muscle 0.25 0.40 (0.36,0.45) 0.25 (0.21,0.31)<br />
1 Numbers in parentheses show 95% confidence intervals.<br />
2 Numbers in parentheses show probable ranges (see Online Methods).<br />
3 Average of eight non-brain non-sex-specific tissues.<br />
Nature Genetics: doi:10.1038/ng.711
Table S8. ISPI-corrected RNA-Seq gene expression levels of X chromosome and autosomes 1<br />
Tissues/stages X:AA<br />
X:AA<br />
(median)<br />
2<br />
X:AA<br />
(Miller’s jackknife)<br />
3<br />
Human<br />
(Mann-Whitney)<br />
Brain 0.57 0.68 (0.63, 0.73) 0.57 (0.50, 0.67)<br />
Heart 0.48 0.55 (0.52, 0.59) 0.45 (0.40, 0.53)<br />
Liver 0.33 0.45 (0.42, 0.49) 0.31 (0.27, 0.36)<br />
Muscle 0.39 0.49 (0.45, 0.54) 0.37 (0.32, 0.43)<br />
Testis 0.62 0.61 (0.55, 0.67) 0.63 (0.56, 0.71)<br />
Kidney 0.43 0.67 (0.63, 0.72) 0.43 (0.38, 0.50)<br />
Breast 0.38 0.52 (0.48, 0.56) 0.39 (0.34, 0.45)<br />
Adipose 0.41 0.50 (0.46, 0.54) 0.36 (0.31, 0.42)<br />
Colon 0.46 0.53 (0.49, 0.58) 0.39 (0.34, 0.45)<br />
Lymph node 0.40 0.48 (0.45, 0.53) 0.38 (0.33, 0.43)<br />
Cerebral cortex 0.51 0.68 (0.62, 0.74) 0.50 (0.43,0.59)<br />
Lung 0.39 0.47 (0.44, 0.51) 0.35 (0.31, 0.40)<br />
Average 4 C. elegans<br />
0.44 0.55 (0.50, 0.60) 0.38 (0.33, 0.45)<br />
L2 1.37 0.95 (0.89, 1.03) 1.43 (1.25, 1.67)<br />
L3 0.92 0.86 (0.82, 0.90) 1.00 (0.91, 1.11)<br />
L4 0.56 0.71 (0.68, 0.74) 0.67 (0.63, 0.71)<br />
Adult 0.61 0.42 (0.40, 0.43) 0.57 (0.53, 0.63)<br />
1<br />
ISPI-correction cannot be made to mouse results due to the lack of mouse DNA-Seq data.<br />
2<br />
Numbers in parenthesis show 95% confidence intervals.<br />
3<br />
Numbers in parentheses show probable ranges (see Online Methods).<br />
4<br />
Average of eight non-brain non-sex-specific tissues.<br />
Nature Genetics: doi:10.1038/ng.711<br />
13
Table S9. X:AA ratios of median expressions for C. elegans hermaphrodites with certain<br />
transcript lengths.<br />
Stages All genes 1.0-1.5 1.5-2.0 2.0-2.5 2.5-3.0 3.0-3.5<br />
kb kb kb kb kb<br />
L2 1.37 2.04 1.09 1.01 0.78 1.11<br />
L3 0.92 1.36 0.81 0.78 0.54 0.60<br />
L4 0.56 0.70 0.53 0.61 0.41 0.40<br />
Adult 0.61 0.85 0.55 0.44 0.30 0.25<br />
Nature Genetics: doi:10.1038/ng.711<br />
14
Table S10. ISPI-calibrated gene expressions of 350 X-linked and 7868 autosomal genes with<br />
comparable GC% (40-50% in coding regions).<br />
Tissues/stages X:A (median) X:A (Miller’s jackknife) 1 X:A ** (Mann-Whitney) 2<br />
Brain 0.48(0.30,0.75) 0.61(0.55,0.67) 0.45(0.38,0.56)<br />
Heart 0.36(0.14,0.57) 0.55(0.50,0.60) 0.32(0.26,0.40)<br />
Liver 0.24(0.10,0.48) 0.39(0.35,0.44) 0.23(0.20,0.29)<br />
Muscle 0.29(0.14,0.51) 0.44(0.38,0.52) 0.26(0.22,0.33)<br />
Testis 0.56(0.42,0.72) 0.70(0.61,0.81) 0.61(0.50,0.77)<br />
Kidney 0.36(0.22,0.49) 0.61(0.55,0.67) 0.36(0.30,0.43)<br />
Breast 0.32(0.19,0.47) 0.65(0.57,0.73) 0.34(0.29,0.42)<br />
Adipose 0.31(0.15,0.48) 0.49(0.43,0.56) 0.29(0.24,0.36)<br />
Colon 0.37(0.17,0.51) 0.52(0.46,0.58) 0.33(0.28,0.40)<br />
Lymph node 0.35(0.19,0.49) 0.54(0.48,0.60) 0.31(0.26,0.38)<br />
Cerebral cortex 0.41(0.23,0.66) 0.66(0.59,0.73) 0.41(0.34,0.50)<br />
Lung 0.30(0.17,0.51) 0.50(0.46,0.54) 0.31(0.26,0.37)<br />
Average 0.41(0.25,0.55) 0.60(0.54,0.67) 0.36(0.30,0.45)<br />
1 Numbers in parenthesis show 95% confidence intervals.<br />
2 Numbers in parenthesis show probable ranges (see Online Methods).<br />
Nature Genetics: doi:10.1038/ng.711<br />
15
Table S11. X:AA ratios calculated as in ref. 6 and ref. 20 with 50% of the most high<strong>ly</strong> expressed<br />
genes of each tissue considered.<br />
Tissues X:AA (median) X:AA (mean)<br />
Brain 0.90 0.99<br />
Heart 0.78 0.79<br />
Liver 0.74 0.78<br />
Muscle 0.65 0.74<br />
Testis 0.73 0.82<br />
Kidney 0.92 0.97<br />
Breast 0.81 0.81<br />
Adipose 0.87 0.88<br />
Colon 0.90 0.92<br />
Lymph node 0.89 0.96<br />
Cerebral<br />
1.04 1.05<br />
cortex<br />
Lung 0.86 0.85<br />
Average 1 0.81 0.87<br />
1 Average of eight non-brain non-sex-specific tissues.<br />
Nature Genetics: doi:10.1038/ng.711<br />
16
Table S12. Numbers of genes detected by proteomic data and X:AA protein expression ratios.<br />
# of known proteincoding<br />
genes<br />
# of genes with at<br />
least 1 hit in the<br />
proteomic data<br />
17<br />
Fraction of genes<br />
with at least 1 hit<br />
P –value (chi-square<br />
test) 1<br />
X:AA protein<br />
expression ratio<br />
(median) 2<br />
X chromosome 991 86 8.70% 0.47 (0.26, 0.58) 3<br />
Autosomes 22156 2734 12.30% 0.38 (0.18, 0.65) 4<br />
Mouse<br />
0.002<br />
X chromosome 2801 1401 50% 0.59 (0.53, 0.67) 3<br />
Autosomes 17375 9021 52% 0.60 (0.52, 0.67) 4<br />
C. elegans<br />
0.3<br />
1<br />
Test of no difference between X and autosomes in the fraction of genes with at least 1 hit.<br />
2<br />
In the parentheses are bootstrap 95% confidence intervals.<br />
3<br />
Based on the fraction of X-linked genes with at least 1 hit and the same fraction of autosomal genes.<br />
4<br />
Based on the fraction of autosomal genes with at least 1 hit and the same fraction of X-linked genes.<br />
Nature Genetics: doi:10.1038/ng.711
Table S13. Total numbers of mapped reads in autosomes (A) and the X<br />
chromosome, based on different software or different mismatch cutoffs. The<br />
human liver data were used. Numbers in parentheses are ratios relative to that of<br />
soap-v3. There is no significant difference in ratio between A and X (P >0.5).<br />
eland-v2 1<br />
soap-v1 2<br />
18<br />
soap-v2 3<br />
soap-v3 4<br />
A 8241529 (95.98%) 7441372 (86.66%) 8370009 (97.48%) 8586585<br />
X 105447 (95.88%) 95425 (86.77%) 106937 (97.24%) 109976<br />
1<br />
Two mismatches are allowed in ELAND mapping<br />
2<br />
One mismatch is allowed in SOAP mapping<br />
3<br />
Two mismatches are allowed in SOAP mapping<br />
4<br />
Three mismatches are allowed in SOAP mapping<br />
Nature Genetics: doi:10.1038/ng.711
Table S14. X:AA expression ratios determined by Miller’s jackknife method are robust when<br />
different proportions of genes are excluded from the two ends of the expression distributions.<br />
Tissues/<br />
stages<br />
Minimal 1 30% 1 35% 1 40% 1 45% 1<br />
Human<br />
Brain 0.68(0.63,0.73) 0.67(0.63,0.72) 0.66(0.62,0.71) 0.67(0.62,0.71) 0.78(0.70,0.86)<br />
Heart 0.55(0.52,0.59) 0.55(0.52,0.59) 0.56(0.53,0.60) 0.62(0.58,0.67) 0.66(0.58,0.73)<br />
Liver 0.45(0.42,0.49) 0.45(0.42,0.49) 0.44(0.41,0.48) 0.43(0.40,0.46) 0.46(0.41,0.52)<br />
Muscle 0.49(0.45,0.54) 0.49(0.45,0.54) 0.46(0.42,0.50) 0.43(0.39,0.47) 0.41(0.37,0.46)<br />
Testis 0.61(0.55,0.67) 0.56(0.53,0.60) 0.58(0.54,0.62) 0.57(0.52,0.62) 0.55(0.49,0.61)<br />
Kidney 0.67(0.63,0.72) 0.62(0.58,0.67) 0.60(0.56,0.64) 0.61(0.56,0.66) 0.59(0.54,0.66)<br />
Breast 0.52(0.48,0.56) 0.51(0.47,0.56) 0.47(0.44,0.51) 0.43(0.39,0.48) 0.39(0.35,0.43)<br />
Adipose 0.50(0.46,0.54) 0.48(0.44,0.52) 0.46(0.43,0.49) 0.48(0.44,0.51) 0.46(0.41,0.52)<br />
Colon 0.53(0.49,0.58) 0.49(0.45,0.53) 0.44(0.41,0.48) 0.45(0.42,0.49) 0.46(0.42,0.52)<br />
Lymph<br />
node<br />
0.48(0.45,0.53) 0.45(0.41,0.48) 0.41(0.39,0.44) 0.44(0.41,0.47) 0.46(0.42,0.51)<br />
Cerebral<br />
0.68(0.62,0.74) 0.59(0.55,0.64) 0.57(0.53,0.61) 0.55(0.51,0.59) 0.55(0.50,0.60)<br />
cortex<br />
Lung 0.47(0.44,0.51) 0.47(0.44,0.50) 0.49(0.46,0.53) 0.49(0.46,0.53) 0.53(0.48,0.59)<br />
Average 2 0.55(0.50,0.60) 0.50(0.47,0.54) 0.48(0.45,0.52) 0.47(0.44,0.50) 0.48(0.42,0.54)<br />
Mouse<br />
Liver 0.21(0.20,0.24) 0.19(0.17,0.21) 0.19(0.17,0.21) 0.17(0.15,0.19) 0.14(0.12,0.15)<br />
Brain 0.47(0.44,0.50) 0.44(0.40,0.48) 0.37(0.34,0.41) 0.32(0.30,0.35) 0.32(0.30,0.36)<br />
Muscle 0.34(0.32,0.37) 0.32(0.30,0.35) 0.29(0.27,0.32) 0.28(0.26,0.31) 0.24(0.22,0.27)<br />
C.elegans<br />
L2 0.95(0.89,1.03) 0.96(0.93,0.99) 0.94(0.91,0.97) 0.91(0.87,0.95) 0.87(0.82,0.92)<br />
L3 0.86(0.82,0.90) 0.77(0.74,0.79) 0.77(0.74,0.80) 0.77(0.74,0.80) 0.79(0.74,0.83)<br />
L4 0.71(0.68,0.74) 0.59(0.57,0.61) 0.58(0.56,0.60) 0.56(0.54,0.59) 0.57(0.54,0.61)<br />
Adult 0.42(0.40,0.43) 0.42(0.40,0.43) 0.46(0.44,0.47) 0.500.48,0.52) 0.48(0.45,0.51)<br />
1 Proportion of genes removed. “Minimal” refers to the minimal proportion removed to ensure<br />
that X and autosomes contain no zero-expression genes, which is used in the ana<strong>ly</strong>sis presented<br />
in the main text.<br />
2 Average of eight non-brain non-sex-specific tissues.<br />
Nature Genetics: doi:10.1038/ng.711<br />
19
Table S15. X:AA ratios determined by the Modified Mann-Whitney U test are robust when<br />
different proportions of genes are excluded from two ends of the expression distributions.<br />
Tissues/stages Minimal 1 30% 1 35% 1 40% 1 45% 1<br />
Human<br />
Brain 0.57(0.50,0.67) 0.59(0.53,0.67) 0.57(0.53,0.63) 0.57(0.53,0.63) 0.57(0.53,0.63)<br />
Heart 0.45(0.40,0.53) 0.44(0.40,0.50) 0.47(0.42,0.53) 0.48(0.43,0.53) 0.48(0.43,0.53)<br />
Liver 0.31(0.27,0.36) 0.30(0.26,0.36) 0.30(0.27,0.34) 0.32(0.29,0.36) 0.32(0.29,0.36)<br />
Muscle 0.37(0.32,0.43) 0.36(0.31,0.42) 0.36(0.32,0.42) 0.36(0.32,0.40) 0.37(0.34,0.40)<br />
Testis 0.63(0.56,0.71) 0.61(0.56,0.67) 0.61(0.56,0.67) 0.61(0.56,0.67) 0.59(0.56,0.63)<br />
Kidney 0.43(0.38,0.50) 0.43(0.38,0.48) 0.43(0.38,0.48) 0.43(0.40,0.48) 0.43(0.40,0.45)<br />
Breast 0.39(0.34,0.45) 0.38(0.34,0.43) 0.38(0.34,0.42) 0.38(0.34,0.42) 0.38(0.36,0.40)<br />
Adipose 0.36(0.31,0.42) 0.36(0.31,0.42) 0.37(0.33,0.42) 0.38(0.34,0.43) 0.39(0.37,0.42)<br />
Colon 0.39(0.34,0.45) 0.40(0.36,0.45) 0.41(0.37,0.45) 0.42(0.38,0.45) 0.43(0.40,0.45)<br />
Lymph node 0.38(0.33,0.43) 0.38(0.34,0.43) 0.39(0.36,0.43) 0.40(0.37,0.43) 0.41(0.38,0.43)<br />
Cerebral<br />
0.50(0.43,0.59) 0.50(0.45,0.56) 0.50(0.45,0.56) 0.49(0.45,0.53) 0.50(0.48,0.53)<br />
cortex<br />
Lung 0.35(0.31,0.40) 0.36(0.32,0.40) 0.36(0.32,0.40) 0.36(0.33,0.40) 0.37(0.34,0.40)<br />
Average 2 0.38(0.33,0.45) 0.41(0.37,0.45) 0.42(0.38,0.45) 0.43(0.40,0.45) 0.43(0.40,0.45)<br />
Mouse<br />
Liver 0.18(0.16,0.21) 0.17(0.15,0.20) 0.16(0.14,0.19) 0.15(0.13,0.16) 0.14(0.13,0.14)<br />
Brain 0.27(0.24,0.32) 0.26(0.23,0.29) 0.25(0.23,0.28) 0.25(0.23,0.27) 0.25(0.23,0.26)<br />
Muscle 0.24(0.21,0.28) 0.22(0.20,0.26) 0.22(0.20,0.24) 0.21(0.19,0.23) 0.19(0.18,0.21)<br />
C.elegans<br />
L2 1.43(1.25,1.67) 1.33(1.25,1.43) 1.33(1.25,1.43) 1.33(1.25,1.43) 1.33(1.25,1.43)<br />
L3 1.00(0.91,1.11) 1.00(0.91,1.11) 1.00(0.91,1.11) 0.95(0.91,1.00) 0.95(0.91,1.00)<br />
L4 0.67(0.63,0.71) 0.59(0.56,0.63) 0.59(0.56,0.63) 0.59(0.56,0.63) 0.57(0.56,0.59)<br />
Adult 0.57(0.53,0.63) 0.59(0.56,0.63) 0.61(0.56,0.67) 0.63(0.59,0.67) 0.63(0.59,0.67)<br />
1 Proportion of genes removed. “Minimal” refers to the minimal proportion removed to ensure<br />
that X and autosomes contain no zero-expression genes, which is used in the ana<strong>ly</strong>sis presented<br />
in the main text.<br />
2 Average of eight non-brain non-sex-specific tissues.<br />
Nature Genetics: doi:10.1038/ng.711<br />
20
Fig. S1. Comparison of gene expressions measured by microarray and RNA-Seq. Frequency<br />
distribution of estimation variation, which is shown by the fold difference of microarray<br />
intensities of two random<strong>ly</strong> chosen probesets targeting the same exons or fold difference of<br />
RNA-Seq signals from two halves of a transcript. In the ana<strong>ly</strong>sis of RNA-Seq data, each<br />
transcript is divided into 32 equal-size windows and the RNA-Seq signals from two random<strong>ly</strong><br />
chosen non-overlapping sets of 16-windows are compared. Both microarray and RNA-Seq data<br />
are from the human liver.<br />
Frequency<br />
60%<br />
40%<br />
20%<br />
Nature Genetics: doi:10.1038/ng.711<br />
0<br />
RNA-Seq<br />
Microarray<br />
1~1.5 1.5~2 2~4 4~10 >10<br />
Estimation variation<br />
21
Fig. S2. Relative expression levels in liver among 120 mouse genes, measured by RNA-Seq,<br />
microarray, and qRT-PCR. The genes are chosen random<strong>ly</strong> from chromosome 13 irrespective<br />
of their expression signals from RNA-Seq or microarray. Spearman’s rank correlation between<br />
qRT-PCR and microarray log10 signals is 0.51 (P = 1.8×10 -9 ) and that between qRT-PCR and<br />
RNA-Seq is 0.76 (P < 2.2×10 -16 ). Note that different methods use different signal units.<br />
Microarray<br />
10000<br />
1000<br />
100<br />
10<br />
Nature Genetics: doi:10.1038/ng.711<br />
1<br />
qRT-PCR vs Microarray<br />
qRT-PCR vs RNA-Seq<br />
0 1e-04 0.001 0.01 0.1 1 10<br />
qRT-PCR<br />
22<br />
10<br />
1<br />
0.1<br />
0.01<br />
0<br />
RNA-Seq
Fig. S3. Comparison of ISPI between X-linked and autosomal genes for (A) human and (B) C.<br />
elegans. ISPI cannot be calculated for mouse due to the lack of appropriate mouse DNA-Seq<br />
data.<br />
A<br />
Frequency<br />
B<br />
Frequency<br />
0.2<br />
0.15<br />
0.1<br />
0.05<br />
0<br />
0.25<br />
0.2<br />
0.15<br />
0.1<br />
0.05<br />
0<br />
Nature Genetics: doi:10.1038/ng.711<br />
Autosomes<br />
X chromosome<br />
0.20<br />
0.25<br />
0.30<br />
0.35<br />
0.40<br />
0.45<br />
0.50<br />
0.55<br />
0.60<br />
0.65<br />
0.70<br />
0.75<br />
0.80<br />
0.85<br />
0.90<br />
0.95<br />
1.00<br />
>1<br />
Autosomes<br />
X chromosome<br />
ISPI<br />
0.20<br />
0.25<br />
0.30<br />
0.35<br />
0.40<br />
0.45<br />
0.50<br />
0.55<br />
0.60<br />
0.65<br />
0.70<br />
0.75<br />
0.80<br />
0.85<br />
0.90<br />
0.95<br />
1.00<br />
>1<br />
ISPI<br />
23
Fig. S4. Distributions of the transcript lengths for (A) human, (B) mouse, and (C) C. elegans<br />
genes and (D) the comparison of transcript lengths between X-linked (X) and autosomal (A)<br />
genes for the 3 organisms.<br />
A<br />
Frequency<br />
B<br />
Frequency<br />
C<br />
Frequency<br />
D<br />
0.16<br />
0.14<br />
0.12<br />
0.1<br />
0.08<br />
0.06<br />
0.04<br />
0.02<br />
0<br />
0.16<br />
0.14<br />
0.12<br />
0.1<br />
0.08<br />
0.06<br />
0.04<br />
0.02<br />
0<br />
0.35<br />
0.3<br />
0.25<br />
0.2<br />
0.15<br />
0.1<br />
0.05<br />
0<br />
500<br />
500<br />
500<br />
1500<br />
1500<br />
1500<br />
2500<br />
2500<br />
2500<br />
3500<br />
4500<br />
P<br />
1<br />
Two-tailed Mann-Whitney U test for transcript length difference 24 between X-linked<br />
genes (X) and autosomal genes (A).<br />
1 P Median of X Median of A Mean of X±SD Mean of A±SD<br />
Human 0.72 2379 2467 2994±80 3002±17<br />
Mouse 0.17 2238 2152 2760±74 2630±15<br />
C.elegans 0.02 1167 1081 1489±25 1394±10<br />
1<br />
Two-tailed Mann-Whitney U test for transcript length difference between X-linked<br />
genes (X) and autosomal genes (A).<br />
1 Median of X Median of A Mean of X±SD Mean of A±SD<br />
Human 0.72 2379 2467 2994±80 3002±17<br />
Mouse 0.17 2238 2152 2760±74 2630±15<br />
C.elegans 0.02 1167 1081 1489±25 1394±10<br />
Nature Genetics: doi:10.1038/ng.711<br />
5500<br />
Autosomes<br />
X chromosome<br />
6500<br />
7500<br />
mRNA length (nucleotide)<br />
3500<br />
4500<br />
5500<br />
6500<br />
7500<br />
mRNA length (nucleotide)<br />
3500<br />
4500<br />
8500<br />
Autosomes<br />
X chromosome<br />
Autosomes<br />
X chromosome<br />
5500<br />
6500<br />
7500<br />
mRNA length (nucleotide)<br />
8500<br />
8500<br />
9500<br />
9500<br />
9500<br />
>10000<br />
>10000<br />
>10000
Fig. S5. Relative gene expression levels of human liver estimated from RNA-Seq are not<br />
affected by using different read mapping software (SOAP and ELAND) or different mismatch<br />
cutoffs. Pearson correlation coefficients of the three comparisons are all larger than 0.995.<br />
Each dot represents a gene.<br />
SOAP - 2 mismatches<br />
SOAP - 2 mismatches<br />
SOAP - 3 mismatches<br />
Nature Genetics: doi:10.1038/ng.711<br />
0.000001 0.00001 0.0001 0.001 0.01 0.1<br />
1<br />
0.1<br />
1 10 100 1000<br />
0.0001<br />
0.00001<br />
0.000001<br />
ELAND - 2 mismatches<br />
25<br />
1000<br />
100<br />
10<br />
0.01<br />
0.001<br />
0.000001 0.00001 0.0001 0.001 0.01 0.1<br />
1<br />
0.1<br />
1 10 100 1000<br />
1000<br />
100<br />
10<br />
0.01<br />
0.001<br />
0.0001<br />
0.00001<br />
0.000001<br />
SOAP - 1 mismatch<br />
0.000001 0.00001 0.0001 0.001 0.01 0.1<br />
1<br />
0.1<br />
1 10 100 1000<br />
1000<br />
100<br />
10<br />
0.01<br />
0.001<br />
0.0001<br />
0.00001<br />
0.000001<br />
SOAP - 2 mismatches