Chaigneau and Pizarro - LEGOS
Chaigneau and Pizarro - LEGOS
Chaigneau and Pizarro - LEGOS

Create successful ePaper yourself
Turn your PDF publications into a flip-book with our unique Google optimized e-Paper software.
Mean surface circulation <strong>and</strong> mesoscale turbulent flow characteristics<br />
in the eastern South Pacific from satellite tracked drifters<br />
Alexis <strong>Chaigneau</strong><br />
Centro de Investigación Oceanográfica en el Pacífico Sur-Oriental/Programa Regional de Oceanografía Física y Clima,<br />
Universidad de Concepción, Concepción, Chile<br />
Oscar <strong>Pizarro</strong><br />
Departamento de Geofísica/Centro de Investigación Oceanográfica en el Pacífico Sur-Oriental, Universidad de Concepción,<br />
Concepción, Chile<br />
Received 26 July 2004; revised 3 January 2005; accepted 24 February 2005; published 21 May 2005.<br />
[1] Circulation of the eastern South Pacific region (10°–34°S, 70°–100°W) was studied<br />
using drifting buoy trajectories from 1979 to 2003. Three different current regimes were<br />
highlighted: the South Equatorial Current, flowing westward north of 26°S with surface<br />
velocities of 7–8 cm s 1 ; the South Pacific Current, an eastward current of 2cms 1<br />
south of 25°–30°S; <strong>and</strong> the Chile-Peru Current, a northwestward flow of 6cms 1 found<br />
to the east of 82°W <strong>and</strong> south of 22°S. The velocity variance distribution showed the<br />
regional flow to be anisotropic in nature. Maps of eddy kinetic energy obtained from<br />
drifter measurements <strong>and</strong> satellite altimetry data showed similar patterns, with higher<br />
energy levels near the South American coast. The Lagrangian time <strong>and</strong> length scales of the<br />
turbulent flow revealed typical values of 5.9 ± 0.6 days <strong>and</strong> 40.7 ± 5.4 km in the zonal<br />
direction <strong>and</strong> of 3.5 ± 0.4 days <strong>and</strong> 29 ± 3.4 km in the meridional direction. The estimated<br />
diffusivities were (4.9 ± 0.5) 10 7 cm 2 s 1 <strong>and</strong> (2.6 ± 0.3) 10 7 cm 2 s 1 in the eastward<br />
<strong>and</strong> northward directions, respectively. Finally, we estimated the respective role of<br />
horizontal advection <strong>and</strong> lateral diffusion on the mixed layer heat <strong>and</strong> salt budgets. Near<br />
the coast the lateral turbulent fluxes in the surface layer were two times larger than the<br />
horizontal transports associated with the large-scale circulation; mean horizontal heat <strong>and</strong><br />
salt diffusive fluxes were around 25 W m 2 <strong>and</strong> 50 g m 2 d 1 .<br />
Citation: <strong>Chaigneau</strong>, A., <strong>and</strong> O. <strong>Pizarro</strong> (2005), Mean surface circulation <strong>and</strong> mesoscale turbulent flow characteristics in the eastern<br />
South Pacific from satellite tracked drifters, J. Geophys. Res., 110, C05014, doi:10.1029/2004JC002628.<br />
1. Introduction<br />
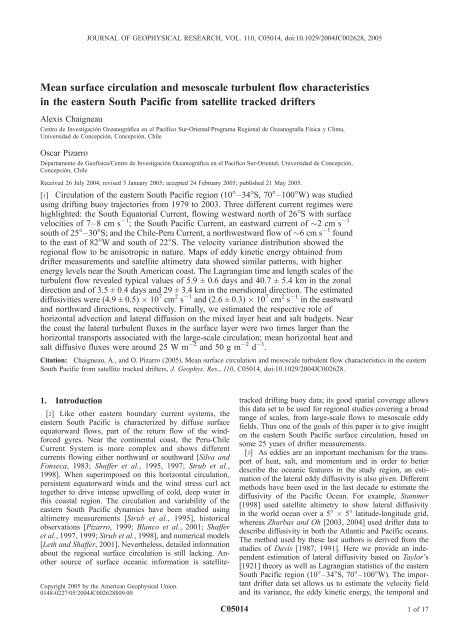
JOURNAL OF GEOPHYSICAL RESEARCH, VOL. 110, C05014, doi:10.1029/2004JC002628, 2005<br />
[2] Like other eastern boundary current systems, the<br />
eastern South Pacific is characterized by diffuse surface<br />
equatorward flows, part of the return flow of the windforced<br />
gyres. Near the continental coast, the Peru-Chile<br />
Current System is more complex <strong>and</strong> shows different<br />
currents flowing either northward or southward [Silva <strong>and</strong><br />
Fonseca, 1983; Shaffer et al., 1995, 1997; Strub et al.,<br />
1998]. When superimposed on this horizontal circulation,<br />
persistent equatorward winds <strong>and</strong> the wind stress curl act<br />
together to drive intense upwelling of cold, deep water in<br />
this coastal region. The circulation <strong>and</strong> variability of the<br />
eastern South Pacific dynamics have been studied using<br />
altimetry measurements [Strub et al., 1995], historical<br />
observations [<strong>Pizarro</strong>, 1999; Blanco et al., 2001; Shaffer<br />
et al., 1997, 1999; Strub et al., 1998], <strong>and</strong> numerical models<br />
[Leth <strong>and</strong> Shaffer, 2001]. Nevertheless, detailed information<br />
about the regional surface circulation is still lacking. Another<br />
source of surface oceanic information is satellite-<br />
Copyright 2005 by the American Geophysical Union.<br />
0148-0227/05/2004JC002628$09.00<br />
tracked drifting buoy data; its good spatial coverage allows<br />
this data set to be used for regional studies covering a broad<br />
range of scales, from large-scale flows to mesoscale eddy<br />
fields. Thus one of the goals of this paper is to give insight<br />
on the eastern South Pacific surface circulation, based on<br />
some 25 years of drifter measurements.<br />
[3] As eddies are an important mechanism for the transport<br />
of heat, salt, <strong>and</strong> momentum <strong>and</strong> in order to better<br />
describe the oceanic features in the study region, an estimation<br />
of the lateral eddy diffusivity is also given. Different<br />
methods have been used in the last decade to estimate the<br />
diffusivity of the Pacific Ocean. For example, Stammer<br />
[1998] used satellite altimetry to show lateral diffusivity<br />
in the world ocean over a 5° 5° latitude-longitude grid,<br />
whereas Zhurbas <strong>and</strong> Oh [2003, 2004] used drifter data to<br />
describe diffusivity in both the Atlantic <strong>and</strong> Pacific oceans.<br />
The method used by these last authors is derived from the<br />
studies of Davis [1987, 1991]. Here we provide an independent<br />
estimation of lateral diffusivity based on Taylor’s<br />
[1921] theory as well as Lagrangian statistics of the eastern<br />
South Pacific region (10°–34°S, 70°–100°W). The important<br />
drifter data set allows us to estimate the velocity field<br />
<strong>and</strong> its variance, the eddy kinetic energy, the temporal <strong>and</strong><br />
C05014 1of17
C05014 CHAIGNEAU AND PIZARRO: CIRCULATION OF THE EASTERN SOUTH PACIFIC<br />
spatial decorrelation scales, <strong>and</strong> diffusivity, along with error<br />
estimates. We also determine the respective contributions of<br />
horizontal advection <strong>and</strong> turbulent diffusion on passive<br />
tracer fluxes. Mean advective <strong>and</strong> eddy diffusive temperature<br />
<strong>and</strong> salinity fluxes are thus estimated in the mixed layer<br />
of the whole study region. The ensemble of the results<br />
provides a useful tool for a comparison with the previous<br />
studies but also for the validation of both regional <strong>and</strong><br />
global models in the eastern South Pacific.<br />
[4] This work is organized as follows: section 2 describes<br />
the data sets <strong>and</strong> processing methods used; section 3 deals<br />
with the surface circulation <strong>and</strong> eddy kinetic energy; <strong>and</strong><br />
section 4 analyses Lagrangian scales of variability <strong>and</strong> eddy<br />
diffusivity. In section 5, we estimate the respective role of<br />
the large-scale advection <strong>and</strong> turbulent diffusive flow on the<br />
mixed layer temperature <strong>and</strong> salinity fluxes. Finally, section<br />
6 summarizes the study results.<br />
2. Data Set<br />
[5] The major data sets used in this study are surface<br />
satellite-tracked drifters <strong>and</strong> Topex-Poseidon/ERS1-2 altimeters<br />
measurements. Additionally, the World Ocean Atlas<br />
2001 (WOA) climatology <strong>and</strong> satellite ERS winds are also<br />
used. The study region extends from 10°S to34°S<strong>and</strong> from<br />
70°W to 100°W (Figure 1b).<br />
[6] The surface satellite-tracked drifters data set spans<br />
1979–2003 <strong>and</strong> is part of the Global Drifter Program/<br />
Surface Velocity Program. The drifters were equipped with<br />
a holey sock drogue centered at 15m depth in order to reduce<br />
surface drag induced by both wind <strong>and</strong> waves. The expected<br />
drogue slip relative to the water is less than 2 cm s 1 for<br />
winds up to 20 m s 1 [Niiler <strong>and</strong> Paduan, 1995; Niiler et al.,<br />
1995]. The Atlantic Oceanographic <strong>and</strong> Meteorological<br />
Laboratory (AOML, Miami) received the drifter positions<br />
from Doppler measurements from Service ARGOS. These<br />
positions, irregularly distributed in time, were therefore<br />
quality controlled <strong>and</strong> interpolated to uniform 6 hour intervals<br />
using an optimum interpolation procedure [Hansen <strong>and</strong><br />
Poulain, 1996]. Velocity components were calculated by a<br />
centered difference scheme at each 6 hour interval. In our<br />
study area, a total of 476 different drifters, able to exit <strong>and</strong><br />
return to the area, were followed. To remove high-frequency<br />
tidal <strong>and</strong> inertial wave energy <strong>and</strong> to avoid aliasing the<br />
energy into the low-frequency motions, the four daily drifter<br />
data were averaged over 24 hour intervals [Swenson <strong>and</strong><br />
Niiler, 1996; Martins et al., 2002]. A total of 72,244 daily<br />
buoy position <strong>and</strong> velocity data were thus obtained from<br />
1979 to 2003. Figure 1a shows the yearly distribution of the<br />
number of daily observations. In the study region for all the<br />
years between 1979 <strong>and</strong> 2003, the maximum amount of data<br />
were observed during the 1990s, corresponding to the World<br />
Ocean Circulation Experiment period, with a maximum of<br />
9948 observations in 1993 <strong>and</strong> none in 1980 <strong>and</strong> 1984. The<br />
results did not differ significantly when considering data<br />
from the last decade (1991–2003) or the entire study period,<br />
although the number of degrees of freedom was decreased.<br />
In order to reduce the errors, we thus prefer use the whole<br />
drifter data set. All seasons of the year were equally sampled<br />
(not shown), with a minimum of around 15,000 observations<br />
in austral summer (January to March) <strong>and</strong> a maximum of<br />
20,000 in austral spring (October to December). The results<br />
2of17<br />
obtained hereafter are thus representative of an annual mean<br />
state. Figure 1b shows the spatial coverage of the daily<br />
data (shading) in the study region, <strong>and</strong> the number of<br />
degrees of freedom or independent observations (see section<br />
3.1 for calculation explanation). The bins have a minimum<br />
size of 2° 2° latitude-longitude <strong>and</strong> are adjusted, especially<br />
along the Chilean coast, to contain more than 6 independent<br />
observations. Only 33 of the 152 cells contained less than 20<br />
independent data. The southwestern part of the region was<br />
extensively sampled, with more than 70 independent observations<br />
in each bin south of 24°S <strong>and</strong> west of 84°W. In<br />
contrast, along the continental coast, the grid cells contain<br />
only between 6 <strong>and</strong> 35 degrees of freedom. For practical<br />
reasons, we have chosen 50 daily data or 6 independent<br />
observations as a lower limit, to make a compromise<br />
between reasonable grid cell dimensions <strong>and</strong> robustness of<br />
the results.<br />
[7] The satellite altimetry data set used in this study is the<br />
gridded product of Topex/Poseidon, ERS-1/2, <strong>and</strong> Jason-1<br />
sea level anomalies (SLA) provided by Archiving Validation<br />
<strong>and</strong> Interpretation of Satellite Data in Oceanography<br />
(AVISO). This data set spans 1993–2003, with weekly SLA<br />
distributed on a 1/3° Mercator Grid. The methods used to<br />
process the data <strong>and</strong> reduce the errors are described by Le<br />
Traon et al. [1995] <strong>and</strong> Le Traon <strong>and</strong> Ogor [1998] <strong>and</strong> by<br />
Ducet et al. [2000]. Zonal <strong>and</strong> meridional components of<br />
the residual sea surface velocity components were calculated<br />
from the SLA, using the geostrophic relationship<br />
V 0 g<br />
U 0 g<br />
¼ g<br />
f<br />
¼ g<br />
f<br />
@ ðSLAÞ @y<br />
@ ðSLAÞ ;<br />
@x<br />
where g is the acceleration due to gravity, f is the Coriolis<br />
parameter, <strong>and</strong> @x <strong>and</strong> @y are the eastward <strong>and</strong> northward<br />
distances.<br />
[8] Time mean eddy kinetic energy (per unit of mass),<br />
EKE, is calculated using<br />
EKE ¼ 1<br />
2<br />
U 0 2<br />
g þ V 0 2<br />
g<br />
where the overbar denotes time average.<br />
[9] Monthly temperature <strong>and</strong> salinity climatologies on a<br />
1/4° latitude 1/4° longitude grid from the World Ocean<br />
Atlas were used to estimate surface geostrophic velocities<br />
relative to 1750 m depth. Generally, the common reference<br />
level is chosen at around 3500 m in the study region<br />
[Shaffer et al., 2004; Leth et al., 2004], but as this area<br />
is one of the least-sampled of the world oceans, the use of<br />
a climatology down to 3500 m may introduce important<br />
errors rather than improve our results. Furthermore, based<br />
on three hydrographic sections, Leth et al. [2004] show<br />
that the maximum horizontal velocity between 1750 m <strong>and</strong><br />
3500 m depth is less than 0.02 cm s 1 in the study area.<br />
Therefore we suppose that the 1750 m reference level does not<br />
introduce a significant error in the surface velocity calculation.<br />
In contrast to geostrophic velocities estimated from<br />
;<br />
C05014
C05014 CHAIGNEAU AND PIZARRO: CIRCULATION OF THE EASTERN SOUTH PACIFIC<br />
Figure 1. (a) Yearly distribution of buoy-day data from 1979 to 2003. (b) Spatial distribution of daily<br />
data (shading) <strong>and</strong> of buoy independent observations (numbers). The areas defined by bold lines<br />
correspond to the South Equatorial Current region (10°–20°S, 82°–100°W), the South Pacific Current<br />
region (30°–34°S, 86°–100°W), <strong>and</strong> the Chile-Peru Current region (24°–34°S, 70°–82°W).<br />
satellite altimetry, the velocity field obtained from hydrographic<br />
data includes the mean flow. To better interpret results<br />
from the drifters, surface Ekman velocities were estimated<br />
using weekly ERS1-2 wind stress on a 1° 1° latitudelongitude<br />
grids over the 1991–2001 period. Ekman transport<br />
was computed using<br />
Mx ¼ ty<br />
rf<br />
My ¼ tx<br />
rf ;<br />
where (M x, M y) are the horizontal components of the total<br />
Ekman transport, (t x, t y) the 10 m wind stress components,<br />
3of17<br />
r the regional mean water density (r = 1024 kg m 3 ), <strong>and</strong> f<br />
the Coriolis parameter.<br />
[10] The ageostrophic velocity components are then approximated<br />
by<br />
UEk ¼ Mx<br />
DEk<br />
VEk ¼ My<br />
;<br />
DEk<br />
C05014<br />
where DEk is the depth of the Ekman layer determined by<br />
[e.g., Cushman-Roisin, 1994]<br />
DEk ¼ 0:4<br />
rffiffiffi<br />
t<br />
;<br />
f r
C05014 CHAIGNEAU AND PIZARRO: CIRCULATION OF THE EASTERN SOUTH PACIFIC<br />
Figure 2. Mean surface circulation obtained from (a) satellite-tracked drifters, (b) the World Ocean<br />
Atlas (WOA) (2001) <strong>and</strong> Ekman velocities (see text), (c) the WOA only, <strong>and</strong> (d) Ekman velocities only<br />
(black arrows). The mean ERS wind stress from 1991 to 2001 is also plotted (blue arrows). The color<br />
code in Figure 2a corresponds to the relative velocity errors: black is less than 30%, blue is between 30<br />
<strong>and</strong> 50%, green is between 50 <strong>and</strong> 80%, <strong>and</strong> red is over 80%. The arrow’s origin is located at the average<br />
drifter position in each box. Bold lines show the SPC, SEC, <strong>and</strong> PCC.<br />
where 0.4 is an empirical factor [Mofjeld <strong>and</strong> Lavelle,<br />
1984; Stigebr<strong>and</strong>t, 1985]. According to this relationship,<br />
the estimated Ekman layer depth varies from 30–50 m<br />
south of 20°S to 100–130 m north of 14°S. This crude<br />
Ekman layer depth estimation does not include the effect<br />
of stratification <strong>and</strong> overestimates the mixed layer depth<br />
principally in the North of the domain. Nevertheless, in the<br />
absence of other relevant information, we assume that the<br />
obtained underestimated velocities give at first order, a<br />
reasonable estimation of the surface layer wind driven<br />
motions.<br />
3. Surface Current Properties in the Eastern<br />
South Pacific<br />
3.1. Surface Circulation<br />
[11] Assuming stationary statistics, the drifter velocity<br />
components were averaged in each spatial bin shown in<br />
Figure 1b. Figure 2a shows the large-scale surface circulation<br />
of the eastern South Pacific inferred from this data set.<br />
We note a relatively week eastward flow of 3–4 cm s 1<br />
south of 32°S, which is the signature of the eastern<br />
extension of the West Wind Drift [Strub et al., 1998; Vega,<br />
2003] also called South Pacific Current (SPC) [Stramma et<br />
al., 1995; Tomczak <strong>and</strong> Godfrey, 1994]. As it flows toward<br />
the South American coast, part of this current is deflected<br />
4of17<br />
northward to form the Chile-Peru Current (CPC). The CPC<br />
shows punctual velocities of 15–20 cm s 1 (Figure 2a).<br />
This current is also known as the Peru Current, Peru-Chile<br />
Current, <strong>and</strong> Humboldt Current [Wyrtki, 1964; Tomczak <strong>and</strong><br />
Godfrey, 1994; Strub et al., 1998], but due to its south to<br />
north orientation, we prefer the name ‘‘Chile-Peru Current’’<br />
introduced by Wooster [1970]. North of 25°S, the surface<br />
coastal currents are weaker (5–7 cm s 1 ) <strong>and</strong> are oriented to<br />
the west/northwest to feed the broad branch of the South<br />
Equatorial Current (SEC) [Tomczak <strong>and</strong> Godfrey, 1994].<br />
This region shows uniform westward flow driven by trade<br />
winds with typical values of 9–12 cm s 1 north of 20°S. A<br />
more detailed analysis on a 1° 1° grid shows a southward<br />
flow closer to the coast. Even if this current can be<br />
associated with the Peru-Chile Countercurrent [Strub et<br />
al., 1998], the results remain inconclusive due to the<br />
insufficient amount of data <strong>and</strong> their irregular spatial <strong>and</strong><br />
temporal distributions.<br />
[12] The error DU =(DU, DV) of the mean velocities U =<br />
(U,V) was evaluated using Student’s t test with a significance<br />
level of 5%:<br />
DU ¼ tN 1;0:025<br />
rffiffiffiffiffiffiffiffiffiffiffiffiffi<br />
varðUÞ ;<br />
N*<br />
C05014
C05014 CHAIGNEAU AND PIZARRO: CIRCULATION OF THE EASTERN SOUTH PACIFIC<br />
Table 1. Statistics of the South Equatorial Current (SEC), the South Pacific Current (SPC), <strong>and</strong> the Chile-Peru Current (CPC), Obtained<br />
From Drifter Data <strong>and</strong> Calculated Surface Geostrophic <strong>and</strong> Ekman Velocities (WOA+ERS)<br />
N *a<br />
U ± DU, cms 1<br />
where tN 1,0.025 represents the Student’s t parameter, var(U)<br />
is the velocity variance, <strong>and</strong> N* the number of independent<br />
observations given by [Flierl <strong>and</strong> McWilliams, 1977]<br />
N* ¼ NDt<br />
2T ;<br />
V ± DV, cms 1<br />
where N is the number of daily observations, Dt = 1 day is<br />
the sample rate, <strong>and</strong> T = 6 days is the temporal decorrelation<br />
scale found in section 4.1. Using this method, we expect<br />
maximized error values, since the error variance is generally<br />
determined without multiplying it by Student’s t parameter<br />
[Flierl <strong>and</strong> McWilliams, 1977; Zhang et al., 2001].<br />
[13] The relative velocity errors (DU/U) are indicated by<br />
the colored arrows in Figure 2a. The relative error for more<br />
than 2/3 of the surface velocities is less than 50% (black <strong>and</strong><br />
blue arrows). Maximum errors are found where surface<br />
velocities are weaker than 1 cm s 1 (between 28°S <strong>and</strong><br />
32°S) or along the coast, where the number of independent<br />
observations is small. In contrast, minimum errors are<br />
encountered in the north of the study area, where the<br />
number of independent observations is relatively high <strong>and</strong><br />
the velocity variance relatively weak.<br />
[14] Figure 2c shows the mean surface geostrophic<br />
velocities derived from dynamic heights calculated from<br />
the WOA (2001) hydrographic data. The geostrophic<br />
circulation does not reproduce the velocity field inferred<br />
from surface drifters; even if the geostrophic flow shows<br />
an eastward current associated with the SPC, the SEC exhibits<br />
a stronger northward component not observed in Figure 2a.<br />
Geostrophic velocities are weaker than 3–4 cm s 1 in all but<br />
the southwestern <strong>and</strong> northwestern sectors (4–6 cm s 1 <strong>and</strong><br />
6–9 cm s 1 , respectively). Undoubtedly, the ageostrophic<br />
part of the current plays an important role in surface circulation.<br />
Figure 2d shows the mean ERS wind stresses (blue<br />
arrows) <strong>and</strong> the inferred Ekman velocities (black arrows). The<br />
jUj ± DU, cms 1<br />
u 0 2 ,cm 2 s 2<br />
v 0 2 ,cm 2 s 2<br />
u 0 v 0 ,cm 2 s 2<br />
SEC (10°–20°S, 80°–100°W)<br />
Annual 1342 7.4 ± 0.5 1.6 ± 0.5 7.6 ± 0.4 93.2 84.9 1.4 1.1<br />
Summer 295 6.3 ± 1.1 2.2 ± 1.1 6.6 ± 1.0 101.9 95.5 0.3 1.1<br />
Fall 364 7.1 ± 1.0 2.2 ± 1.0 7.4 ± 0.8 89.8 84.9 0.8 1.1<br />
Winter 357 7.9 ± 1.0 0.5 ± 1.0 7.9 ± 0.8 88.4 71.8 2.4 1.2<br />
Spring 418 8±0.9 1.6 ± 0.9 8.1 ± 0.8 93.6 87.9 2.9 1.1<br />
WOA+ERS 2.7 0.6 2.8<br />
SPC (30°–34°S, 86°–100°W)<br />
Annual 1431 1.7 ± 0.6 0.8 ± 0.6 1.9 ± 0.4 118.6 91.7 7 1.3<br />
Summer 387 0.7 ± 1.0 0.3 ± 1.0 0.8 ± 0.7 99.3 73.5 6.1 1.4<br />
Fall 350 3 ± 1.1 1.5 ± 1.1 3.3 ± 0.8 118 88.7 7 1.3<br />
Winter 379 3.6 ± 1.2 0.9 ± 1.2 3.7 ± 0.8 134.2 109.1 12 1.2<br />
Spring 391 1.3 ± 1.0 0.7 ± 1.0 1.2 ± 0.7 112.7 95.2 5.5 1.2<br />
WOA+ERS 3.4 1.7 3.8<br />
CPC (24°–34°S, 70°–82°W)<br />
Annual 277 2.4 ± 1.2 5.4 ± 1.2 5.9 ± 1.0 110.4 108.7 15.2 1<br />
Summer 76 3 ± 2.2 5.3 ± 2.2 5.9 ± 1.8 97.2 89.8 7.4 1.1<br />
Fall 55 0.5 ± 3.0 3.4 ± 3.0 3.1 ± 2.1 120.9 72.6 5.5 1.7<br />
Winter 69 1.1 ± 2.5 5.9 ± 2.5 5.8 ± 2.2 111.2 136.7 26.6 0.8<br />
Spring 96 4 ± 2.1 6.3 ± 2.2 7.3 ± 1.8 108.1 119.7 21.3 0.9<br />
WOA+ERS 0.4 2.8 2.8<br />
a<br />
Number of independent observations.<br />
5of17<br />
C05014<br />
u0 2 /v0 2<br />
wind field shows three main characteristics: a weak wind<br />
regime in the south western boundary of our study region,<br />
leading to Ekman velocities weaker than 1 cm s 1 ;an<br />
alongshore component, persistent year-round [<strong>Pizarro</strong>,<br />
1999], which is upwelling favorable; north of 22°S <strong>and</strong><br />
offshore, a north/northwest component leads to important<br />
south/southwest Ekman velocities of 2–2.5 cm s 1 . The<br />
combination of mean geostrophic <strong>and</strong> ageostrophic velocities<br />
leads to a much better representation of the observed<br />
circulation from the drifters (Figure 2b). The inferred<br />
surface velocity directions are quite close to the observations<br />
with a continuous eastward flow north of 26°S, <strong>and</strong><br />
offshore flow near the coast. Although the direction of<br />
the mean currents is well-represented in Figure 2b, their<br />
magnitudes are weaker than that observed from drifters,<br />
except for the SPC. In the entire study area, the velocity<br />
modules are correlated at 40% at a significance level of<br />
0.05%, with a linear regression coefficient of 0.45. The<br />
correlation is 47% in the SEC <strong>and</strong> 66% in the SPC, with<br />
regression coefficients of 0.52 <strong>and</strong> 1.43. Coastal data for<br />
the CPC region is insufficient to determine significant<br />
correlations. Note that the correlation increases strongly<br />
considering only the zonal velocity component, with a<br />
value of 75% in the entire study domain <strong>and</strong> 80% in the<br />
SPC region. A more precise estimate of Ekman velocities<br />
could also increase the correlation, particularly in the<br />
SEC region, where the Ekman depth is overestimated.<br />
[15] Table 1 gives the annual <strong>and</strong> seasonal averages of the<br />
SPC, SEC, <strong>and</strong> CPC properties obtained from the drifter<br />
data. In comparison, the annual average of the combination<br />
of geostrophic <strong>and</strong> wind induced surface velocities is also<br />
given (WOA+ERS, Table 1). The SEC is dominated by its<br />
strong westward velocity component (7–8 cm s 1 ), which<br />
is quite stable throughout the year. The minimum of U =<br />
6.3 cm s 1 observed in austral summer (January to<br />
March) could be due to the reduced number of independent
C05014 CHAIGNEAU AND PIZARRO: CIRCULATION OF THE EASTERN SOUTH PACIFIC<br />
observations during this season (295 compared to 350–<br />
420), but also to the slight decrease of zonal wind stress<br />
intensity in the SEC region during the summer period (not<br />
shown). The velocity variance is quasi isotropic ( 90 cm 2<br />
s 2 ) with slightly higher variance along the zonal direction<br />
(u 0 2 /v 0 2 = 1.1). In contrast, the southwestern box related to<br />
the SPC shows strong seasonal variability with an eastward<br />
flow of 3–4 cm s 1 in fall (April to June) <strong>and</strong> winter<br />
(July to September), which decreases to 1 cm s 1 in<br />
spring (October to December) <strong>and</strong> reverses to a westward<br />
flow of 1cms 1 in summer. Even if the reversed current<br />
of 1cms 1 is not statistically significant <strong>and</strong> is on the<br />
order of the error (Table 1), a plot of the seasonal<br />
variability of the surface circulation (not shown) suggests<br />
meridional displacement of the southern limit of the SEC,<br />
with the westward current appearing between 30°S <strong>and</strong><br />
32°S during spring <strong>and</strong> summer, <strong>and</strong> between 26°S <strong>and</strong><br />
28°S in fall <strong>and</strong> winter. These oceanic seasonal variations<br />
are directly linked to the annual meridional displacement<br />
of the atmospheric high-pressure center of the eastern<br />
South Pacific, which migrates to the north during fall<br />
<strong>and</strong> winter. The seasonal wind stress calculated with the<br />
ERS data (not shown) in the same domain (30°S–34°S<br />
<strong>and</strong> 86°W–100°W) shows stronger magnitudes in fall <strong>and</strong><br />
winter (0.1 N m 2 ) than in spring <strong>and</strong> summer (0.05 N m 2 ).<br />
The SPC is anisotropic, with a 20–40% higher velocity<br />
variance along the zonal direction. The Chile-Peru Current<br />
shows a strong northward component, which is maximum in<br />
spring <strong>and</strong> minimum in fall. Again, this may be related to the<br />
wind regime because the satellite ERS measurements<br />
indicate stronger northward winds in this region between<br />
winter <strong>and</strong> summer (0.05–0.06 N m 2 ) than during fall<br />
(0.035 N m 2 ). On average, the CPC seems to be totally<br />
isotropic with a similar velocity variance of 110 cm 2 s 2<br />
in both zonal <strong>and</strong> meridional directions. On a seasonal<br />
scale, the data reveal strong anisotropy, for example,<br />
zonal variance is 70% stronger than its meridional counterpart<br />
in fall. This anisotropy could be linked to the<br />
Ekman transport, which indicates a zonal variance around<br />
250% stronger than the meridional variance during this<br />
season (not shown).<br />
[16] The quantification of the surface eddy momentum<br />
flux (u 0 v 0 ) is important for underst<strong>and</strong>ing how eddies may<br />
act to transport momentum into or away from the mean flow<br />
[Morrow et al., 1992]. In the first place, the SEC <strong>and</strong> SPC<br />
can be considered to be zonal <strong>and</strong> the CPC meridional. In<br />
this case, the cross stream flux of along-stream momentum<br />
by transient eddies is given by u 0 v 0 [Wilkin <strong>and</strong> Morrow,<br />
1994; Morrow et al., 1992, 1994]. For the westward SEC<br />
<strong>and</strong> eastward SPC, this term represents the meridional<br />
transfer of the zonal momentum, whereas for the equatorward<br />
CPC, it corresponds to the zonal transfer of meridional<br />
momentum. Owing to the mean westward (eastward, respectively)<br />
SEC (SPC), positive (negative) values of horizontal<br />
momentum flux (Table 1) correspond to a southward<br />
transport of the zonal momentum. The eddy flux momentum<br />
associated to the equatorward CPC is negative, with<br />
maximum values of around 25 cm 2 s 2 in austral winter<br />
<strong>and</strong> spring, revealing a westward transfer of the meridional<br />
momentum.<br />
[17] Table 1 also shows that the velocities obtained using<br />
the climatology <strong>and</strong> satellite wind data (WOA+ERS) un-<br />
6of17<br />
derestimate the South-Equatorial <strong>and</strong> Chile-Peru Currents<br />
<strong>and</strong> overestimate the South-Pacific Current. However, the<br />
directions of the SEC <strong>and</strong> SPC are well reproduced. In<br />
contrast, the intensity of the CPC is more than 2 times lower<br />
in the calculated velocities <strong>and</strong> the direction indicates a<br />
northward flow rather than an observed northwest current.<br />
These discrepancies may be induced by different factors,<br />
such as the coarse spatiotemporal resolution of the WOA<br />
climatology, or the Ekman velocity estimates, which are<br />
clearly underestimated in the northern part of the study<br />
region.<br />
3.2. Variance Ellipses<br />
[18] Velocity variance statistics were calculated from the<br />
drifter velocity components in each cell grid. From these<br />
data, we can compute the velocity variance terms (u0 2 , v0 2 )<br />
<strong>and</strong> the covariance term (u0v0 ). Following the method used<br />
first by Freel<strong>and</strong> et al. [1975] in the North Atlantic ocean,<br />
the magnitude <strong>and</strong> the direction of the eddy variability are<br />
represented using variance ellipses [Preisendorfer, 1988;<br />
Morrow et al., 1992, 1994]. The formula giving the major<br />
<strong>and</strong> minor axes of principal variability can be found in<br />
Morrow et al. [1994] <strong>and</strong> Le Traon <strong>and</strong> Morrow [2001].<br />
The direction of eddy momentum flux can be inferred from<br />
the ellipse orientation: negative u0v0 correspond to ellipses<br />
oriented southeastward, whereas ellipses oriented toward<br />
the northeast quadrant have positive u0v0 [Le Traon <strong>and</strong><br />
Morrow, 2001].<br />
[19] Velocity variance ellipses reveal the principal direction<br />
<strong>and</strong> anisotropic nature of the variability, as well as the<br />
magnitude <strong>and</strong> spatial distribution of the eddy energy.<br />
Figure 3 confirms the previous results that the flow tends<br />
to be nonisotropic in the most part of the domain <strong>and</strong> overall<br />
along the coast where the eddy kinetic energy is higher<br />
[Hormazabal et al., 2004]. In the SEC (SPC, relatively)<br />
region, the ellipses are oriented to the northeast (southeast),<br />
in agreement with the positive (negative) eddy momentum<br />
fluxes u0v0 (Table 1). The southeast orientation of the<br />
ellipses in the CPC region also confirms the negative values<br />
of u0v0 shown in Table 1.<br />
3.3. Eddy Kinetic Energy<br />
[20] The mean eddy kinetic energy per unit of mass is<br />
calculated in each bin from the drifter data using<br />
EKE ¼ 1<br />
ð 0 2Þ;<br />
2 u0 2 þ v<br />
C05014<br />
where the overbar denotes time average.<br />
[21] The EKE is, on average, weaker in the SEC region<br />
defined in Table 1 (87.7 cm 2 s 2 ) than in the SPC region<br />
(103 cm 2 s 2 ) <strong>and</strong> CPC region (112.7 cm 2 s 2 ). The<br />
mean kinetic energy (MKE = 1/2(U 2 + V 2 )) is 2–3 times<br />
smaller than the EKE in the SPC <strong>and</strong> CPC (35.9 cm 2 s 2<br />
<strong>and</strong> 44.9 cm 2 s 2 ) <strong>and</strong> negligible in the SEC region<br />
(4.1 cm 2 s 2 ).<br />
[22] Despite the nonuniform character of the data,<br />
Figure 4a shows a decrease in EKE values from 200–<br />
300 cm 2 s 2 along the continental coast to 50–100 cm 2 s 2 in<br />
the interior ocean. We also note the presence of a<br />
local maximum of around 140 cm 2 s 2 in the southwest<br />
boundary of the domain linked to the seasonal meridional
C05014 CHAIGNEAU AND PIZARRO: CIRCULATION OF THE EASTERN SOUTH PACIFIC<br />
Figure 3. Velocity variance ellipses from drifter velocity components (see text). The ellipse’s center is<br />
located at the average drifter positions in each box. The scale ellipse has a major axis of 500 cm 2 s 1 ,a<br />
minor axis of 250 cm 2 s 1 , <strong>and</strong> is rotated 90° from the north.<br />
shift of the SPC. The maxima observed near the continent<br />
may be due to the interaction of the Peru-Chile Current<br />
System with the coastline. The strong upwelling front<br />
observed here during summer <strong>and</strong> spring could also<br />
contribute to generate baroclinic instabilities that increase<br />
mesoscale variability. Furthermore, coastal flow shows<br />
large intraseasonal <strong>and</strong> seasonal variability [<strong>Pizarro</strong> et<br />
al., 2002] related to disturbances of equatorial origin that<br />
may reinforce the rather unstable coastal jet. On the other<br />
h<strong>and</strong>, downwelling phase Kelvin waves largely intensify<br />
the Peru-Chile Undercurrent [Shaffer et al., 1997], which<br />
may also destabilize the near-surface coastal circulation<br />
generating eddies. Such a mechanism has been proposed<br />
to explain the formation of eddies observed off the west<br />
coast of Mexico during El Niño periods [Zamudio et al.,<br />
2001]. Thus all these processes can act together to create<br />
strong instabilities responsible for the enhanced EKE<br />
along the coast.<br />
[23] The EKE derived from satellite altimetry data<br />
(Figure 4b) confirms the distribution patterns obtained<br />
from the drifter data set, with maximum levels of EKE<br />
concentrated along the coast, but the magnitudes are<br />
about 2 times smaller. Differences between the two data<br />
sets are probably due to the fact that satellite data refers<br />
to the geostrophic components of the flow only, whereas<br />
the drifter EKE also includes the ageostrophic component<br />
(see section 3.1). Furthermore, the altimetry data are<br />
representative of the upper water column (1000–1500 m),<br />
whereas the drifter circulation is influenced by the dynamics<br />
of the first 15 m. A number of additional processes, not<br />
well-resolved by satellite measurements, can take place in<br />
this shallower layer. The goal of the next section is thus to<br />
7of17<br />
C05014<br />
describe the Lagrangian properties of the mesoscale structures<br />
observed with the satellite-tracked drifters.<br />
4. Lagrangian Properties of the Eastern<br />
South Pacific<br />
[24] Stammer [1997] used satellite altimetry data to<br />
describe the mesoscale characteristics (length scales <strong>and</strong><br />
timescales) <strong>and</strong> lateral diffusivity of the world ocean.<br />
Zhurbas <strong>and</strong> Oh [2003] used drifter data <strong>and</strong> Davis’s<br />
[1987, 1991] approach, to give the Lagrangian scales of<br />
the horizontal turbulent flow of the whole Pacific ocean<br />
over a 5° 5° latitude-longitude grid. Here we use an<br />
independent <strong>and</strong> simpler method [Taylor, 1921] based on<br />
the integration of the Lagrangian velocity autocovariance<br />
function. This method has been tested with drifter observations<br />
in the North Atlantic region [Colin de Verdiere, 1983;<br />
Krauss <strong>and</strong> Böning, 1987; Martins et al., 2002], in the<br />
Northwest <strong>and</strong> tropical Pacific [Oh et al., 2000; Bauer et al.,<br />
1998, 2002], <strong>and</strong> in other eastern boundary current regions<br />
[Poulain <strong>and</strong> Niiler, 1989; Brink et al., 1991]. All these<br />
studies show that when stationary <strong>and</strong> homogeneous turbulence<br />
is considered, the drifter’s dispersion is well modeled<br />
by Taylor’s [1921] hypothesis. We thus expect that the same<br />
conclusions are also valid in our study region, based on the<br />
surface data set having high number of degrees of freedom<br />
(overall in the interior ocean).<br />
4.1. Lagrangian Scales of the Surface Turbulent Flow<br />
[25] In the ocean, the transport of passive tracers depends<br />
on an infinite number of scales of motion <strong>and</strong> assumptions<br />
are necessary to obtain simplified equations of motion for
C05014 CHAIGNEAU AND PIZARRO: CIRCULATION OF THE EASTERN SOUTH PACIFIC<br />
Figure 4. Spatial distribution of eddy kinetic energy from (a) drifter data <strong>and</strong> (b) satellite altimeter<br />
measurements of TP/ERS. Bold lines show the SPC, SEC, <strong>and</strong> PCC.<br />
the tracer evolution. In a Lagrangian frame, the most<br />
common is that the velocity field can be decomposed in a<br />
mean flow U =(U, V) representative of large spatial scale,<br />
<strong>and</strong> in a turbulent mesoscale flow u 0 =(u 0 , v 0 ) computed<br />
following the fluid particles [Poulain <strong>and</strong> Niiler, 1989;<br />
Bauer et al., 1998, 2002; Kundu <strong>and</strong> Cohen, 2000]. Thus<br />
the mean current U is determined by averaging the velocity<br />
components over each drifter trajectory. The main properties<br />
of the turbulent velocity field u 0 are the Lagrangian integral<br />
time <strong>and</strong> length scales (T <strong>and</strong> L, respectively), which<br />
represents the time <strong>and</strong> the distance over which a particle<br />
remembers its path.<br />
[26] For each component of the turbulent velocities (u 0 , v 0 ),<br />
we can determine a temporal scale T =(T u, T v) by integrating<br />
the respective velocity autocovariance function R =(R u, R v)<br />
to its first zero crossing G [Taylor, 1921]:<br />
T ¼ 1<br />
Rð0Þ<br />
Z G<br />
0<br />
RðtÞdt:<br />
8of17<br />
C05014<br />
The Lagrangian autocovariance functions Ru (t) =<br />
u0ðÞu t 0ðtþtÞ <strong>and</strong> Rv (t) =v0ðÞv t 0ðtþtÞ (here the overbar<br />
denotes ensemble average) were determined for each drifter<br />
spending more than 20 days in the domain <strong>and</strong> averaged in<br />
time. A total of 353 drifter trajectories, assumed to be<br />
independent, were then used to calculate this mean<br />
autocovariance function. If a drifter exits the area <strong>and</strong><br />
returns several days later, the two different trajectories are<br />
considered distinctly. Figure 5a shows the mean autocovariance<br />
functions. The zonal <strong>and</strong> meridional components have<br />
an e-folding scale (time lag at which the normalized<br />
autocorrelation functions fall to 1/e = 0.368) of 4.1 days <strong>and</strong><br />
3.7 days, respectively; their first zero crossings are 50 <strong>and</strong><br />
16 days.<br />
[27] Figure 5b shows the integral timescales of the<br />
normalized autocovariance functions <strong>and</strong> indicates that the<br />
zonal components converge between 50 <strong>and</strong> 90 days <strong>and</strong><br />
the meridional components between 15 <strong>and</strong> 25 days. After<br />
these periods, the autocorrelation functions still statistically<br />
converge to zero (Figure 5a), but as they are slightly
C05014 CHAIGNEAU AND PIZARRO: CIRCULATION OF THE EASTERN SOUTH PACIFIC<br />
Figure 5. (a) Normalized mean time-lagged autocovariance functions for both velocity departure<br />
components based on the full drifter data set. (b) Estimates of the integral timescales Tu <strong>and</strong> Tv. Crosses<br />
indicate the dates of the first zero crossing of both autocorrelation functions.<br />
negative, the integral timescales decrease (Figure 5b). For<br />
this reason, timescales, which theoretically correspond to<br />
the integration of the normalized autocovariance functions<br />
to the infinite [Kundu <strong>and</strong> Cohen, 2000], are calculated only<br />
to the first zero crossing. This method is commonly used<br />
when R is contaminated at large lags by noise <strong>and</strong> uncertainties<br />
in mean current [Richman et al., 1977; Poulain <strong>and</strong><br />
Niiler, 1989; Stammer, 1997, 1998; Lumpkin <strong>and</strong> Flament,<br />
2001]. The obtained zonal <strong>and</strong> meridional timescales reveal<br />
the nonisotropic nature of the flows with values of 5.9 days<br />
<strong>and</strong> 3.5 days, respectively (Table 2). On the basis of a<br />
Student’s t test, with a significance level of 5%, we<br />
estimated the timescale errors to be less than 0.6 days <strong>and</strong><br />
0.4 days in both directions. These temporal scales of 3–<br />
Table 2. Lagrangian Time <strong>and</strong> Length Scales, Velocity Variances, <strong>and</strong> Diffusivities for Both Zonal <strong>and</strong> Meridional Directions a<br />
T u, days T v, days L u,km L v,km u 0 2 ,cm 2 s 2<br />
v 0 2 ,cm 2 s 2<br />
K u,10 7 cm 2 s 1<br />
K v,10 7 cm 2 s 1<br />
Global 5.9 ± 0.6 3.5 ± 0.4 40.7 ± 5.4 29.0 ± 3.4 95.8 77.3 4.9 ± 0.5 (5) 2.6 ± 0.3 (2.7)<br />
Global b<br />
6.5 ± 0.3 3.7 ± 0.2 38.9 ± 2.0 23.9 ± 1.0 87.3 65.5 4.9 ± 0.3 (4.8) 2.1 ± 0.2 (2.3)<br />
SEC b<br />
4.8 ± 0.4 3.3 ± 0.3 24.7 ± 2.9 19.1 ± 2.0 75.0 61.8 3.1 ± 0.3 (2.7) 1.8 ± 0.2 (1.9)<br />
SPC b<br />
3.1 ± 0.2 2.4 ± 0.2 19.5 ± 1.8 16.0 ± 1.3 99.2 77.2 2.7 ± 0.2 (2.4) 1.6 ± 0.2 (1.6)<br />
CPC b<br />
3.3 ± 0.8 3.5 ± 0.5 24.1 ± 4.7 19.7 ± 3.6 77.2 60.4 2.2 ± 0.5 (2.5) 1.8 ± 0.4 (2)<br />
a<br />
These were obtained from trajectories longer than 20 days. Each characteristic is given for the entire study region (Global), the SPC, SEC, <strong>and</strong> CPC. For<br />
the diffusivities the first number corresponds to the product of the variance <strong>and</strong> the Lagrangian timescale, whereas the second number (in parentheses) is<br />
obtained from the integration of the autocorrelation function (see text for details).<br />
b<br />
Values obtained with reinitialized trajectories (see text for details).<br />
9of17<br />
C05014
C05014 CHAIGNEAU AND PIZARRO: CIRCULATION OF THE EASTERN SOUTH PACIFIC<br />
6 days are equivalent to those of the tropical Pacific [Bauer<br />
et al., 1998] <strong>and</strong> close to the 2–7 days observed in the<br />
California currents [Swenson <strong>and</strong> Niiler, 1996].<br />
[28] Corresponding to the integral timescales, we can<br />
determine the integral length scales in each direction L =<br />
(Lu, Lv) using [Taylor, 1921; Knudsen <strong>and</strong> Katz, 1958]<br />
ffiffiffiffiffiffi<br />
L ¼ u02 q<br />
T;<br />
ffiffiffiffiffiffi<br />
where u02 p<br />
represents the st<strong>and</strong>ard deviation of the turbulent<br />
flow velocity. The mean Lagrangian length scales <strong>and</strong> the<br />
associated errors determined by Student’s t test, with a<br />
significance level of 5%, are 40.7 ± 5.4 km for the zonal<br />
direction <strong>and</strong> 29 ± 3.4 km for the meridional direction<br />
(Table 2), again showing the anisotropic nature of the<br />
study region. In the California Current region, Swenson<br />
<strong>and</strong> Niiler [1996] estimate typical space scales of 16–59 km.<br />
Depending on the subregion of the California Current Systems,<br />
the turbulent flow can show elongated time <strong>and</strong> length<br />
scales along both the zonal <strong>and</strong> meridional directions<br />
[Swenson <strong>and</strong> Niiler, 1996]. In this study, we have also<br />
shown the anisotropic character of the surface ocean in<br />
the eastern South Pacific; on average, both temporal <strong>and</strong><br />
spatial scales were elongated in the zonal direction.<br />
4.2. Lateral Dispersion <strong>and</strong> Diffusivity<br />
[29] The large mixing rate in a turbulent flow is due to the<br />
fact that the fluid particles gradually diverge from their<br />
initial location. Taylor [1921] has shown that, in steady <strong>and</strong><br />
homogeneous turbulence withoutffiffiffiffiffiffiffi mean flow, the zonal <strong>and</strong><br />
meridional particle dispersion X02 p pffiffiffiffiffiffiffi<br />
pffiffiffiffiffiffiffi<br />
=( X 0 2,<br />
Y 0 2)<br />
from<br />
its origin can be related to the velocity autocorrelation<br />
function by [e.g., Kundu <strong>and</strong> Cohen, 2000; Zhang et al.,<br />
2001; Martins et al., 2002]<br />
X02 ðÞ¼2 t u02 t<br />
Z t<br />
0<br />
1<br />
t<br />
t<br />
RðtÞ RðÞ 0<br />
dt;<br />
where the overbar denotes ensemble average of individual<br />
particles <strong>and</strong> X 0 = (X 0 , Y 0 ) is the Lagrangian position<br />
inferred by u 0 =(u 0 , v 0 ). In practice, if the statistics are<br />
stationary, the ensemble average is replaced by an average<br />
in time.<br />
[30] Figure 6a shows the zonal <strong>and</strong> meridional dispersion<br />
of the drifters due to both velocity components. If t is small<br />
compared to the autocorrelation scales, the autocorrelation<br />
function R tends to R(0) (Figure 5b) <strong>and</strong> the initial<br />
dispersion increases linearly with time <strong>and</strong> is proportional<br />
to the intensity of turbulent fluctuations:<br />
rms X 0<br />
ffiffiffiffiffiffiffi<br />
ð Þ ¼ X02 q ffiffiffiffiffiffi<br />
¼ u02 p<br />
t:<br />
Figure 6a shows effectively that for t < 3 days, the zonal <strong>and</strong><br />
meridional dispersions increase linearly with time, <strong>and</strong> that<br />
for t < 8 days, they exhibit the same characteristics.<br />
[31] For a long time t,<br />
rms X 0<br />
ffiffiffiffiffiffiffi<br />
ð Þ ¼ X02 q ffiffiffiffiffiffiffiffiffiffiffiffiffiffiffiffi<br />
¼ 2u02 p<br />
T t;<br />
where T =(T u, T v) is the integral timescale. Using T u =<br />
5.9 days <strong>and</strong> T v = 3.5 days, Figure 6a shows that the<br />
10 of 17<br />
dispersion of the drifters are close to the ‘‘r<strong>and</strong>om walk’’<br />
regime predicted by Taylor [1921] for lags between 10<br />
<strong>and</strong> 100 days. This relationship has been also observed in<br />
other ocean basins [e.g., Zhang et al., 2001; Martins et<br />
al., 2002]. For times longer than 100 days, the number of<br />
data drops drastically (Figure 6b) from around 350 for<br />
short times to around 120 for a lag of 200 days, <strong>and</strong> we<br />
have less confidence in the particle dispersions showing a<br />
plateau. After 100 days, the turbulent flow has displaced<br />
the drifters an average of 320 km zonally <strong>and</strong> 200 km<br />
meridionally from their origins. This result is consistent<br />
with the anisotropic nature of the turbulent flow observed<br />
in our study region.<br />
[32] The diffusivity K = (Ku, Kv) in a problem of<br />
turbulent dispersion corresponds to the rate at which the<br />
magnitude of X 0 =(X 0 , Y 0 ) increases with time <strong>and</strong> is given<br />
by [Martins et al., 2002; Kundu <strong>and</strong> Cohen, 2000]<br />
KðÞ¼ t<br />
1 d<br />
2 dt X02 Z<br />
¼ u02 t<br />
0<br />
RðtÞ Rð0Þ dt:<br />
K is computed from the normalized autocorrelation<br />
functions <strong>and</strong> therefore the theoretical diffusivities are<br />
expected to converge to a constant value after some integral<br />
timescales T. Analyzing the two limit conditions<br />
t T : KðÞ t u0 2 t<br />
t T : KðÞ t u0 2 T;<br />
C05014<br />
initially the diffusivity increases linearly with time, while<br />
for long times the diffusivity tends to a constant value<br />
depending on the integral timescale T.<br />
[33] The black lines in Figure 7 correspond to the<br />
diffusivities derived from the 353 independent drifter trajectories<br />
(section 4.1). The general forms of the curves are<br />
dominated by the form of the integrated normalized functions<br />
(Figure 5b), with a sharp increase for short times,<br />
followed by a plateau <strong>and</strong> then a decrease for longer times<br />
due to saturation <strong>and</strong> the negative values of the functions<br />
(Figure 5a). The product of the velocity variances by the<br />
integral timescales leads to Ku = (4.9 ± 0.5) 10 7 cm 2 s 1<br />
<strong>and</strong> Kv = (2.6 ± 0.3) 10 7 cm 2 s 1 (Table 2). Averaging the<br />
diffusivity curves over the saturation plateau between 40–<br />
70 days <strong>and</strong> 15–30 days in both zonal <strong>and</strong> meridional<br />
directions (bold black lines, Figure 7), we obtained, in the<br />
r<strong>and</strong>om walk regime, Ku =5 10 7 cm 2 s 1 <strong>and</strong> Kv =2.7<br />
10 7 cm 2 s 1 , in the range of the preceding error values.<br />
[34] To increase the realizations <strong>and</strong> the number of<br />
degrees of freedom, we reinitialized the trajectories every<br />
30 days (this value is much longer than the 3–6 day<br />
decorrelation timescale), as done in previous studies [Colin<br />
de Verdiere, 1983; Poulain <strong>and</strong> Niiler, 1989; Martins et al.,<br />
2002]. New autocorrelation functions (not shown) <strong>and</strong><br />
diffusivities (gray lines, Figure 7) are determined for each<br />
velocity component. Although meridional diffusivity is<br />
slightly reduced by this procedure, the results are quite<br />
close to those obtained for the initial trajectories (Table 2).<br />
For the r<strong>and</strong>om walk regime (t T), <strong>and</strong> averaging over<br />
the same zonal <strong>and</strong> meridional plateaus (40–70 days <strong>and</strong>
C05014 CHAIGNEAU AND PIZARRO: CIRCULATION OF THE EASTERN SOUTH PACIFIC<br />
Figure 6. (a) Dispersion of the drifters as a function of time due to both velocity anomaly components<br />
<strong>and</strong> (b) the number of data used for the calculation. The scales are logarithmic <strong>and</strong> the straight lines in<br />
Figure 6a correspond to Taylor’s [1921] asymptotes (see text).<br />
15–30 days respectively), the reinitialized trajectories give<br />
K u =4.8 10 7 cm 2 s 1 <strong>and</strong> K v =2.3 10 7 cm 2 s 1 .Asthe<br />
number of degrees of freedom was higher, we have<br />
more confidence in the values obtained from reinitialized<br />
trajectories, <strong>and</strong> in the next section, we use K u =4.8<br />
10 7 cm 2 s 1 <strong>and</strong> K v =2.3 10 7 cm 2 s 1 to make initial<br />
calculations of horizontal, eddy heat, <strong>and</strong> salt fluxes in the<br />
mixed layer. These values agree with the results of Bauer et<br />
al. [2002], who estimated the maximum values of diffusivity<br />
in the SEC region (between 10°–15°S <strong>and</strong> 100°–160°W) to<br />
be 4.8 10 7 cm 2 s 1 <strong>and</strong> 2.8 10 7 cm 2 s 1 in the zonal <strong>and</strong><br />
meridional directions.<br />
[35] Table 2 also shows the main turbulent flow characteristics<br />
(integral scales, velocity variances, diffusivities)<br />
of both the SEC, the SPC, <strong>and</strong> the CPC, calculated from<br />
reinitialized drifter trajectories in the corresponding subregion.<br />
The obtained diffusivities are on the order of 2.5–3<br />
10 7 cm 2 s 1 in the zonal direction <strong>and</strong> 1.5–2 10 7 cm 2 s 1 in<br />
11 of 17<br />
C05014<br />
the meridional direction, with larger errors in the CPC<br />
region due to the limited number of drifter trajectories<br />
near the coast. The elongation in the mean flow direction,<br />
seen in the SEC <strong>and</strong> SPC (Table 2), is reduced in the<br />
northward CPC, which shows a higher temporal decorrelation<br />
scale in the meridional direction. In both the<br />
subareas, the diffusivity estimated through the integral<br />
of the autocovariance function <strong>and</strong> from the derivative of<br />
the dispersion function agree well.<br />
5. Heat <strong>and</strong> Salt Fluxes<br />
[36] What is the respective role of the turbulent flow <strong>and</strong><br />
the mean current on the horizontal passive tracer fluxes in<br />
the surface layer of the eastern South Pacific? The answer is<br />
investigated by comparing the heat <strong>and</strong> salt fluxes due to<br />
both, horizontal advection by the large-scale currents <strong>and</strong><br />
lateral diffusion by mesoscale circulation. The heat <strong>and</strong> salt
C05014 CHAIGNEAU AND PIZARRO: CIRCULATION OF THE EASTERN SOUTH PACIFIC<br />
Figure 7. Estimates of the zonal <strong>and</strong> meridional components of eddy diffusivity in the whole region,<br />
based on the original (black lines) <strong>and</strong> reinitialized (shaded lines) drifter trajectories. The bold portions<br />
correspond to the periods where the diffusivities of the r<strong>and</strong>om walk regime are calculated.<br />
fluxes due to the mean horizontal currents of the surface<br />
layer were calculated using<br />
rCpHU gradðTÞ ¼ rCpH U @T @T<br />
þ V<br />
@x @y<br />
rHU gradðSÞ ¼ rH U @S<br />
@x<br />
þ V @S<br />
@y ;<br />
where T, S, <strong>and</strong> r are the WOA’s mean surface temperature,<br />
salinity, <strong>and</strong> density; H is the mixed layer depth fixed at 50 m;<br />
Cp is the specific heat of seawater (in J kg 1 K 1 ); <strong>and</strong> U =<br />
(Ux, Uy) is the sum of the mean surface geostrophic <strong>and</strong><br />
Ekman velocities (Figure 2b). The surface property gradients<br />
are considered to be uniform over the constant mixed layer of<br />
50 m. This level corresponds approximately to the mixed<br />
layer depth observed in the region from hydrographic data<br />
[Blanco et al., 2001; Tsuchiya <strong>and</strong> Talley, 1998] or from<br />
WOA climatology (not shown).<br />
12 of 17<br />
[37] On the other h<strong>and</strong>, the horizontal heat <strong>and</strong> salt fluxes<br />
linked to the turbulent flow (u 0 ) are related to the transport<br />
divergences (div) by a parameterization of the mixing<br />
processes. We assume that, in a first approximation, the<br />
turbulent fluxes are proportional to <strong>and</strong> in direction of the<br />
downward property gradients. They are then represented by<br />
the eddy diffusivity coefficient K =(K u, K v), previously<br />
determined in the whole study region from reinitialized<br />
trajectories, <strong>and</strong> obey the commonly used Fickian law<br />
rCpH div u 0 T 0<br />
ð Þ ¼ rCpH divð K rTÞ<br />
¼ rCpH Ku<br />
rH div u 0 S 0<br />
ð Þ ¼ rH divð K rSÞ<br />
¼ rH Ku<br />
@ 2 S<br />
@x<br />
@2T @<br />
þ Kv<br />
@x2 2T @y2 2 þ Kv<br />
@2S ;<br />
@y2 C05014<br />
with Ku =4.8 10 7 cm 2 s 1 <strong>and</strong> Kv =2.3 10 7 cm 2 s 1 .
C05014 CHAIGNEAU AND PIZARRO: CIRCULATION OF THE EASTERN SOUTH PACIFIC<br />
Figure 8. (a) Mean sea surface temperature <strong>and</strong> (b) sea surface salinity from the annual World Ocean<br />
Atlas (2001) climatology. The countergradient vectors are represented by arrows <strong>and</strong> indicate the<br />
direction of the horizontal diffusive transport (see text).<br />
[38] Figure 8 shows the mean surface temperature <strong>and</strong><br />
salinity fields of the WOA (2001), <strong>and</strong> the counter gradient<br />
vectors indicate the direction of the tracer transports induced<br />
by the turbulent flow. The surface temperature (Figure 8a) is<br />
maximum in the northwest of the study region (24°C) <strong>and</strong><br />
minimum in the southeast (less than 14°C). Along the coast,<br />
the northward wind regime produces upwelling of cold<br />
water into the surface layer, which leads to strong horizontal<br />
temperature gradients. The salinity distribution (Figure 8b)<br />
shows a patch of high salinities ( 36) centered at 18°S–<br />
98°W <strong>and</strong> fresher water along the coast with a minimum of<br />
around 34 in the southeastern limit of the study area.<br />
Therefore the counter temperature <strong>and</strong> salinity gradients<br />
<strong>and</strong> corresponding turbulent transports have principally<br />
southeastward orientations.<br />
[39] Figure 9 shows the mean <strong>and</strong> turbulent horizontal<br />
temperature <strong>and</strong> salinity fluxes over the mixed layer. The<br />
diffusive heat flux variations average ±15W m 2 in the<br />
study area (Figure 9a) but increase strongly near the coast,<br />
13 of 17<br />
C05014<br />
where turbulent fluxes reach more than 50 W m 2 locally.<br />
Mean horizontal surface layer currents, oriented principally<br />
northwestward (Figure 2b), transport cold water from higher<br />
latitudes into the study area. The resulting advective heat<br />
flux (Figure 9b) is mostly negative ( 10 to 50 W m 2 )<br />
except near the coast, where it can reach positive values of<br />
20–40 W m 2 . The coastal positive heat flux around 20°S<br />
<strong>and</strong> 75°W (Figure 9b) is due to advection of the patch of<br />
warmer water centered at 19°S <strong>and</strong> 73°W (Figure 8),<br />
whereas the positive advective heat flux along the coast at<br />
the study area’s northern limit (Figure 9b) is linked to weak<br />
local eastward surface current (Figure 2b). On average, over<br />
the whole study area, the horizontal mesoscale turbulent<br />
flow provides heat to the surface layer at a rate of 4.4 W m 2 ,<br />
whereas the horizontal advection produces a loss of heat on<br />
the order of 11.5 W m 2 . Horizontal salt turbulent flux<br />
(Figure 9c) varies by around ±100 g m 2 d 1 in the region.<br />
South of 18°S, strong positive diffusive fluxes of 100–<br />
150 g m 2 d 1 are also observed along the coast. The
C05014 CHAIGNEAU AND PIZARRO: CIRCULATION OF THE EASTERN SOUTH PACIFIC<br />
Figure 9. Horizontal (a, b) heat <strong>and</strong> (c, d) salt fluxes in the 50 m surface layer, associated with the (left)<br />
diffusive turbulent flow <strong>and</strong> with the (right) large-scale surface advection. Numbers indicated in black are<br />
the averages of the corresponding fluxes in the whole study region. The black dashed lines are situated<br />
3° offshore.<br />
horizontal advective salt flux is highly negative (< 50 g<br />
m 2 d 1 ) everywhere except locally, where patches of<br />
positive values are encountered. On average, the horizontal<br />
turbulent flow provides salt to the surface layer at a rate of<br />
12.3 g m 2 d 1 , whereas the horizontal advective flux<br />
freshens it at a rate of 56 g m 2 d 1 . The strong coastal<br />
horizontal heat <strong>and</strong> salt fluxes are due to important meridional<br />
temperature <strong>and</strong> salinity fronts (Figure 8) generated by<br />
the coastal upwelling of colder, fresher subsurface water.<br />
[40] In order to better quantify the respective roles that<br />
advection <strong>and</strong> diffusion play in horizontal temperature <strong>and</strong><br />
salinity mixed layer changes, Figure 10 shows the zonally<br />
averaged meridional variations of heat <strong>and</strong> salt fluxes<br />
between the coast <strong>and</strong> 3° offshore. This cross-shore (perpendicular<br />
to the coast) turbulent heat flux is positive all<br />
along the coast with a mean value of around 25 W m 2 .In<br />
contrast, south of 12°S, the horizontal advective heat flux<br />
associated with the mean currents is negative <strong>and</strong> cools the<br />
surface layer at a rate of 15 W m 2 . Thus along the coast,<br />
the surface mesoscale turbulent flow totally counterbalances<br />
the cooling of the ocean surface by the mean horizontal<br />
large-scale circulation. Between 17°S <strong>and</strong> 27°S, diffusive<br />
heat flux increases to 50 W m 2 <strong>and</strong> is the dominant<br />
horizontal oceanic process providing heat to the surface<br />
layer; the horizontal advective heat flux plays a minor role<br />
in this region. In terms of salt flux, advection <strong>and</strong> diffusion<br />
have an inverse relationship except north of 17°S. On<br />
average, the coastal turbulent flow increases the salinity of<br />
the surface layer at a rate of around 50 g m 2 d 1 , whereas<br />
14 of 17<br />
C05014<br />
the advection of fresher water produces a negative salt flux<br />
on the order of 30 g m 2 d 1 . Again, between 17°S <strong>and</strong><br />
27°S, the salt flux due to mesoscale turbulence increased to<br />
100–120 g m 2 d 1 .<br />
[41] This section has principally shown that coastal lateral<br />
eddy fluxes in the mixed layer are around two times larger,<br />
in absolute value, than the horizontal transport associated<br />
with large-scale advection. However, the budget is not<br />
closed <strong>and</strong> other contributions, such as vertical advection<br />
<strong>and</strong> diffusion, entrainment, <strong>and</strong> outgoing solar fluxes at the<br />
base of mixed layer, may also play a significant role in the<br />
property evolutions. Furthermore, the results presented here<br />
are a crude estimate of the impact of lateral processes on the<br />
mixed layer temperature <strong>and</strong> salt changes. Some errors are<br />
certainly made by considering, for example, a homogeneous<br />
mixed layer of 50 m to be representative of the whole study<br />
area, or homogeneous diffusivities. Owing to the little<br />
hydrographic data available for the region, WOA climatology<br />
may have also introduced several biases into our<br />
calculations. Thus more estimates are needed, based for<br />
example on numerical simulations, to more precisely quantify<br />
the lateral fluxes due to both the large-scale advection<br />
<strong>and</strong> the turbulent flow in the study region.<br />
6. Summary <strong>and</strong> Conclusion<br />
[42] The goal of this study was to describe the mean<br />
surface circulation <strong>and</strong> the turbulent characteristics of<br />
the flow in the eastern South Pacific. On the basis of a
C05014 CHAIGNEAU AND PIZARRO: CIRCULATION OF THE EASTERN SOUTH PACIFIC<br />
Figure 10. Mean horizontal (a) heat <strong>and</strong> (b) salt fluxes averaged between the coast <strong>and</strong> 3° offshore (see<br />
Figure 9) as a function of latitude.<br />
high coverage data from satellite-tracked drifter deployed<br />
throughout the 1979–2003 period, we have for the first time<br />
described quantitatively the large-scale current features in<br />
this region using Eulerian averages in geographical bins.<br />
Three main currents were studied: (1) the South Equatorial<br />
Current, flowing westward north of 26°S with surface<br />
velocities of 7–8 cm s 1 year-round; (2) the South Pacific<br />
Current, a slower eastward current of 2cms 1 south of<br />
25°–30°S, which experiences strong seasonal variability<br />
related to the meridional movements of the subtropical<br />
anticyclone; <strong>and</strong> (3) the Chile-Peru Current, a stronger<br />
northeastward flow of 6 cm s 1 encountered east of<br />
82°W <strong>and</strong> south of 24°S, responding to local wind forcing.<br />
The Reynolds stresses (or the variance ellipses) related to<br />
these flows have principally revealed the anisotropic character<br />
of regional surface circulation. The eddy kinetic<br />
energies calculated from the drifter data <strong>and</strong> from the<br />
geostrophic velocities derived from the TP/ERS altimeters<br />
show similar patterns, with high energy levels along the<br />
continent <strong>and</strong> lower values in the interior ocean. On the<br />
other h<strong>and</strong>, the geostrophic EKE is around two times<br />
smaller than the values determined from the drifting-buoys.<br />
15 of 17<br />
C05014<br />
[43] Lagrangian statistics were performed from the classical<br />
point of view of Taylor’s [1921] theory, to evaluate in both<br />
the zonal <strong>and</strong> meridional directions, the integral time <strong>and</strong><br />
space scales, the dispersion <strong>and</strong> the diffusivity. The turbulent<br />
flow shows time <strong>and</strong> length scales of O(6 days) <strong>and</strong> O(50 km)<br />
with higher values along the zonal direction revealing the<br />
anisotropy of the region. The estimate of diffusivity through<br />
the derivative of the dispersion or via the integral of the<br />
autocovariance function gives essentially the same results,<br />
with higher values in the direction of the mean flow. Owing<br />
to the important number of independent observations, we<br />
expect that our diffusivity estimations are robust.<br />
[44] Finally, we produced direct estimates of the horizontal<br />
heat <strong>and</strong> salt fluxes in the mixed layer due to both the<br />
mean horizontal advection <strong>and</strong> the lateral turbulent diffusion.<br />
On average, horizontal eddy fluxes in the study area<br />
provide heat ( 5Wm 2 ) <strong>and</strong> salt ( 12 g m 2 d 1 )tothe<br />
study region surface layer. These fluxes counterbalance the<br />
effect of the horizontal mean current, which advects colder<br />
<strong>and</strong> fresher water into the region. The magnitude of turbulent<br />
heat <strong>and</strong> salt fluxes in the study area are around 2 <strong>and</strong> 4<br />
times smaller than advective fluxes. In contrast, along the
C05014 CHAIGNEAU AND PIZARRO: CIRCULATION OF THE EASTERN SOUTH PACIFIC<br />
coast, the mesoscale instabilities are a crucial mechanism of<br />
transport for warmer <strong>and</strong> saltier water into the upwelling<br />
region. In this zone, the horizontal turbulent heat <strong>and</strong> salt<br />
fluxes ( 25 W m 2 <strong>and</strong> 50 g m 2 d 1 ) are two times<br />
larger than the negative mean current advective fluxes.<br />
Thus in the Peru-Chile Current System, the horizontal<br />
fluxes associated with the mesoscale eddies can be significant<br />
in the long-term heat <strong>and</strong> salt budgets of the upper<br />
ocean. A comparison with net downward surface heat flux<br />
remains inconclusive, since the NCEP fluxes average<br />
around 25 W m 2 annually, whereas the Southampton<br />
Oceanography Center (SOC) surface flux climatology<br />
indicates positive fluxes of around 25 W m 2 (not shown).<br />
Finally, other terms not considered in this study (e.g., vertical<br />
advection <strong>and</strong> diffusion, entrainment at the base of the mixed<br />
layer) could also play a significant role on the tracer budgets.<br />
[45] This study has given insight into the mean surface<br />
circulation <strong>and</strong> mesoscale flow characteristics of the eastern<br />
South Pacific region. The results provide a useful measure<br />
for validating numerical models. In this poorly sampled<br />
region, more satellite buoy-tracked drifters <strong>and</strong> in situ<br />
measurements are also required to better underst<strong>and</strong> the<br />
role of surface circulation on the heat <strong>and</strong> salt budget.<br />
[46] Acknowledgments. Drifter data were provided by the National<br />
Oceanic <strong>and</strong> Atmospheric Administration (NOAA). The authors thank<br />
O. Leth, two anonymous reviewers, <strong>and</strong> editor James Richman for their<br />
helpful comments. A.C. was supported by ECOS-SUD <strong>and</strong> Fundación Andes<br />
grant D-13615. This work was also supported by the Chilean National<br />
Research Council (FONDAP-COPAS).<br />
References<br />
Bauer, S., M. S. Swenson, A. Griffa, A. J. Mariano, <strong>and</strong> K. Owens (1998),<br />
Eddy-mean flow decomposition <strong>and</strong> eddy-diffusivity estimates in the<br />
tropical Pacific Ocean: 1. Methodology, J. Geophys. Res., 103,<br />
30,855–30,871.<br />
Bauer, S., M. S. Swenson, <strong>and</strong> A. Griffa (2002), Eddy-mean flow decomposition<br />
<strong>and</strong> eddy-diffusivity estimates in the tropical Pacific Ocean: 2.<br />
Results, J. Geophys. Res., 107(C10), 3154, doi:10.1029/2000JC000613.<br />
Blanco, J. L., A. C. Thomas, M.-E. Carr, <strong>and</strong> P. T. Strub (2001), Seasonal<br />
climatology of hydrographic conditions in the upwelling region off northern<br />
Chile, J. Geophys. Res., 106, 11,451–11,467.<br />
Brink, K. H., R. C. Beardsley, P. P. Niiler, M. Abbott, A. Huyer, S. Ramp,<br />
T. Stanton, <strong>and</strong> D. Stuart (1991), Statistical properties of near-surface<br />
flow in the California coastal transition zone, J. Geophys. Res., 96,<br />
14,693–14,706.<br />
Colin de Verdiere, A. (1983), Lagrangian eddy statistics from surface drifters<br />
in the eastern North Atlantic, J. Mar. Res., 41, 375–398.<br />
Cushman-Roisin, B. (1994), Introduction to Geophysical Dynamics, 320 pp.,<br />
Prentice-Hall, Upper Saddle River, N. J.<br />
Davis, R. E. (1987), Modeling eddy transport of passive tracers, J. Mar.<br />
Res., 45, 635–666.<br />
Davis, R. E. (1991), Observing the general circulation with floats, Deep Sea<br />
Res., 38, S531–S571.<br />
Ducet, N., P. Y. Le Traon, <strong>and</strong> G. Reverdin (2000), Global high-resolution<br />
mapping of ocean circulation from TOPEX/Poseidon <strong>and</strong> ERS-1 <strong>and</strong> -2,<br />
J. Geophys. Res., 105, 19,477–19,498.<br />
Flierl, G. R., <strong>and</strong> J. C. McWilliams (1977), On the sampling requirements<br />
for measuring moments of eddy variability, J. Mar. Res., 35, 797–820.<br />
Freel<strong>and</strong>, H. J., P. B. Rhines, <strong>and</strong> H. T. Rossby (1975), Statistical observations<br />
of the trajectories of neutrally buoyant floats in the North Atlantic,<br />
J. Mar. Res., 33, 383–404.<br />
Hansen, D. V., <strong>and</strong> P.-M. Poulain (1996), Quality control <strong>and</strong> interpolations<br />
of WOCE-TOGA drifter data, J. Atmos. Oceanic Technol., 13, 900–909.<br />
Hormazabal, S., G. Shaffer, <strong>and</strong> O. Leth (2004), Coastal transition zone off<br />
Chile, J. Geophys. Res., 109, C01021, doi:10.1029/2003JC001956.<br />
Knudsen, J. G., <strong>and</strong> D. L. Katz (1958), Fluid Dynamics <strong>and</strong> Heat Transfer,<br />
576 pp., McGraw-Hill, New York.<br />
Krauss, W., <strong>and</strong> C. W. Böning (1987), Lagrangian properties of eddy fields<br />
in the northern North Atlantic as deduced from satellite-tracked buoys,<br />
J. Mar. Res., 45, 259–291.<br />
16 of 17<br />
C05014<br />
Kundu, P., <strong>and</strong> I. Cohen (2000), Fluid Mechanics, 2nd ed., 730 pp., Elsevier,<br />
New York.<br />
Leth, O., <strong>and</strong> G. Shaffer (2001), A numerical study of the seasonal variability<br />
in the circulation off central Chile, J. Geophys. Res., 106, 22,229–22,248.<br />
Leth, O., G. Shaffer, <strong>and</strong> O. Ulloa (2004), Hydrography of the eastern<br />
South Pacific Ocean: Results from the Sonne 102 Cruise, May – June<br />
1995, Deep Sea Res., Part II, 51, 2349–2369.<br />
Le Traon, P.-Y., <strong>and</strong> R. Morrow (2001), Ocean currents <strong>and</strong> eddies, in<br />
Satellite Altimetry <strong>and</strong> Earth Sciences: A H<strong>and</strong>book of Techniques <strong>and</strong><br />
Applications, edited by L.-L. Fu <strong>and</strong> A. Cazenave, 457 pp., Elsevier, New<br />
York.<br />
Le Traon, P.-Y., <strong>and</strong> F. Ogor (1998), ERS-1/2 orbit improvement using<br />
TOPEX/Poseidon: The 2 cm challenge, J. Geophys. Res., 103, 8045–<br />
8057.<br />
Le Traon, P.-Y., P. Gaspar, F. Ogor, <strong>and</strong> J. Dor<strong>and</strong>eu (1995), Satellites<br />
work in t<strong>and</strong>em to improve accuracy of data, Eos Trans. AGU, 76,<br />
385–389.<br />
Lumpkin, R., <strong>and</strong> P. Flament (2001), Lagrangian statistics in the central<br />
North Pacific, J. Mar. Syst., 29, 141–155.<br />
Martins, C. S., M. Hamann, <strong>and</strong> A. F. G. Fiúza (2002), Surface circulation<br />
in the eastern North Atlantic, from drifters <strong>and</strong> altimetry, J. Geophys.<br />
Res., 107(C12), 3217, doi:10.1029/2000JC000345.<br />
Mofjeld, H. O., <strong>and</strong> J. W. Lavelle (1984), Setting the length scale in a<br />
second-order closure model of the unstratified bottom boundary layer,<br />
J. Phys. Oceanogr., 14, 833–839.<br />
Morrow, R., J. Church, R. Coleman, D. Chelton, <strong>and</strong> N. White (1992),<br />
Eddy momentum flux <strong>and</strong> its contribution to the Southern Ocean<br />
momentum balance, Nature, 357, 482–484.<br />
Morrow, R., R. Coleman, J. Church, <strong>and</strong> D. Chelton (1994), Surface eddy<br />
momentum flux <strong>and</strong> velocity variances in the Southern Ocean from Geosat<br />
altimetry, J. Phys. Oceanogr., 24, 2050–2071.<br />
Niiler, P. P., <strong>and</strong> J. D. Paduan (1995), Wind-driven motions in the northeast<br />
Pacific as measured by Lagrangian drifters, J. Phys. Oceanogr., 25,<br />
2819–2830.<br />
Niiler, P. P., A. S. Sybr<strong>and</strong>y, K. Bi, P.-M. Poulain, <strong>and</strong> D. Bitterman (1995),<br />
Measurements of the water-following capability of holey-sock <strong>and</strong><br />
TRISTAR drifters, Deep Sea Res., Part I, 42, 1951–1964.<br />
Oh, I. S., V. Zhurbas, <strong>and</strong> W. Park (2000), Estimating horizontal diffusivity<br />
in the East Sea (Sea of Japan) <strong>and</strong> the northwest Pacific from satellitetracked<br />
drifter data, J. Geophys. Res., 105, 6483–6492.<br />
<strong>Pizarro</strong>, O. (1999), Low frequency fluctuations in the eastern boundary<br />
current off South America: Remote <strong>and</strong> local forcing, Ph.D. thesis,<br />
Göteborg Univ., Sweden.<br />
<strong>Pizarro</strong>, O., G. Shaffer, B. Dewitte, <strong>and</strong> M. Ramos (2002), Dynamics of<br />
seasonal <strong>and</strong> interanual variability of the Peru-Chile Undercurrent, Geophys.<br />
Res. Lett., 29(12), 1581, doi:10.1029/2002GL014790.<br />
Poulain, P.-M., <strong>and</strong> P. P. Niiler (1989), Statistical analysis of the surface<br />
circulation in the California Current system using satellite-tracked drifters,<br />
J. Phys. Oceanogr., 19, 1588–1603.<br />
Preisendorfer, R. W. (1988), Principal Component Analysis in Meteorology<br />
<strong>and</strong> Oceanography, 245 pp., Elsevier, New York.<br />
Richman, J. G., C. Wunsch, <strong>and</strong> N. G. Hogg (1977), Space <strong>and</strong> time scales<br />
<strong>and</strong> mesoscale motions in the sea, Rev. Geophys., 15, 385–420.<br />
Shaffer, G., S. Salinas, O. <strong>Pizarro</strong>, A. Vega, <strong>and</strong> S. Hormazabal (1995),<br />
Currents in the deep ocean off Chile (30°S), Deep Sea Res., 42, 425–<br />
436.<br />
Shaffer, G., O. <strong>Pizarro</strong>, L. Djurfeldt, S. Salinas, <strong>and</strong> J. Rutlant (1997),<br />
Circulation <strong>and</strong> low frequency variability near the Chile coast: Remotelyforced<br />
fluctuations during the 1991–1992 El Niño,J. Phys. Oceanogr., 27,<br />
217–235.<br />
Shaffer, G., S. Hormazabal, O. <strong>Pizarro</strong>, <strong>and</strong> S. Salinas (1999), Seasonal<br />
<strong>and</strong> interannual variability of currents <strong>and</strong> temperature off central<br />
Chile, J. Geophys. Res., 104, 29,931–29,961.<br />
Shaffer, G., S. Hormazabal, O. <strong>Pizarro</strong>, <strong>and</strong> M. Ramos (2004), Circulation<br />
<strong>and</strong> variability in the Chile basin, Deep Sea Res., Part I, 51, 1367–<br />
1386.<br />
Silva, N., <strong>and</strong> T. R. Fonseca (1983), Geostrophic component of the<br />
oceanic flow off northern Chile, in Resursos Marinos del Pacífico,<br />
edited by P. Arana, pp. 59 – 70, Escuela de Cienc. del Mar, Univ.<br />
Católica de Valparaíso, Chile.<br />
Stammer, D. (1997), Global characteristics of ocean variability estimated<br />
from regional TOPEX/POSEIDON altimeter measurements, J. Phys.<br />
Oceanogr., 27, 1743–1769.<br />
Stammer, D. (1998), On eddy characteristics, eddy transports, <strong>and</strong> mean<br />
flow properties, J. Phys. Oceanogr., 28, 727–739.<br />
Stigebr<strong>and</strong>t, A. (1985), A model of the seasonal pycnocline in rotating<br />
systems with application to the Baltic Proper, J. Phys. Oceanogr., 15,<br />
1392–1404.<br />
Stramma, L., R. G. Peterson, <strong>and</strong> M. Tomczak (1995), The South Pacific<br />
Current, J. Phys. Oceanogr., 25, 77–91.
C05014 CHAIGNEAU AND PIZARRO: CIRCULATION OF THE EASTERN SOUTH PACIFIC<br />
Strub, P. T., J. M. Mesías, <strong>and</strong> C. James (1995), Altimeter observations of<br />
the Peru-Chile Countercurrent, Geophys. Res. Lett., 22, 211–214.<br />
Strub, P. T., J. M. Mesias, V. Montecino, J. Rutllant, <strong>and</strong> S. Salinas<br />
(1998), Coastal ocean circulation off western South America, in The<br />
Sea, vol. 11, edited by A. R. Robinson <strong>and</strong> K. H. Brink, pp. 273–<br />
313, John Wiley, Hoboken, N. J.<br />
Swenson, M. S., <strong>and</strong> P. P. Niiler (1996), Statistical analysis of the surface<br />
circulation of the California Current, J. Geophys. Res., 101, 22,631 –<br />
22,645.<br />
Taylor, G. I. (1921), Diffusion by continuous movements, Proc. London<br />
Math. Soc., 20, 196–211.<br />
Tomczak, M., <strong>and</strong> J. S. Godfrey (1994), Regional Oceanography: An Introduction,<br />
442 pp., Elsevier, New York.<br />
Tsuchiya, M., <strong>and</strong> L. D. Talley (1998), A Pacific hydrographic section at<br />
88°W: Water-property distribution, J. Geophys. Res., 103, 12,899–<br />
12,918.<br />
Vega, A. (2003), Ondes de Rossby, niveau de la mer et couleur de l’eau<br />
dans le Pacifique Sud-Est, Ph.D. thesis, 160 pp., Univ. é Paul Sabatier de<br />
Toulouse, France.<br />
Wilkin, J. L., <strong>and</strong> R. A. Morrow (1994), Eddy kinetic energy <strong>and</strong> momentum<br />
flux in the Southern Ocean: Comparison of a global eddy-resolving<br />
model with altimeter, drifter, <strong>and</strong> current-meter data, J. Geophys. Res.,<br />
99, 7903–7916.<br />
Wooster, W. S. (1970), Eastern boundary currents in the South Pacific, in<br />
Scientific Exploration of the South Pacific, edited by W. S. Wooster,<br />
pp. 60–68, Natl. Acad. of Sci., Washington, D. C.<br />
17 of 17<br />
C05014<br />
Wyrtki, K. (1964), Total integrated mass transports <strong>and</strong> actual circulation in<br />
the eastern South Pacific Ocean, in Studies in Oceanography, pp. 47–52,<br />
Japan.<br />
Zamudio, L., A. P. Leonardi, S. D. Meyers, <strong>and</strong> J. J. O’Brien (2001), ENSO<br />
<strong>and</strong> eddies on the southwest coast of Mexico, Geophys. Res. Lett., 28,<br />
13–16.<br />
Zhang, H.-M., M. D. Prater, <strong>and</strong> T. Rossby (2001), Isopycnal Lagrangian<br />
statistics from the North Atlantic Current RAFOS float observations,<br />
J. Geophys. Res., 106, 13,817–13,836.<br />
Zhurbas, V., <strong>and</strong> I. S. Oh (2003), Lateral diffusivity <strong>and</strong> Lagrangian scales<br />
in the Pacific Ocean as derived from drifter data, J. Geophys. Res.,<br />
108(C5), 3141, doi:10.1029/2002JC001596.<br />
Zhurbas, V., <strong>and</strong> I. S. Oh (2004), Drifter-derived maps of lateral diffusivity<br />
in the Pacific <strong>and</strong> Atlantic Oceans in relation to surface circulation patterns,<br />
J. Geophys. Res., 109, C05015, doi:10.1029/2003JC002241.<br />
A. <strong>Chaigneau</strong>, Programa Regional de Oceanografía Física y Clima,<br />
Cabina 7, Universidad de Concepción, Concepción, Chile. (chaigneau@<br />
profc.udec.cl)<br />
O. <strong>Pizarro</strong>, Departamento de Geofísica/Centro de Investigación Oceanográfica<br />
en el Pacífico Sur-Oriental, Universidad de Concepción, Casilla<br />
160-C, Concepción, 3, Chile. (orpa@profc.udec.cl)