Physiological Basis of the Electrocardiogram
Physiological Basis of the Electrocardiogram
Physiological Basis of the Electrocardiogram

You also want an ePaper? Increase the reach of your titles
YUMPU automatically turns print PDFs into web optimized ePapers that Google loves.
1.3 Introduction to Clinical Electrocardiography: Abnormal Patterns 15<br />
1.3.2 Ectopy, Tachycardia, and Fibrillation<br />
An arrhythmia is any abnormal cardiac rhythm. One category <strong>of</strong> arrhythmias occurs<br />
when <strong>the</strong> trigger to depolarize originates outside <strong>of</strong> <strong>the</strong> SA node, in ano<strong>the</strong>r part<br />
<strong>of</strong> <strong>the</strong> myocardium (known as ectopic depolarization, leading to ectopic beats).<br />
Common causes <strong>of</strong> ectopy include a drug effect (e.g., caffeine) or a viral infection<br />
<strong>of</strong> <strong>the</strong> myocardium, or o<strong>the</strong>r inflammation or damage <strong>of</strong> part <strong>of</strong> <strong>the</strong> heart (e.g.,<br />
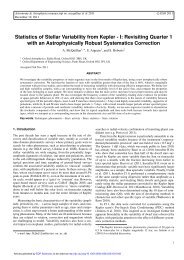
ischemia). When <strong>the</strong> ectopic beat originates in <strong>the</strong> atria, it leads to a premature<br />
atrial beat, also known as an atrial premature contraction (APC) (see Figure 1.13).<br />
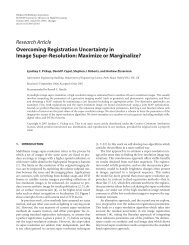
When it originates in <strong>the</strong> ventricles, it leads to a premature ventricular beat or<br />
ventricular premature contraction (VPC); see Figure 1.14.<br />
Note in Figure 1.14 that <strong>the</strong> ectopic ventricular beat looks very different from<br />
<strong>the</strong> o<strong>the</strong>r sinus beats. The spread <strong>of</strong> <strong>the</strong> wavefront for a VPC can be backwards, such<br />
as when <strong>the</strong> action potential starts at <strong>the</strong> apex <strong>of</strong> <strong>the</strong> heart ra<strong>the</strong>r than <strong>the</strong> septum.<br />
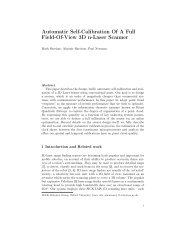
The depolarization wavefront can move in very different directions than <strong>the</strong> typical<br />
sinus-driven heart vector. Compare Figure 1.15 with <strong>the</strong> wavefront trajectory in<br />
Figure 1.13 Atrial premature contractions (indicated by arrowheads). (From: [2]. c○ 2004 MIT<br />
OCW. Reprinted with permission.)<br />
Figure 1.14 Ventricular premature contractions. (From: [2]. c○ 2004 MIT OCW. Reprinted with<br />
permission.)<br />
Figure 1.15 Wavefront trajectory in a ventricular premature contraction. (From: [2]. c○ 2004 MIT<br />
OCW. Reprinted with permission.)