

The Visual Display
The Visual Display
The Visual Display

Create successful ePaper yourself
Turn your PDF publications into a flip-book with our unique Google optimized e-Paper software.
It was not unril rhe late 17oos thar dme-series charts began to<br />
appear in scienrific wrirings. Thrs drawing ofJohann Hcinrich<br />
Lambert, one ofa iong scries, shows the periodic variation in soil<br />
tempcrature in relation ro the dcprh undcr rhe surface. <strong>The</strong> greater<br />
the deprh, the greater the rime-1ag in temperature responsivencs.<br />
Modern graphc dcsigns showing time-series periodicities diFer<br />
little from those oflambert, although the data bases are far larger.<br />
a<br />
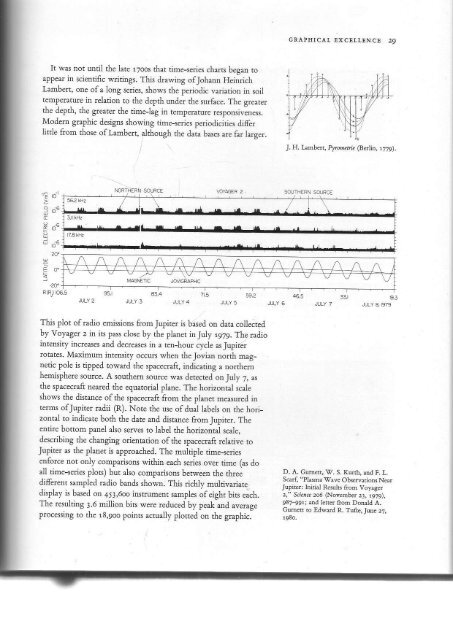
This plot of radio emissions from Jupiter is based on data collected<br />
by Voyagcr 2 in its pass ciose by the planct in July 1979. <strong>The</strong> rrdio<br />
inrensir;' increases and decrcases in a ren-hour cycle as Jupirer<br />
rolates. Maximum intensity occurs when rLeJovian north magneric<br />
polc is tipped roward fie spacecraft, indicating a norrhe<br />
hemisphere source. A sourhern source was dctected on July 7, as<br />
dre spacecraft neared the equatorial plane. <strong>The</strong> horizontal scale<br />
shows the disunce of the spacecraft from the planet measured in<br />
terms ofJupiter radii (R). Note the use ofdurl labels on the horizontal<br />
to indicatc both the d:te and disr:nce fromJupirer. <strong>The</strong><br />
entire bottom panel also serves to label the horizontal scale,<br />
describing the changing orientation ofthe spacecrafr relative to<br />
Jupiter as the planet is approached. <strong>The</strong> multiple time--serics<br />
erforce not only comparisons witLin each series over rime (as do<br />
all time-series plots) bul also comparisons between the tluee<br />
diferent sampled radio bands shown. Thn ricHy multivariare<br />
display is based on 453,6oo instrumenr samples ofcight bits cach.<br />
<strong>The</strong> resulting 3.6 million bits were reduced by pcak and average<br />
p(ocessing ro rhe 18,9oo points acually plotted on thc graphic.<br />
GRA?IIICAL IXCXTl!NCT 29<br />
J. H. I-anberr, 4'o'err -l3ertin, r7?9).<br />
D. A. clrneti, W. S. (u.th, and F. L.<br />
sc2ri "Plasnx wave obs.rvarioDs Ncar<br />
Jupite' Ihirial Rcsulrs f.om voy4er<br />
2, s.tdra:06 (Novchb{ 2t, 19?e),<br />
987 991; md Ietter from Dorold A.<br />
Guhett to Edward R. Tufre, Jue 27,