

The Visual Display
The Visual Display
The Visual Display

Create successful ePaper yourself
Turn your PDF publications into a flip-book with our unique Google optimized e-Paper software.
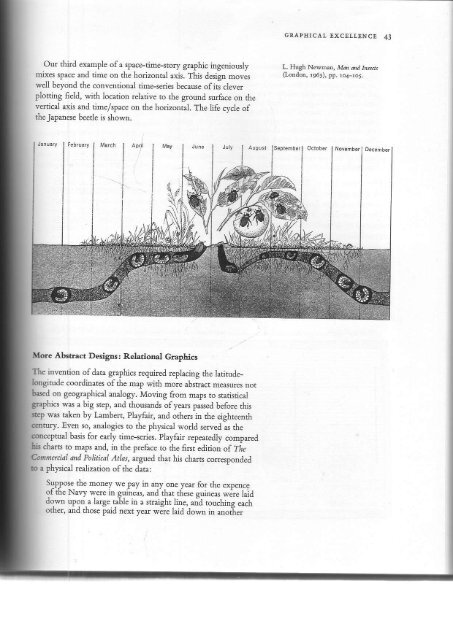
Our third example of a space-time-srory grephic ingeniourly<br />
mixer space and time on the horizontal axis. This desien moves<br />
well beyond che conrcndonal rime-'eries becru.e ofiL" clever<br />
plotting field, with location relative to the eround surface on the<br />
verric:l axis and rime/spacc on rhe honzonial. Tle life cyde of<br />
the lapanese beetle is shown.<br />
More Abstract Designs: Relational GrapLics<br />
Ile invention ofdata graphics required replacing the laritudebngitude<br />
coordinates ofthe map wirh more abstrac measures rror<br />
f,ased on geographicai analogy. Moving from maps to statisticil<br />
pphics was a big step, and thousands ofyears pased bdore this<br />
rtep was taken by Lambert, Playfair, and others in the eishteenth<br />
. Even so, analogics to the physical world served as the<br />
ceptual basis for early time-series. Piayfair repeatedly compared<br />
charts to maps and, in the preface to the finr ed.Lt:Lon of <strong>The</strong><br />
nnercial a d Political Atlas, argued that his charrs corresponded<br />
a physical realization ofthe data:<br />
Suppose $e money we pay ir any<br />
_one rcar lo, 'he exp€nce<br />
of rhe Na!ry u_erc in gunca.. and rhat thesc guirea. wire lajd<br />
down upon,a lrrgc rable in a strarghr.line._and rouchirg each<br />
omer. and rnosf paid nexr )ear were latd down in anoiher<br />
GRAPHTCAI EXCETL!NCr 43<br />
L. Hugh Neman, Md, a/d hs.h<br />
(Lordon, 1e6J), p!. ro4-1oJ.