Implementing food-based dietary guidelines for - United Nations ...
Implementing food-based dietary guidelines for - United Nations ...
Implementing food-based dietary guidelines for - United Nations ...

You also want an ePaper? Increase the reach of your titles
YUMPU automatically turns print PDFs into web optimized ePapers that Google loves.
Contents<br />
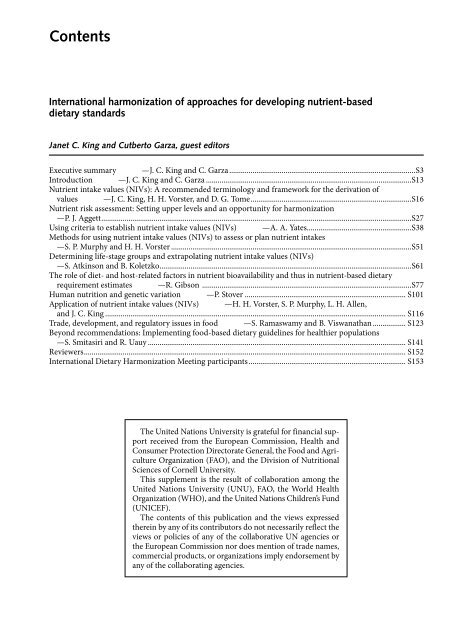
International harmonization of approaches <strong>for</strong> developing nutrient-<strong>based</strong><br />
<strong>dietary</strong> standards<br />
Janet C. King and Cutberto Garza, guest editors<br />
Executive summary —J. C. King and C. Garza ................................................................................................S3<br />
Introduction —J. C. King and C. Garza ..........................................................................................................S13<br />
Nutrient intake values (NIVs): A recommended terminology and framework <strong>for</strong> the derivation of<br />
values —J. C. King, H. H. Vorster, and D. G. Tome ...................................................................................S16<br />
Nutrient risk assessment: Setting upper levels and an opportunity <strong>for</strong> harmonization<br />
—P. J. Aggett ................................................................................................................................................................S27<br />
Using criteria to establish nutrient intake values (NIVs) —A. A. Yates ......................................................S38<br />
Methods <strong>for</strong> using nutrient intake values (NIVs) to assess or plan nutrient intakes<br />
—S. P. Murphy and H. H. Vorster ............................................................................................................................S51<br />
Determining life-stage groups and extrapolating nutrient intake values (NIVs)<br />
—S. Atkinson and B. Koletzko ..................................................................................................................................S61<br />
The role of diet- and host-related factors in nutrient bioavailability and thus in nutrient-<strong>based</strong> <strong>dietary</strong><br />
requirement estimates —R. Gibson ............................................................................................................S77<br />
Human nutrition and genetic variation —P. Stover ................................................................................... S101<br />
Application of nutrient intake values (NIVs) —H. H. Vorster, S. P. Murphy, L. H. Allen,<br />
and J. C. King ........................................................................................................................................................... S116<br />
Trade, development, and regulatory issues in <strong>food</strong> —S. Ramaswamy and B. Viswanathan ................. S123<br />
Beyond recommendations: <strong>Implementing</strong> <strong>food</strong>-<strong>based</strong> <strong>dietary</strong> <strong>guidelines</strong> <strong>for</strong> healthier populations<br />
—S. Smitasiri and R. Uauy ..................................................................................................................................... S141<br />
Reviewers ...................................................................................................................................................................... S152<br />
International Dietary Harmonization Meeting participants ................................................................................. S153<br />
The <strong>United</strong> <strong>Nations</strong> University is grateful <strong>for</strong> financial support<br />
received from the European Commission, Health and<br />
Consumer Protection Directorate General, the Food and Agriculture<br />
Organization (FAO), and the Division of Nutritional<br />
Sciences of Cornell University.<br />
This supplement is the result of collaboration among the<br />
<strong>United</strong> <strong>Nations</strong> University (UNU), FAO, the World Health<br />
Organization (WHO), and the <strong>United</strong> <strong>Nations</strong> Children’s Fund<br />
(UNICEF).<br />
The contents of this publication and the views expressed<br />
therein by any of its contributors do not necessarily reflect the<br />
views or policies of any of the collaborative UN agencies or<br />
the European Commission nor does mention of trade names,<br />
commercial products, or organizations imply endorsement by<br />
any of the collaborating agencies.
Food and Nutrition Bulletin<br />
Editor: Dr. Irwin H. Rosenberg, Friedman School of Nutrition Science<br />
and Policy, Tufts University, Boston, Mass., USA<br />
Senior Associate Editor: Dr. Nevin S. Scrimshaw<br />
Associate Editor—Food Policy and Agriculture:<br />
Dr. Suresh Babu, International Food Policy Research Institute (IFPRI),<br />
Washington, DC, USA<br />
Associate Editor—Food Science and Technology: Dr. V. Prakash, Central Food<br />
Technological Research Institute (CFTRI), Mysore, India<br />
Statistical Advisor—Dr. William M. Rand, Tufts University School of<br />
Medicine, Boston, Mass., USA<br />
Managing Editor: Ms. Susan Karcz<br />
Manuscripts Editor: Mr. Jonathan Harrington<br />
Copyeditor: Ms. Ellen Duff<br />
Editorial Assistant: Ms. Caroline Wyrosdick<br />
Editorial Board:<br />
Dr. Ricardo Bressani, Institute de Investigaciones, Universidad del Valle<br />
de Guatemala, Guatemala City, Guatemala<br />
Dr. Hernán Delgado, Director, Institute of Nutrition of Central America<br />
and Panama (INCAP), Guatemala City, Guatemala<br />
Dr. Cutberto Garza, Academic Vice President and Dean of Faculties, Boston<br />
College, Chestnut Hill, Mass., USA<br />
Dr. Joseph Hautvast, Secretary General, International Union of Nutritional<br />
Sciences (IUNS), Department of Human Nutrition, Agricultural University,<br />
Wageningen, Netherlands<br />
Dr. Peter Pellett, Professor, Department of Food Science and Nutrition,<br />
University of Massachusetts, Amherst, Mass., USA<br />
Dr. Zewdie Wolde-Gabreil, Director, Ethiopian Nutrition Institute, Addis<br />
Ababa, Ethiopia<br />
Dr. Aree Valyasevi, Professor and Institute Consultant, Mahidol University,<br />
Bangkok, Thailand<br />
Food and Nutrition Bulletin, vol. 28, no. 1 (supplement)<br />
© The <strong>United</strong> <strong>Nations</strong> University, 2007<br />
<strong>United</strong> <strong>Nations</strong> University Press<br />
Published by the International Nutrition Foundation <strong>for</strong> The <strong>United</strong> <strong>Nations</strong> University<br />
53-70 Jingumae 5-chome, Shibuya-ku, Tokyo 150-8925, Japan<br />
Tel.: (03) 3499-2811 Fax: (03) 3406-7345<br />
E-mail: mbox@hq.unu.edu<br />
ISSN 0379-5721<br />
Design and production by Digital Design Group, Newton, MA USA<br />
Printed on acid-free paper by Webcom, Toronto, ON Canada
Executive summary<br />
Harmonization of nutrient intake values<br />
Janet C. King and Cutberto Garza<br />
Key words: Nutrient recommendations, nutrient<br />
requirements<br />
The <strong>United</strong> <strong>Nations</strong> University’s Food and Nutrition<br />
Programme, in collaboration with the Food and<br />
Agriculture Organization (FAO), the World Health<br />
Organization (WHO), and UNICEF, convened a group<br />
of international experts to review the harmonization<br />
of approaches <strong>for</strong> developing nutrient-<strong>based</strong> <strong>dietary</strong><br />
standards. The group met at the Innocenti Center in<br />
Florence, Italy, and was charged to:<br />
» Identify the concepts that must be harmonized to<br />
provide a foundation <strong>for</strong> generating nutrient-<strong>based</strong><br />
<strong>dietary</strong> standards and to define the components and<br />
terms supporting these concepts;<br />
» Harmonize <strong>guidelines</strong> <strong>for</strong> the elaboration of methods<br />
and approaches <strong>for</strong> developing nutrient-<strong>based</strong><br />
<strong>dietary</strong> standards; and<br />
» Consider specific aspects of the process <strong>for</strong> developing<br />
nutrient-<strong>based</strong> <strong>dietary</strong> standards that require<br />
adjustments <strong>for</strong> unique <strong>food</strong> patterns and lifestyles<br />
of specific populations throughout the world.<br />
» The group reviewed the need <strong>for</strong> harmonization,<br />
agreed on the definitions of key terms, developed a<br />
framework <strong>for</strong> estimating average nutrient requirements<br />
(ANRs) and upper nutrient levels (UNLs),<br />
identified criteria <strong>for</strong> establishing ANRs and UNLs,<br />
evaluated key issues related to the derivation of such<br />
values (e.g., nutrient bioavailability, extrapolation of<br />
values among diverse life-stage groups, application<br />
of standard height and weights, categorization of<br />
life-stage groups, and effects of genetic variation),<br />
and considered their uses and applications, especially<br />
Janet C. King is affiliated with Children’s Hospital Oakland<br />
Research Institute, Oakland, Cali<strong>for</strong>nia, USA; Cutberto<br />
Garza is affiliated with Boston College, Chestnut Hill, Massachusetts,<br />
USA.<br />
Please direct queries to the corresponding author: Janet C.<br />
King, Children’s Hospital Oakland Research Institute, 5700<br />
Martin Luther King Jr. Way, Oakland, CA 94609, USA; e-mail:<br />
jking@chori.org.<br />
their roles in the development of <strong>dietary</strong> <strong>guidelines</strong>.<br />
The group’s deliberations were <strong>based</strong> on papers<br />
developed <strong>for</strong> this review and published by the Food<br />
and Nutrition Bulletin [1–10]. The outcome of these<br />
deliberations is summarized below.<br />
Why harmonize?<br />
The group identified four basic reasons why it is<br />
important to harmonize approaches and methods <strong>for</strong><br />
the development of nutrient intake values (NIVs),<br />
the term adopted to encompass all nutrient-<strong>based</strong><br />
<strong>dietary</strong> standards derived from primary data. First,<br />
harmonization of the process will improve the objectivity<br />
and transparency of values that are derived by<br />
diverse national, regional, and international groups.<br />
Second, a harmonized process will provide a common<br />
basis or background <strong>for</strong> groups of experts to consider<br />
throughout processes that lead to NIV. Third, a harmonized<br />
process will permit developing countries, which<br />
often have limited access to scientific and economic<br />
resources, to convene groups of experts to identify how<br />
to modify existing NIVs to meet their populations’<br />
specific requirements, objectives, and national policies.<br />
Finally, a harmonized process will supply a common<br />
basis <strong>for</strong> the use of NIVs across countries, regions, and<br />
the globe <strong>for</strong> establishing public and clinical health<br />
objectives and <strong>food</strong> and nutrition policies, such as<br />
<strong>for</strong>tification programs, and <strong>for</strong> addressing regulatory<br />
and trade issues.<br />
Harmonization of key terms<br />
The group agreed to use the term NIV to encompass<br />
the set of recommendations <strong>based</strong> on primary data that<br />
are analogous to those developed by various regional<br />
groups, e.g., <strong>dietary</strong> reference values (DRVs) by the<br />
<strong>United</strong> Kingdom, nutrient reference values (NRVs)<br />
by Australia and New Zealand, reference values <strong>for</strong><br />
nutrient supply by Germany/Austria/Switzerland, and<br />
Food and Nutrition Bulletin, vol. 28, no. 1 (supplement) © 2007, The <strong>United</strong> <strong>Nations</strong> University. S3
S4 J. C. King and C. Garza<br />
<strong>dietary</strong> reference intakes (DRIs) by the <strong>United</strong> States<br />
and Canada. The term was judged to be sufficiently<br />
neutral and descriptive of these values’ broad uses.<br />
The group agreed to recommend only two NIVs, the<br />
average nutrient requirement (ANR) and the upper<br />
nutrient level (UNL). It recognized that groups charged<br />
with the development of such recommendations have<br />
derived other values, but that these other values usually<br />
are derived from estimates of nutrient-specific ANRs<br />
or UNLs.<br />
The exclusion of lower recommended intakes,<br />
reference nutrient intakes, safe or adequate intakes,<br />
and population-level recommendations from tables<br />
summarizing NIVs, is put <strong>for</strong>ward <strong>for</strong> the following<br />
reasons:<br />
Lower reference nutrient intake (LRNI) or lower<br />
threshold intake (LTI). This value is derived from the<br />
ANR, i.e., it is equivalent to the ANR minus 2 SD of the<br />
requirement. Typically it is sufficient to meet the needs<br />
of only 2% of individuals, but countries may wish to<br />
use some other analogous value (e.g., values that meet<br />
the needs of 5% or 10% of a specified population) to<br />
evaluate the likelihoods of nutrient intake sufficiency<br />
and deficiency.<br />
The principal rationale <strong>for</strong> the exclusion of such<br />
values rests on their limited usefulness <strong>for</strong> assessing<br />
the prevalence of undernutrition in populations, and<br />
concern that such values set too low an expectation <strong>for</strong><br />
the adequacy of nutrient intake of individuals. Their<br />
use <strong>for</strong> planning purposes is similarly too limited.<br />
Reference nutrient intake (RNI), recommended nutrient<br />
intake (also RNI), recommended <strong>dietary</strong> allowance<br />
(RDA), and recommended <strong>dietary</strong> intake (RDI). This<br />
number also may be derived from the ANR as the mean<br />
plus 2 SD of the mean requirement. The process <strong>for</strong><br />
setting it or other values intended to guide individual<br />
intakes is described in subsequent sections of this<br />
summary. Typically, this value covers the index nutrient<br />
needs of 98% of individuals. Such values are also<br />
not recommended <strong>for</strong> inclusion in tables summarizing<br />
NIVs. The group has adopted the term “individual<br />
nutrient level” (INL x ) <strong>for</strong> these values. The x denotes<br />
the probability of nutrient adequacy <strong>for</strong> any single individual.<br />
This term is discussed below in greater detail.<br />
The group concluded that it would be preferable to<br />
use a more flexible approach that enables expert groups<br />
to develop values analogous to the present RNI (or its<br />
equivalent) at points in the distribution of requirement<br />
deemed to be appropriate in specific countries and<br />
regions. Thus, some may wish to use 75%, 80%, 90%,<br />
etc., rather than the 98% used currently that reflects a<br />
risk of inadequate intake of approximately 2% <strong>for</strong> an<br />
individual.<br />
Safe intake (same as the adequate intake (AI) or the<br />
lower end of the range of safe intakes). Because this<br />
value often is used when data are insufficient to set<br />
an ANR, the process <strong>for</strong> setting it is greatly subjec-<br />
tive. Ideally, such a term will be used only to describe<br />
nutrient targets <strong>for</strong> infants (<strong>based</strong> on the nutrient<br />
content of breastmilk) or other exceptional situations.<br />
Exclusion of these values from NIV tables is recommended<br />
because of the great subjectivity inherent to<br />
their derivation.<br />
The report also recommends that the NIVs not<br />
include population-level recommendations, such as the<br />
upper and lower limits of the population mean intake.<br />
These standards vary with the population’s intake characteristics<br />
and require several assumptions. This topic<br />
is covered in more detail in the section below on uses<br />
and applications and in Vorster et al. [1] and Murphy<br />
et al. [4] in this volume.<br />
The framework <strong>for</strong> estimating average<br />
nutrient requirements (ANRs)<br />
The basic framework <strong>for</strong> estimating ANRs is <strong>based</strong> on<br />
distributions of nutrient intakes required to achieve<br />
a specific outcome in a specified healthy population<br />
[6]. If those intakes are distributed normally, the<br />
population’s mean requirement is its ANR. When<br />
such intakes are not distributed normally, data should<br />
be trans<strong>for</strong>med, thus enabling the resulting median<br />
intake to serve as the ANR. In many cases the distribution<br />
of requirements is unknown. Because this<br />
is not uncommon, substantial research is needed to<br />
define the distributions of nutrient requirements and<br />
to identify biological and environmental factors that<br />
influence them.<br />
Groups charged with developing NIVs should<br />
determine which nutrients and <strong>food</strong> components<br />
to consider. The group agreed that NIVs should be<br />
established whenever possible <strong>for</strong> all nutrients and<br />
<strong>food</strong> components that are essential OR have public<br />
health relevance. Fiber is an example of a <strong>food</strong> component<br />
that has public health relevance but is not an<br />
essential <strong>dietary</strong> component. The group concluded<br />
that good <strong>food</strong>-composition data <strong>for</strong> a nutrient or <strong>food</strong><br />
component are necessary to ascertain public health<br />
relevance, since such data are key to estimate exposures<br />
(or intake).<br />
Acceptable macronutrient distribution ranges <strong>for</strong><br />
carbohydrate, fat, and protein have been established<br />
by some groups. These ranges are derived primarily <strong>for</strong><br />
promoting long-term health and preventing chronic<br />
(or noncommunicable) disease and will be described<br />
further in that context. Establishing an ANR <strong>for</strong> the<br />
total amount of carbohydrate and fat in the diet is not<br />
necessary. However, it is appropriate to establish ANRs<br />
<strong>for</strong> protein to achieve zero or appropriately positive<br />
nitrogen balance and <strong>for</strong> the essential fatty acids that<br />
have specific biological functions.<br />
Population intake levels were established <strong>for</strong> some<br />
of the trace elements in the 1996 FAO/WHO report
Executive summary<br />
[11]. These are levels of intake of a specific nutrient<br />
that can be used to plan diets or assess intakes of<br />
homogeneous populations, e.g., all girls of a similar<br />
age in a boarding school. Population intake levels <strong>for</strong><br />
planning and assessment purposes should be derived<br />
from the ANR, assessments of the variation in nutrient<br />
requirements, and the targeted population’s variation<br />
in nutrient intakes. Thus, such calculations reflect an<br />
application of the ANR. Also, assessing population<br />
intakes requires several assumptions that are not met<br />
easily. This application is considered in more detail in<br />
subsequent sections of this summary.<br />
The group recognized that nutrient–nutrient interactions<br />
may alter nutrient requirements. Examples of such<br />
interactions are protein–energy, vitamin E–polyunsaturated<br />
fats, and calcium–protein–sodium. The potential<br />
impact of such interactions on average requirements<br />
should be considered and described whenever such<br />
interactions are likely. Ideally, such nutrient interactions<br />
should be characterized quantitatively, e.g.,<br />
estimates of reductions in protein requirements with<br />
increasing energy intakes.<br />
Finally, the group addressed the need to consider<br />
subpopulations with special needs, e.g., children with<br />
chronic diarrhea or smokers. The NIVs address the<br />
requirements of “apparently healthy” individuals.<br />
Individuals with special needs should be considered<br />
separately, and if enough data are available, NIVs may<br />
be established <strong>for</strong> them.<br />
Framework <strong>for</strong> estimating UNLs<br />
The second recommended NIV is the upper nutrient<br />
level (UNL) [7]. This value was defined as the highest<br />
level of habitual nutrient intake that is likely to pose no<br />
risk of adverse health effects in almost all individuals in<br />
the general population. As intake increases above the<br />
UNL, the potential <strong>for</strong> risk of adverse effects increases.<br />
Habitual intake was defined as chronic daily use and<br />
is usually <strong>based</strong> on the total intake of a nutrient from<br />
<strong>food</strong> (including <strong>for</strong>tificants), water, supplements, and,<br />
in some cases, medications.<br />
As implied by the definition, the recommended process<br />
<strong>for</strong> deriving UNLs <strong>for</strong> all groups is the determination<br />
of a “no observed adverse effect level”* (NOAEL)<br />
or the “lowest observed adverse effect level”** (LOAEL).<br />
The group agreed that UNLs should be determined by<br />
applying an uncertainty factor to NOAELs or LOAELs<br />
and that the magnitude of uncertainty factors should be<br />
determined on a case-by-case basis. These considerations<br />
should include a careful review of the differences<br />
between values equivalent to the ANR plus 2 SD, and<br />
corresponding NOAELs or LOAELs and outcomes of a<br />
risk assessment’s hazard identification and characterization.<br />
The group endorsed the use of a modification<br />
of the sequence of possible effects due to excess intakes<br />
S5<br />
proposed by Renwick et al. (2004) [13] to help estimate<br />
the magnitude of uncertainty factors:<br />
1. Biochemical changes within the homeostatic range<br />
and without indication of adverse sequelae;<br />
2. Biochemical changes outside the homeostatic range<br />
without knowing the sequelae;<br />
3. Biochemical changes outside the homeostatic range<br />
that represent a biomarker of potential adverse<br />
effects due to excess;<br />
4. Clinical signs and/or symptoms indicative of a<br />
minor but reversible adverse effect;<br />
5. Clinical signs and/or symptoms of significant but<br />
reversible adverse effects;<br />
6. Clinical signs and/or symptoms indicative of significant<br />
reversible organ damage;<br />
7. Clinical signs and/or symptoms indicative of irreversible<br />
organ damage.<br />
The group concluded that the magnitude of uncertainty<br />
factors is likely to increase as observations progress<br />
from items 1 to 7 in the above sequence, and with<br />
the severity of sequelae to excess intakes. It acknowledged<br />
that the earliest potentially significant adverse<br />
effects would correspond to items 2 or 3 in the above<br />
sequence.<br />
The group’s recommendation of this sequence<br />
implicitly recognizes the need <strong>for</strong> biomarkers that<br />
anticipate adverse effects, rather than focusing solely on<br />
biomarkers that reflect an adverse effect’s occurrence.<br />
The availability of such biomarkers was viewed as most<br />
supportive of the protection of the public’s health and<br />
most likely to minimize the role of uncertainty factors<br />
in the estimation of UNLs.<br />
In making these recommendations, the group recognized<br />
the paucity of dose–response data available <strong>for</strong><br />
determining UNLs and describing interindividual variation<br />
and distributions. Estimates of index exposures,<br />
particularly exposures among the most vulnerable,<br />
e.g., pregnant and lactating women, children, and the<br />
elderly, also are inadequate. The seriousness of this data<br />
gap is evident in both industrialized and less wealthy<br />
countries. Furthermore, data needed to estimate values<br />
at the upper tails of intake distributions are almost<br />
always scanty <strong>for</strong> vulnerable groups in all settings.<br />
* “Greatest concentration or amount of a substance, found<br />
by experiment or observation, which causes no detectable<br />
adverse alteration of morphology, functional capacity, growth,<br />
development, or life span of the target organism under<br />
defined conditions of exposure” [12].<br />
** “Lowest concentration or amount of a substance, found<br />
by experiment or observation, which causes an adverse alteration<br />
of morphology, functional capacity, growth, development,<br />
or life span of a target organism distinguishable from<br />
normal (control) organisms of the same species and strain<br />
under defined conditions of exposure” [12].
S6 J. C. King and C. Garza<br />
Criteria <strong>for</strong> selecting outcomes <strong>for</strong><br />
establishing NIVs<br />
NIVs should be <strong>based</strong> on specific outcomes related<br />
to functional capacities or the avoidance of disease<br />
or other adverse outcomes [2]. Ideally, outcomes <strong>for</strong><br />
establishing NIVs should have the following characteristics:<br />
» A demonstrated dose–response function;<br />
» Responsive to inadequacy or excess of a single nutrient;<br />
» Resistant to rapid (daily) changes in response to<br />
inadequate, adequate, or excessive intakes;<br />
» Easily measurable or assessable with noninvasive<br />
methods;<br />
» Not responsive to environmental changes other than<br />
nutrient intake from all sources.<br />
Selecting outcomes that meet all of these characteristics<br />
is presently difficult; thus, research is needed<br />
that is designed to identify outcomes with these characteristics<br />
and to develop appropriate technologies <strong>for</strong><br />
this purpose.<br />
It is recommended strongly that a single outcome<br />
be selected <strong>for</strong> establishing NIVs <strong>for</strong> each nutrient in<br />
a specific age-physiological group. The basis <strong>for</strong> this<br />
recommendation is the likelihood that values <strong>based</strong><br />
on more than one outcome will create confusion<br />
and unnecessary complexity. Multiple outcomes also<br />
present the risk of discriminatory application, e.g.,<br />
to diverse socioeconomic or differentially privileged<br />
groups.<br />
It also is important that experts explicitly recognize<br />
that diverse outcomes <strong>for</strong> setting requirement levels<br />
differentially affect resulting ANRs and very likely<br />
also affect their variances. For example, selecting “dark<br />
adaptation” or “saturation of liver deposits” as an outcome<br />
<strong>for</strong> setting the ANR <strong>for</strong> vitamin A will result in<br />
different ANRs and probably different variances and<br />
coefficients of variation. It also is likely that diverse<br />
diet-, host-, and environment-related factors will affect<br />
ANRs differentially. Thus, careful reviews of such influences<br />
are key to the estimation of ANRs. In practice,<br />
reliable estimates of population-specific variability are<br />
seldom available, and thus research on the determinants<br />
of variances should be a high priority.<br />
The group stressed the importance of using all available<br />
published physiological data <strong>based</strong> on agreedupon<br />
characteristics to determine outcomes on which<br />
to base NIVs. It did not recommend the independent<br />
development of such data by each group that is charged<br />
with estimating NIVs. The same data may be used by<br />
diverse groups as a basis <strong>for</strong> developing NIVs that are<br />
context-specific in terms of diverse population characteristics<br />
and environmental factors that may alter<br />
estimates of specific NIVs.<br />
Acceptable distribution ranges <strong>for</strong> fat, carbohydrate,<br />
and protein intakes have been established by some<br />
groups. These ranges are derived primarily <strong>for</strong> promoting<br />
long-term health and reducing the long-term risk<br />
of noncommunicable disease. It is not necessary to<br />
establish an ANR <strong>for</strong> total <strong>dietary</strong> carbohydrate or fat.<br />
However, it is appropriate to establish ANRs <strong>for</strong> protein<br />
to achieve appropriate nitrogen balance at various<br />
life stages, and <strong>for</strong> the specific biological functions of<br />
essential fatty acids.<br />
There is a need to be as specific as possible regarding<br />
“targeted” diseases when nutrient-<strong>based</strong> standards are<br />
recommended <strong>for</strong> disease prevention or control. Thus,<br />
<strong>for</strong> example, when targeting cancer, the site, tissue<br />
involvement, physiological stage at onset, etc. should<br />
be stated explicitly. This level of specificity is likely to<br />
support the development of biomarkers linked directly<br />
to outcomes of interest and exploitation of growing<br />
in<strong>for</strong>mation regarding specific nutrient–gene interactions<br />
that modify the risks of diet-related long-term<br />
diseases.<br />
Evidence linking diet to risks of long-term diseases<br />
is more often related to specific <strong>dietary</strong> patterns than<br />
to levels of intake of specific nutrients. Thus, the<br />
group stressed the need to link committees convened<br />
to develop diet-<strong>based</strong> strategies <strong>for</strong> the promotion of<br />
long-term well-being and reduction of risk of dietrelated<br />
long-term diseases, with those convened to<br />
develop NIVs.<br />
Issues related to study design and experimental<br />
errors also should be considered explicitly by groups<br />
setting NIVs. Sample size is among the more important<br />
design characteristics in this regard. For this purpose,<br />
it is necessary to consider the width of resultant confidence<br />
intervals and to minimize the likelihood of alpha<br />
or beta errors. For example, the probability of accepting<br />
a false negative conclusion with a sample size of 100<br />
is 0.71 if an alpha value of 0.05 is used to determine<br />
statistical significance and a clinically significant difference<br />
between values of interest is set at 50%. Many<br />
nutrition studies, however, involve samples of 15 to 25<br />
subjects rather than 100 and have a much higher risk<br />
of underpowering comparisons of interest. Such risks<br />
need to be addressed when selecting a database <strong>for</strong><br />
estimating nutrient requirements.<br />
Bioavailability<br />
Bioavailability is an important factor to consider when<br />
estimating NIVs <strong>for</strong> selected nutrients (e.g., iron, zinc,<br />
carotenoids, vitamin A, folate, protein, calcium, and<br />
magnesium). The definition of bioavailability accepted<br />
by the group was proposed by Hurrell in 2002 [14] and<br />
modified by Gibson [5], the “proportion of the ingested<br />
nutrient absorbed and utilized through normal metabolic<br />
pathways. Bioavailability is influenced by <strong>dietary</strong><br />
factors and host related factors.” Bioefficacy is the<br />
efficiency with which ingested nutrients are absorbed
Executive summary<br />
and converted to an active <strong>for</strong>m [15]. Both of these<br />
terms reflect the broader concept of bioequivalence<br />
of nutrients or their precursors in defining nutritional<br />
status and function. These concepts also encompass<br />
various steps in metabolic and utilization pathways<br />
of nutrients (i.e., absorption, metabolic conversion,<br />
utilization, retention, secretion, and excretion). There<br />
are multiple factors that influence the bioequivalence of<br />
nutrients and their precursors: competition <strong>for</strong> absorptive<br />
systems; role of enhancers or inhibitors of absorption;<br />
metabolic conversion efficiency in the intestine,<br />
liver, kidney, or other tissues; and interactions between<br />
or among nutrients, chemical <strong>for</strong>m, and others. Also, it<br />
is important to remember that <strong>food</strong> processing, treatment,<br />
and/or preparation practices at the household<br />
level influence nutrient bioavailability.<br />
The roles of infection (bacterial and parasitic) and<br />
the nutritional and physiological status of the host also<br />
are of key importance in defining bioequivalence of<br />
nutrients and should be considered when the impact<br />
of infections can be described quantitatively <strong>for</strong> specific<br />
populations of interest.<br />
The importance of considering bioequivalence is<br />
especially relevant <strong>for</strong> iron and zinc, where specific<br />
approaches have been developed <strong>based</strong> on <strong>dietary</strong><br />
components that enhance and/or inhibit absorption.<br />
Algorithms predicting the bioavailability of iron and<br />
zinc have been developed <strong>based</strong> on the amounts of<br />
enhancers and inhibitors in the diet, the nutrient’s<br />
chemical <strong>for</strong>m, e.g., iron, and the nutrient status of<br />
the individual. However, the validity of these models<br />
needs to be evaluated in practice and considered in<br />
setting reference values only if quantitatively significant.<br />
Retinol, tocopherol, and folate equivalents are<br />
examples in which specific conversion values depend<br />
on the relative content of precursors, the chemical<br />
<strong>for</strong>m of the nutrient, the <strong>food</strong> matrix that serves as<br />
a “delivery system,” and the host’s physiological and<br />
health condition. Digestibility of protein sources is<br />
the key factor affecting absorbed amino nitrogen, and<br />
amino acid composition determines protein retention<br />
and urea excretion.<br />
Data on the efficiency of the biological conversion of<br />
carotenoids and various tocopherols into their bioactive<br />
<strong>for</strong>ms have significant variability; however, the practical<br />
implications of this variability have not been elucidated<br />
completely. In many cases, <strong>food</strong>-composition data<br />
are scant, limiting the assessment of bioequivalence.<br />
Recent progress in FAO’s data system to assess <strong>food</strong><br />
availability (FAOSTAT II) represents an advance in this<br />
matter. The capacity to define the nutritional adequacy<br />
of local diets will remain very limited, unless ef<strong>for</strong>ts to<br />
improve in<strong>for</strong>mation systems on <strong>food</strong>-composition<br />
data are strengthened. Ef<strong>for</strong>ts should be encouraged to<br />
advance progress in developing the International Food<br />
Data Systems Project (INFOODS) as a tool to improve<br />
the derivation of NIVs and related values.<br />
Derivation of life-stage groups, standard<br />
heights and weights, and NIV estimation<br />
by extrapolation<br />
Derivation of life-stage groups<br />
S7<br />
NIVs are developed <strong>for</strong> specific life-stage groups [3].<br />
There is no consensus, however, as to how to establish<br />
those groups. Three different options exist: chronologic<br />
age, use of functional characteristics (e.g., growth and<br />
puberty), or potential purposes <strong>for</strong> which NIVs might<br />
be used (e.g., complementary feeding programs). As<br />
an illustration of the last alternative, one might want<br />
to establish life-stage groups <strong>for</strong> infants and young<br />
children so that all children requiring complementary<br />
feeding are included in one group. It is likely that a<br />
combination of options most often will be used to<br />
establish life-stage groups. Growth and type of feeding<br />
may be used <strong>for</strong> infants and children, whereas chronologic<br />
age might be used <strong>for</strong> young, mature, and elderly<br />
adults. The same life-stage groups, however, should be<br />
used <strong>for</strong> all nutrients included in the NIV; it would be<br />
inappropriate and confusing to use one life-stage group<br />
<strong>for</strong> calcium and another <strong>for</strong> riboflavin, <strong>for</strong> example.<br />
Pregnancy and lactation do not need to be divided<br />
into various stages such as trimesters of pregnancy or<br />
early and late lactation, because physiological adjustments<br />
in nutrient utilization generally compensate <strong>for</strong><br />
shifts in nutrient requirements that occur at different<br />
stages of gestation or lactation. Furthermore, having<br />
more than one NIV <strong>for</strong> pregnancy and lactation is<br />
essentially impossible to implement; advising women<br />
to eat one diet during early pregnancy and another in<br />
late pregnancy is impractical.<br />
Standard heights and weights<br />
Standard weights and heights should be established<br />
<strong>for</strong> each selected life-stage group to define the general<br />
characteristics of the population and to permit<br />
extrapolations of ANRs to other life-stage groups <strong>based</strong><br />
on body size. For infants and children between 0 and<br />
5 years of age, the new WHO growth standards are<br />
recommended as the basis <strong>for</strong> normalizing NIVs when<br />
adjustments <strong>based</strong> on weight are appropriate. For all<br />
other age groups, data from the National Center <strong>for</strong><br />
Health Statistics/World Health Organization (NCHS/<br />
WHO) can be used to derive a standard weight and<br />
height [16]. The group recommended, however, that<br />
the average weight of men and women at 18 years of<br />
age be used throughout the adult years rather than<br />
reflecting the typical secular increase in body weight<br />
with age. It is uncertain whether this secular increase<br />
is consistent with good health. It is important to<br />
downwardly adjust energy NIVs when expressed per<br />
kilogram of body weight or per day <strong>for</strong> overweight
S8 J. C. King and C. Garza<br />
or obese individuals with body-mass indexes greater<br />
than 25. For all other nutrients, standard body weight<br />
uncorrected <strong>for</strong> overweight status is appropriate <strong>for</strong><br />
estimating NIVs.<br />
Extrapolation<br />
It is preferable to use original research <strong>for</strong> estimating<br />
nutrient requirements of various life-stage groups [3].<br />
However, due to the paucity of data <strong>for</strong> some subgroups,<br />
it is often necessary to extrapolate in<strong>for</strong>mation<br />
from other groups. Extrapolation should always<br />
be a second choice, and scientists are encouraged to<br />
develop innovative, noninvasive methods or to use<br />
existing methods (e.g., stable isotopes) to determine<br />
nutrient requirements of understudied groups, e.g.,<br />
pregnant and lactating women, infants, children, and<br />
the elderly.<br />
Until data are available <strong>for</strong> all life-stage groups,<br />
extrapolation from one group to another is necessary.<br />
Frequently, this involves extrapolation from adults to<br />
children and adolescents and from younger adults to<br />
older adults. The rationale or scientific basis <strong>for</strong> the<br />
method chosen should be completely transparent and<br />
thoroughly described <strong>for</strong> each nutrient and life-stage<br />
group. It is likely that different approaches will be<br />
used <strong>for</strong> different nutrients, or different extrapolations<br />
<strong>for</strong> diverse life-stage groups <strong>for</strong> a single nutrient.<br />
There is no one “correct” method <strong>for</strong> extrapolation,<br />
and thus scientific judgment is required. Examples<br />
of extrapolation methods that are used include body<br />
size (weight or metabolic weight), energy intakes <strong>for</strong><br />
age, or factorial estimates of requirements <strong>for</strong> growth,<br />
pregnancy, and lactation. When the factorial approach<br />
is used, it is important to be completely transparent in<br />
describing the databases used to estimate components<br />
of the estimate, such as milk volume and composition<br />
during lactation, or composition of weight gain during<br />
pregnancy.<br />
Effects of genetic variation on nutrient<br />
intake values<br />
The primary nucleotide sequence of the human genome<br />
varies by approximately 0.2% to 0.4% among humans<br />
[8]. Variations in a DNA sequence that are enriched in<br />
populations are referred to as polymorphisms, which<br />
constitute a primary molecular basis <strong>for</strong> human phenotypic<br />
variation. Human mutations expand in populations<br />
as a result of natural selection or through random<br />
drift. Historically, the nature and abundance of the<br />
<strong>food</strong> supply are among several environmental selective<br />
pressures that enabled the expansion of polymorphisms<br />
within human populations. Genetic variants that<br />
enable survival in challenging nutrient environments<br />
become enriched in populations through the process of<br />
natural selection. This process may confer differences<br />
in <strong>food</strong> tolerances or intolerances, could develop into<br />
metabolic disease alleles in different environmental<br />
contexts, and has the potential to alter NIVs. Because<br />
many human populations have existed <strong>for</strong> many generations<br />
in unique, isolated, and challenging nutrient<br />
environments, relatively rare gene variants that influence<br />
NIVs may be highly prevalent in isolated populations.<br />
Gene variants associated with human lactose<br />
intolerance and alcohol intolerance display genomic<br />
signatures of positive selection in specific geographic<br />
regions. These signatures indicate that these variants<br />
offered survival advantages related to an index <strong>food</strong><br />
component itself and/or more broadly to the metabolic<br />
network key to a <strong>food</strong> component’s broader role.<br />
Computational approaches are identifying numerous<br />
gene variants associated with nutrient transport and<br />
metabolism that display signatures of positive selection.<br />
To date, no gene variant has been demonstrated<br />
to affect nutritional requirements sufficiently to warrant<br />
genotype-specific recommendations, although the<br />
effect of the MTHFR A222V variants on folate requirements<br />
has been considered. Because polymorphisms<br />
can confer both health benefits and risks, depending<br />
on the outcome of interest, and these outcomes may<br />
respond differentially to nutrient intake levels, it may<br />
be important to consider the effects of genetic-specific<br />
recommendations on all known health outcomes. For<br />
example, the MTHFR A22V polymorphism confers<br />
increased risk <strong>for</strong> developmental anomalies but protection<br />
from colon cancer; the impact of individualized<br />
ANRs on both health outcomes should be considered<br />
<strong>for</strong> this genetic minority.<br />
The impact of a gene variant on nutrient requirements<br />
will be dependent on its prevalence and penetrance.<br />
Penetrance is the probability that a gene variant<br />
will express a phenotype from a given genotype at a<br />
given time. In most cases, penetrance varies inversely<br />
with prevalence. Few gene variants are anticipated to<br />
be sufficiently penetrant to affect variation of ANRs to<br />
a greater degree than environmental factors. However,<br />
the identification of highly penetrant gene variants may<br />
require the derivation of more than one ANR or UNL<br />
<strong>for</strong> genetic subgroups. It is unlikely that gene–gene<br />
interactions will be a major consideration in the determination<br />
of NIVs because of the low prevalence associated<br />
with highly penetrant gene–gene interactions.<br />
Furthermore, because chronic diseases are polygenic<br />
complex traits, individual SNPs are unlikely to impact<br />
NIVs that target the reduction of diet-related risk of<br />
long-term disease.<br />
Thus, the group concluded that other than that <strong>for</strong><br />
folate, no other specific polymorphisms have been<br />
identified that should be considered in the derivation<br />
of NIVs beyond those subsumed in estimates of interindividual<br />
variation. This field is, however, progressing
Executive summary<br />
very rapidly and our understanding of human genetic<br />
variation is expected to improve steadily in the near<br />
and mid-term future. Linking specific gene variants to<br />
known nutrient-sensitive ethnic or geographic populations,<br />
such as salt sensitivity in African Americans,<br />
may enable population-specific recommendations <strong>for</strong><br />
genetic subgroups. There<strong>for</strong>e, advances in understanding<br />
the impact of genetic variation on NIVs merit<br />
the close attention of all groups charged with their<br />
derivation.<br />
Methodological approaches and<br />
applications of NIVs<br />
The term “uses” frequently has been used to refer to all<br />
of the various applications of a set of NIVs. The group<br />
felt, however, that it is important to distinguish between<br />
the terms “uses” and “applications.” Common uses of<br />
NIVs are <strong>for</strong> planning diets (of groups and individuals)<br />
and assessing intakes (of groups and individuals). The<br />
group decided to refer to this set of uses as “methodological<br />
approaches [4].” “Applications,” then, refers to<br />
specific ways in which methods can be applied to various<br />
tasks (e.g., setting <strong>for</strong>tification levels, developing<br />
<strong>food</strong>-<strong>based</strong> <strong>dietary</strong> <strong>guidelines</strong>) [1, 9, 10].<br />
Theoretical approaches to using the NIV <strong>for</strong> assessment<br />
of <strong>dietary</strong> intakes <strong>for</strong> individuals requires calculating<br />
the probability of an inadequate intake using the<br />
ANR and its distribution. At any intake on the x-axis<br />
one can calculate the probability of inadequacy <strong>for</strong> an<br />
individual. For example, if the intake equals the ANR,<br />
then the probability of inadequacy <strong>for</strong> an individual<br />
is 50%. For the assessment of groups, the prevalence<br />
of inadequacy can be estimated as the percentage of<br />
the population below the ANR if certain criteria are<br />
met.*<br />
For planning diets <strong>for</strong> individuals, one must first<br />
establish a “recommended intake” or individual nutrient<br />
level (INL x , where x indicates the likelihood of<br />
meeting an individual’s nutrient requirement, historically<br />
98%). The group suggests that the INL x should be<br />
<strong>based</strong> on the ANR adjusted <strong>for</strong> the level of acceptable<br />
risk <strong>for</strong> deficiency. For example, if 2 SD of the requirement<br />
are added to the ANR, then the likelihood of<br />
meeting an individual’s needs is 98%, or conversely the<br />
individual’s risk of inadequacy is 2%.<br />
When planning diets <strong>for</strong> groups, one should aim <strong>for</strong> a<br />
distribution of intakes that results in an acceptably low<br />
*Among these criteria is that requirements must have a<br />
reasonably normal distribution; thus, the estimated average<br />
requirement (EAR) cutpoint method that is the basis <strong>for</strong><br />
estimating the prevalence of nutrient adequacy or inadequacy<br />
in a targeted population cannot be used <strong>for</strong> assessing iron<br />
intakes of menstruating women, because the distribution<br />
of iron requirements <strong>for</strong> this group is highly skewed to the<br />
left.<br />
S9<br />
prevalence of inadequacy (estimated as the proportion<br />
below the ANR) and also a low prevalence of nutrient<br />
excess (estimated as the proportion above the UNL).<br />
To reduce the prevalence of inadequacy, one could<br />
either shift the entire intake distribution to a higher<br />
level, or change the shape of the intake distribution by<br />
improving the intakes of those at the lower end. Either<br />
way, the goal is to identify an intake distribution that<br />
represents an acceptable level of inadequacy, such as<br />
only 2% to 3% of the population being below the ANR.<br />
This may be achieved through education in relevant<br />
nutrition practices or by a targeted <strong>food</strong> supply (e.g.,<br />
<strong>for</strong>tification of staple <strong>food</strong>s) to ensure that the intake<br />
distribution curve has only a small proportion of the<br />
population below the ANR or above the UNL. For<br />
most groups, it is not appropriate to use the INL x as the<br />
target <strong>for</strong> the group’s mean intake. Due to significant<br />
interindividual differences in high variance individuals<br />
in a group, targeting mean group intakes at an INL x<br />
usually results in a high prevalence of inadequacy (as<br />
much as 25% to 30%, <strong>for</strong> some nutrients, even when<br />
INL 98 is targeted) because of commonly high levels of<br />
interindividual differences in nutrient intakes. For this<br />
reason, intake distributions should be examined, not<br />
just group mean intakes.<br />
In summary, NIVs should <strong>for</strong>m the basis of planning<br />
and assessment of diets, and this requires at a<br />
minimum an ANR and a UNL. The INL x is derived<br />
from the ANR by adding a factor to cover a specified<br />
percentage of the population (x). The specific application<br />
of the INL will drive the x factor that is applied [6].<br />
Graphs and charts illustrate the relationship among the<br />
ANR, UNL, and INL x and the appropriate use of these<br />
NIVs <strong>for</strong> nutrient assessment and <strong>dietary</strong> planning<br />
purposes. Groups charged with developing NIVs may<br />
choose to include values <strong>for</strong> INL x in basic tables, but<br />
this latter value is derived basically from the ANR and<br />
its distribution.<br />
Trade and regulatory issues<br />
The group agreed that issues related to international<br />
and domestic trade, and the important roles played<br />
by the Codex Alimentarius Commission and the<br />
World Trade Organization (WTO), should be considered<br />
when developing harmonized processes and<br />
approaches <strong>for</strong> deriving NIVs [9]. Also, it is important<br />
that scientific advice regarding nutrient requirements<br />
and their applications be made available to specific<br />
groups of the Codex Alimentarius Commission, such<br />
as the Codex Committee on Nutrition and Foods <strong>for</strong><br />
Special Dietary Uses (CCNFSDU) and the Codex<br />
Committee on Food Labeling (CCFL). In<strong>for</strong>mation on<br />
developing <strong>dietary</strong> <strong>guidelines</strong> <strong>for</strong> health and consumer<br />
protection also should be provided to these specific<br />
groups. It is crucial to understand the important role
S10 J. C. King and C. Garza<br />
that the Codex Alimentarius Commission plays in setting<br />
<strong>food</strong> standards and <strong>guidelines</strong> <strong>for</strong> protecting consumer<br />
health and ensuring fair practices in domestic<br />
and international trade.<br />
Food labeling is an important component of trade<br />
and regulatory nutrition issues. Harmonizing label procedures<br />
also will improve trade opportunities within<br />
regions and worldwide. The process of developing <strong>food</strong><br />
labels can be harmonized among regional, national,<br />
and international groups. To establish <strong>food</strong> labels, some<br />
have used the INL x weighted by the distribution of the<br />
various life-stage groups in populations as a basis <strong>for</strong><br />
<strong>food</strong> labels. Others have used the highest nutrient level<br />
recommended <strong>for</strong> individuals in a population.<br />
Food <strong>for</strong>tification is another application of NIVs relevant<br />
to trade and regulatory issues. Food <strong>for</strong>tification may<br />
be mandatory or voluntary. Fortification programs should<br />
be designed so that the prevalence of intakes of target<br />
nutrients that are below the ANR or above the UNL is low<br />
[17]. This will ensure that very few individuals have either<br />
inadequate or excessive intakes of targeted nutrients.<br />
Application of NIVs to <strong>dietary</strong> <strong>guidelines</strong><br />
Explicit <strong>food</strong>-<strong>based</strong> <strong>dietary</strong> <strong>guidelines</strong> (FBDGs), or<br />
similar recommendations, have been developed by<br />
many countries [10]. In some countries, such as the<br />
<strong>United</strong> States and Canada, FBDGs are the basis <strong>for</strong><br />
national nutrition education activities and <strong>food</strong> assistance<br />
programs. FBDGs generally provide a comprehensive<br />
set of <strong>guidelines</strong> that are intended to reduce<br />
long-term disease risk and improve general health. In<br />
addition to specific <strong>guidelines</strong> regarding the intake of<br />
fruits, vegetables, whole grains, and dairy <strong>food</strong>s, statements<br />
often are included regarding physical activity,<br />
<strong>food</strong> safety, and the types of carbohydrate and fat <strong>for</strong><br />
reducing long-term disease risk. Thus, FBDGs serve<br />
as the basis <strong>for</strong> healthy lifestyles. In most countries,<br />
resources <strong>for</strong> disseminating in<strong>for</strong>mation embodied<br />
in FBDGs are inadequate and their use and implementation<br />
by the general public are limited. Thus, not<br />
surprisingly, direct evidence that <strong>dietary</strong> <strong>guidelines</strong> are<br />
an effective means to improve the overall health of a<br />
population is lacking in practically all countries.<br />
It is not possible to harmonize <strong>food</strong>-<strong>based</strong> <strong>dietary</strong><br />
<strong>guidelines</strong> across countries, cultures, and regions,<br />
because these <strong>guidelines</strong> stem from social influences<br />
on <strong>food</strong> patterns, culturally sensitive issues regarding<br />
<strong>food</strong> within a country or subpopulation, and nutrition<br />
and health problems of a specific population. However,<br />
methods <strong>for</strong> developing <strong>dietary</strong> <strong>guidelines</strong> can be<br />
harmonized around the world. As is the case <strong>for</strong> <strong>food</strong><br />
labeling and <strong>for</strong>tification programs, NIVs <strong>for</strong>m the<br />
basis <strong>for</strong> FBDGs. A harmonized method <strong>for</strong> developing<br />
FBDGs <strong>based</strong> on ANR, INL x , and UNL values is<br />
described by Vorster et al. [1].<br />
Summary<br />
The conceptual framework <strong>for</strong> the various NIVs is<br />
depicted in figure 1 along with the methodological<br />
approaches and applications. The NIVs consist of two<br />
values derived from a statistical evaluation of data on<br />
nutrient requirements, the average nutrient requirement<br />
(ANR), or nutrient toxicities, the upper nutrient<br />
level (UNL). The individual nutrient level x (INL x )<br />
is derived from the distribution of average nutrient<br />
requirements. The percentile chosen is often 98%,<br />
which is equivalent to 2 SD above the mean requirement.<br />
Concepts underlying the NIVs include criteria<br />
<strong>for</strong> establishing a nutrient requirement, e.g., ferritin<br />
stores, nitrogen balance, or serum vitamin C. Once the<br />
requirement <strong>for</strong> the absorbed nutrient is determined, it<br />
may be necessary to adjust the value <strong>for</strong> <strong>food</strong> sources,<br />
i.e., bioavailability, or host factors, such as the effect<br />
of infection on nutrient utilization. Other concepts<br />
that committees may want to consider when establishing<br />
NIVs include the effects of genetic variation on<br />
nutrient requirements and the role of the nutrient in<br />
preventing long-term disease.<br />
Two fundamental uses of NIVs are <strong>for</strong> assessing the<br />
adequacy of nutrient intakes and <strong>for</strong> planning diets<br />
<strong>for</strong> individuals and populations. Establishing the NIV<br />
using the statistical framework proposed in this report<br />
improves the efficacy of the values <strong>for</strong> identifying risks<br />
of nutrient deficiency or excess among individuals<br />
and populations. NIVs also are applied to a number of<br />
aspects of <strong>food</strong> and nutrition policy. Some examples<br />
include regulatory issues and trade, labeling, planning<br />
programs <strong>for</strong> alleviating public health nutrition problems,<br />
<strong>food</strong> <strong>for</strong>tification, and <strong>dietary</strong> guidance.
Executive summary<br />
References<br />
Concepts Average nutrient<br />
Methods of using NIVs<br />
requirement (ANR)<br />
Assessment/evaluation<br />
Evaluate criteria<br />
Extrapolate if<br />
necessary<br />
Adjust <strong>for</strong>:<br />
Food sources<br />
Host factors<br />
Consider<br />
Genetic variation<br />
Long-term health<br />
Acronyms may change with various languages<br />
Estimated from a<br />
distribution of<br />
requirements <strong>based</strong> on a<br />
specific criterion in<br />
healthy individuals<br />
Individual nutrient<br />
level x (INL x )<br />
Derived from the<br />
distribution of the ANR;<br />
x=percentile chosen<br />
Upper nutrient level<br />
(UNL)<br />
Using a LOAEL/NOAEL<br />
with an appropriate<br />
uncertainty factor<br />
1. Vorster HH, Murphy SP, Allen LH, King JC. Application<br />
of nutrient intake values (NIVs). Food Nutr Bull<br />
2007;28(suppl):S116–22.<br />
2. Yates AA. Using criteria to establish nutrient intake<br />
values (NIVs). Food Nutr Bull 2007;28(suppl):S38–50.<br />
3. Atkinson SA, Koletzko B. Determining life-stage groups<br />
and extrapolating nutrient intake values (NIVs). Food<br />
Nutr Bull 2007;28(suppl):S61–76.<br />
4. Murphy SP, Vorster HH. Methods <strong>for</strong> using nutrient<br />
intake values (NIVs) to assess or plan nutrient intakes.<br />
Food Nutr Bull 2007;28(suppl):S51–60.<br />
5. Gibson RS. The role of diet- and host-related factors<br />
in nutrient bioavailability and thus in nutrient<strong>based</strong><br />
<strong>dietary</strong> requirement estimates. Food Nutr Bull<br />
2007;28(suppl):S77–100.<br />
6. King JC, Vorster HH, Tome DG. Nutrient intake<br />
values (NIVs): A recommended terminology and<br />
framework <strong>for</strong> the derivation of values. Food Nutr Bull<br />
2007;28(suppl):S16–26.<br />
7. Aggett PJ. Nutrient risk assessment: Setting upper levels<br />
Individuals<br />
Populations<br />
Diet Planning<br />
Individuals<br />
Populations<br />
Applications<br />
Regulatory issues and trade<br />
Labeling<br />
Public health planning<br />
Fortification<br />
Dietary guidance<br />
FIG. 1. The two nutrient intake values (NIVs) are the average nutrient requirement<br />
(ANR) and the upper nutrient level (UNL). Other NIVs may be derived from these two<br />
values, i.e., the individual nutrient level x (INL x ), which is the ANR plus some percentile<br />
of the mean used <strong>for</strong> guiding individual intakes. The ANR and UNL are derived from<br />
estimates of amounts needed <strong>for</strong> a specific physiological criterion, e.g., tissue stores,<br />
metabolic balance, or a biochemical function. The NIVs are modified <strong>for</strong> population<br />
differences in the <strong>food</strong> supply, host factors such as infection, genetic variations, and needs<br />
<strong>for</strong> sustaining long-term health. The methods of using NIVs to assess/evaluate intakes of<br />
individuals and populations differ from that used <strong>for</strong> planning diets <strong>for</strong> individuals and<br />
populations. NIVs are the basis <strong>for</strong> a number of policy applications. Examples include<br />
<strong>food</strong> labeling and <strong>for</strong>tification, <strong>food</strong>-<strong>based</strong> <strong>dietary</strong> guidance, planning public health<br />
nutrition programs, and establishing <strong>food</strong> regulatory policies.<br />
S11<br />
and an opportunity <strong>for</strong> harmonization. Food Nutr Bull<br />
2007;28(suppl):S27–37.<br />
8. Stover PJ. Human nutrition and genetic variation. Food<br />
Nutr Bull 2007;28(suppl):S101–15.<br />
9. Ramaswamy S, Viswanathan B. Trade, development, and<br />
regulatory issues in <strong>food</strong>. Food Nutr Bull 2007;28(suppl):<br />
S123–40.<br />
10. Smitasiri S, Uauy R. Beyond recommendations: <strong>Implementing</strong><br />
<strong>food</strong>-<strong>based</strong> <strong>dietary</strong> <strong>guidelines</strong> <strong>for</strong> healthier<br />
populations. Food Nutr Bull 2007;28(suppl):S141–51.<br />
11. World Health Organization. Trace elements in human<br />
nutrition and health. Geneva: WHO, 1996.<br />
12. McNaught AD, Wilkinson A. IUPAC Compendium of<br />
Chemical Terminology. The Gold Book. 2 nd Edition.<br />
1997. Blackwell Science.<br />
13. Renwick AG, Flynn A, Fletcher RJ, Muller DJ, Tuijtelaars<br />
S, Verhagen H. Risk-benefit analysis of micronutrients.<br />
Food Chem Toxicol 2004;42:1903–22.<br />
14. Hurrell R. Bioavailability—a time <strong>for</strong> reflection. Int J<br />
Vitam Nutr Res 2002;72:5–6.
S12 J. C. King and C. Garza<br />
15. West CE, Eilander A, van Lieshout M. Consequences of<br />
revised estimates of carotenoid bioefficacy <strong>for</strong> <strong>dietary</strong><br />
control of vitamin A deficiency in developing countries.<br />
J Nutr 2002;132(9 suppl):2920S–6S.<br />
16. World Health Organization. Measuring change in nutritional<br />
status: <strong>guidelines</strong> <strong>for</strong> assessing the nutritional<br />
impact of supplementary feeding programmes <strong>for</strong><br />
vulnerable groups. Geneva: WHO, 1983.<br />
17. World Health Organization. Guidelines on <strong>food</strong> <strong>for</strong>tification<br />
with micronutrients <strong>for</strong> the control of micronutrient<br />
malnutrition. Geneva: WHO, 2006.
Introduction<br />
Janet C. King and Cutberto Garza<br />
The important roles of wholesome <strong>food</strong> supplies lead<br />
national governments or their designated agents to<br />
name expert groups periodically to derive and promulgate<br />
nutrient-<strong>based</strong> <strong>dietary</strong> standards, e.g., estimated<br />
average requirements, recommended intakes <strong>for</strong> individuals,<br />
and upper tolerable intake levels. Discrepancies<br />
often arise among diverse national ef<strong>for</strong>ts, in part<br />
because there is no global consensus regarding concepts<br />
and approaches <strong>for</strong> their derivation. These discrepancies<br />
create problems <strong>for</strong> health, trade, and other<br />
national authorities responsible <strong>for</strong> those sectors.<br />
The lack of a global consensus on the most appropriate<br />
concepts and approaches <strong>for</strong> the determination of<br />
national standards makes it difficult to resolve differences<br />
that arise in setting national and international<br />
nutrition standards and public and clinical health<br />
objectives, designing national and international <strong>food</strong><br />
policies, and enhancing the transparency of national<br />
standards to trade and other regulatory and normative<br />
activities with economic, health, and safety<br />
implications. Resolution of these differences is most<br />
problematic <strong>for</strong> developing countries that often have<br />
to sift through disparate recommendations without the<br />
needed infrastructures to make decisions.<br />
Project objective<br />
To address these discrepancies in <strong>dietary</strong> standards<br />
worldwide that lead to international discrepancies<br />
in health, <strong>food</strong> policies, and trade, a working group<br />
The authors are co-chairs of the Working Group on<br />
International Harmonization of Approaches <strong>for</strong> Developing<br />
Nutrient-Based Dietary Standards.<br />
Janet C. King is affiliated with the Children’s Hospital<br />
Oakland Research Institute and the University of Cali<strong>for</strong>nia<br />
at Berkeley and Davis, Cali<strong>for</strong>nia, USA. Cutberto Garza is<br />
affiliated with Boston College, Boston, Massachusetts, USA.<br />
Please direct queries to the corresponding author: Janet C.<br />
King, Children’s Hospital Oakland Research Institute, 5700<br />
Martin Luther King Jr. Way, Oakland, CA 94609, USA; e-mail:<br />
jking@chori.org.<br />
was convened to harmonize concepts and approaches<br />
(as opposed to deriving specific recommendations)<br />
<strong>for</strong> developing nutrient-<strong>based</strong> <strong>dietary</strong> standards. A<br />
major outcome of this ef<strong>for</strong>t is an improvement in the<br />
transparency of methods used to derive nutrient-<strong>based</strong><br />
<strong>dietary</strong> standards and how to apply them to various<br />
functions.<br />
Approach<br />
The <strong>United</strong> <strong>Nations</strong> University (UNU) Food and<br />
Nutrition Programme in collaboration with the Food<br />
and Agriculture Organization (FAO) and the World<br />
Health Organization (WHO) Nutrition Department<br />
<strong>for</strong> Health and Development commissioned 10 papers<br />
from leaders in establishing and applying nutrient<br />
intake recommendations. Each paper focused on distinct<br />
aspects of the process <strong>for</strong> developing harmonized<br />
nutrient-<strong>based</strong> <strong>dietary</strong> standards. A brief description of<br />
the papers follows.<br />
King et al. [1] review the terminology used by various<br />
countries and regions <strong>for</strong> defining <strong>dietary</strong> standards.<br />
A general framework <strong>for</strong> establishing nutrient<br />
intake values is proposed and the rationale <strong>for</strong> the<br />
proposed framework is discussed. Aggett [2] reviews<br />
the approaches <strong>for</strong> identifying upper nutrient levels<br />
and proposes a framework <strong>for</strong> defining upper nutrient<br />
levels.<br />
Yates [3] reviews the possible approaches <strong>for</strong> identifying<br />
physiological criteria <strong>for</strong> establishing <strong>dietary</strong><br />
standards (i.e., determining what physiological functions<br />
requirements will satisfy). Important components<br />
of this paper are how to estimate the numbers of<br />
subjects needed to estimate function-specific nutrient<br />
requirements and interindividual variation, how to<br />
identify the basis <strong>for</strong> that variation, and the assessment<br />
of approaches <strong>for</strong> identifying the physiological states or<br />
ages <strong>for</strong> which data are required.<br />
Murphy and Vorster [4] review the specific methologic<br />
approaches to plan and assess intakes <strong>for</strong> individuals<br />
and populations. The advantages of basing <strong>dietary</strong><br />
Food and Nutrition Bulletin, vol. 28, no. 1 (supplement) © 2007, The <strong>United</strong> <strong>Nations</strong> University. S13
S14<br />
assessments and plans on the NIV are discussed.<br />
Atkinson and Koletzko [5] review the bases <strong>for</strong><br />
extrapolation and interpolation among and between<br />
age groups, environments, and physiological states <strong>for</strong><br />
which insufficient data are available.<br />
Gibson [6] reviews the biological factors that influence<br />
recommended intakes of specific nutrients (e.g.,<br />
composition of usual diets, bioavailability, biological<br />
value, interindividual variability, nutrient–nutrient<br />
interactions, etc.).<br />
Stover [7] reviews the implications of expanding<br />
understanding of the human genome and the technological<br />
capabilities that have made that understanding<br />
possible. Special attention is focused on the role of<br />
population-wide versus individual recommendations<br />
and on the likely magnitude of inter- and intrapopulation<br />
genetically <strong>based</strong> differences that relate to nutrient<br />
requirements.<br />
Vorster et al. [8] review the diverse applications of<br />
nutrient intake values (NIVs) <strong>for</strong> <strong>dietary</strong> assessment<br />
and planning. Examples of how to use NIV <strong>for</strong> <strong>food</strong><br />
labeling, <strong>food</strong> <strong>for</strong>tification, and <strong>food</strong>-<strong>based</strong> <strong>dietary</strong><br />
<strong>guidelines</strong> are provided.<br />
Ramaswamy and Viswanathan [9] review regulatory<br />
and trade issues of importance to the harmonization of<br />
approaches <strong>for</strong> setting nutrient-<strong>based</strong> <strong>dietary</strong> standards<br />
and, ultimately, quantitative estimates of standards.<br />
Smitasiri and Uauy [10] review principles and<br />
approaches <strong>for</strong> the translation of nutrient-<strong>based</strong> <strong>dietary</strong><br />
standards to <strong>food</strong>-<strong>based</strong> <strong>guidelines</strong>, with special care<br />
being taken to address the multiple uses that <strong>food</strong><strong>based</strong><br />
<strong>guidelines</strong> have served (e.g., consumer education<br />
and feeding programs).<br />
Following an initial review and modification of the<br />
papers, the authors and staff from the UNU, FAO,<br />
WHO, and UNICEF met at the UNICEF Innocenti<br />
Center in Florence, Italy, in December 2005, to discuss<br />
the papers and develop the final report on harmonizing<br />
<strong>dietary</strong> standards. Following the December meeting, the<br />
authors revised their reports <strong>based</strong> on discussion and<br />
decisions regarding the framework, criteria, uses, and<br />
applications of <strong>dietary</strong> standards. The papers included<br />
in this supplement to the Food and Nutrition Bulletin<br />
are the final product of this process. An Executive<br />
Summary [11] is also included in the report that outlines<br />
the discussion and decisions made by the group.<br />
Members of the Working Group<br />
on International Harmonization<br />
of Approaches <strong>for</strong> Developing<br />
Nutrient-Based Dietary Standards<br />
J. C. King and C. Garza<br />
The members of the working group are Professor<br />
Peter J. Aggett, Head of School, Lancashire Postgraduate<br />
School of Medicine and Health, University<br />
of Central Lancashire, UK; Lindsay Allen, Director,<br />
Western Human Nutrition Research Center, University<br />
of Cali<strong>for</strong>nia, Davis, USA; Stephanie A. Atkinson,<br />
Professor, Department of Pediatrics, McMaster<br />
University, Ontario, Canada; Cutberto Garza, Boston<br />
College, Boston, Massachusetts, USA; Rosalind S.<br />
Gibson, Department of Human Nutrition, University<br />
of Otago, New Zealand; Janet C. King, Children’s Hospital<br />
Oakland Research Institute and the University<br />
of Cali<strong>for</strong>nia at Berkeley and Davis, Cali<strong>for</strong>nia, USA;<br />
Berthold Koletzko, Division of Metabolic Diseases and<br />
Nutritional Medicine, Ludwig-Maximilians-University<br />
of Munich, Germany; Suzanne P. Murphy, University of<br />
Hawaii, Cancer Research Center of Hawaii, Honolulu,<br />
USA; Professor Pirjo Pietinen, National Public Health<br />
Institute, Nutrition Unit, Helsinki; Suttilak Smitasiri,<br />
Head, Division of Communication and Behavioral<br />
Science, Institute of Nutrition, Mahidol University,<br />
Nakhon Pathom, Thailand; Sunder Ramaswamy, Frederick<br />
C. Dirks Professor of Economics, Middlebury<br />
College, Middlebury, Vermont, USA; Prakash Shetty,<br />
Kasturba Medical College, Karnataka, India; Patrick<br />
Stover, Cornell University, Ithaca, New York, USA;<br />
Professor Daniel Tome, Institut National Agronomique<br />
Paris-Grignon, Paris; Ricardo Uauy, INTA University<br />
of Chile, Santiago, Chile; Brinda Viswanathan, Institute<br />
<strong>for</strong> Social and Economic Change (ISEC), Nagarbhavi,<br />
Bangalore, India; Hester H. Vorster, Faculty of<br />
Health Sciences, North-West University Potchefstroom<br />
Campus, Potchefstroom, South Africa; and Allison A.<br />
Yates, Director, Beltsville Human Nutrition Center,<br />
Beltsville, Maryland, USA.
Introduction<br />
References<br />
1. King JC, Vorster HH, Tome DG. Nutrient intake values<br />
(NIVs): A recommended terminology and framework<br />
<strong>for</strong> the derivation of values. Food Nutr Bull 2007;<br />
28(suppl):S16–26.<br />
2. Aggett PJ. Nutrient risk assessment:Setting upper levels<br />
and an opportunity <strong>for</strong> harmonization. Food Nutr Bull<br />
2007;28(suppl):S27–37.<br />
3. Yates AA. Using criteria to establish nutrient intake<br />
values (NIVs). Food Nutr Bull 2007;28(suppl):S38–50.<br />
4. Murphy SP, Vorster HH. Methods <strong>for</strong> using nutrient<br />
intake values (NIVs) to assess or plan nutrient intakes.<br />
Food Nutr Bull 2007;28(suppl):S51–60.<br />
5. Atkinson S, Koletzko B. Determining life-stage groups<br />
and extrapolating nutrient intake values (NIVs). Food<br />
Nutr Bull 2007;28(suppl):S61–76.<br />
6. Gibson RS. The role of diet and host-related fac-<br />
S15<br />
tors in nutrient bioavailability and thus in nutrient<strong>based</strong><br />
<strong>dietary</strong> requirement estimates. Food Nutr Bull<br />
2007;28(suppl):S77–100.<br />
7. Stover PJ. Human nutrition and genetic variation. Food<br />
Nutr Bull 2007;28(suppl):S101–15.<br />
8. Vorster HH, Murphy S, Allen LH, King JC. Application<br />
of nutrient intake values (NIVs). Food Nutr Bull<br />
2007;28(suppl):S116–22.<br />
9. Ramaswamy S, Viswanathan B. Trade and regulatory<br />
issues and nutrient intake values (NIVs). Food Nutr Bull<br />
2007;28(suppl):S123–40.<br />
10. Smitasiri S, Uauy R. Beyond recommendations: <strong>Implementing</strong><br />
<strong>food</strong>-<strong>based</strong> <strong>dietary</strong> <strong>guidelines</strong> <strong>for</strong> healthier<br />
populations. Food Nutr Bull 2007;28(suppl):S141–51.<br />
11. King JC, Garza C. Executive summary. Food Nutr Bull<br />
2007;28(suppl):S3–12.
Nutrient intake values (NIVs): A recommended<br />
terminology and framework <strong>for</strong> the derivation of<br />
values<br />
Janet C. King, Hester H. Vorster, and Daniel G. Tome<br />
Abstract<br />
Although most countries and regions around the world<br />
set recommended nutrient intake values <strong>for</strong> their populations,<br />
there is no standardized terminology or framework<br />
<strong>for</strong> establishing these standards. Different terms used<br />
<strong>for</strong> various components of a set of <strong>dietary</strong> standards are<br />
described in this paper and a common set of terminology<br />
is proposed. The recommended terminology suggests that<br />
the set of values be called nutrient intake values (NIVs)<br />
and that the set be composed of three different values.<br />
The average nutrient requirement (ANR) reflects the<br />
median requirement <strong>for</strong> a nutrient in a specific population.<br />
The individual nutrient level (INL x ) is the recommended<br />
level of nutrient intake <strong>for</strong> all healthy people in<br />
the population, which is set at a certain level x above the<br />
mean requirement. For example, a value set at 2 standard<br />
deviations above the mean requirement would cover<br />
the needs of 98% of the population and would be INL 98 .<br />
The third component of the NIVs is an upper nutrient<br />
level (UNL), which is the highest level of daily nutrient<br />
intake that is likely to pose no risk of adverse health<br />
effects <strong>for</strong> almost all individuals in a specified life-stage<br />
group. The proposed framework <strong>for</strong> deriving a set of<br />
NIVs is <strong>based</strong> on a statistical approach <strong>for</strong> determining<br />
the midpoint of a distribution of requirements <strong>for</strong> a set<br />
of nutrients in a population (the ANR), the standard<br />
deviation of the requirements, and an individual nutrient<br />
level that assures health at some point above the<br />
mean, e.g., 2 standard deviations. Ideally, a second set<br />
of distributions of risk of excessive intakes is used as the<br />
basis <strong>for</strong> a UNL.<br />
Janet C. King is affiliated with the Children’s Hospital<br />
Oakland Research Institute and the University of Cali<strong>for</strong>nia at<br />
Berkeley and Davis, Cali<strong>for</strong>nia, USA; Hester H. Vorster is affiliated<br />
with North-West University (Potchefstroom Campus),<br />
Potchefstroom, South Africa; Daniel G. Tome is affiliated with<br />
the Institut National Agronomique Paris-Grignon, Paris.<br />
Please direct queries to the corresponding author: Janet C.<br />
King, Children’s Hospital Oakland Research Institute, 5700<br />
Martin Luther King Jr. Way, Oakland, CA 94609, USA; e-mail:<br />
jking@chori.org.<br />
S16<br />
Key words: Nutrient requirements, nutrient recommendations,<br />
recommended <strong>dietary</strong> allowances, recommended<br />
nutrient intakes<br />
Introduction<br />
Most countries or regions around the world recommend<br />
nutrient intake values <strong>for</strong> their populations.<br />
These recommendations serve as a basis <strong>for</strong> national<br />
or regional nutrition policies, nutritional educational<br />
programs, and <strong>food</strong> regulations and action programs.<br />
Traditionally, these standards have been set at a level<br />
that would cover the requirements of practically all<br />
healthy persons in the population. As new knowledge<br />
of human nutrient requirements becomes available, the<br />
standards need to undergo a reassessment and revision<br />
as appropriate. Most countries or regions review the<br />
status of knowledge and update their nutrient intake<br />
values about every 5 to 10 years.<br />
The amounts of nutrient intakes recommended<br />
vary considerably from country to country. Also, the<br />
terms used to describe the intake values differ. For<br />
example, some countries recommend a single value<br />
that serves as a recommended intake <strong>for</strong> all members<br />
of a population subgroup, whereas other countries<br />
recommend four different values: a lower reference<br />
intake, an average requirement, a recommended intake<br />
<strong>for</strong> nearly all members of a population group, and an<br />
upper tolerable level or limit. There is no standardized,<br />
commonly agreed-upon terminology <strong>for</strong> these terms.<br />
Furthermore, there is no standard method or approach<br />
<strong>for</strong> deriving these different nutrient intake values.<br />
In this paper, we will review the different terms<br />
and definitions used to describe a set of <strong>dietary</strong> recommendations<br />
from different countries and regions<br />
around the world. We will then propose a set of terms<br />
and definitions <strong>for</strong> harmonizing nutrient intake values<br />
worldwide. Finally, we will suggest a theoretical framework<br />
<strong>for</strong> deriving specific nutrient intake values.<br />
Throughout this paper, a set of <strong>dietary</strong> intake recommendations<br />
derived from primary research data is<br />
Food and Nutrition Bulletin, vol. 28, no. 1 (supplement) © 2007, The <strong>United</strong> <strong>Nations</strong> University.
Terminology and framework <strong>for</strong> nutrient intake values<br />
referred to as nutrient intake values (NIVs). The term<br />
nutrient was chosen instead of <strong>dietary</strong> to denote that<br />
these values are <strong>for</strong> the intakes of specific nutrients, not<br />
<strong>food</strong> components, such as cereals, fruits, vegetables, etc.<br />
Also, the term value was selected instead of reference<br />
to reflect the wide range of uses and applications of<br />
these standards. In addition to being a set of standards<br />
<strong>for</strong> assessing the adequacy of intakes of a population,<br />
they also serve as important values <strong>for</strong> setting nutrition<br />
policies that influence agricultural, economic, and<br />
legislative decisions of a country or region. Thus, they<br />
serve as values <strong>for</strong> assessing nutrient status as well as<br />
making policy decisions.<br />
Terminology: expressions and definitions<br />
of nutrient intake values<br />
In recent years, the number of terms used to describe<br />
a set of nutrient intake values has increased from a<br />
single recommended intake to multiple recommendations<br />
spanning a range of nutrient requirements from<br />
inadequate to excessive. This expansion is due, in part,<br />
to the increased uses and applications of nutrient intake<br />
values [1, 2]. Definitions of the various terms used to<br />
describe the nutrient intake values defined by repre-<br />
S17<br />
sentative countries and regions follow; they are also<br />
summarized in table 1.<br />
US and Canadian terminology<br />
DRI (<strong>dietary</strong> reference intake)<br />
This term was developed by a joint US-Canadian Committee<br />
charged with establishing reference values <strong>for</strong><br />
planning and assessing diets of healthy populations<br />
as well as serving as a basis <strong>for</strong> nutrition policies. The<br />
DRIs refer to the complete set of reference intakes,<br />
including the RDA (recommended <strong>dietary</strong> allowance),<br />
AI (adequate intake), UL (tolerable upper intake level),<br />
and EAR (estimated average requirement) [3–7]. DRIs<br />
are expressed as intakes per day but are meant to represent<br />
average intakes of individuals over time. It is<br />
thought that the nutrient intake can vary substantially<br />
from day to day without ill effects [2, 3]. Each DRI<br />
expression (RDA, AI, UL, and EAR) has specific uses<br />
<strong>for</strong> planning and assessing diets or <strong>for</strong> applications to<br />
nutrition policy and education.<br />
RDA (recommended <strong>dietary</strong> allowance)<br />
The RDA is the original term introduced by the US<br />
Food and Nutrition Board of the National Research<br />
Council in the 1940s [8]. It was defined as the level of<br />
TABLE 1. Comparison of the suggested “harmonized” terminology with terms in use at present around the world<br />
Recommendation<br />
Umbrella term <strong>for</strong><br />
the set of recommendations<br />
Average<br />
requirement<br />
Recommended<br />
intake level<br />
Lower reference<br />
intake<br />
Harmonized<br />
terms USA/Canada UK<br />
NIV DRI DRV VNR<br />
ANR EAR EAR AR RN<br />
European<br />
Communities Mexico WHO/FAO<br />
INL X RDA RNI PRI IDR RNI<br />
LRNI LTI<br />
Safe intake AI Lower end<br />
of safe intake<br />
range<br />
Upper level of safe<br />
intake<br />
Appropriate<br />
macronutrient<br />
distribution range<br />
UNL UL Upper end<br />
of safe intake<br />
range<br />
Lower end<br />
of safe intake<br />
range<br />
Upper end<br />
of safe intake<br />
range<br />
AMDR Minimum and<br />
maximum<br />
population<br />
ranges<br />
IDS<br />
LSC UL<br />
Population<br />
mean intake<br />
goals<br />
AI, adequate intake; AMDR, adequate macronutrient distribution range; ANR, average nutrient requirement; AR, average requirement;<br />
DRI, <strong>dietary</strong> reference intake; DRV, <strong>dietary</strong> reference value; EAR, estimated average requirement; IDR, ingestiόn diaria recomendada; IDS,<br />
ingestiόn diaria sugerida; INL X , individual nutrient level, x = percentile chosen; LRNI, lower reference nutrient intake; LSC, límite superior de<br />
consumo; LTI, lowest threshold intake; NIV, nutrient intake value; PRI, population reference intake; RDA, recommended <strong>dietary</strong> allowance;<br />
RN, promedio de los requerimientos nutrimentales; RNI, reference nutrient intake; UL, upper tolerable nutrient intake level; UNL, upper<br />
nutrient level; VNR, valores nutrimentales de referencia
S18<br />
intake of an essential nutrient that, on the basis of scientific<br />
knowledge, is judged by the Food and Nutrition<br />
Board to be adequate to meet the known nutrient needs<br />
of practically all healthy people. The RDA continues to<br />
be used as one of the nutrient intake values included<br />
in the US/Canadian DRIs. The RDA is <strong>based</strong> on a<br />
statistical distribution of individual requirements <strong>for</strong><br />
meeting a chosen criterion of adequacy <strong>for</strong> the target<br />
nutrient, such as calcium, vitamin A, or protein. Based<br />
on the statistical distribution of requirements, the RDA<br />
is set at a level of intake that meets the needs of 97%<br />
to 98% of healthy individuals in a particular age- and<br />
sex-specific group.<br />
EAR (estimated average requirement)<br />
Using the same statistical distributions <strong>for</strong> nutrient<br />
requirements, the EAR is the average or mean daily<br />
nutrient intake that meets the requirement of half the<br />
healthy individuals in a particular age- and sex-specific<br />
group.<br />
AI (adequate intake)<br />
The AI is defined as the observed or experimentally<br />
derived intake by a defined population group that<br />
appears to sustain health [3–7]. An AI is used when<br />
there are insufficient primary data to establish a statistical<br />
distribution of individual requirements and,<br />
there<strong>for</strong>e, an EAR and RDA. The AI is estimated in<br />
a number of different ways. For some nutrients, it is<br />
<strong>based</strong> on the observed mean intakes of groups with an<br />
apparent low prevalence of nutrient inadequacy. For<br />
example, an AI is used to represent the nutrient intake<br />
values <strong>for</strong> infants because they were derived from the<br />
nutrients supplied by human milk. The AI has also<br />
been derived from the results of experimental studies<br />
when data were thought to be inadequate to describe<br />
a statistical distribution of requirements <strong>for</strong> a specific<br />
function or criterion. Examples include calcium, vitamin<br />
D, fluoride, and sodium.<br />
AMDR (adequate macronutrient distribution range)<br />
The AMDR specifies the upper and lower boundaries<br />
<strong>for</strong> percentage of energy from macronutrients (i.e.,<br />
carbohydrate, fat, n-6 and n-3 polyunsaturated fatty<br />
acids, and protein) [6]. These boundaries are generally<br />
<strong>based</strong> on intakes associated with reducing the risk of<br />
chronic disease.<br />
UL (tolerable upper intake level)<br />
The UL is defined as the highest level of daily nutrient<br />
intake likely to pose no risk of adverse health effects <strong>for</strong><br />
nearly all individuals in the group (general population)<br />
[9]. The level is also estimated from a statistical analysis<br />
of the risk assessment associated with a range of high<br />
nutrient intakes. The term tolerable intake was chosen<br />
to avoid implying a possible beneficial effect [9].<br />
British terminology<br />
DRV (<strong>dietary</strong> reference value)<br />
Dietary reference values (DRVs) are nutrient-<strong>based</strong> <strong>dietary</strong><br />
standards recommended by the <strong>United</strong> Kingdom<br />
in 1991 [10, 11]. The DRVs apply to groups of healthy<br />
people and are not appropriate <strong>for</strong> those with disease<br />
or metabolic abnormalities. As <strong>for</strong> US/Canadian DRIs,<br />
the DRVs <strong>for</strong> a nutrient assume that requirements <strong>for</strong><br />
energy and all other nutrients are met when deriving<br />
a specific reference value. The British DRVs provide<br />
three values <strong>for</strong> most nutrients: the lower reference<br />
nutrient intake (LRNI), the estimated average requirement<br />
(EAR), and the reference nutrient intake (RNI).<br />
For some nutrients, a “safe intake” is given, and <strong>for</strong><br />
carbohydrate and fat, individual minimum, maximum,<br />
and population averages are specified [10].<br />
LRNI (lower reference nutrient intake)<br />
Using a statistical distribution of nutrient requirements,<br />
the LRNI is set at 2 standard deviations (SD) below the<br />
mean or average intake (EAR).<br />
EAR (estimated average requirement)<br />
The British EAR is the intake that meets the estimated<br />
nutrient needs of half of the individuals in a group,<br />
assuming a normal, statistical distribution of requirements.<br />
RNI (reference nutrient intake)<br />
This term is set at 2 SD of the requirement above the<br />
EAR and will meet the needs of 97% to 98% of the<br />
population; it is similar to the US/Canadian RDA.<br />
Safe intake<br />
A safe intake is specified <strong>for</strong> a nutrient <strong>for</strong> which there<br />
is insufficient data to determine a statistical distribution<br />
of requirements. The safe intake is judged to be<br />
a level or range of intakes at which there is no risk of<br />
deficiency and below a level where there is a risk of<br />
undesirable effects. The safe intake corresponds conceptually<br />
to the US/Canadian AI.<br />
Individual minimum, maximum, and population averages<br />
These terms are used by the British to specify recommended<br />
intakes of carbohydrate and fat [9, 10].<br />
European Communities terminology<br />
PRI (population reference intake)<br />
J. C. King et al.<br />
This term was introduced by the Commission of the<br />
European Communities in 1993 [12] to refer to an<br />
intake acceptable <strong>for</strong> a defined age- and sex-specific<br />
group. Like the US/Canadian RDA and the British<br />
RNI, it is <strong>based</strong> on a statistical distribution of requirements<br />
<strong>for</strong> a nutrient and is set at 2 SD above the mean<br />
requirement.
Terminology and framework <strong>for</strong> nutrient intake values<br />
LTI (lowest threshold intake)<br />
This European Communities term is similar to the British<br />
LRNI and describes the mean intake minus 2 SD.<br />
Intakes below this level are assumed to be inadequate<br />
<strong>for</strong> nearly all of the individuals in a group.<br />
AR (average requirement)<br />
This term reflects the average requirement, i.e., the estimated<br />
nutrient need of half the individuals in a group;<br />
it is equivalent to the US/Canadian and British EAR.<br />
Acceptable range<br />
A range of safe intake values is given where insufficient<br />
in<strong>for</strong>mation is available. The acceptable range is<br />
similar to the British safe intake, and the lower end of<br />
the range is similar to the US/Canadian AI. The upper<br />
end of the range is conceptually similar to the UL <strong>for</strong><br />
the US/Canada.<br />
Dietary reference intakes <strong>for</strong> Koreans (KDRIs)<br />
Korea released a set of DRIs in 2005 [13]. Four values<br />
were proposed that are very similar to those used by<br />
the US/Canada: an estimated average requirement<br />
(EAR), recommended intake (RI), adequate intake<br />
(AI), and tolerable upper intake level (UL). They also<br />
established an AMDR (acceptable macronutrient distribution<br />
range) <strong>for</strong> the distribution of energy among<br />
the macronutrients.<br />
Southeast Asia RDAs<br />
The region of Southeast Asia, including Cambodia,<br />
Indonesia, Laos, Malaysia, Myanmar, Philippines,<br />
Singapore, Thailand, and Vietnam, released a set of recommended<br />
<strong>dietary</strong> allowances (RDAs) <strong>for</strong> their region<br />
in 2005 [14]. One nutrient intake value, an RDA, was<br />
recommended <strong>for</strong> each nutrient. In view of the limited<br />
studies done in most Southeast Asian countries, the<br />
Recommended Dietary Allowance Committee drew<br />
heavily from FAO/WHO/UNU Expert Panel reports<br />
on nutrient requirements and the US/Canadian reports<br />
on <strong>dietary</strong> reference intakes.<br />
German language societies<br />
The “reference values <strong>for</strong> nutrient intakes” (Referenzwerte<br />
für die Nährstoffzufuhr) have been established<br />
jointly by the Nutrition Societies of Germany, Austria,<br />
and Switzerland and adopted also <strong>for</strong> Slovenia [15].<br />
Provided are average requirements (Durchschnittlicher<br />
Bedarf) <strong>for</strong> energy intake; reference intakes<br />
(Referenzwerte) <strong>for</strong> most essential nutrients (protein,<br />
n-6 fatty acids, and most vitamins, minerals, and trace<br />
elements), <strong>based</strong> on mean intakes plus assumed 2 SD<br />
of population variation, or in the absence of adequate<br />
in<strong>for</strong>mation on standard deviation, <strong>based</strong> on mean<br />
S19<br />
intakes plus 20% to 30%; estimated values (Schätzwerte)<br />
<strong>for</strong> nutrients where human requirements cannot<br />
be calculated with the desired accuracy, such as n-3<br />
fatty acids, vitamin E, vitamin K, β-carotene, biotin,<br />
pantothenic acid, and some trace elements; and orientation<br />
values (Richtwerte) <strong>for</strong> nutrients where <strong>for</strong><br />
health reasons a certain range of intakes is desirable <strong>for</strong><br />
some substances, even though strict borderlines cannot<br />
be drawn. Lower orientation values are provided <strong>for</strong><br />
water, fluoride, and <strong>dietary</strong> fiber and upper orientation<br />
values <strong>for</strong> total fat, cholesterol, alcohol, and salt.<br />
Australia and New Zealand<br />
Australia and New Zealand [16] recently defined a<br />
series of nutrient reference values (NRVs) broadly<br />
following the approach outlined in the US/Canadian<br />
publications on <strong>dietary</strong> reference intakes and applications<br />
in <strong>dietary</strong> assessment [3–7, 17]. thus, the<br />
terms estimated average requirement (EAR), recommended<br />
<strong>dietary</strong> intake (RDI, which is equivalent to<br />
the US/Canadian RDA), adequate intake (AI), and<br />
upper level of intake (UL) are used in the same way<br />
as defined in the US/Canadian report. To address the<br />
issue of chronic disease prevention, two additional<br />
sets of reference values were developed <strong>for</strong> selected<br />
nutrients <strong>for</strong> which sufficient evidence existed. The<br />
acceptable macronutrient distribution range (AMDR)<br />
was made as an estimate of the range of intakes <strong>for</strong> each<br />
macronutrient <strong>for</strong> individuals (expressed as percentage<br />
contribution to energy), which would allow <strong>for</strong> an<br />
adequate intake of all the other nutrients while maximizing<br />
general health outcome. The suggested <strong>dietary</strong><br />
target (SDT) is the daily average intake from <strong>food</strong> and<br />
beverages <strong>for</strong> certain nutrients that may help in the<br />
prevention of chronic disease. These two additional sets<br />
of reference values apply only to adults and adolescents<br />
over 14 years of age.<br />
Mexico<br />
Mexico released a new edition of values <strong>for</strong> reference<br />
nutrients (valores nutrimentales de referencia [VNR])<br />
in 2005 [18]. Four standards were recommended. The<br />
RN50 (promedio de los requerimientos nutrimentales) is<br />
the mean nutritional requirements of a population; this<br />
is equivalent to the estimated average requirement used<br />
by the US/Canadian report. The daily recommended<br />
intake (ingestión diaria recomendada [IDR]) is the value<br />
obtained by adding 2 SD to the mean of the requirements<br />
in order to cover the needs of 97.5% of the<br />
individuals in the population. If the standard deviation<br />
is unknown, the RN50 is multiplied by 1.2, assuming<br />
a coefficient of variation (standard deviation divided<br />
by the mean and multiplied by 100 to give a percentage)<br />
of 10%. The daily suggested intake (ingestión<br />
diaria sugerida [IDS]) is used in place of the IDR
S20<br />
when in<strong>for</strong>mation about requirements is insufficient<br />
to determine an RN; and the upper limit of consumption<br />
(límite superior de consumo [LSC]) establishes the<br />
daily intake that one should not surpass and that has,<br />
there<strong>for</strong>e, a precautionary sense.<br />
WHO and FAO terminology<br />
The World Health Organization/Food and Agriculture<br />
Organization (WHO/FAO), sometimes together with<br />
the <strong>United</strong> <strong>Nations</strong> University (UNU), has published a<br />
number of recommendations (reference values) <strong>for</strong> different<br />
groups of nutrients over time [19–24]. The most<br />
recent report on vitamin and mineral standards, published<br />
in 2004 [23], uses the terms described below.<br />
RNI (recommended nutrient intake)<br />
The RNI is the daily intake that meets the nutrient<br />
requirements of almost all (97.5%) apparently healthy<br />
individuals in an age- and sex-specific population<br />
group. The most recent RNIs (<strong>for</strong> 6 minerals and 11<br />
vitamins) are <strong>based</strong> on nutrient-specific criteria. A<br />
statistical distribution of requirements is derived from<br />
primary data, and the RNI equals the mean requirement<br />
plus 2 SD. It is equivalent, there<strong>for</strong>e, to the US/<br />
Canadian RDA, the British RNI, and the European PRI.<br />
Insufficient data were available to establish an RNI <strong>for</strong><br />
vitamins E and A. An acceptable intake that supports<br />
the known function of vitamin E was determined and<br />
used as the best estimate of requirements. A recommended<br />
safe intake level was specified <strong>for</strong> vitamin<br />
A as the level of intake that prevents clinical signs of<br />
deficiency and allows normal growth, but it does not<br />
protect vitamin A status during prolonged periods of<br />
infection or other stresses.<br />
UL (upper tolerable nutrient intake level)<br />
ULs were defined <strong>for</strong> some nutrients. The definition<br />
is similar to that used <strong>for</strong> the US/Canadian UL: the<br />
maximum intake from <strong>food</strong> that is unlikely to pose<br />
a risk of adverse health effects in almost all (97.5%)<br />
apparently healthy individuals in an age- and sex-specific<br />
population group.<br />
Basal vs. normative requirements<br />
Two earlier publications from the UN agencies distinguished<br />
between basal and normative nutrient requirements<br />
[19, 24]. The basal requirement was defined as<br />
the mean requirement to prevent clinically detectable<br />
signs of impaired function attributable to inadequacy of<br />
the nutrient; the normative requirement was the mean<br />
requirement to maintain a level of tissue storage that is<br />
judged to be desirable.<br />
Population-level requirements<br />
Population-level intake recommendations were established<br />
in the WHO/FAO Trace Element Report in<br />
J. C. King et al.<br />
1996 [24]. Population-level intake recommendations<br />
establish a safe range of intakes <strong>for</strong> a population by<br />
considering both the variability of intakes and the<br />
variability of requirements within a defined group of<br />
similar individuals, e.g., girls between 7 and 9 years of<br />
age. The upper limit of safe ranges of population mean<br />
intakes was set so that only 2% to 3% of individuals<br />
would have intakes above the average threshold of<br />
toxicity <strong>for</strong> a nutrient, whereas the lower limit of safe<br />
ranges of population mean intakes was set so that only<br />
2% to 3% of individuals would have usual intakes below<br />
the average requirement. More recent WHO/FAO<br />
reports do not specify population intake ranges. This is<br />
because these standards require knowledge of the variance<br />
of intakes, which usually differs markedly across<br />
populations, even within a country. Furthermore, the<br />
magnitude of these variances is often not known.<br />
WHO recently set population goals <strong>for</strong> macronutrient<br />
intakes as a percentage of energy intakes [22].<br />
Although the values are similar to those specified by<br />
US/Canadian adequate macronutrient distribution<br />
ranges (AMDRs), they are interpreted differently<br />
[22]. The US/Canadian standards refer to adequate<br />
ranges <strong>for</strong> usual intakes of individuals, whereas the<br />
WHO standards refer to mean intake goals <strong>for</strong> populations<br />
or large groups. For example, the WHO mean<br />
intake goal <strong>for</strong> total fat intake is 15% to 30% of energy,<br />
whereas the US/Canadian AMDR <strong>for</strong> adults is 20% to<br />
35% of energy intake. The AMDR recommends that<br />
most individuals should have fat intakes above 20% of<br />
energy; an acceptable mean intake, there<strong>for</strong>e, would<br />
be substantially above 20% of energy from fat. The<br />
WHO standard states that a healthy population could<br />
have a mean fat intake as low as 15% of energy intake,<br />
implying that it is acceptable <strong>for</strong> half of the population<br />
to have intakes below 15% of energy from fat.<br />
Summary of current terminology of <strong>dietary</strong><br />
standards<br />
All countries or regions establish recommended nutrient<br />
intake values using a statistical distribution of<br />
individual nutrient requirements derived from primary<br />
research data. Using those data, most establish an<br />
estimated average requirement and a recommended<br />
nutrient intake value that is usually set at 2 SD above<br />
the average requirement. Although defined summarily,<br />
these two values are given several different names<br />
(table 1). The average requirement is referred to as<br />
the estimated average requirement (EAR) or average<br />
reference intake (ARI). The recommended intake level<br />
is called the recommended <strong>dietary</strong> allowance (RDA),<br />
reference nutrient intake (RNI), population reference<br />
intake (PRI), or recommended nutrient intake (RNI).<br />
The terminology used <strong>for</strong> the recommended intake<br />
value is confusing, since the letter R is used to refer to
Terminology and framework <strong>for</strong> nutrient intake values<br />
both “recommended” and “reference.”<br />
In addition to an average and recommended (or<br />
reference) nutrient intake value, recommendations<br />
include a lower reference intake that defines a value<br />
that is below the requirements of most individuals in<br />
the population, an upper intake value that is the highest<br />
intake unlikely to pose any health risks, a safe intake<br />
value (or range) or adequate intake that is used when<br />
the statistical distribution of requirements is unknown,<br />
and a range of intakes <strong>for</strong> macronutrients (adequate<br />
macronutrient distribution range [AMDR]) associated<br />
with a reduced risk of chronic disease.<br />
Proposed terminology <strong>for</strong> nutrient intake<br />
values (NIVs)<br />
To avoid confusion about the meaning of acronyms<br />
and the use of multiple acronyms <strong>for</strong> the same nutrient<br />
intake standard, we propose that a common set<br />
of terms and definitions be used by all countries and<br />
regions establishing NIVs. We recognize, however,<br />
that the absolute values will probably differ among<br />
the various countries and regions, because differences<br />
in body size, the bioavailability of <strong>food</strong> sources, and<br />
environmental conditions that affect nutrient needs<br />
(e.g., sunshine exposure or altitude) will influence the<br />
statistical distribution of nutrient requirements in a<br />
particular population. Nevertheless, we believe that the<br />
same terms and definitions can be used worldwide. The<br />
following terms are recommended.<br />
Average nutrient requirement (ANR)<br />
The ANR is the average or median requirement estimated<br />
from a statistical distribution of requirements<br />
<strong>for</strong> a specific criterion and <strong>for</strong> a particular age- and<br />
sex-specific group.<br />
Individual nutrient level x (INL x )<br />
The INL x is the recommended nutrient level <strong>for</strong> all<br />
healthy individuals in a specific subpopulation. Often<br />
committees add 2 SD to ANR, which will cover the<br />
needs of most (i.e., 98%) of the population, assuming<br />
that the distribution is symmetrical. In that case, the<br />
INL x would be INL 98 . But one might choose a lower<br />
level in the distribution of requirements <strong>for</strong> the recommended<br />
intake if the current nutrient policies of the<br />
country or region conclude that it is not practical to<br />
achieve an intake equal to the 98th percentile <strong>for</strong> the<br />
entire population. This might be the case, <strong>for</strong> example,<br />
if the additional cost of providing fish rich in omega-3<br />
fatty acids is inconsistent with the <strong>food</strong> supply <strong>for</strong> a<br />
country. Then one might choose to make a recommendation<br />
at a lower level, such as 1.5 SD above the<br />
ANR, or at the 93rd percentile. In that case, the INL 93<br />
S21<br />
would meet the needs of 93% of the population. Thus,<br />
the INL x <strong>for</strong> a specific country or region should be<br />
consistent with the overall nutrition policy.<br />
Upper nutrient level (UNL)<br />
The UNL is the highest level of daily nutrient intake<br />
that is likely to pose no risk of adverse health effects<br />
<strong>for</strong> almost all individuals in a specified life-stage group.<br />
Ideally, it is <strong>based</strong> on an analysis of the statistical distribution<br />
of risk <strong>for</strong> high nutrient intakes. The UNL is<br />
usually set at a level where the risk of excessive intakes<br />
is close to zero. Also, the UNL is a level of intake that<br />
should be avoided on a chronic basis [9].<br />
General framework <strong>for</strong> estimating nutrient<br />
intake values (NIVs)<br />
Starting with the report by the <strong>United</strong> Kingdom recommending<br />
a multiple reference framework <strong>for</strong> quantitative<br />
nutrient standards [10] and the subsequent reports<br />
of the US/Canadian <strong>dietary</strong> reference intakes (DRIs)<br />
[3–7], a new statistical approach was used <strong>for</strong> making<br />
<strong>dietary</strong> recommendations. The general features of this<br />
model were adopted by a number of other countries or<br />
regions, such as the Germanic language nutrition societies<br />
[15], South Korea [13], Southeast Asia [14], and<br />
Australia and New Zealand [16], as well as WHO/FAO<br />
[23]. The framework <strong>for</strong> assessing intakes of population<br />
groups stems from the work of a subcommittee of<br />
the US Food and Nutrition Board [25] that related the<br />
probability of inadequacy to nutrient requirements.<br />
The framework has since been expanded to include<br />
both assessment and planning of nutrient intakes and<br />
can now be applied to both individuals and groups<br />
[17, 26].<br />
Determining the average nutrient requirement<br />
The first step in estimating nutrient requirements is<br />
to determine the average nutrient requirement (ANR)<br />
<strong>for</strong> a defined population from primary research data<br />
(fig. 1). Once the distribution of requirements is<br />
known, the ANR can be estimated. Often the ANR<br />
<strong>for</strong> a population is estimated from experimental data<br />
derived from a subsample of individuals in the defined<br />
group, because in practice, rarely, if ever, are the specific<br />
nutrient requirements known <strong>for</strong> each person in<br />
a group of interest. However, it is usually not possible<br />
to mirror completely the diversity of the group. For<br />
most nutrients, data on individual responses to varying<br />
levels of nutrient intake are scant, resulting in the<br />
need to make many assumptions about the attributes of<br />
the population group from data obtained from a small<br />
subsample that has been studied in depth. With each<br />
assumption, there is potential error and a decrease in
S22<br />
����������� � �� �������� ��������<br />
���������� ������<br />
FIG. 1. Frequency distribution of individual requirements<br />
the level of confidence or reliability in the resulting<br />
reference standard. This is perhaps one of the main<br />
reasons why previous nutrient reference values were<br />
frequently developed by determining the minimum<br />
amount of a nutrient needed by all who were evaluated<br />
or sampled, and then adding a safety factor to create<br />
an “allowance” that should meet everyone’s need [27].<br />
However, if an allowance or reference standard is<br />
derived from the addition of safety factors, its use is<br />
limited to being a goal <strong>for</strong> an individual. It cannot be<br />
used to predict the adequacy of the diet <strong>for</strong> a group or<br />
to plan what a group’s intake should be. The statistical<br />
approach described here permits the application of the<br />
nutrient intake value <strong>for</strong> <strong>dietary</strong> assessment and planning<br />
[1, 2, 17, 26].<br />
The estimated requirements will obviously vary<br />
with the criterion chosen. For example, an ANR that<br />
prevents the clinical symptoms of a nutrient deficiency<br />
will be much lower than one that sustains nutrient<br />
stores or reserves. The process of selecting a specific<br />
criterion is one of the more difficult tasks <strong>for</strong> a committee<br />
charged with establishing NIVs since the criterion<br />
chosen can lead to high standards and, there<strong>for</strong>e,<br />
a higher prevalence of inadequate intakes, or vice<br />
versa. Different methods <strong>for</strong> deriving human nutrient<br />
requirements and a description of the criterion are<br />
given by Yates [28].<br />
There are two sources of variation that affect nutrient<br />
requirements: the level of intake within the individual<br />
and variation among the individuals studied. Within<br />
an individual, nutrient needs at the cellular level vary<br />
depending on environmental differences, immune<br />
status, energy expenditure level, and type of activity;<br />
thus, one day is not necessarily like the next in the<br />
actual demand <strong>for</strong> and use of a nutrient. This difference<br />
in day-to-day need must be considered when estimating<br />
an ANR. There<strong>for</strong>e, the condition under which the<br />
population is studied is important. If the ANR obtained<br />
is not close to the actual median requirement, then the<br />
estimate of the percentage of individuals within a group<br />
that have inadequate diets will be less precise, and one<br />
could over- or underestimate the level of inadequacy<br />
in the population.<br />
Often committees charged with establishing <strong>dietary</strong><br />
standards do not have in<strong>for</strong>mation on the average<br />
nutrient requirements <strong>for</strong> all possible different populations.<br />
This is especially true <strong>for</strong> infants, children, pregnant<br />
and lactating women, and older individuals. When<br />
experimental data are missing, nutrient requirements<br />
and their variability are generally extrapolated and<br />
interpolated among and between age- and sex-specific<br />
groups and physiological states from other population<br />
data [29].<br />
Estimating variation in requirements<br />
J. C. King et al.<br />
The second step in estimating nutrient requirements<br />
using the statistical framework is to estimate the<br />
variation in requirements. A normal distribution of<br />
requirements is an underlying assumption of the theoretical<br />
model. This is not always the case, however. It<br />
is known, <strong>for</strong> example, that menstrual iron losses are<br />
not normally distributed in women. If the data are not<br />
normally distributed, they can be trans<strong>for</strong>med to normality,<br />
an ANR and INL x can be calculated, and then<br />
these numbers can be trans<strong>for</strong>med back into the original<br />
units [5]. If normality cannot be assumed <strong>for</strong> all<br />
components of a requirement (e.g., intestinal, urinary,<br />
and integumental losses), then a Monte Carlo simulation<br />
may be used to sum up all of the components.<br />
This approach involves simulating a large population<br />
of individuals (e.g., 100,000), each with his or her own<br />
requirement <strong>for</strong> a particular nutrient. To accomplish<br />
this, the component parts of nutrient needs (i.e., the<br />
factorial losses) are treated as coming from independent<br />
random distributions. The total requirement is<br />
then calculated <strong>for</strong> each individual, and the 50th and<br />
individual nutrient level percentiles (e.g., the 98th<br />
percentile) are calculated directly.<br />
Although the estimated mean or median of requirements<br />
(the ANR) that is obtained from a small sample<br />
of individuals in the group may be close to the actual<br />
mean of that group, the variation in requirement<br />
among individuals in the sample may not be nearly as<br />
close to the true variation in the population without<br />
a significant increase in the number of observations<br />
(individuals sampled). Nutrient needs vary between<br />
individuals: individuals of the same body size per<strong>for</strong>ming<br />
the same types of activity <strong>for</strong> similar periods may<br />
utilize and need different amounts of a nutrient, <strong>based</strong><br />
on their rate of metabolism, organ function, and a host<br />
of other aspects that affect requirements (fig. 2). This<br />
is one of the reasons that in studies in which nutrient<br />
requirements are evaluated at various levels of intake,<br />
the subjects usually serve as their own controls, dampening<br />
some of the effects of individual responses.<br />
The disparity between the true variation in requirements<br />
in a population and what is measured or estimated<br />
among individuals in a sample can be due to<br />
lack of randomness in selecting the sample (i.e., a
Terminology and framework <strong>for</strong> nutrient intake values<br />
Frequency distribution of individual<br />
requirements of nutrient X in women<br />
30–50 years old<br />
3 A 6 B 9 10<br />
ANR: <strong>based</strong> on selected indicator<br />
or criterion of adequacy<br />
Increasing intake of nutrient X<br />
INL 98<br />
FIG. 2. In this symmetrical distribution of the requirements<br />
<strong>for</strong> a subgroup of the population (assume that it is <strong>for</strong> apparently<br />
healthy, nonpregnant, nonlactating women aged 30<br />
through 50 years, woman A requires approximately 3.5 U of<br />
nutrient X (this is the lowest level of intake <strong>for</strong> her at which<br />
the criterion of adequacy chosen is normal or functions normally);<br />
other women require less, the same, or more. Woman<br />
B requires more, about 7 U of nutrient X, to demonstrate the<br />
same level of normal function of the criterion of adequacy<br />
selected. The ANR is the average nutrient requirement (in<br />
this example, ANR = 6 U) <strong>for</strong> this group of women; the ANR<br />
is specific <strong>for</strong> the nutrient, the group to which it applies, and<br />
the criterion chosen <strong>for</strong> adequacy. Note that the INL x is set<br />
at 2 SD (SD ANR ) above the ANR, and in this case, if SD ANR =<br />
2 U, INL 98 = 10 U. (ANR, average nutrient requirement; INL,<br />
individual nutrient level)<br />
convenience sample), or to environmental factors<br />
that affect nutrient needs and may differ from those<br />
in place during the evaluation of the nutrient requirements<br />
in the individuals sampled, as well as a host of<br />
other causes.<br />
Often the usual nutrient requirements of all individuals<br />
in a population are not known, so data on the<br />
specific variation in requirements are not available. In<br />
that case, a standard estimate of variance is used. If one<br />
assumes that the distribution of requirements is symmetrical,<br />
a coefficient of variation (CV) (the standard<br />
deviation divided by the mean × 100) can be used to<br />
estimate the variation. It is often assumed that nutrient<br />
requirements have a symmetrical distribution and a<br />
similar CV that is equal to about 10% (i.e., the standard<br />
deviation is about 10% of the mean requirement) [8].<br />
This assumption is <strong>based</strong> on extensive data on the variation<br />
in basal metabolic rate [6]; a similar CV of 12.5%<br />
was derived from data on the protein requirements of<br />
adults [30].<br />
Given the routinely small sample sizes from which<br />
ANRs are determined, a default estimate of the variation<br />
<strong>for</strong> nutrients is often adopted <strong>for</strong> use when there<br />
is little in<strong>for</strong>mation from which to obtain a reliable<br />
estimate of the variance or standard deviation of the<br />
S23<br />
ANR. The default CV frequently used is 10% (CV ANR<br />
= SD ANR /ANR). For many nutrients, there are enough<br />
data from dose–response curves to determine an ANR,<br />
but in many cases the observed variation in response<br />
due to the small number of subjects <strong>for</strong> which the<br />
requirements were derived was thought to include<br />
errors sizable enough to prevent the observed variation<br />
from being used as an estimate. Instead, the default CV,<br />
i.e., 10%, is used.<br />
For a few nutrients included in the US/Canadian<br />
<strong>dietary</strong> reference intakes, CVs larger than 10% were<br />
applied. In the cases of copper, molybdenum, and<br />
niacin, 15% was used on the basis of the variability in<br />
response observed in the studies used to determine the<br />
ANR [4, 5]; <strong>for</strong> vitamin A, 20% was used on the basis of<br />
the variability in the apparent half-life of vitamin A in<br />
liver stores. For iodine, 20% was applied on the basis of<br />
iodine turnover studies [5], and <strong>for</strong> carbohydrate, 15%<br />
was used on the basis of observed variability in brain<br />
glucose utilization [6].<br />
Other nutrient intake values derived from<br />
an ANR<br />
After the ANR and variance in requirements have<br />
been determined, an individual nutrient level x (INL x )<br />
may be derived from the ANR and its distribution.<br />
The subscript x refers to the percentile chosen <strong>for</strong> the<br />
setting the INL. Often committees add 2 SD to the<br />
observed ANR which will cover the needs of most (i.e.,<br />
98%) individuals if the distribution of requirements is<br />
symmetrical, and it can thus be used as the target <strong>for</strong><br />
an individual’s nutrient intake. This is the approach<br />
used in the <strong>United</strong> Kingdom and the US/Canadian<br />
reports, where this model <strong>for</strong> estimating multiple<br />
nutrient references was first applied. In those cases,<br />
the INL x would be an INL 98 ; those values are referred<br />
to as the reference nutrient intake (RNI) and the recommended<br />
<strong>dietary</strong> allowance (RDA) in the UK and<br />
USA/Canadian reports, respectively [3–7, 10]: INL 98<br />
= ANR + 2 SD ANR .<br />
Individuals whose intake is equal to the INL 98 have<br />
a 98% probability that their intake meets their needs.<br />
One might also choose to have a recommended intake<br />
at a lower level, such as 1.5 SD above the ANR, resulting<br />
in a lower target intake <strong>for</strong> individuals, and a lower<br />
probability of adequacy <strong>for</strong> individuals who achieve<br />
this target (in this case, ANR + 1.5 SD ANR = 93%, rather<br />
than 98%). One could also set the INL x at 2.5 SD above<br />
the ANR, increasing the probability of adequacy to 99%<br />
<strong>for</strong> individuals whose intakes are at the INL.<br />
Since the INL x represents a nutrient goal <strong>for</strong> all<br />
individuals in a specific country or region, committees<br />
charged with establishing nutrient recommendations<br />
<strong>for</strong> a country or region should choose the specific<br />
multiple of the SD ANR they wish to use that is consistent
S24<br />
with the overall nutrient policy.<br />
As an estimate of the between-individual variation,<br />
the standard deviation of the ANR (SD ANR ) is<br />
important in developing an INL. If the variation in<br />
requirements is small, then an INL that is set at 1.5, 2,<br />
or 2.5 SD ANR above the ANR will be relatively close to<br />
the ANR; if the variation is broader, then the INL will<br />
be larger. This demonstrates that the distribution of<br />
requirements is an important determinant of the INL.<br />
Two other NIVs, in addition to the INL x , may also be<br />
derived. A ”deficient” or lower nutrient intake level may<br />
be established at some point below the ANR (e.g., 2 SD<br />
below) to serve as an estimated intake that is probably<br />
below the needs of practically all individuals. Since the<br />
ANR is usually used to estimate the proportion of the<br />
population with inadequate intakes by determining<br />
the percentage below the ANR [2, 17], a lower nutrient<br />
intake level has limited use.<br />
If in<strong>for</strong>mation is available on the level of intake of<br />
a specific nutrient that carries health risks, an upper<br />
nutrient intake level (UNL) may also be established.<br />
The UNL is usually set where the risk of excessive<br />
intakes is very low, close to zero. The UNL is a level of<br />
intake that should be avoided on a chronic basis [9].<br />
There is no established benefit to consuming nutrient<br />
intakes above the INL set at 2 or 2.5 SD ANR .<br />
Estimating energy requirements<br />
Energy recommendations are set at levels that represent<br />
the average needs of individuals in the population. In<br />
determining energy standards, factors such as age, sex,<br />
and level of physical activity should be considered.<br />
Energy standards may be expressed as equations that<br />
permit the calculation of energy intake requirements<br />
<strong>based</strong> on these factors.<br />
It would not be appropriate to set an energy INL x as<br />
was done <strong>for</strong> the other nutrients, because adding an<br />
increment (e.g., 2 SD) to the average energy requirement<br />
would result in an intake goal that would lead to<br />
weight gain. If the energy intake is consistently above<br />
or below the average requirement <strong>for</strong> a long enough<br />
period of time, changes in body weight will occur<br />
and may adversely affect health. As a consequence,<br />
recommendations <strong>for</strong> energy are expressed in terms<br />
of energy expenditure rather than energy intake in<br />
order to prevent under- or overconsumption. Since<br />
nutrient standards are set <strong>for</strong> healthy individuals, it is<br />
assumed that body energy stores are appropriate and<br />
that the average requirement should be used as the<br />
standard <strong>for</strong> the entire population. Because energy<br />
intake and expenditure are not independent, it is not<br />
possible to determine the probability that energy intake<br />
is adequate.<br />
Acceptable macronutrient distribution<br />
ranges<br />
J. C. King et al.<br />
Recently, several countries or regions have established<br />
acceptable ranges <strong>for</strong> the percentage of energy coming<br />
from carbohydrate, protein, and fat in the diet, which<br />
are thought to reduce the risk of long-term or chronic<br />
disease while providing an adequate intake of essential<br />
nutrients. The term used to describe these recommendations<br />
is acceptable macronutrient distribution range<br />
(AMDR). The AMDR is expressed as a percentage of<br />
total energy intake, because the range is not independent<br />
of other fuel sources or of the energy requirement<br />
of the individual. As mentioned earlier, definitions used<br />
<strong>for</strong> macronutrient intakes as a percentage of energy<br />
vary. The AMDRs established by the <strong>United</strong> States and<br />
Canada refer to appropriate ranges of usual intakes of<br />
individuals, whereas the WHO standards are population<br />
mean intake goals [6, 22]. Thus, the WHO mean<br />
intake goal of 15% to 30% of the energy as fat implies<br />
that it is acceptable <strong>for</strong> half of the individuals in a<br />
population to have intakes below 15%.<br />
Although a range of protein intakes as a percentage<br />
of energy has been established, since protein is one of<br />
the fuel sources of the diet, there is also a specific minimum<br />
need <strong>for</strong> nitrogen and amino acids that serves as<br />
the basis <strong>for</strong> the protein ANR and INLx. Those values<br />
are usually presented as grams or milligrams per day.<br />
Since the need <strong>for</strong> nitrogen or amino acids is likely<br />
to be independent of intake, the theoretical statistical<br />
model can be used to estimate the probability of<br />
inadequacy <strong>for</strong> an individual and the prevalence of<br />
inadequate intakes in a population. When protein NIVs<br />
are derived, the committees need to ensure that those<br />
NIVs can be acquired within the range of acceptable<br />
protein intakes.<br />
General features of the statistical model <strong>for</strong><br />
estimating nutrient requirements<br />
There are two important caveats associated with this<br />
model <strong>for</strong> estimating nutrient intake values [31].<br />
First, the estimates of requirements pertain to the<br />
maintenance of health in already healthy individuals.<br />
Such estimates may or may not pertain to individuals<br />
with disease, and they certainly are inappropriate<br />
<strong>for</strong> individuals recovering from nutrient deficiencies.<br />
Second, nutrient intake refers to the usual intake of an<br />
individual or group, i.e., the average intake <strong>for</strong> weeks<br />
or months, not days.<br />
The primary advantage of this general framework<br />
is its simplicity. Only the midpoint of the requirement<br />
distribution (the ANR) needs to be determined from<br />
primary scientific data. Ideally, one would also like<br />
in<strong>for</strong>mation regarding the variance in the requirement<br />
in a large, representative population. However,
Terminology and framework <strong>for</strong> nutrient intake values<br />
assuming a coefficient of variation <strong>for</strong> the SD ANR seems<br />
reasonable. Using coefficients of variation ranging from<br />
10% to 20% <strong>for</strong> the various nutrients is consistent with<br />
the variance measured <strong>for</strong> a number of biological variables<br />
[30].<br />
Finally, the underlying biology defining nutrient<br />
requirements is likely to be similar across diverse populations.<br />
For example, the biological need <strong>for</strong> absorbed<br />
zinc in toddlers to support normal growth is probably<br />
similar among diverse populations around the world.<br />
However, the amount they need to consume from<br />
their <strong>food</strong> supply probably differs because of the difference<br />
in the bioavailability of zinc from various <strong>food</strong><br />
sources, e.g., cereals versus animal flesh. A description<br />
of when and how to make adjustments in the ANR <strong>for</strong><br />
inefficient use of the nutrient as consumed due to poor<br />
absorption or inefficient conversion of a precursor<br />
to active <strong>for</strong>ms is given by Gibson in this issue [32].<br />
Since the biological need <strong>for</strong> absorbed or active <strong>for</strong>ms<br />
of nutrients to maintain a specific function probably is<br />
similar among diverse populations worldwide, countries<br />
should be able to use primary scientific data on<br />
nutrient requirements <strong>for</strong> populations living in other<br />
countries or regions, as long as they adjust <strong>for</strong> specific<br />
environmental influences in their country, e.g., nutrient<br />
bioavailability, the prevalence of infectious diseases,<br />
exposure to sunlight, and altitude.<br />
References<br />
1. Vorster HH, Murphy SP, Allen LH, King JC. Application<br />
of nutrient intake values (NIVs). Food Nutr Bull<br />
2007;28(suppl):S116–22.<br />
2. Murphy SP, Vorster HH. Methods <strong>for</strong> using nutrient<br />
intake values (NIVs) to assess or plan nutrient intakes.<br />
Food Nutr Bull 2007;28(suppl):S51–60.<br />
3. Institute of Medicine. Dietary reference intakes <strong>for</strong> calcium,<br />
phosphorus, magnesium, vitamin D, and fluoride.<br />
Washington, DC: National Academy Press, 1997.<br />
4. Institute of Medicine. Dietary reference intakes <strong>for</strong><br />
thiamin, riboflavin, niacin, vitamin B 6 , folate, vitamin<br />
B 12 , pantothenic acid, biotin, and choline. Washington,<br />
DC: National Academy Press, 1998.<br />
5. Institute of Medicine Panel on Micronutrients. Dietary<br />
reference intakes: Vitamin A, vitamin K, arsenic, boron,<br />
chromium, copper, iodine, iron, manganese, molybdenum,<br />
nickel, silicon, vanadium, and zinc. Washington,<br />
DC: National Academy Press, 2002.<br />
6. Institute of Medicine. Dietary reference intakes <strong>for</strong><br />
energy, carbohydrate, fiber, fat, fatty acids, cholesterol,<br />
protein, and amino acids. Part I. Washington, DC:<br />
National Academy Press, 2002.<br />
7. Institute of Medicine. Dietary reference intakes: Water,<br />
potassium, sodium, chloride, and sulfate. Washington,<br />
DC: National Academies Press, 2004.<br />
8. Institute of Medicine, Food and Nutrition Board, RDA<br />
Subcommittee on the tenth edition of the recommended<br />
Conclusions<br />
S25<br />
A general statistical model <strong>for</strong> estimating nutrient<br />
intake values that permits assessments of the adequacy<br />
of nutrient intakes of populations is recommended.<br />
The model is <strong>based</strong> on estimating the average nutrient<br />
requirement (ANR) from data on nutrient requirements<br />
<strong>for</strong> a specific function in a well-defined population,<br />
determining or assuming a variance in requirements<br />
<strong>for</strong> the general population in an age- and sex-specific<br />
group, and calculating an individual nutrient level<br />
INL x that meets the needs of a defined percentage of<br />
the population. Most countries and regions use the<br />
mean or average energy expenditure levels of a defined<br />
population <strong>for</strong> the energy intake standard, because a<br />
higher standard would result in weight gain. It is not<br />
possible to assess the probability of energy adequacy,<br />
because an individual’s energy requirement is related<br />
to intake. In addition, many countries and regions are<br />
establishing acceptable macronutrient distribution<br />
ranges (AMDRs) to define the distribution of <strong>dietary</strong><br />
fuel sources (carbohydrate, protein, and fat) as a percentage<br />
of total energy.<br />
<strong>dietary</strong> allowances. 10th ed. Washington, DC: National<br />
Academy Press, 1989.<br />
9. Institute of Medicine. Dietary reference intakes: a risk<br />
assessment model <strong>for</strong> establishing upper intake levels<br />
<strong>for</strong> nutrients. Washington, DC: National Academy Press,<br />
1998.<br />
10. Department of Health. Report on health and social<br />
subjects 41. Dietary reference values <strong>for</strong> <strong>food</strong> energy<br />
and nutrients <strong>for</strong> the <strong>United</strong> Kingdom. London: Her<br />
Majesty’s Stationery Office, 1991.<br />
11. Department of Health. Report on health and social<br />
subjects 49. Nutrition and bone health: with particular<br />
reference to calcium and vitamin D. London: The Stationery<br />
Office, 1998.<br />
12. Commission of the European Communities. Reports of<br />
the Scientific Committee <strong>for</strong> Food. Nutrient and energy<br />
intakes <strong>for</strong> the European Community. Luxembourg:<br />
Director General, Industry, 1993.<br />
13. Korean Nutrition Society. Dietary reference intakes <strong>for</strong><br />
Koreans. Seoul: Korean Nutrition Society, 2005.<br />
14. International Life Sciences Institute. Recommended<br />
<strong>dietary</strong> allowances: harmonization in Southeast Asia.<br />
Singapore: International Life Sciences Institute, 2005.<br />
15. Wolfram G. New reference values <strong>for</strong> nutrient intake in<br />
Germany, Austria and Switzerland (DACH-Reference<br />
Values). Forum Nutr 2003;56:95–7.<br />
16. Department of Health and Ageing, National Health and<br />
Medical Research Council, Canberra, Australia, and
S26<br />
New Zealand Ministry of Health, Wellington, New Zealand.<br />
Nutrient reference values <strong>for</strong> Australia and New<br />
Zealand—Executive summary. Canberra, Australia:<br />
National Health and Medical Research Council, 2006.<br />
17. Institute of Medicine. Dietary reference intakes: applications<br />
in <strong>dietary</strong> assessment. Washington, DC: National<br />
Academy Press, 2000.<br />
18. Bourges HR, Casanueva E, Rosado JL. Recomendaciones<br />
de ingestion de nutrimentos para la poblacion Mexicana.<br />
Mexico: Editorial Medica Panamericana: Instituto<br />
Danone, 2005.<br />
19. Food and Agriculture Organization/World Health<br />
Organization. Requirements <strong>for</strong> vitamin A, iron, folate<br />
and vitamin B 12 . Report of a joint FAO/WHO Expert<br />
Consultation. Rome: FAO, 1988.<br />
20. Food and Agriculture Organization/World Health<br />
Organization/<strong>United</strong> <strong>Nations</strong> University. Energy and<br />
protein requirements. Report of a joint FAO/WHO/<br />
UNU Expert Consultation. World Health Organ Tech<br />
Rep Ser 1985;724:1–206.<br />
21. World Health Organization. Handbook on human nutritional<br />
requirements. Geneva: World Health Organization,<br />
1974.<br />
22. World Health Organization. Diet, nutrition and the<br />
prevention of chronic diseases. Geneva: World Health<br />
Organization, 2003.<br />
23. World Health Organization/Food and Agriculture<br />
Organization. Human vitamin and mineral requirements.<br />
Rome: FAO, 2004.<br />
J. C. King et al.<br />
24. World Health Organization. Trace elements in human<br />
nutrition and health. Geneva: World Health Organization,<br />
1996.<br />
25. National Research Council. Nutrient adequacy. Assessment<br />
using <strong>food</strong> consumption surveys. Washington,<br />
DC: National Academy Press, 1986.<br />
26. Institute of Medicine. Dietary reference intakes. Applications<br />
in <strong>dietary</strong> planning. Washington, DC: National<br />
Academies Press, 2003.<br />
27. Beaton GH. Recommended <strong>dietary</strong> intake: Individuals<br />
and populations, 9th ed. Baltimore, Md, USA: Williams<br />
& Wilkins, 1999.<br />
28. Yates AA. Using criteria to establish nutrient intake<br />
values (NIVs). Food Nutr Bull 2007;28(suppl):S38–50.<br />
29. Atkinson SA, Koletzko B. Determining life-stage groups<br />
and extrapolating nutrient intake values (NIVs). Food<br />
Nutr Bull 2007;28(suppl):S61–76.<br />
30. Young VR, Scrimshaw NS. Genetic and biological variability<br />
in human nutrient requirements. Am J Clin Nutr<br />
1979;32:486–500.<br />
31. Beaton GH. Criteria of an adequate diet. In:Shils ME,<br />
Olson JA, Shike M, eds. Modern nutrition in health<br />
and disease. Philadelphia, Pa, USA: Lea & Febiger,<br />
1994:1491–505.<br />
32. Gibson RS. The role of diet- and host-related factors<br />
in nutrient bioavailability and thus in nutrient<strong>based</strong><br />
<strong>dietary</strong> requirement estimates. Food Nutr Bull<br />
2007;28(suppl):S77–100.
Nutrient risk assessment: Setting upper levels and an<br />
opportunity <strong>for</strong> harmonization<br />
Peter J. Aggett<br />
Abstract<br />
Upper levels are estimates of the quantity of a nutrient<br />
that can be ingested daily over a lifetime without appreciable<br />
risk to health. The approach to establishing upper<br />
levels <strong>for</strong> nutrients, nutrient risk assessment, has derived<br />
from the risk assessment of <strong>for</strong>eign chemicals that are<br />
deliberately added to <strong>food</strong>s, or are in <strong>food</strong> as contaminants.<br />
This process of risk assessment is rigorous and<br />
transparent, particularly in dealing with the uncertainty<br />
arising from the data available and their assessment and<br />
extrapolation to human populations. Hazard identification<br />
and characterization, i.e., a dose–response pattern,<br />
as applied to xenobiotics, are discussed first, and then<br />
the difficulties of applying this approach to nutrients are<br />
reviewed. Nutrients, in contrast to <strong>for</strong>eign chemicals,<br />
have specific and selective metabolic pathways and homeostasis,<br />
as well as specific functions. This is the source<br />
of differences in the nutrient risk assessments produced<br />
by various national and international advisory bodies.<br />
Although the same data are used in such exercises, different<br />
judgments are made about identifying adverse<br />
effects, the nature of uncertainties in the assessment, and<br />
in matching the upper levels with exposure assessments<br />
and <strong>dietary</strong> reference values. The establishment of different<br />
upper levels <strong>for</strong> different national and international<br />
communities is a source of confusion in public health<br />
policy and practice and a barrier to trade. It is proposed<br />
that a basis <strong>for</strong> harmonizing the existing approaches<br />
used in nutrient risk assessment would be the collaborative<br />
development of the model <strong>for</strong> establishing upper<br />
levels of intake <strong>for</strong> nutrients and related substances that<br />
has been recently described by a Joint Task Force of the<br />
World Health Organization and the Food and Agriculture<br />
Organization.<br />
The author is affiliated with the Lancashire School of<br />
Health and Postgraduate Medicine, University of Central<br />
Lancashire, Preston, UK.<br />
Please direct queries to the author: Peter Aggett, Lancashire<br />
School of Health and Postgraduate Medicine, University of<br />
Central Lancashire, Preston, PR1 2HE UK; e-mail: pjaggett@<br />
uclan.ac.uk.<br />
Key words: Nutrient risk assessment, upper levels,<br />
adverse health effects<br />
Introduction<br />
This contribution addresses the assessment of the risk<br />
or safety of high intakes or exposure to nutrients and<br />
related substances. I will call this nutritional risk assessment,<br />
although, of course, risk and safety assessment,<br />
and, perhaps, the approaches described in this paper,<br />
could be as readily applied to setting safe lower levels<br />
of intake.<br />
For this overview, an upper level of intake (UL) is<br />
“the maximum level of habitual intake from all sources<br />
of a nutrient or related substance judged to be unlikely<br />
to lead to adverse health effects in humans”[1]. This<br />
definition, in turn, requires at least two more definitions,<br />
setting aside that of defining a nutrient or related<br />
substance.<br />
First, an habitual intake is “the long-term average<br />
daily intake of the nutrient or substance”; second, an<br />
adverse health effect is “a change in morphology, physiology,<br />
growth, development, reproduction or lifespan<br />
of an organism, system, or (sub) population that results<br />
in an impairment of functional capacity, an impairment<br />
of capacity to compensate <strong>for</strong> additional stress, or an<br />
increase in susceptibility to other influences” [1].<br />
A hazard is the inherent property of a nutrient<br />
or related substance to cause adverse health effects,<br />
depending on the level of intake.<br />
These definitions have been derived from the processes<br />
and definitions that have been applied to the risk<br />
analysis, risk assessment, and regulation of human<br />
exposure to xenobiotics as additives to our <strong>food</strong>, or<br />
as natural toxicants or environmental pollutants and<br />
contaminants in the <strong>food</strong> chain.<br />
Since risk assessment approaches to setting ULs <strong>for</strong><br />
nutrients have drawn on these more established processes<br />
<strong>for</strong> nonessential chemicals, this overview will first<br />
describe these processes, and then discuss how such an<br />
approach can be applied to nutrient risk assessment.<br />
Food and Nutrition Bulletin, vol. 28, no. 1 (supplement) © 2007, The <strong>United</strong> <strong>Nations</strong> University. S27
S28<br />
Most of this discussion will draw on recent considerations<br />
of micronutrients [1, 2]. Additionally, there is<br />
a current international collaboration exploring systematic<br />
safety assessments of intakes of amino acids [3–5].<br />
Toxicological risk analysis and assessment<br />
The values derived by the risk assessment are estimates<br />
of the quantity of a substance that can be ingested daily<br />
over a lifetime without appreciable risk to health and<br />
are termed health-<strong>based</strong> guidance values [6–9]. These<br />
include the acceptable daily intake (ADI) [6]) and the<br />
tolerable intake (TI), which may be weekly (TWI) or<br />
daily (TDI) [8]. The ADI is applied <strong>for</strong> estimates of safe<br />
exposure <strong>for</strong> <strong>food</strong> additives, i.e., <strong>for</strong> chemicals that are<br />
permitted to be used in <strong>food</strong>s, and the TDI relates to<br />
contaminants and pollutants. The US Environmental<br />
Protection Agency has replaced ADI and TDI with the<br />
term reference dose (RfD), which has been defined<br />
as an estimate of the daily exposure in the human<br />
population that is likely to be without an appreciable<br />
risk of deleterious effects during a lifetime. All these<br />
definitions are framed to avoid implying that they<br />
are absolutely “safe”; they are advisory (although they<br />
might subsequently be translated into regulations) and<br />
are the products of a systematic process of risk analysis,<br />
of which risk assessment is one element.<br />
Risk analysis is “a detailed examination, including<br />
risk assessment, risk evaluation and risk management<br />
alternatives, per<strong>for</strong>med to understand the nature of<br />
unwanted, negative consequences to human life, health,<br />
property or the environment; an analytic process to<br />
provide in<strong>for</strong>mation regarding undesirable events:<br />
the process of quantification of the probabilities and<br />
expected consequences of identified risks” [10].<br />
The definitions used in the established process vary<br />
among the agencies involved, but with the maturation<br />
of the discipline and increased international and interagency<br />
harmonization, the definitions are very close and<br />
common wordings are emerging.<br />
In this process, the definition of a hazard is “the<br />
inherent property of a chemical to cause adverse effects<br />
depending upon the level of intake.” The modification<br />
of this to suit the needs of nutritional risk assessment<br />
(see above) is straight<strong>for</strong>ward [1]. An adverse effect is<br />
“a change in morphology, physiology, growth, development<br />
or lifespan of an organism which results in<br />
impairment of functional capacity or impairment of<br />
capacity to compensate <strong>for</strong> additional stress or increase<br />
in susceptibility to the harmful effects of other environmental<br />
influences. Decisions on whether or not any<br />
effect is adverse require expert judgment” [7]. Again,<br />
this is little different from the definition derived <strong>for</strong><br />
nutritional risk assessment.<br />
A risk is “the probability or likelihood that a hazard<br />
will actually cause harm to an individual or popula-<br />
tion group”<br />
In the model developed by the Food and Agriculture<br />
Organization/World Health Organization (FAO/WHO)<br />
and the Codex Alimentarius, Risk Analysis comprises<br />
three distinct steps: risk assessment, risk management,<br />
and risk communication. Although each is a distinct<br />
step, collectively they are intended to be a coherent<br />
and fluently progressive entity. This is a well-accepted<br />
model, because it provides a structure that ensures that<br />
any uncertainties, variabilities, or assumptions involved<br />
in the assessment can be identified, thereby enabling<br />
and encouraging a transparent explanation of the<br />
means by which these issues are compensated.<br />
Risk assessment<br />
P. J. Aggett<br />
In practice, the first step in risk analysis is that of<br />
“problem <strong>for</strong>mulation,” i.e., setting the key purpose<br />
and objective of the exercise. Usually this is done by<br />
the risk managers and regulators who will be responsible<br />
<strong>for</strong> managing the risk of any particular exposure<br />
and communicating to the public about the risk and<br />
the strategy to manage it.. Often, but not necessarily<br />
always, problem <strong>for</strong>mulation may involve consultation<br />
with those who have the task of assessing the hazards<br />
and any attendant risks.<br />
Once the problem has been set, the first phase in risk<br />
analysis, risk assessment, can start. Since this involves<br />
identifying and prioritizing hazards and the exposures<br />
at which they happen, this is the process that is most<br />
relevant <strong>for</strong> this paper. Risk assessment comprises four<br />
stages: hazard identification, hazard characterization<br />
(sometimes called dose–response assessment), exposure<br />
assessment, and risk characterization. Each is<br />
briefly described later, but in essence they involve first<br />
a full review of all relevant in<strong>for</strong>mation and a qualitative<br />
identification and evaluation of all adverse effects<br />
associated with high exposures (hazard identification),<br />
followed by a quantitative estimation of risk <strong>for</strong> each<br />
adverse effect (hazard characterization). Assessment of<br />
dose–response often includes a modeling exercise to<br />
extrapolate from high to low levels of exposure.<br />
Hazard identification, as the determination of the<br />
relationship between the exposure to the chemical and<br />
one or more associated adverse effects, needs a full<br />
appraisal of in<strong>for</strong>mation to characterize the absorption,<br />
systemic distribution, metabolism, and elimination<br />
(i.e., toxicokinetics) of the chemical and the toxic<br />
effects that the chemical, or its metabolites, may have<br />
at tissue and cellular functional levels (i.e., toxicodynamics).<br />
Both human and animal model data are used.<br />
Some of these are systematically acquired through<br />
specific studies (table 1), and this applies particularly<br />
to chemicals that are proposed as <strong>food</strong> additives. Other<br />
data may be acquired more opportunistically, such as<br />
from case studies and incident reports. This is more
Setting upper levels <strong>for</strong> nutrient risk assessment<br />
TABLE 1. Current tests and endpoints used in toxicology a<br />
Study type Endpoints measured<br />
30-day study Clinical signs, mortality<br />
Body weight, body weight gain, organ weights<br />
Food consumption, water consumption<br />
Hematology and clinical chemistry<br />
Urinalysis<br />
Macroscopic/microscopic histopathology<br />
90-day study Clinical signs, mortality<br />
Body weight, body weight gain, organ weights<br />
Food consumption, water consumption<br />
Hematology and clinical chemistry<br />
Urinalysis<br />
Macroscopic/microscopic histopathology<br />
2-yr/lifetime study Clinical signs, mortality<br />
Body weight, weight gain, organ weights<br />
Food consumption, water consumption<br />
Hematology and clinical chemistry<br />
Urinalysis<br />
Macroscopic/microscopic histopathology<br />
Developmental<br />
toxicology<br />
Reproductive toxicology(multigenerational<br />
study)<br />
often the case <strong>for</strong> contaminants and pollutants. As a<br />
principle, wherever possible, data from human experimental<br />
or observational and epidemiologic studies are<br />
preferred. Commonly in toxicology the critical “adverse<br />
effect” refers to an unambiguously demonstrable<br />
adverse event, rather than a phenomenon that might<br />
be regarded as adaptive [8]. This selection is part of the<br />
hazard characterization, but in practice there would be<br />
some iteration between this and the preceding hazard<br />
identification.<br />
The regulatory assessment of applications by producers<br />
to add a chemical to a <strong>food</strong> requires an extensive<br />
database. This would be expected to include<br />
toxicokinetic in<strong>for</strong>mation from studies in animals and<br />
Dams Clinical signs, mortality<br />
Body weight, body weight gain<br />
Food and water consumption<br />
Macroscopic/microscopic histopathology<br />
Fetal data Numbers of corpora lutea and implantations<br />
Numbers of viable fetuses and resorptions<br />
Sex ratio, fetal and litter weights<br />
Skeletal and visceral examination<br />
Parental Clinical signs, mortality<br />
Body weight, body weight gain<br />
Fertility<br />
Macroscopic pathology<br />
Histopathology of reproductive organs<br />
Litter/pup data Litter size, numbers of live and dead pups<br />
Pup sex<br />
Pup weight, pup organ weights<br />
Pup macroscopic/microscopic pathology<br />
a. In addition to these toxicologic studies, studies of absorption, distribution, metabolism, and excretion are<br />
usually undertaken. Furthermore, tests of mutagenicity are carried out both in vitro and in vivo.<br />
S29<br />
perhaps in humans, and acute, short-term, repeateddose<br />
studies in two animal species. These are listed in<br />
table 1. Occasionally, but not usually <strong>for</strong> <strong>food</strong> additives,<br />
tests relevant to skin sensitivity and allergenicity<br />
may be required. In<strong>for</strong>mation from metabolic and<br />
toxicokinetic studies can help determine whether<br />
adverse effects are caused by the parent compound or<br />
by its metabolites, and also provide in<strong>for</strong>mation that<br />
would characterize interspecies and interindividual<br />
differences in toxicokinetics and toxicodynamics and<br />
susceptibility to adverse effects.<br />
It is customary to assess the quality of all published<br />
data and to consider their “totality” and coherence.<br />
Data that have been peer reviewed and produced in
S30<br />
accordance with benchmark and good-quality control<br />
practice are preferred. Systematic reviews that have<br />
already been published may help some stages of hazard<br />
identification and characterization, but they are not<br />
invariably necessary or helpful, because they have<br />
not been prepared <strong>for</strong> risk assessment and because<br />
of the judgments that have already been applied in<br />
preparing such reviews. For hazard identification and<br />
characterization, good practice is to use primary data<br />
sources, with access, if possible, to associated quality<br />
assurance.<br />
The systematic generation of data <strong>for</strong> hazard identification<br />
and characterization of chemicals that are<br />
intended to be added to <strong>food</strong>s would be resourced<br />
and acquired <strong>for</strong> regulatory review by the producers<br />
applying <strong>for</strong> approval to use that chemical in <strong>food</strong>.<br />
On the other hand, chemicals that are present in <strong>food</strong><br />
as contaminants have no such commercial sponsor,<br />
and many of the data listed in table 1 would not be<br />
available. Nevertheless, risk assessment is required to<br />
establish regulatory limits <strong>for</strong> contaminants in <strong>food</strong>, but<br />
invariably the database will be poor compared with that<br />
<strong>for</strong> additives, and consequently the uncertainty of the<br />
assessment of contaminants is increased.<br />
Hazard characterization [8] is the determination of<br />
the relationship between the exposure to the chemical<br />
and the adverse effect or effects; this is a quantitative<br />
evaluation of the adverse effects by dose–response<br />
evaluation. It includes evaluation of mechanisms of<br />
action and of species differences in the responses, if<br />
such data are available. This stage should result in the<br />
identification of a health-<strong>based</strong> guidance value or reference<br />
dose and an account of the uncertainties inherent<br />
in that value.<br />
Deriving health-<strong>based</strong> guidance values<br />
The identification and selection of one, or occasionally<br />
more than one, adverse effects is crucial to the derivation<br />
of a health-<strong>based</strong> guidance value. This judgment<br />
is <strong>based</strong> on confidence in the effect’s characterization,<br />
the appropriateness of markers relating to exposure or<br />
intake, body burden, and of the adverse effect itself,<br />
the quality of the determination of these markers,<br />
and their mechanistic relevance. This analysis, ideally,<br />
would be able to address toxicokinetic (i.e., ADME;<br />
absorption, distribution, metabolism, and excretion)<br />
and toxicodynamic in<strong>for</strong>mation and would describe<br />
the dose–response relationship of the critical event<br />
or events. Ideally this would involve determining the<br />
link between external dose (intake) and the internal or<br />
systemic burden associated with the effects, along with<br />
the mechanism <strong>for</strong> the adverse effect. Ideally these data<br />
would be supplied from a suite of integrated studies,<br />
in one species, but with some further data from other<br />
species to enable the detection and characterization of<br />
potential species differences (qualitatively and quantitatively)<br />
and of sensitive species and strains.<br />
These data are then used to derive a health guidance<br />
value or reference dose <strong>for</strong> human exposure. The<br />
derivation of this value is most commonly done by a<br />
no observed adverse effect level approach.<br />
The no observed adverse effect level (NOAEL)<br />
P. J. Aggett<br />
The NOAEL is the highest tested dose or intake at<br />
which the chosen adverse effect is not observed. The<br />
key notion here is that the dose is below the threshold<br />
<strong>for</strong> a particular health effect. It is, there<strong>for</strong>e, a conservative<br />
estimate.<br />
When a NOAEL cannot be identified, a lowest<br />
observed adverse effect level (LOAEL) is identified. The<br />
LOAEL is the lowest dose of the chemical of interest<br />
that was found to cause an adverse effect. Guidance<br />
values are derived from the adverse effect levels by<br />
dividing them by factors that represent the risk assessors’<br />
objective assessment of the uncertainty in the<br />
characterization.<br />
As may be obvious from earlier comments, all risk<br />
assessments have an inherent uncertainty and variability.<br />
Identifying and allowing <strong>for</strong> these is an integral<br />
part of the data analysis involved in hazard identification<br />
and hazard characterization. Variability can be<br />
characterized; it relates to interindividual differences<br />
arising from, <strong>for</strong> example, age, gender, absorption<br />
efficiency and other metabolic activity, nutrition, and<br />
developmental maturation. The roles of functional polymorphisms,<br />
programming, and epigenetic effects as<br />
contributors to variability are becoming appreciated.<br />
Uncertainty arises from factors that are unknown<br />
or imprecise. These include both the quality and the<br />
limitations of the database on exposure and on <strong>dietary</strong><br />
adequacy in model studies, extrapolation of data from<br />
animal models to humans, uncertainty about the representivity<br />
of the animal models, and extrapolation of<br />
the available data to human populations, particularly<br />
potentially sensitive subpopulations. Other sources of<br />
uncertainty include the methodologies used and the<br />
measurements made, and the degree of confidence in<br />
the selection of the adverse effects and data analyses.<br />
These variabilities and uncertainties are collectively<br />
incorporated in an “uncertainty factor,” which is<br />
defined as a product of several single factors by which<br />
the NOAEL or LOAEL of the critical effect is divided<br />
to derive a health <strong>based</strong> guidance value. It is important<br />
to note that “these factors account <strong>for</strong> adequacy of the<br />
pivotal study, interspecies extrapolation, interindividual<br />
variability in humans, adequacy of the overall database,<br />
and nature of toxicity”. The term uncertainty factor was<br />
considered to be a more appropriate expression than<br />
safety factor, since it avoids the notion of absolute safety<br />
and because the size of this factor is proportional to the<br />
magnitude of uncertainty rather than safety. The choice
Setting upper levels <strong>for</strong> nutrient risk assessment<br />
of uncertainty factor should be <strong>based</strong> on the available<br />
scientific evidence [7].<br />
Commonly the NOAEL is divided by a default<br />
uncertainty factor of 100 to derive a guidance value.<br />
This default value comprises two factors of 10: one <strong>for</strong><br />
interspecies differences, covering extrapolation of data<br />
from animal models to humans, and one <strong>for</strong> interindividual<br />
differences (human variability). Uncertainty<br />
factors are illustrated in table 2.<br />
As a further refinement, the International Programme<br />
on Chemical Safety (IPCS) framework [7, 9]<br />
apportions the default uncertainty factor [10] <strong>for</strong> interspecies<br />
differences between two factors of 2.5 and 4.0<br />
<strong>for</strong> toxicodynamics and toxicokinetics, respectively,<br />
and that <strong>for</strong> intraspecies variability into 3.2 and 3.2 <strong>for</strong><br />
both components. These values represent an initiative<br />
to use chemical-specific adjustment factors derived<br />
from kinetic and dynamic data to derive expressions of<br />
uncertainty that are more definitive and specific than<br />
are default values <strong>for</strong> uncertainty factors.<br />
Sometimes additional factors are used to compensate<br />
<strong>for</strong> the absence of data, such as an inadequate<br />
long-term (chronic) study, no discernible NOAEL and<br />
the need to use a LOAEL, other gaps in the data, and,<br />
sometimes, the severity of the adverse effect.<br />
The preceding outline is the ideal. It describes the<br />
application of the NOAEL approach to a systematic<br />
set of data. There is usually some such structure in the<br />
data <strong>for</strong> additives that facilitates the use of uncertainty<br />
factors, but <strong>for</strong> contaminants the quality of the data<br />
makes their use more challenging, and often several<br />
uncertainty factors are applied, resulting in a relatively<br />
high overall factor.<br />
TABLE 2. Typical uncertainty factors used in toxicology<br />
Other approaches to uncertainty and improving<br />
risk assessment<br />
S31<br />
The NOAEL approach has been criticized because<br />
it may not use all the available data, including dose–<br />
response data, and because the dose–response curves<br />
are customarily derived by using large, e.g., 10-fold,<br />
incremental steps in the intakes of the chemicals<br />
under study. Furthermore, the NOAEL approach is<br />
deterministic and does not readily allow <strong>for</strong> flexibility<br />
in selecting different levels of risk. There are alternative<br />
approaches to hazard characterization, and two, in particular,<br />
are seen as being potentially useful. These are<br />
the benchmark dose–response and categorical regression.<br />
Both allow <strong>for</strong> more extensive use of available<br />
in<strong>for</strong>mation and <strong>for</strong> calculation of levels of exposure<br />
that can be associated with predetermined levels of<br />
risk (e.g., 1%, 2.5%, 5%) within the population. These<br />
will be described briefly. Better descriptions of their<br />
use and applicability are in the references cited from<br />
which I have derived this commentary.<br />
Benchmark dose modeling<br />
Benchmark dose (BMD) modeling [2, 11, 12] fits a<br />
dose–response regression to more of the available<br />
dose–response data acquired from animal models and<br />
human studies (fig. 1). This provides an overall estimate<br />
of the variance and a way of estimating dose levels<br />
at which specific proportions of the population under<br />
study would experience an event or effect over and<br />
above the base occurrence. A statistical lower bound<br />
(BMDL or LBMD) customarily set at 95% is used.<br />
The statistical lower confidence limit of the lower<br />
bound is generally used <strong>for</strong> developing an RfD [12].<br />
Thus, this approach uses all the dose–response data to<br />
find the dose associated with a predefined response,<br />
whereas the NOAEL usually derives from a single<br />
Uncertainty factor Use Value<br />
Intraspecies (intrahuman) When extrapolating long-term studies to provide acceptable<br />
daily intakes or short-term studies to produce acute<br />
reference doses in the same species<br />
Interspecies When extrapolating, from one species to another, longterm<br />
studies to provide acceptable daily intakes or shortterm<br />
studies to produce acute reference doses<br />
Subchronic to chronic Where no adequate chronic study is available Up to 10<br />
LOAEL to NOAEL If the critical effect in the critical study is a LOAEL Up to 10 (often 3 <strong>based</strong><br />
on dose spacing)<br />
Incomplete database Where the standard data package is not complete Up to 10<br />
Steep dose–response curve Where the dose–response curve <strong>for</strong> a compound is steep,<br />
a small error in extrapolation would have dramatic consequences<br />
NOAEL, no observed adverse effect level; LOAEL, lowest observed adverse effect level<br />
10<br />
10<br />
Judgment, 3–10
S32<br />
�������� ���<br />
���<br />
�<br />
level of exposure. Furthermore, the BMD can be used<br />
on data from which an NOAEL cannot be derived;<br />
however, the dose exposure spacing <strong>for</strong> the NOAEL<br />
approach is not always useful <strong>for</strong> the BMD. It is thought<br />
or hoped by its advocates that the advantages of the<br />
BMD would provide an incentive <strong>for</strong> more rigorous<br />
studies that would decrease both scientific and mathematical<br />
uncertainty. These advantages have been<br />
discussed by a number of investigators [11, 12].<br />
It is possible to apply uncertainty factors as part of<br />
the BMD approach, <strong>for</strong> example, to allow <strong>for</strong> interindividual<br />
differences. Un<strong>for</strong>tunately, datasets from<br />
studies designed to support the use of the NOAEL<br />
approach to setting a UL are not easily used <strong>for</strong> the<br />
BMD approach.<br />
Categorical regression<br />
��� ����� ���������� �����<br />
��� �� �����<br />
��� ���<br />
���� ���<br />
�� �<br />
�����<br />
����������<br />
����<br />
FIG. 1. Benchmark dose (BMD) modeling: A representation<br />
of a benchmark dose–response curve of an adverse effect in a<br />
population. The 95% confidence interval has been calculated<br />
from all the plotted data points, and the horizontal dotted line<br />
represents the derivation of an intake, the lower benchmark<br />
dose (LBMD), at which there is a 2.5% response or risk of<br />
an adverse effect occurring in a population. Hypothetical<br />
no observed adverse effect levels (NOAELs) and lowest<br />
observed adverse effect levels (LOAELs) are indicated, as<br />
are the lower bound benchmark dose (BMDL or LBMD),<br />
uncertainty factor (UF), and the upper level of intake (UL).<br />
Source: International Programme on Chemical Safety [2],<br />
modified by Przyrembel <strong>for</strong> the Joint FAO/WHO Task Force<br />
on Nutrient Risk Assessment [1]<br />
Categorical regression [11] can use combined qualitative<br />
and quantitative data. It fits ordinal data (i.e.,<br />
outcomes that are ranked by severity of effect) to a<br />
dose–response model that can be applied to a benchmark<br />
dose–response approach. It can take into consideration<br />
the severity and duration of exposure of<br />
effect (i.e., the effects of different periods of exposure<br />
to single levels of intakes, which is a common design<br />
feature in nutritional studies), use data from multiple<br />
studies, and address a variety of endpoints. As with the<br />
BMD, it gives equal weight to studies and their data,<br />
though it is possible, as with the other approaches,<br />
to evaluate the quality of the studies against objective<br />
criteria. For example, data amenable to this approach<br />
are those from histopathological studies in which the<br />
evolution of architectural damage is monitored in relation<br />
to the period of exposure. This approach there<strong>for</strong>e<br />
provides in<strong>for</strong>mation about the evolution and mechanisms<br />
of effects at single exposure levels over time; this<br />
would be helpful in assessment of prolonged exposure<br />
at constant levels of intake.<br />
Exposure assessment and risk characterization<br />
These are the last two stages of risk assessment.<br />
Exposure/intake assessment is the measurement or<br />
estimation of exposure to a chemical by any route <strong>for</strong><br />
the population or its subgroups (e.g., toddlers, children,<br />
adults, and ethnic groups). It includes consideration of<br />
the pattern, frequency, and duration of exposure and it<br />
in<strong>for</strong>ms the next step of risk characterization.<br />
Risk characterization (sometimes called “advice <strong>for</strong><br />
decision making”) is the integrative consideration of<br />
hazard identification, hazard characterization, and<br />
exposure assessment to predict whether effects in<br />
humans are likely and the nature and severity of such<br />
effects. If data permit, it may include identification of<br />
the proportion of the population affected and the existence<br />
of any vulnerable subpopulations. The product of<br />
this exercise is an overall report describing the process,<br />
including a description of the nature of the risk, its<br />
extent, and all the associated uncertainties [8].<br />
Risk management and risk communication<br />
P. J. Aggett<br />
Risk management and risk communication are the last<br />
two elements of risk analysis. Risk management has two<br />
main functions. The first, as has been mentioned, is to<br />
frame the question, or set the task <strong>for</strong> the risk assessors;<br />
the second is to act on the risk assessment. This<br />
involves option assessment, which is the identification<br />
and assessment of possible control options; implementation<br />
of management decisions; and monitoring and<br />
evaluation of the effectiveness of the risk management<br />
measure.<br />
Although risk management and risk assessment are<br />
discrete activities, it is accepted that the system works<br />
most effectively if there is some interaction between<br />
the stages to ensure that the assessment is accurately<br />
conveyed between the two stages and is properly<br />
understood. However, the prime intention of separating<br />
risk assessment and risk management is to protect<br />
the integrity of the scientific and objective assessment<br />
by the expert risk assessment process, leaving those<br />
responsible <strong>for</strong> risk management to take into account<br />
other issues, such as the concerns and interests of other<br />
stakeholders.<br />
Finally, risk communication represents the exchange<br />
of in<strong>for</strong>mation taking place throughout the process,
Setting upper levels <strong>for</strong> nutrient risk assessment<br />
particularly but not exclusively during risk management.<br />
It is important that managers, the public, and<br />
other stakeholders understand the assessment, and<br />
it is envisaged that the entire process of risk analysis<br />
should be open and transparent and that the views of<br />
stakeholders should be taken into account as part of<br />
the process.<br />
Nutrient risk assessment: Applying the risk<br />
assessment model<br />
A joint FAO/WHO Technical Workshop [1] recently<br />
reviewed the terms of reference and nutrient risk<br />
assessments of three authoritative advisory reports,<br />
namely, the European Food Safety Authority [13] <strong>for</strong><br />
the European Union, the Expert Group on Vitamins<br />
and Minerals <strong>for</strong> the Food Standards Agency in the<br />
<strong>United</strong> Kingdom [14], and the Institute of Medicine<br />
of the National Academies <strong>for</strong> the <strong>United</strong> States and<br />
Canada [15]. It is evident that these nutrient risk<br />
assessments did not always find it easy to derive a UL<br />
confidently. The groups often used the same data, and<br />
there were many commonalities in their risk assessments.<br />
However, the data are of an inconsistent and<br />
uncertain quality, and there were differences in the use<br />
made of the data, the derived ULs, and the expression<br />
of the uncertainties. With such a predicament, there is<br />
a need, both <strong>for</strong> public health considerations and <strong>for</strong><br />
harmonized approaches to regulatory issues in global<br />
trade, to have an internationally agreed approach to<br />
setting ULs that would serve as a basis <strong>for</strong> international<br />
collaborative nutrient risk assessment, <strong>for</strong> the identification<br />
and prioritization of knowledge needs, and <strong>for</strong><br />
organizing the necessary research.<br />
The established toxicologic approach when applied<br />
systematically to nutrient risk assessment reveals the<br />
inherent limitations of the available data. In the <strong>United</strong><br />
Kingdom, <strong>for</strong> instance, in some cases the data were<br />
felt to be too insecure to set safe ULs, and provisional<br />
levels called guidance values (not to be confused with<br />
health-<strong>based</strong> guidance values) were set instead. These<br />
uncertainties include difficulties in identifying critical<br />
adverse health effects; difficulties in extrapolating<br />
between species and population age and gender groups;<br />
a lack of confidence in the estimates of intakes (exposures)<br />
involved with particular adverse health effects;<br />
and no good, if any, dose–response data. Usually nutrient<br />
risk assessment or, specifically, nutrient hazard<br />
characterization has used the NOAEL and LOAEL<br />
approach to develop a UL, and doing this with such<br />
poor-quality data has meant using many uncertainty<br />
factors. The application of the default values <strong>for</strong> these<br />
uncertainty factors can result in such a large value that<br />
when they are applied to a NOAEL or a LOAEL, they<br />
produce health-<strong>based</strong> guidance values that are close to<br />
or even below the upper end of the range <strong>for</strong> reference<br />
S33<br />
values <strong>for</strong> nutrient intakes. This “nutrient paradox” in<br />
nutrient safety assessment is well recognized <strong>for</strong> minerals<br />
but can be demonstrated also <strong>for</strong> organic nutrients<br />
(e.g., ascorbic acid) [1]. The reasonable response of<br />
risk assessors to this problem has been to reduce the<br />
uncertainty factor values applied in deriving the UL.<br />
Although this is done openly, the pathophysiological<br />
basis of such flexibility is not necessarily easy to<br />
explain.<br />
Apart from the paucity of the database, the major<br />
source of uncertainty in the risk assessment of nutrients<br />
is the nature of the nutrients themselves. For non-nutrient<br />
chemicals, the assumptions of risk assessment are<br />
that they have no physiological role, have detoxification<br />
pathways that are probably not chemical-specific, generally<br />
have no interdependence on exposure to other<br />
chemicals or nutrients, and do not increase the risk of<br />
any adverse health effects at low intakes [1, 11]. Nutrients<br />
are different; they have distinctive biochemical<br />
and physiological roles, and biological organisms have<br />
evolved specific and selective mechanisms to acquire,<br />
absorb, distribute systemically, metabolize, and control<br />
the body burden of the nutrient itself or its metabolites.<br />
These homeostatic mechanisms respond to excursions<br />
of intakes above or below physiological requirements.<br />
As a result, nutrients have a dual–dose response curve,<br />
i.e., there are adverse health effects at levels of intake<br />
that, relative to systemic requirements, are inappropriately<br />
high and at intakes that are inappropriately low<br />
(fig. 2) [1, 2, 11]. Furthermore, the shape or inflexions<br />
of the dose–response curve at the thresholds of excessive<br />
and deficient intakes will be contingent on the<br />
efficiency of the mechanisms of homeostasis and, possibly,<br />
on the nutrient’s interdependence on the supply<br />
and metabolism of other nutrients (e.g., the relatively<br />
���������� �� ���������� �� ����<br />
���<br />
��<br />
������������ ��<br />
������������<br />
���������� ����<br />
�� ����������<br />
���������� �����<br />
�� ���� ������<br />
������<br />
������<br />
�����������<br />
� �<br />
����� ���� ������<br />
���������� ����<br />
�� ��������<br />
������������ ��<br />
����� �� ��������<br />
����<br />
FIG. 2. The dual biological, or U-shaped, response curve to<br />
increasing oral intakes of a nutrient as applied to a population.<br />
At low intakes, there is a cumulative risk of deficiency<br />
that reflects the distribution of requirements, and at the upper<br />
range of intakes there is a similar cumulative risk of toxicity.<br />
Conceptually, the acceptable range of intakes represents a<br />
zone bounded at points A and B within which homeostasis<br />
ensures that intakes are used to meet individuals’ systemic<br />
requirements. Source: International Programme on Chemical<br />
Safety [2]<br />
���<br />
��
S34<br />
lower limits of toxicity of amino acid supply in zinc<br />
deficiency, or the interaction of amino acid metabolism<br />
and energy supply). Nutrient risk assessment has to be<br />
alert to such confounders.<br />
Between the extremes of adverse health effects, there<br />
is a range of intakes within which normal systemic<br />
homeostasis is effective (fig. 2). This pattern was<br />
used by an IPCS task <strong>for</strong>ce on “Risk Assessment <strong>for</strong><br />
Essential Trace Elements” to support the concept of<br />
acceptable range of oral intake (AROI) <strong>for</strong> essential<br />
trace elements [2]. Although it is easiest to envisage <strong>for</strong><br />
minerals and vitamins, the concept can apply equally<br />
well to amino acids and to lipids or fatty acids. Extending<br />
this idea to the latter nutrients highlights the need<br />
<strong>for</strong> particular consideration in hazard characterization<br />
of the duration of any particular intake that is needed<br />
to cause an adverse health effect. If, <strong>for</strong> example, one<br />
appreciates the “timeline” of adverse health effects of<br />
inappropriately high intakes of a lipid, or a class of<br />
lipids in general, then it should be feasible to appreciate<br />
the sequential mechanistic pathway and time frame of<br />
effects such as disturbances in membrane functioning,<br />
cell signaling, cell function, energy metabolism,<br />
and vascular intimal integrity and function. Although<br />
some of these effects are reversible, early, and minor,<br />
they are part of a sequence in which they might be seen<br />
to be predictive of later gross effects that would occur<br />
if high exposure to the lipid continued. As such, all<br />
these effects could be considered as potentially useful<br />
to nutrient hazard identification and characterization.<br />
This point is revisited later.<br />
Currently, the adverse health effects applied to nutrient<br />
risk assessment are clearly associated with intakes<br />
that are above the upper adaptive limits of homeostasis.<br />
Often the selected adverse health effects either are<br />
derived from data from unsystematic observational<br />
incident reports and are severe or gross (as would be<br />
expected to be inherent in the nature of a case report),<br />
or are derived from data from prolonged single-dose<br />
studies in humans or in animal models. These points<br />
reemphasize that the database available <strong>for</strong> nutrient risk<br />
assessment is much like that available <strong>for</strong> non-nutrient<br />
chemical contaminants.<br />
Although it is conceivable in hazard characterization<br />
to work from the marked adverse effects at high exposures<br />
back along the responsible pathogenic pathway<br />
to identify possible markers of later severe adverse<br />
health effects of particular intakes, it is arguably more<br />
logical to identify and characterize the hazards of high<br />
intakes on the basis of adverse health effects that are<br />
known to herald more serious events that would occur<br />
at higher or more prolonged intakes. A means of doing<br />
this would be to develop a strategy <strong>for</strong> nutrient risk<br />
assessment that is more sympathetic to the dual nature<br />
of the nutrient dose–response curve and its regulation.<br />
This strategy would involve identifying, at intakes that<br />
are nearer those to which consumers might be exposed,<br />
P. J. Aggett<br />
events that would be valid markers of potential adverse<br />
health effects. These intakes would also be ethically and<br />
practically acceptable <strong>for</strong> studies designed to in<strong>for</strong>m<br />
nutrient hazard characterization.<br />
The IPCS task <strong>for</strong>ce [2] considered this strategy.<br />
It felt that “early” biochemical effects without functional<br />
significance should not themselves be regarded<br />
as adverse health effects. However, if these could be<br />
seen to be part of the pathogenic pathway <strong>for</strong> an overt<br />
effect, then they could be envisaged as biomarkers <strong>for</strong><br />
subsequent, more serious adverse events. The IPCS<br />
task <strong>for</strong>ce reexpressed a spectrum involving classes of<br />
responses to deficient and excessive intakes: these were<br />
biochemical responses without functional significance,<br />
subclinical biomarkers of effect with functional impairment,<br />
increasing functional disturbances with clinical<br />
effects, and death. So although the biochemical changes<br />
after short or lower dose exposure are not a threat to<br />
health, and may indeed be reversible, the possibility<br />
that they herald a potentially more serious effect can<br />
be seen to contribute to nutrient hazard identification<br />
and characterization.<br />
The recent FAO/WHO Technical Workshop [1]<br />
appreciated the distinctiveness of nutrient risk assessment<br />
as compared with that of non-nutrient chemicals.<br />
It was also sensitive to the differences between the<br />
disciplinary vocabularies of nutrition and physiology<br />
and that of toxicology. For example, it felt that the terms<br />
“dose” and “exposure” caused some confusion and<br />
chose to use the term “intake” as a matter of familiarity<br />
and consistency within the discipline of nutrition,<br />
although the meaning of “intake” is still essentially<br />
the same as that of “dose” and “exposure” as they are<br />
understood in toxicology. The workshop modified the<br />
term “adverse effects” to “adverse health effects” in an<br />
attempt to capture the importance it was placing on<br />
using a full range of morphological, physiological, and<br />
early biochemical responses both as adverse events<br />
in nutrient risk assessment and as part of a spectrum<br />
including adaptive and beneficial health effects. This<br />
provided the opportunity to include, within the range<br />
of markers of adverse health effects, mild and reversible<br />
effects (such as homeostatic adaptations or, as might be<br />
the case with high exposures to complex carbohydrates,<br />
phenomena of intestinal fermentation), as well as more<br />
serious and potentially life-threatening outcomes, such<br />
as hepatic and neurologic damage [1].<br />
This workshop considered that markers indicative of<br />
effects of biochemical changes outside the homeostatic<br />
range and of minor but reversible clinical symptoms<br />
could be used as surrogate adverse health effects [1].<br />
However, it is important <strong>for</strong> quality assurance and consideration<br />
of causation that these markers be properly<br />
validated and suitable <strong>for</strong> systematic use in hazard<br />
identification and characterization. The knowledge<br />
base <strong>for</strong> this might come from published literature,<br />
but because many published or proposed markers have
Setting upper levels <strong>for</strong> nutrient risk assessment<br />
not been fully validated, there is probably a need <strong>for</strong><br />
research to develop and validate markers appropriate<br />
<strong>for</strong> this nutrient risk assessment strategy.<br />
A continuum as a basis <strong>for</strong> identifying adverse health<br />
effects <strong>for</strong> this strategy in nutrient hazard identification<br />
and characterization is illustrated in figure 3 [16].<br />
Steps 4–7 in the figure reflect the increasing severity<br />
of adverse health effects; the workshop [1] agreed that<br />
phenomena occurring at level 3, namely, at levels of<br />
intake that were assumed to be not far in excess of the<br />
homeostatic range, could indeed be surrogates, or predictive<br />
markers, of adverse health effects. Furthermore,<br />
it concluded that<br />
when data are available, the optimal endpoint <strong>for</strong> use<br />
in setting a UL would be an effect at step 3 and possibly<br />
step 2, with steps 4–7 reflective of clinical phenomena.<br />
Step 2 may be applicable in some cases in which sufficient<br />
in<strong>for</strong>mation is available to suggest that changes<br />
outside the homeostatic range that occur without known<br />
sequelae would be relevant as surrogates <strong>for</strong> an adverse<br />
health effect [1].<br />
This is emphasized in figure 3 by showing, against<br />
the background of the ranked effects, a hypothetical<br />
cascade of markers or effects arising from exceeding<br />
a safe level, or conceptual UL, of intake. These figures<br />
show how a critical control point analytical approach<br />
to available in<strong>for</strong>mation could be used in nutrient<br />
hazard identification and characterization; it provides<br />
a strategic structure <strong>for</strong> an evidence-<strong>based</strong> systematic<br />
review and categorization of the data and potential<br />
markers and <strong>for</strong> the determination of gaps in insight<br />
of the pathophysiology and uncertainty.<br />
The use of such markers would be an important<br />
�� ����������� ������� ������ ����������� ����� ���<br />
�� ������� ��������<br />
�� ����������� ������� ������� ��� ����������� �����<br />
������� ����� ��������<br />
�� ����������� ������� ������� ��� ����������� ������<br />
� ������ �� ��������� ������� �������<br />
��� �� ������<br />
�� �������� �������� ���������� �� ����� ��� ����������<br />
�������<br />
�� �������� �������� �� ����������� ��� ���������� �������<br />
�� �������� ����� ���������� �� ����������� ���������� �����<br />
������<br />
�� �������� ����� ���������� �� ������������ ����� ������<br />
FIG. 3. The range and cascade of effects and of markers:<br />
opportunities <strong>for</strong> identifying critical markers of adverse<br />
health effects. Each circle represents a hypothetical marker,<br />
and the dark circle represents the marker at a critical point<br />
<strong>for</strong> the subsequent cascade of adverse health effects. The<br />
spectrum of health effects is from Renwick et al. [16]<br />
S35<br />
innovation in nutrient risk assessment. Their introduction<br />
would be amenable to the NOAEL, BMD, and<br />
categorical regression approaches to hazard characterization.<br />
Using markers of earlier effects of excess intakes<br />
would be expected to increase the size of the database<br />
<strong>for</strong> hazard identification and characterization. They<br />
probably will not improve the quality of the database.<br />
In particular, the use of markers at steps 2 and 3 of<br />
figure 3 needs to be backed by confidence in their<br />
validity and quality.<br />
With these issues in mind, the workshop emphasized<br />
that biomarkers comprised two classes: “factors” that<br />
represent “an event…directly involved in the process<br />
of interest and are causally associated with the adverse<br />
health effect”[1] and “indicators” that represent correlated<br />
or associated effects and events that have not been<br />
shown to be part of the causal pathway. Thus, a biomarker<br />
that is part of the causal pathway can be regarded as<br />
being “predictive” of an adverse health effect; however,<br />
some “predictive” biomarkers might not be causal. In<br />
this regard, the workshop appreciated that biomarkers<br />
can be diagnostic in that they indicate adverse<br />
health effects relevant to nutrient risk assessment, <strong>for</strong><br />
example, liver damage, but as such these could still be<br />
categorized as factors or indicators according to their<br />
perceived role in the pathogeneses involved. Thus,<br />
nutrient risk assessors may have available a portfolio of<br />
biomarkers that could be used as surrogates <strong>for</strong> adverse<br />
health effects, in that such markers can be typified as<br />
being causally associated with the adverse health effect;<br />
diagnostic of the adverse health effect; and predictive<br />
of, but not causally associated with, the adverse health<br />
effect [1].<br />
Overall markers, whether they are functional, chemical,<br />
or morphological, would need to meet the quality<br />
criteria of being biologically valid and reproducible, of<br />
known specificity and sensitivity, and methodologically<br />
or analytically valid and reproducible. A recent<br />
consideration of the use of markers as surrogate endpoints<br />
in the justification of claims of reduced risk of<br />
disease is particularly relevant to these issues [17] and<br />
emphasizes the need <strong>for</strong> markers to be ethically and<br />
practically feasible if they are to be used in systematic<br />
studies in populations. The workshop appreciated that<br />
these criteria provided a basis <strong>for</strong> characterizing the<br />
uncertainty and variability associated with markers at<br />
any stage in the above ranking, but particularly those<br />
at stages 2 and 3, where the best chances of improving<br />
the database through human research exist.<br />
Theoretically, a biologically <strong>based</strong> or metabolic dose–<br />
response model would be applicable to all nutrients<br />
and should or could derive from the compilation and<br />
acquisition of new data on absorption, distribution,<br />
metabolism, and excretion as the basis of in<strong>for</strong>mation<br />
on biokinetics and biodynamics. In essence, this<br />
resembles the use and derivation of chemical-specific<br />
adjustment factors (CSAFs) to improve the specificity
S36<br />
of uncertainty factors. Furthermore, ADME data<br />
could be used to explore the dose–response curve at<br />
the lower extreme of intakes to set safe lower levels as<br />
part of a risk–benefit analysis [16]. The construction of<br />
biological models <strong>for</strong> dose–response curves and CSAFs<br />
would need different gradations of intakes from those<br />
traditionally used <strong>for</strong> toxicologic studies.<br />
In some instances, high nutrient intakes have already<br />
been associated with phenomena that correspond with<br />
stage 2 or 3 markers <strong>for</strong> adverse health effects. These<br />
are metabolic interactions among nutrients (<strong>for</strong> example,<br />
those among iron, zinc, and copper) in situations in<br />
which imbalanced intakes compromise the specificity<br />
of individual metabolic pathways [1].<br />
The value of using markers in nutrient risk assessment<br />
would be enhanced if the totality of the evidence<br />
supporting the biological validity <strong>for</strong> each marker<br />
could be explicitly evaluated in the context of overall<br />
causation, incorporating the strength of the association;<br />
consistency across all lines of evidence; specificity; temporal<br />
relationship; a demonstrable relationship between<br />
intake and a functional or health effect response <strong>for</strong> the<br />
marker (i.e., <strong>for</strong> a homeostatic stage 2 marker, an indication<br />
of an adaptive phenomenon, rather than a linear<br />
response that might reflect exposure rather than a specific<br />
adaptive health effect [5]); and plausibility, coherence,<br />
and experimental support from other sources<br />
(e.g., animal models [17]). It is doubtful whether much<br />
in<strong>for</strong>mation is available to support potential markers<br />
<strong>for</strong> nutrient risk assessment.<br />
These principles are also relevant to the early detection<br />
of inadequate intakes. Some initiatives have considered<br />
whether it would be possible to have a common<br />
approach to assessing nutrient deficiency and excess.<br />
This has been explored <strong>for</strong> essential trace elements [2]<br />
and as a risk–benefit analysis <strong>for</strong> micronutrients in<br />
general [16]. Recently a human health dose–response<br />
risk assessment has been used to explore the dual<br />
response curve risk assessment <strong>for</strong> copper [11], and<br />
a spectrum from copper deficiency to copper toxicity<br />
has been compiled with the use of data from studies on<br />
humans and animal models. The exercise provided an<br />
opportunity to explore several approaches to dose– or<br />
intake–response modeling, including the benchmark<br />
dose and categorical regression. Existing data allowed<br />
<strong>for</strong> these approaches, but the development of a biologically<br />
<strong>based</strong> dose–response risk assessment and of<br />
CSAFs was limited by the quality and amount of the<br />
data [11]. Many of the individual studies that were<br />
reviewed during hazard identification and characterization<br />
in this exercise had been designed to demonstrate<br />
the effects of prolonged exposures to single measured<br />
and usually very high or very low concentrations of<br />
copper in diets. These studies were not designed to<br />
generate intake–response curves or to examine risk.<br />
Most just reported the copper contents of diets fed to<br />
animals and gave no indication of actual intakes; these<br />
had to be estimated, albeit imperfectly, from knowledge<br />
of animal weights and data from other reports<br />
on animal <strong>food</strong> consumption. After such reports were<br />
excluded during the systematic literature search, the<br />
residual database was very scant. This experience cautions<br />
against having high expectations of being able<br />
soon to address nutrient risk assessment through a<br />
biologically <strong>based</strong> response approach. The situation <strong>for</strong><br />
amino acids, where systematic metabolic studies using<br />
tracers are improving the generic understanding of the<br />
application of kinetic and dynamic studies to homeostasis,<br />
may be more encouraging [3–5].<br />
Summary and conclusions<br />
P. J. Aggett<br />
There is a need <strong>for</strong> a transparent model <strong>for</strong> nutrient risk<br />
assessment that would enable key elements of nutrient<br />
metabolism and function, and gastrointestinal and<br />
systemic adaptive phenomena in response to excess<br />
intakes (i.e., above the “physiological requirements”),<br />
to be identified and used as markers of excessive exposure.<br />
Such a biologically <strong>based</strong> dose–response model<br />
to determine ULs <strong>for</strong> nutrients could also be used to<br />
explore lower levels of intake and thereby enable the<br />
setting of lower levels of reference intakes.<br />
Nutrient hazard identification and characterization is<br />
an iterative process. It needs to be supported by a complete<br />
compilation and review of the available literature<br />
and data, i.e., an evidence-<strong>based</strong> systematic review with<br />
predefined search and summary strategies and transparent<br />
criteria <strong>for</strong> rating, including and excluding individual<br />
studies and their data. As with risk assessment of<br />
non-nutrient chemicals, published systematic reviews<br />
may be useful. However, they should provide a means<br />
to access primary data and to rate their quality, and the<br />
bases of their systematization should not be allowed<br />
to prejudice the nutrient hazard identification and<br />
characterization. The critical intermediate outcome of<br />
this process is the agreed selection of an adverse health<br />
effect from which a UL, as a health-<strong>based</strong> guidance<br />
value, can be derived <strong>for</strong> the protection of the public’s<br />
health. The approach proposed in this paper <strong>for</strong> identification<br />
of the adverse health effect, namely, the use of<br />
health effects and markers that occur relatively earlier<br />
or at lower intakes on the pathogenic response curve<br />
than classic toxicologically adverse effects, necessitates<br />
specific data search strategies that make greater use of<br />
ADME, biokinetic, and biodynamic data and that will<br />
probably need specific research. The advantage of using<br />
adverse health effects, or markers thereof, that occur<br />
at such lower intakes is that such research should be<br />
feasible in human participants. The disadvantages at<br />
the moment are the overall paucity of data, the nonsystematic<br />
and opportunistic nature of most of the<br />
relevant data, and the fact that most systematic data<br />
are derived from animal models.
Setting upper levels <strong>for</strong> nutrient risk assessment<br />
The proposals outlined here are much more fully<br />
developed in the Report of the Joint FAO/WHO Technical<br />
Workshop [1], as are their implications <strong>for</strong> international<br />
nutrient risk assessment and health policy.<br />
The report highlighted five key issues: (1) Scientific<br />
judgment is a key aspect of nutrient risk assessment,<br />
and the bases <strong>for</strong> decision-making should be well<br />
documented to enhance its transparency. (2) Because<br />
data are limited, the model is designed to carefully take<br />
into account the identification and evaluation of data<br />
uncertainties so that users of the derived ULs would be<br />
unlikely to devise additional corrections. (3) Because<br />
nutrient risk managers need a UL, a UL should be set<br />
whenever possible, despite the limitations of the data;<br />
the risk assessor should be able to clarify the degree<br />
and nature of the uncertainty so that the risk manager<br />
can take this into account in decision-making. (4) The<br />
absence of evidence of an adverse health effect is not<br />
References<br />
1. World Health Organization/Food and Agriculture<br />
Organization. A model <strong>for</strong> establishing upper levels of<br />
intake <strong>for</strong> nutrients and related substances. Report of a<br />
Joint FAO/WHO Technical Workshop on Nutrient Risk<br />
Assessment. Geneva: WHO/FAO, 2006<br />
2. International Programme on Chemical Safety (IPCS).<br />
Principles and methods <strong>for</strong> the assessment of risk from<br />
essential trace elements. Environmental health criteria.<br />
228, Geneva: WHO, 2002.<br />
3. Hayashi Y. Application of the concepts of risk assessment<br />
to the study of amino acid supplements. J Nutr<br />
2003;133(6 suppl 1):2021S–4S.<br />
4. Renwick AG. The safety testing of amino acids. J Nutr<br />
2003;133:2031S–2033S.<br />
5. Bier DM. Amino acid pharmacokinetics and safety<br />
assessment. J Nutr 2003;133(6 suppl 1):2034S–9S.<br />
6. World Health Organization. Principles <strong>for</strong> the safety<br />
assessment of <strong>food</strong> additives and contaminants in <strong>food</strong>.<br />
Environmental Health Criteria 70. Geneva: WHO, 1987.<br />
7. World Health Organization. Assessing human health<br />
risks of chemicals: derivation of guidance values <strong>for</strong><br />
health-<strong>based</strong> exposure limits. Environmental Health<br />
Criteria 70. Geneva: WHO, 1994<br />
8. International Programme on Chemical Safety (IPCS).<br />
IPCS Risk Assessment Terminology, Geneva: WHO,<br />
2004. Available at: (http://www.who.int/ipcs/methods/<br />
harmonization/areas/ipcsterminologyparts1and2.pdf).<br />
Accessed 27 November 2006.<br />
9. Dybing E, Doe J, Groten J, Kleiner J, O’Brien J, Renwick<br />
AG, Schlatter J, Steinberg P, Tritscher A, Walker R,<br />
Younes M. Hazard characterisation of chemicals in <strong>food</strong><br />
and diet: Dose response, mechanisms and extrapolation<br />
issues. Food Chem Toxicol 2002;40:237–82.<br />
10. Society <strong>for</strong> Risk Analysis (SRA). Available at: http://<br />
S37<br />
equivalent to evidence of the absence of an adverse<br />
health effect. (5) It is inappropriate to base conclusions<br />
on the risk or lack of risk <strong>for</strong> nutrients in risk<br />
assessment on the basis of studies that were designed<br />
<strong>for</strong> purposes other than assessing risk. Points 1 and 2<br />
pick up on the benefit of a harmonized approach to use<br />
biologically <strong>based</strong> dose–response modeling in nutrient<br />
risk assessment. Point 3 is sensitive to the pressures on<br />
risk managers, who at least want a UL with a transparent<br />
and harmonized basis <strong>for</strong> expressing uncertainty;<br />
this would be achievable against a biologically <strong>based</strong><br />
model. Point 4 is a universal truism that is too often<br />
overlooked, perhaps because of overdependence on<br />
studies such as those one is warned about in point 5.<br />
Collectively, these points show the potential of other<br />
agencies to further explore, develop, and apply the<br />
model advanced by the Joint FAO/WHO Technical<br />
Workshop on Nutrient Risk Assessment [1].<br />
www.sra.org/resources_glossary. Accessed 28 October<br />
2006.<br />
11. Stern BR, Solioz M, Krewski D, Aggett P, Aw T-C, Baker<br />
S, Crump K, Dourson M, Haber L, Hertzberg R, Keen C,<br />
Meek B, Rudenko L, Schoeny R, Slob W, Starr T. Copper<br />
and human health: Biochemistry, genetics and strategies<br />
<strong>for</strong> modelling dose response relationships. J Toxicol<br />
Environ Hlth Ser B 2007;10(pt 3).<br />
12. Crump KS. A new method <strong>for</strong> determining allowable<br />
daily intakes. Fundam Appl Toxicol 1984;4:854–71.<br />
13. European Commission. Scientific Committee on Food<br />
(EC/ SCF). Guidelines of the Scientific Committee on<br />
Food <strong>for</strong> the development of tolerable upper intake<br />
levels <strong>for</strong> vitamins and minerals, 2000. (SCF/CS/NUT/<br />
UPPLEV/11 Final) Brussels: European Commission.<br />
Available at: http://europa.eu.int./comm/<strong>food</strong>/fs/sc/scf/<br />
out80a_en.pdf. Accessed 28 November 2006.<br />
14. Expert Group on Vitamins and Minerals. Food Standards<br />
Agency Publications, London, 2002. Available at:<br />
(http://www.<strong>food</strong>.gov.uk/multimedia/pdfs/vitmin2003.<br />
pdf. Accessed 27 November 2006.<br />
15. Institute of Medicine. Dietary reference values. A risk<br />
assessment model <strong>for</strong> establishing upper intake levels<br />
<strong>for</strong> nutrients. Washington, DC: National Academy<br />
Press, 1998.<br />
16. Renwick AG, Flynn A, Fletcher RJ, Muller DJ, Tuijtelaars<br />
S, Verhagen H. Risk-benefit analysis of micronutrients.<br />
Food Chem Toxicol 2004;42:1903–22.<br />
17. Aggett PJ, Antoine J-M, Asp N-G, Bellisle F, Contor L,<br />
Cummings JH, Howlett J, Muller DJG, Persin C, Pijls<br />
LTJ, Rechkemmer G, Tuijtelaars S, Verhagen H. Process<br />
<strong>for</strong> the assessment of scientific support <strong>for</strong> claims<br />
on <strong>food</strong>s. Consensus on criteria. Eur J Nutr 2005;<br />
44(supp1):1–30.
Using criteria to establish nutrient intake values (NIVs)<br />
Allison A. Yates<br />
Abstract<br />
One of the most important of the nutrient intake values<br />
(NIVs) is the average nutrient requirement (ANR). The<br />
ANR is defined as an intake value that will be adequate<br />
<strong>for</strong> half of the individuals in a group of people with similar<br />
characteristics. It is used to estimate the prevalence<br />
of adequacy, and it serves as the basis <strong>for</strong> the individual<br />
nutrient level (INL x ). The determination of adequacy is<br />
a complex process, with the resulting value of the ANR<br />
dependent on the criterion or functional outcome chosen<br />
to define nutrient adequacy. Because nutrients have<br />
multiple sites of action in human metabolism, it is possible<br />
to demonstrate abnormal function in one parameter<br />
measured or observed as a result of inadequate intake<br />
of a nutrient, while other parameters requiring the<br />
same nutrient appear normal or within normal ranges.<br />
Thus, depending on the criterion of adequacy selected,<br />
the requirement <strong>for</strong> a given nutrient may be at a lower<br />
or a higher intake amount. In harmonizing development<br />
of NIVs, it is important to clearly identify the<br />
criterion of adequacy selected and the rationale <strong>for</strong> its<br />
selection. Rarely are available data sufficient to provide<br />
dose–response in<strong>for</strong>mation from which to select a level<br />
of intake at which half of the individuals demonstrate<br />
adequacy and half appear to demonstrate inadequacy.<br />
Three levels of intake, of which at least one level of intake<br />
is below the requirement <strong>for</strong> most of the individuals in<br />
the sample, and one level of intake is above their requirement,<br />
are useful <strong>for</strong> establishing a level at which half of<br />
the group might be considered to demonstrate adequacy.<br />
Types of human nutrient studies that may be used to<br />
obtain data are discussed, as well as characteristics of<br />
the sample size needed to demonstrate adequacy. The<br />
The author is affiliated with the Beltsville Human Nutrition<br />
Research Center, US Department of Agriculture/Agricultural<br />
Research Service, Beltsville, Maryland, USA.<br />
Please direct queries to the author: Allison A. Yates, Director,<br />
Beltsville Human Nutrition Research Center, USDA/ARS,<br />
110300 Baltimore Ave., Beltsville, MD 20705, USA; e-mail:<br />
Allison.Yates@ars.usda.gov.<br />
S38<br />
variation in requirements is also an important aspect in<br />
predicting levels of intake that will have defined probabilities<br />
of adequacy <strong>for</strong> groups (to develop the INL x ,<br />
where x is the defined probability chosen). An analysis<br />
of the origins of different types of variability is presented.<br />
When estimating energy requirements, a special case of<br />
NIVs, important issues must be considered. Additionally,<br />
an example of evaluating data used to establish an ANR<br />
<strong>for</strong> vitamin A, and the effect of variability in requirements<br />
<strong>for</strong> vitamin A, is provided.<br />
Key words: Average nutrient level, criterion of<br />
adequacy, nutrient requirements, sample size<br />
Introduction<br />
The framework <strong>for</strong> nutrient intake values, as discussed<br />
in this issue by King et al. [1], and the uses of quantitative<br />
nutrient standards, as discussed by Murphy and<br />
Vorster [2] and Vorster et al. [3], are well understood by<br />
those who work in nutrition policy and program areas;<br />
it is less well understood how human nutrition research<br />
regarding nutrients and bioactive <strong>food</strong> components is<br />
actually translated into establishing a nutrient intake<br />
value, and whether such a reference value is a level of<br />
intake thought to be adequate or a level thought to not<br />
increase the risks associated with excess intakes. This<br />
article outlines the steps in applying criteria to establish<br />
nutrient intake values, describes the importance of<br />
identifying and substantiating the criterion or criteria<br />
selected to establish adequacy, and reviews how data<br />
typically available are assembled and compared in the<br />
process of establishing nutrient intake values.<br />
Steps in applying criteria to establish nutrient<br />
requirements<br />
There are four general steps to determining nutrient<br />
intake values (NIVs) <strong>based</strong> on scientific data where<br />
nutrient intake has been estimated and various data<br />
Food and Nutrition Bulletin, vol. 28, no. 1 (supplement) © 2007, The <strong>United</strong> <strong>Nations</strong> University.
Establishing nutrient intake values<br />
have been gathered on responses to various levels of<br />
intake (see box 1). This paper covers the first two of<br />
these steps in detail.<br />
Step 1: Determine average nutrient<br />
requirement (ANR)<br />
The first step in developing an NIV is to determine<br />
the average nutrient requirement (ANR) <strong>for</strong> the target<br />
population group. Although this sounds simple, it is<br />
very complex and is a critical step in developing usable<br />
nutrient intake values. It requires that the available data<br />
fit the model described by King et al. [1] and Murphy<br />
and Vorster [2] in this issue.<br />
As described by King et al. [1], the model <strong>for</strong> setting<br />
NIVs has been adopted over the last two decades in<br />
whole or in part by a number of countries and regions<br />
<strong>for</strong> use in nutrition policy development and programs.<br />
The framework described in King et al. [1] proposes<br />
harmonizing the terms used <strong>for</strong> the various values<br />
as well as their definitions in order to move toward<br />
adoption, where appropriate, of common NIVs. The<br />
model requires the determination of an ANR <strong>for</strong> a<br />
defined subset of the apparently healthy population.<br />
From in<strong>for</strong>mation that relates meeting an individual’s<br />
requirement to the level of nutrient intake consumed,<br />
an individual nutrient level (INL x ) is derived that<br />
should meet the needs of a defined percentage (which<br />
is represented by the subunit x) of that subgroup in the<br />
population. More in<strong>for</strong>mation on the model and its<br />
statistical basis and assumptions is provided by Murphy<br />
and Vorster [2].<br />
If it were possible to know each person’s usual<br />
requirement <strong>based</strong> on a chosen criterion <strong>for</strong> adequacy,<br />
it would be possible to identify an intake amount that<br />
is the average (median) requirement of the group of<br />
interest. With this in<strong>for</strong>mation, and with in<strong>for</strong>mation<br />
on each person’s usual intake, it is also possible to use<br />
BOX 1. Steps in applying criteria to establish an individual<br />
nutrient level (INL)<br />
1. Determine average (median) nutrient requirements<br />
(ANR) <strong>for</strong> target population subgroup<br />
a. Evaluate possible requirement datasets<br />
b. Determine usable dataset <strong>based</strong> on chosen level<br />
of adequacy<br />
2. Estimate variation in requirements in target population<br />
group<br />
3. Increase the ANR by a factor <strong>based</strong> on the variation<br />
observed or assumed (e.g., 2 x CV ANR ) to obtain<br />
INL x , the nutrient intake to be used as a goal <strong>for</strong><br />
individuals (see Murphy and Vorster [2])<br />
4. Determine the nutrient intake values (NIVs) <strong>for</strong><br />
other population groups with missing data (see<br />
Atkinson and Koletzko [4] in this issue)<br />
S39<br />
the ANR as the cutoff <strong>for</strong> the percentage of the population<br />
whose diet is inadequate <strong>for</strong> a given nutrient [5] in<br />
order to establish the prevalence of inadequacy <strong>for</strong> the<br />
population group of interest (see Murphy and Vorster<br />
[2] <strong>for</strong> more in<strong>for</strong>mation).<br />
Adequate <strong>for</strong> what?<br />
A number of assumptions must be made when estimating<br />
an ANR. Since the ANR plays a key role both in<br />
assessing adequacy of the nutrient intakes of groups<br />
and in serving as the basis <strong>for</strong> a recommended nutrient<br />
intake <strong>for</strong> individuals (INL x ) (see Murphy and Vorster<br />
[2]), it becomes very important to carefully examine<br />
the data used to establish the ANR to ensure that the<br />
ANR is both applicable to the group and <strong>based</strong> on the<br />
best indicator of adequacy that can be applied.<br />
The effects of inadequacy become apparent when<br />
diets are low in or lack a nutrient required <strong>for</strong> normal<br />
physiological function, or when <strong>dietary</strong> intakes result<br />
in increasing the risk of onset of a chronic disease such<br />
as cardiovascular disease; with greater deprivation,<br />
more serious effects are frequently demonstrated. Correspondingly,<br />
after a period of depletion, when small<br />
amounts of a nutrient are then provided, some functions<br />
may be restored while others remain abnormal<br />
and are not reversed. For many nutrients, this results<br />
in a continuum of responses observed as levels of<br />
intake increase, and may range from easily observed<br />
deficiency signs and symptoms when the diet lacks the<br />
nutrient (such as is seen in scurvy with chronic and<br />
severe lack of vitamin C) to subtle changes indicating<br />
suboptimal levels of intake, such as a decrease in the<br />
ability to respond to oxidative stress as measured by<br />
leukocyte ascorbate concentrations. Table 1 provides a<br />
list of the types of research studies and criteria that can<br />
and have been used to determine what is “adequate” <strong>for</strong><br />
various nutrients.<br />
The possible types of criteria and their indicators can<br />
be grouped on the basis of their origins, as biochemical<br />
measures (e.g., red blood cell folate), physiological<br />
measures (e.g., blood pressure), functional measures<br />
(e.g., dark adaptation), equilibrium maintenance (e.g.,<br />
factorial estimates of iron), disease incidence (e.g., cardiovascular<br />
disease), or animal models of inadequacy<br />
(e.g., hemolytic anemia in rats).<br />
Model indicators or criteria <strong>for</strong> adequacy<br />
To serve as a model indicator or criterion of adequacy,<br />
an indicator should meet the following criteria:<br />
» It can be measured without compromising the health<br />
or well-being of the individual (thus somewhat noninvasive,<br />
particularly <strong>for</strong> infants and children);<br />
» It does not fluctuate rapidly or markedly when intake<br />
is increased or reduced, so that changes in it reflect<br />
the gradual nature of a change in availability of the
S40<br />
TABLE 1. Possible criteria that may serve as the basis <strong>for</strong> adequacy<br />
Type of study Measurement Examples a<br />
Nutrition intervention studies (randomized,<br />
placebo-controlled studies)<br />
nutrient at the cellular level;<br />
» It has been validated as representative of the functional<br />
level present of the nutrient and not easily<br />
altered by other environmental changes, including<br />
the <strong>dietary</strong> content of other nutrients.<br />
In the case of chronic disease relationships or developmental<br />
abnormalities, a surrogate marker of adequacy<br />
is useful because while the initiation of the<br />
disease process or abnormality may occur as a result of<br />
an alteration in nutrient intake (either not enough or<br />
too much) at an early age, the presence of the chronic<br />
disease may not be evident functionally <strong>for</strong> many years<br />
via observable clinical signs or symptoms. The surrogate<br />
marker, then, must be validated through strong<br />
correlation with both the <strong>dietary</strong> constituent and with<br />
subsequent development of the disease in order to be<br />
considered a true indicator of adequacy. The generally<br />
accepted example of a validated surrogate marker is<br />
serum cholesterol and subsequent development of<br />
cardiovascular disease.<br />
None of the possible criteria used in establishing<br />
nutrient requirements and listed in table 1 is considered<br />
a perfect example of a model indicator of<br />
adequacy, although some are better choices, when<br />
available, than others.<br />
Selecting criteria <strong>for</strong> setting nutrient standards<br />
The values of the ANR and thus the INL x depend<br />
on which criterion is selected to establish adequacy.<br />
Nutrient adequacy is not well defined, and in some<br />
situations it may become a political decision. It is well<br />
known that 10 mg of vitamin C or less per day will<br />
prevent scurvy. If the criterion chosen <strong>for</strong> vitamin C<br />
adequacy is prevention of scurvy, then the ANR will<br />
Functional outcome Calcium fracture rate with increased<br />
calcium intake via supplements or<br />
placebo<br />
Biochemical measurements Red blood cell folate response to varying<br />
levels of folate<br />
Depletion/repletion studies Biochemical measurements Leukocyte ascorbate concentrations<br />
<strong>for</strong> vitamin C<br />
Urinary excretion of 4-pyridoxic acid<br />
<strong>for</strong> vitamin B 6<br />
Balance studies Controlled intake and excretion Protein requirements<br />
Animal studies Biochemical measurements Vitamin E and red blood cell hemolysis<br />
Factorial estimation Measure losses + bioavailability Iron requirements<br />
Epidemiologic observational studies Estimate intake and measure losses Iodine intake and excretion<br />
Observed intakes in healthy populations<br />
a. Source: Dietary reference intake reports [6–10].<br />
Functional outcome Vitamin A and night-blindness<br />
Dietary intake data Vitamin K<br />
be at a value less than 10 mg; however, if the criterion<br />
chosen is the amount of vitamin C at which ascorbate<br />
is first excreted in urine when increasing doses are<br />
consumed, assumed to represent a more complete saturation<br />
of body stores and thus a purported mechanism<br />
to handle oxidative stress [6], then the ANR will be at<br />
a much higher value. It is thus possible to have multiple<br />
ANRs, each corresponding to a different indicator or<br />
criterion of adequacy (fig. 1). It is then up to nutrition<br />
and public health policy planners to determine which<br />
level of adequacy is desirable or possibly attainable<br />
in the population group of interest. The choice of the<br />
criterion, assuming it has a strong scientific basis, is a<br />
policy–risk management decision.<br />
Steps in determining the ANR <strong>for</strong> a specific group<br />
The applicability of the ANR to the population <strong>for</strong><br />
which it is developed is improved if the data used meet<br />
certain standards. Some important factors are listed in<br />
box 2. Whatever data are finally selected, it is important<br />
to be transparent by identifying the data used, their<br />
source, and the rationale <strong>for</strong> their choice.<br />
Nutrient research methods that evaluate human<br />
nutrient needs<br />
A. A. Yates<br />
Methods used to establish nutrient requirements<br />
include those where specific biochemical measures or<br />
functional changes can be specifically attributed to the<br />
level of intake and followed as intake varies.<br />
Factorial estimation. For many nutrients in normal<br />
metabolism, nutrient turnover occurs such that the<br />
amount of the nutrient (or its by-products) excreted<br />
roughly approximates the amount that needs to be
Establishing nutrient intake values<br />
���� �� ����������<br />
���<br />
��� � ��� �<br />
��� ��� � �<br />
���������� ������ �� �������� �<br />
FIG. 1. Model <strong>for</strong> impact of different criteria used to establish<br />
adequacy. EAR 1 is the amount of a nutrient X needed<br />
that would result in a chosen criterion (C 1 ) to appear to be<br />
adequate—defined as within a normal range, functioning<br />
normally, or considered as an indicator of health—in half<br />
of the individuals in a subgroup consuming that level of the<br />
nutrient on a usual intake basis; at this level of intake, C 2 (a<br />
second criterion, which could also be chosen) would still be<br />
abnormal or not functioning normally and thus inadequate<br />
<strong>for</strong> almost all individuals. The level of the intake needed<br />
<strong>for</strong> C 2 to be normal in half the individuals in the group is<br />
EAR 2 . Note the corresponding RDA (recommended <strong>dietary</strong><br />
allowance) that would occur, assuming that the distribution<br />
of requirements <strong>for</strong> C 1 is the same as that <strong>for</strong> C 2 . (EAR, estimated<br />
average requirement)<br />
replaced. Typically, the amounts of a nutrient excreted<br />
via the urine, feces, and skin and by miscellaneous<br />
losses are measured, and they may be increased by an<br />
additional amount to take into account differences<br />
in assumed bioavailability (particularly <strong>for</strong> nutrients<br />
<strong>for</strong> which absorption varies greatly; see Gibson [11]<br />
in this issue) and any expected increase in metabolism<br />
thought to occur when utilizing a <strong>dietary</strong> source<br />
(the additional amounts needed to allow <strong>for</strong> nutrient<br />
absorption, excretion, etc.). These measurements<br />
may not be obtained from the same study or the same<br />
subjects, but they represent expected losses in general<br />
<strong>for</strong> the population group of interest. These factors are<br />
added together to estimate the ANR.<br />
BOX 2. Factors important in determining the average<br />
nutrient requirement (ANR)<br />
1. Dataset should be from a representative sample of<br />
the target group<br />
2. Data should<br />
a. Be from the same individuals consuming a range<br />
of intakes<br />
b. Be an indicator of adequacy measured or evaluated<br />
that establishes a level of intake at which<br />
half of the individuals demonstrate abnormal<br />
responses or inadequacy<br />
3. The sample size needs to be large enough to provide<br />
confidence in the data obtained<br />
4. Data should be collected <strong>for</strong> a long enough period<br />
of time to include an estimate of intraindividual<br />
variation in requirement<br />
��<br />
���<br />
���� �� ������<br />
S41<br />
Nutrient balance studies. Similar in many respects<br />
to the factorial approach, nutrient balance studies also<br />
involve collecting and measuring losses of a nutrient in<br />
individuals while carefully estimating nutrient intake.<br />
Although nutrient balance (nutrient intake = nutrient<br />
excreted) will occur at levels above the requirement<br />
after equilibrium (usually 5 to 6 days, depending on the<br />
nutrient under study), at levels below the individual’s<br />
requirement metabolism continues to the extent possible<br />
in response to the partial lack of the substrate. This<br />
results in loss of body stores or breakdown of tissue to<br />
meet the more critical demands <strong>for</strong> the nutrient; the<br />
amount of the nutrient or its metabolic by-product<br />
excreted is more than the intake when inadequate<br />
amounts are consumed, resulting in a state known<br />
as negative balance. The lowest intake level at which<br />
balance occurs, in which the amount consumed is<br />
equivalent to the amount excreted, is used to determine<br />
an adequate intake.<br />
With this type of experimental study, a group of<br />
similar subjects is initially adapted to a low level of the<br />
nutrient of interest while all other <strong>dietary</strong> components<br />
are provided at levels thought to be adequate. Graded<br />
levels of the nutrient are then provided (usually in<br />
random order) to determine the level of intake that<br />
provides a balance between excretion and intake. At<br />
this steady-state or equilibrium condition, the nutrient<br />
requirement is considered to be met. The most<br />
useful data from this approach are derived when the<br />
levels of intake tested are below and just above that<br />
required by the individual, and in which at least three<br />
levels of intake are tested; it is necessary that at least<br />
one level of intake be below the individual’s requirement.<br />
The amount of the nutrient consumed can then<br />
be compared against the difference between intake and<br />
excretion. The data can <strong>for</strong>m a regression equation<br />
that allows the determination of where equilibrium<br />
(intake = output) would occur <strong>for</strong> the group. This point<br />
of equilibrium represents the average requirement or<br />
ANR <strong>for</strong> the individuals included in the study.<br />
This method, although it is frequently applied to<br />
nutrients such as trace elements <strong>for</strong> which metabolism<br />
does not alter the basic chemical identity, has significant<br />
limitations; considered a black-box approach, it<br />
is justly criticized <strong>for</strong> not taking into account or measuring<br />
the extent of metabolic adaptation required to<br />
maintain homeostasis occurring as the body maximally<br />
conserves the nutrient at marginal levels of intake to<br />
prevent the adverse effects of inadequacy. Newer methods,<br />
such as the use of isotopic tracers, have provided<br />
better and more in-depth understanding of changes<br />
in response to varying intake levels occurring, rather<br />
than solely depending on estimating nutrient balance.<br />
Depletion/repletion study. Another similar metabolic<br />
study design is depletion/repletion. In this type<br />
of experimental study, all nutrients are provided in<br />
amounts thought to be adequate except <strong>for</strong> the nutri-
S42<br />
ent under study; a diet may have to be artificially<br />
constructed to attain a goal of negligible amounts<br />
of the study nutrient. The effects of the diet lacking<br />
the nutrient are followed in a group of subjects until<br />
observable signs or symptoms of inadequacy appear;<br />
early signs may be abnormal biochemical or neurological<br />
measures indicating abnormal metabolism. Once<br />
the effects of mild depletion are ascertained, the nutrient<br />
is given to the group of individuals under study in<br />
incremental amounts to see at what dose (intake) the<br />
abnormal signs or measures return to normal. With<br />
this type of study, it is possible to identify candidates <strong>for</strong><br />
the appropriate indicator or criterion of adequacy, as<br />
well as see how responsive the criterion is to repletion<br />
of the nutrient. This type of study is useful <strong>for</strong> nutrients<br />
<strong>for</strong> which it is not possible to collect excretion products<br />
that would represent turnover of the nutrient.<br />
Animal studies. For a few nutrients, there may be<br />
few quantitative data available that relate <strong>dietary</strong> intake<br />
in human subjects to specific functional outcomes,<br />
whereas significant data from animal models may be<br />
available. Such data are particularly useful in establishing<br />
the probable mechanism of action and resulting<br />
adverse effects that will be experienced in humans as<br />
a result of inadequacy; however, without human correlates,<br />
such data have not been considered sufficient<br />
to define a quantitative relationship between intake<br />
and a noted criterion of adequacy. Because evidence of<br />
inadequacy <strong>for</strong> such a nutrient in humans consuming<br />
typical diets is lacking, there has been a hesitation to<br />
use animal studies to establish quantitative reference<br />
intakes. This is the case <strong>for</strong> nutrients such as silicon and<br />
possibly boron in the <strong>dietary</strong> reference intake (DRI)<br />
reviews [7]; animal models have been used to identify<br />
the essential role of a nutrient in metabolism <strong>for</strong> one or<br />
more species, but the lack of demonstrated deficiency<br />
or inadequacy in humans due to the ubiquitous nature<br />
of the nutrient has precluded the establishment of a<br />
reference standard <strong>for</strong> adequacy by extrapolation to<br />
estimate human requirements. However, in the case<br />
of potential adverse effects due to overconsumption,<br />
animal data have been used when human data are<br />
not available, with appropriate uncertainty factors to<br />
extrapolate from animals to humans (see Aggett [12]<br />
in this issue).<br />
Clinical signs and symptoms. Functional outcomes of<br />
inadequacy of a nutrient, such as a deficiency disease<br />
like scurvy, are easy to detect at advanced stages and<br />
even at early stages if they present with unique and<br />
well-known symptoms; such symptoms can be considered<br />
good indicators of adequacy, since symptoms such<br />
as bleeding gums and loose teeth are observable and<br />
taken together are not associated with other nutrient<br />
deficiencies. Other functional outcomes and their relationship<br />
to nutrients are less well understood and characterized,<br />
such as risk of fracture and calcium intake or<br />
potassium intake and hypertension. Although there is a<br />
relationship, it is not well understood due either to lack<br />
of data or to multiple causative factors that prevent the<br />
demonstration of a direct dose–response relationship<br />
between intake and outcome.<br />
Although the most valuable endpoints may be<br />
observable events, such as fracture, stroke, or myocardial<br />
infarction, studies of this type can take much<br />
longer and require many more subjects than studies<br />
in which surrogate markers are evaluated. The use of<br />
biomarkers or surrogate markers must be validated as<br />
clinically useful [13], in which mechanisms of action<br />
are established that support the relationship between<br />
the nutrient and the functional outcome [14].<br />
Epidemiologic associations. In 1971 Hill identified six<br />
important factors useful in establishing relationships<br />
between diet and disease [15] (table 2); although they<br />
have been modified slightly by others, they continue to<br />
aptly describe the required components of the relationship<br />
desired between a nutrient or bioactive <strong>food</strong> component<br />
and functional or disease outcome. Although<br />
they were developed <strong>for</strong> epidemiologic associations<br />
to assist in determining causation, they are equally<br />
applicable to experimental studies in which outcomes<br />
are evaluated when the level of nutrients is varied in<br />
diets. This type of in<strong>for</strong>mation is particularly useful in<br />
evaluating the role of diet in chronic disease onset.<br />
Observations in healthy populations. Nutrient intakes<br />
of populations in which individuals show no signs,<br />
symptoms, or indicators of inadequacy can also be used<br />
as the basis <strong>for</strong> setting nutrient standards; the nutrient<br />
intakes of a representative sample of individuals<br />
in the population are estimated and then assumed to<br />
be typical of all those in the population. Since there is<br />
no evidence of inadequacy, the amount consumed on<br />
average is assumed to be adequate <strong>for</strong> all. This is the<br />
basis <strong>for</strong> establishing most of the default recommended<br />
intake values in the DRI process, termed adequate<br />
intakes (AIs), a recommended intake reference standard<br />
used when it was not possible to determine a level<br />
at which half of a population group would have their<br />
needs met [7].<br />
It is possible to set a nutrient reference standard<br />
using observational in<strong>for</strong>mation from a representative<br />
sample of a healthy population group if the following<br />
conditions are met:<br />
» There is a comprehensive <strong>food</strong> and supplement<br />
database that includes the nutrient content of all the<br />
TABLE 2. Diet and disease relationships<br />
Strength of association<br />
Dose–response relationship<br />
Temporally correct association<br />
Consistency of association<br />
Specificity of association<br />
Biological plausibility<br />
Source: Hill [15].<br />
A. A. Yates
Establishing nutrient intake values<br />
<strong>food</strong>s and supplements consumed by the population<br />
of interest;<br />
» Very accurate intake data are captured <strong>for</strong> a long<br />
enough period of time to make the sample of days<br />
truly represent usual intake. For some nutrients, such<br />
as vitamin A, <strong>for</strong> which most of the nutrient intake<br />
comes from a few specific <strong>food</strong>s, the variation in<br />
daily intake is quite large [5].<br />
Intervention trials. Double-blind, randomized trials<br />
of nutrient requirements are considered by many to be<br />
of major importance in ascertaining individual nutrient<br />
requirements. To be most useful, this type of study provides<br />
three or more test levels of a nutrient in a typical<br />
diet to a group of subjects in a random or varied order;<br />
randomization avoids bias due to time (season) or<br />
duration of the study, which can be confounding variables.<br />
Keeping the study double-blinded, i.e., neither<br />
the study volunteers nor the personnel administering<br />
the diet know which level of intake is being provided,<br />
prevents both the subjects’ and the researchers’ possible<br />
expectations about requirements from biasing<br />
the outcomes.<br />
Lack of dose–response data directly linking <strong>dietary</strong><br />
intake with measured response. For many nutrients,<br />
few data are available that systematically tie the level<br />
of nutrient intake to an accepted and validated quantitative<br />
measure or metabolic criterion of adequacy.<br />
In these cases, other data described above have been<br />
used to establish nutrient standards that are associated<br />
with and thus imply adequacy. These include data from<br />
nutrient balance studies, epidemiologic observations<br />
of the prevalence of disease associated with lack of the<br />
nutrient, and intakes of apparently healthy population<br />
groups. Dose–response data may not be available <strong>for</strong><br />
many important nutrients; in these situations, a default<br />
INL such as the AI in the DRI process is provided; this<br />
default value, given a different name, represents a judgment<br />
of adequacy, and is not tied to an ANR.<br />
Frequently, data from other population groups<br />
(perhaps from other countries or cultures) can be used<br />
if the ANR is <strong>based</strong> on metabolic requirements, and<br />
adjustments made to take into account known differences<br />
in utilization (perhaps due to energy or climatic<br />
conditions) or known differences in metabolism (such<br />
as is frequently done when establishing ANRs <strong>for</strong> older<br />
age groups or <strong>for</strong> women when only data from men<br />
are available).<br />
Step 2: Estimate the variation in<br />
requirements<br />
Although much ef<strong>for</strong>t must be put into deciding on<br />
the best criterion or indicator of adequacy to use (the<br />
one that is most reflective of meeting nutrient needs),<br />
it is also necessary to estimate the variation in requirements<br />
<strong>for</strong> the indicator chosen in each subgroup of<br />
S43<br />
the population in order to develop goals <strong>for</strong> intake⎯a<br />
frequent policy and program need (see Vorster et al.<br />
[3] in this issue). This is an even more difficult task,<br />
and statistically small errors in its estimation can lead<br />
to great uncertainty in the resulting INL x .<br />
Responses of individuals to three or more levels of<br />
intake (the dose–response) in the chosen indicators<br />
or criteria of adequacy are evaluated to determine<br />
which is the lowest level of intake that corresponds to<br />
the indicator or criterion of adequacy being classified<br />
as “within the normal range” <strong>for</strong> each individual. The<br />
ANR is identified as the level of intake at which half of<br />
the individuals tested or observed are in the normal<br />
range and half are still in the abnormal range <strong>for</strong> the<br />
selected criterion of adequacy. The variation in this<br />
response, the standard deviation of the ANR (SD ANR ),<br />
represents the variation in requirements seen in the<br />
sample of the group evaluated at the multiple levels of<br />
intake. As described in Murphy and Vorster [2] in this<br />
issue, the SD ANR is used to increase the ANR to obtain<br />
the INL x at a desired level of coverage in the population<br />
group (where x = percentage of the population group<br />
covered).<br />
Factors that affect variation in requirements<br />
How many should be sampled? The type of experiment<br />
that is most useful in determining requirements<br />
depends on the nutrient of concern and how it is<br />
related to health, the methods available to determine<br />
its adequacy, and the resources that can be allocated to<br />
its evaluation. Although it would be ideal to establish<br />
an ANR <strong>based</strong> on requirement data obtained from each<br />
person in the population group of interest, this clearly<br />
is not feasible or really necessary. Appropriate sampling<br />
of the population, or of a very similar population, can<br />
provide data that are applicable to and descriptive of<br />
the overall group’s requirements. What sample size,<br />
then, is necessary to establish a nutrient intake value<br />
<strong>for</strong> adequacy?<br />
The size of the sample needed to estimate nutrient<br />
requirements depends on the type of study contemplated<br />
and its study design.<br />
Value <strong>based</strong> on epidemiologic evidence of adequacy.<br />
Epidemiologic studies that relate nutrient intake to<br />
associated behaviors or markers of adequacy in which<br />
there is little variability in the distribution of nutrient<br />
intakes result in little variation in the risk of inadequacy<br />
within the population, and there<strong>for</strong>e more individuals<br />
(a larger sample size) are needed to detect a significant<br />
association between intake and risk of disease.<br />
For example, in situations demonstrated by figure 2,<br />
where there is less variation in intake than in requirements,<br />
it is not possible to use the ANR to estimate the<br />
prevalence of inadequacy in this group, since one of the<br />
statistical assumptions <strong>for</strong> such a use of the ANR as a<br />
cutoff <strong>for</strong> prevalence of adequacy is that the variation in
S44<br />
���������<br />
�����������<br />
������������<br />
������<br />
������������<br />
���������� ������ �� ��������<br />
FIG. 2. Situation in which the ANR cannot be used to estimate<br />
prevalence of inadequacy. When the variability in the<br />
usual intakes of a group is less than the variability in requirements<br />
<strong>for</strong> a nutrient, the cut-point method, using the ANR<br />
to estimate the prevalence of inadequacy, cannot be applied.<br />
Other methods to estimate prevalence of inadequacy can<br />
be employed [5]. In order to detect rare but widely diverse<br />
requirements in a given population, much larger sample sizes<br />
are needed. (ANR, average nutrient requirement)<br />
intake is greater than the variation in requirements (see<br />
Murphy and Vorster [2] in this issue). Low variability<br />
in intake there<strong>for</strong>e leads to the need <strong>for</strong> a larger sample<br />
size [16] in order to obtain good estimates of the true<br />
variation that exists within the population.<br />
This need <strong>for</strong> very large sample sizes to determine<br />
normal small variation in responses and to differentiate<br />
normal variation from abnormal deviation due to differences<br />
in intake may be demonstrated when diet and<br />
disease relationships are observed in large population<br />
groups but are not subsequently statistically supported<br />
in clinical trials. Frequently such trials are said to be<br />
“underpowered,” since the sample size is not adequate<br />
to demonstrate a relatively rare effect that, although it<br />
may occur, will not show up in a random selection of a<br />
small group of individuals (the group sampled) to the<br />
extent that it would be considered as not occurring<br />
by chance. This has been given as a major reason that<br />
relationships evaluated in intervention trials of different<br />
<strong>dietary</strong> patterns and the subsequent incidence of<br />
cancers are less than conclusive, although large sets of<br />
observational data from population groups appear to<br />
demonstrate significant associations [13].<br />
When epidemiologic in<strong>for</strong>mation is used as the<br />
basis <strong>for</strong> determination of nutrient adequacy, the<br />
data or criteria chosen must be representative of the<br />
group of interest and adequately powered (by a large<br />
enough sample size) to detect relatively small differences<br />
in response (table 3). In order to have adequate<br />
power (1 − β) when small changes in chronic disease<br />
outcomes due to diet are evaluated, sample sizes need<br />
to be large.<br />
Values <strong>based</strong> on clinical trials or intervention studies.<br />
Statistics are available to estimate the sample size necessary<br />
to determine the ANR as well as the SD ANR in a<br />
population group of interest. Such methods require<br />
» Specifying the minimum difference needed <strong>for</strong> a<br />
clinically relevant or important indicator of adequacy<br />
(µ 1 – µ 0 );<br />
» Determining the level of confidence (1 − α) that the<br />
difference should represent between the response<br />
due to the variable tested versus a random occurrence;<br />
» The probability (1 − β) that if the specified minimum<br />
difference is not attained, then there truly is not a<br />
meaningful difference in response; and<br />
» An estimate of the probable variance (σ T ) in the<br />
overall population.<br />
If all these are determined, are available, or can be<br />
estimated, then this general <strong>for</strong>mula can be applied to<br />
obtain the relevant sample size:<br />
n = [2 (t α + t β ) σ/(µ 1 – µ 0 )] 2 .<br />
Although components such as (µ 1 – µ 0 ), α, and β can<br />
be set or defined by the researcher, the expected variance<br />
(σ) of the population can only be estimated, and<br />
this is not always possible to do well. A possible source<br />
of estimation is from other similar studies or previous<br />
work.<br />
Given the typical lack of data on human nutrient<br />
requirements that include usable estimates of variation,<br />
pilot studies or validation studies are frequently<br />
conducted prior to initiating expensive larger studies<br />
to get an idea of the variation in response present, thus<br />
providing an estimate of σ T . The costs of such pilot<br />
studies may make it impossible, though, to get estimates<br />
of the variation expected <strong>for</strong> use in determining<br />
the needed sample size. However, without determining<br />
the size of the sample needed to adequately evaluate a<br />
requirement, the study may be underpowered and not<br />
provide meaningful conclusions.<br />
Many studies of nutrient requirements must limit<br />
the number of subjects studied because of limitations<br />
in space, the number of samples, and the measurements<br />
that can be analyzed with available funds. The<br />
goal when testing multiple levels of intake is to see a<br />
nutritionally relevant difference in response; often this<br />
is not specifically set in advance, with the assumption<br />
that the statistical tests per<strong>for</strong>med will indicate what is<br />
statistically significant. It is then up to the researcher<br />
TABLE 3. Resulting β values <strong>for</strong> various sample sizesa N 100 200 300 400 500 600 700<br />
β 0.71 0.48 0.31 0.19 0.11 0.06 0.04<br />
a. Example <strong>for</strong> a given value of α (0.05), predicted mean (0.2), and clinically significant difference of 50%<br />
(0.10), β values are the probability of making a false negative conclusion (type II error).<br />
Source: Matthews and Farewell [17].<br />
A. A. Yates
Establishing nutrient intake values<br />
in analyzing the data to identify among statistically significant<br />
differences what is nutritionally relevant. For<br />
example, this difference might be the reduction in rate<br />
of fracture compared at each level of calcium intake.<br />
The null hypothesis, that there will be no difference,<br />
must be rejected if a difference is demonstrated in one<br />
or more treatments.<br />
Table 4 provides the theoretical framework of sample<br />
size calculations <strong>for</strong> correct and erroneous conclusions<br />
and the resulting probabilities of correct and erroneous<br />
conclusions. In two of the four cases identified in table<br />
4, the researcher reaches a correct conclusion. However,<br />
in the remaining two cases, the researcher is wrong,<br />
having reached either a false positive or a false negative<br />
conclusion. A larger sample will provide more in<strong>for</strong>mation<br />
about the response to the level tested and hence<br />
lead to a more precise estimate of the average requirement<br />
of the study population. There<strong>for</strong>e, by increasing<br />
the sample size, the ability to detect any real difference<br />
in responses to the level of intake is increased. Since<br />
α and β both represent probabilities of making an<br />
erroneous decision, in the best of all possible worlds<br />
the closer each is to zero, the better. However, if α is<br />
decreased (from, say, 0.05 to 0.01) without changing<br />
the total sample size, n, then β will necessarily increase<br />
(meaning that there is a greater chance of accepting<br />
the null hypothesis where there is truly a difference).<br />
Conversely, if β must decrease without changing n,<br />
then α necessarily increases. Only by increasing the<br />
sample size can a simultaneous reduction in both α<br />
and β be achieved [17].<br />
Other factors also influence the determination of an<br />
adequate sample size. They include the relative sizes of<br />
the treatment groups, possible dropout rates in these<br />
groups, and rates of treatment noncompliance.<br />
Variability in requirements. The variation measured<br />
in studies where multiple levels of intake are tested and<br />
the chosen criteria or indicators of adequacy are measured<br />
is the combined result of the following:<br />
» Biological differences in response to the level provided<br />
between individuals in the sample studied⎯termed<br />
interindividual variation;<br />
TABLE 4. Validity of conclusions: role of size of α and β<br />
Conclusions of study<br />
True situation<br />
Ho true<br />
Conclusions are<br />
Ho false<br />
Ho true Correct False positive<br />
(type I error)<br />
Ho false False negative<br />
(type II error)<br />
Probability of conclusions<br />
Correct<br />
Ho true 1 – α α<br />
Ho false β 1 – β<br />
Source: Matthews and Farewell [17].<br />
S45<br />
» Day-to-day variation in the response by a given individual<br />
due to differences in that person’s metabolism,<br />
activity, etc. on one day compared with another,<br />
which cause one day’s results to differ from another<br />
with no definable difference in diet⎯termed intraindividual<br />
variation;<br />
» Possible variation due to environmental factors<br />
that may be different <strong>for</strong> different individuals in<br />
the sample, depending on the extent that they are<br />
controlled <strong>for</strong> in the study;<br />
» Variation in the ability to accurately measure or<br />
estimate the criterion or indicator used⎯termed<br />
measurement error.<br />
In order to compensate <strong>for</strong> the very small sample<br />
sizes characteristic of most human experimental studies,<br />
well-controlled studies evaluating nutrient requirements<br />
are designed to minimize as many of these<br />
sources of variance as possible, with the exception of<br />
the variance resulting from biological differences. This<br />
then provides a more robust estimate of the variation<br />
due to differences in the actual requirements within a<br />
population group rather than to extraneous factors.<br />
In spite of the desirability of the inclusion in nutrient<br />
requirement studies of methods to control <strong>for</strong> other<br />
sources of variation, because of cost and availability<br />
of resources small sample sizes in the range of 6 to 12<br />
predominate, resulting in uncom<strong>for</strong>tably large variance<br />
in responses (SD ANR ). Since NIVs are also to provide<br />
guidance <strong>for</strong> use with individuals about an appropriate<br />
goal <strong>for</strong> intake, a recommended intake (such as<br />
the INL x , or the RDA [recommended <strong>dietary</strong> allowance]<br />
or AI in the DRI series) is provided. However, in<br />
the DRI process, when the variation in response was<br />
inaccurately broad and an estimate of the variability<br />
in requirements was needed to establish the RDA, a<br />
default coefficient of variation (CV ANR ) (Murphy and<br />
Vorster [2]) of 10% was used.<br />
Although the 10% value was used <strong>for</strong> many nutrients<br />
following its initial use with the first group of nutrients<br />
reviewed [8], to date the coefficient of variation of 10%<br />
has not been examined in any specific way in validation<br />
studies to ascertain its closeness to variability in<br />
requirements <strong>for</strong> the nutrients whose RDAs were<br />
developed using the default coefficient of variance<br />
(vitamin C, vitamin E, thiamin, riboflavin, vitamin B 6 ,<br />
folate, vitamin B 12 , copper, magnesium, phosphorus,<br />
selenium, and zinc [6, 7, 9]). Developing consensus <strong>for</strong><br />
the scientific basis <strong>for</strong> the development and application<br />
of such default assumptions is an important issue in<br />
moving toward harmonizing reference standards.<br />
Other factors in experimental design<br />
Number of treatments<br />
The number of levels of intake tested in a nutrient<br />
intervention or balance study also affects the ability to<br />
estimate requirements. Many studies may include two
S46<br />
levels of intake, comparing responses to determine<br />
which results in a more “adequate” diet relative to the<br />
criterion or indicator of adequacy chosen. Although it<br />
is possible to compare two levels of intake, given the<br />
types of variation that are independent of the level of<br />
nutrient consumed (see variability in requirements section,<br />
above), at least three levels of intake of a nutrient<br />
should be evaluated in the same individual.<br />
Data can then be evaluated <strong>for</strong> the parameters that<br />
best fit the data [18]; <strong>for</strong> example, two models currently<br />
used <strong>for</strong> individual amino acid requirements include<br />
fitting a smooth regression curve and estimating where<br />
it intersects the zero-balance line [19], and fitting a<br />
regression curve with an inflection point and estimating<br />
where that point lies [20]. Un<strong>for</strong>tunately, other than<br />
protein [21] and some of the amino acids [22], there<br />
are few nutrients <strong>for</strong> which such data are available <strong>for</strong><br />
analysis in this way.<br />
In evaluating protein requirements <strong>for</strong> children in<br />
the DRI process [10], it was necessary to group data<br />
<strong>for</strong> those aged 9 months through 14 years, since only<br />
seven studies could be identified in which individual<br />
data were provided and that could be used to obtain a<br />
regression curve. These studies were published from<br />
1980 through 1992, and no studies published since<br />
then were available. This analysis included a total of<br />
53 subjects from the seven studies from which data<br />
on multiple levels were available, plus an additional<br />
three studies with a total of 42 subjects <strong>for</strong> whom only<br />
group data were provided. It is of interest that only 16<br />
of the total of 95 children were over the age of 5 years,<br />
and almost all were boys (<strong>based</strong> on the data in the<br />
individual publications included, the number of girls<br />
could have been as high as 11 or as low as 2). The diets<br />
tested in these studies were not standardized:Some<br />
were animal-<strong>based</strong> (milk, egg), some were mixed (rice<br />
and fish; beans, wheat, milk), and some were vegetable<br />
(soybeans, rice and beans), and they came from geographically<br />
diverse areas: China, Chile, Guatemala, and<br />
the Philippines. Differentiation between boys and girls,<br />
particularly during puberty, was only possible relative<br />
to the amount of protein estimated <strong>for</strong> growth, and not<br />
<strong>for</strong> maintenance [10].<br />
Protein is one of the most studied nutrients, given<br />
its importance in normal growth in infants and young<br />
children and its frequent lack in the traditional diets<br />
of many developing countries. The above example<br />
demonstrates that, in spite of this, useful data to<br />
obtain requirement estimates, let alone estimates of<br />
the amount needed <strong>for</strong> growth in children, are woefully<br />
inadequate.<br />
Publication bias<br />
Although estimates of human requirements are <strong>based</strong><br />
on published data, among the assumptions made in<br />
reviewing such studies is that the published literature<br />
reflects all the data that are worth reviewing. Par-<br />
ticularly where equivocal results occur, the tendency of<br />
journals to publish papers only if the results reported<br />
are significant at the conventional level of p < .05 [22]<br />
means that there may be a tendency of journals to reject<br />
research studies as underpowered when differences<br />
do not appear statistically significant. Meta-analyses<br />
of studies related to cancer that have been published<br />
versus all studies related to cancer have demonstrated<br />
a preference <strong>for</strong> reporting only endpoints that produce<br />
the best results [23]; whether this is true of nutrient<br />
requirements is unknown.<br />
Nutrient–nutrient interactions<br />
Although it is not usually evaluated in carefully controlled<br />
double-blind studies, the influence of other<br />
nutrients on absorption and metabolism of the nutrient<br />
under study is an important factor to consider in<br />
evaluating data from different studies. Bioavailability<br />
issues (see Gibson [11]) can also influence the data and<br />
need to be carefully considered.<br />
Energy requirements<br />
As briefly described by Murphy and Vorster [2] in this<br />
issue, estimating energy requirements represents a special<br />
situation when NIVs are being developed. Unlike<br />
the case with other nutrients, the adequacy (and excess)<br />
of energy needs are readily assessed by individuals from<br />
changes in body weight. Also unlike the case with other<br />
nutrients, physiological mechanisms provide immediate<br />
in<strong>for</strong>mation to individuals that intake should be<br />
increased or curtailed; thus, energy intake is not independent<br />
of energy requirements, one of the statistical<br />
assumptions upon which the use of the ANR is <strong>based</strong><br />
(see Murphy and Vorster [2]). Since estimates of energy<br />
requirements are needed <strong>for</strong> program development<br />
and <strong>for</strong> planning diets, somewhat different steps are<br />
followed both to estimate energy requirements and to<br />
then apply them to individuals and groups.<br />
Energy requirement criteria<br />
A. A. Yates<br />
As with nutrients, the body can metabolically adapt to<br />
lower levels of energy intake on a chronic basis. This<br />
has been studied recently in some detail [24]. The<br />
definition accepted by international working groups of<br />
the amount needed to meet energy requirements can<br />
be used as defining what is “adequate” <strong>for</strong> humans: the<br />
amount needed to balance energy expenditure in order<br />
to maintain a body size, body composition, and level of<br />
physical activity consistent with good health [24]. This<br />
includes the energy needed <strong>for</strong> optimal growth and<br />
development in children, deposition of tissue during<br />
pregnancy, and normal lactation.<br />
The recommended levels of energy intake <strong>for</strong> individuals<br />
are the levels that provide adequate energy to
Establishing nutrient intake values<br />
each person in a population group. With the growing<br />
problem of obesity and overweight, it is more difficult<br />
to determine what the mean energy intake of a group<br />
should be to meet the requirements of all members of<br />
the group, yet not result in overconsumption by some.<br />
Unlike the use of average population intakes <strong>for</strong> nutrients<br />
in apparently healthy populations as surrogates <strong>for</strong><br />
an INL x where dose–response data are not available,<br />
average energy intakes cannot be used, as most populations<br />
in both developed and developing countries<br />
are now experiencing adverse effects associated with<br />
excess consumption of energy, inadequate physical<br />
activity, or both.<br />
Methods of estimating energy requirements<br />
Similar to nutrients, energy requirements measured<br />
in individuals with similar characteristics, such as<br />
age, body size, sex, and physical activity levels, vary;<br />
the variation seen in observed requirements assumes<br />
a normal distribution. When energy expenditure<br />
over time (e.g., 2 to 3 weeks) is measured carefully<br />
in a sample of individuals whose characteristics are<br />
known, it is possible to develop estimates of energy<br />
requirements <strong>for</strong> the group, along with a measure of<br />
the variance in those requirements among the individuals<br />
in the sample. These requirement distributions<br />
have been used to predict the requirements <strong>for</strong> other<br />
individuals with similar characteristics. One of the<br />
advances in the ability to develop good predictions of<br />
energy requirements is the ability now to use tracer<br />
methodology, such as doubly labeled water, to obtain<br />
independent estimates of energy expenditure without<br />
perturbing the environment of the individual [10].<br />
Older methods estimated expenditure indirectly (e.g.,<br />
metabolic hoods) or estimated <strong>food</strong> intake and derived<br />
the amount of energy consumed, equating it with the<br />
amount expended.<br />
Components of energy requirements<br />
As outlined in the definition of energy requirements,<br />
the energy required <strong>for</strong> five general components makes<br />
up the total human energy requirement: basal metabolism,<br />
metabolic response to <strong>food</strong>, physical activity,<br />
growth, and needs during pregnancy and lactation.<br />
Early studies of energy requirements, in which the<br />
method used to estimate energy expenditure itself<br />
influenced the energy requirement, often involved<br />
estimating each of these individually and summing<br />
the total to get the total energy required. With the<br />
advent of doubly labeled water, prediction equations<br />
that take into account all of these energy components<br />
have been developed. Recently, doubly labeled water<br />
has been used as well to validate other methods to estimate<br />
energy requirements that are less expensive and<br />
more adaptable to different settings, such as heart-rate<br />
monitoring [24].<br />
S47<br />
Equations that are derived from these data depend<br />
on the accuracy of the method employed and the extent<br />
to which variables in energy expenditure are included<br />
as identified factors that influence energy requirements.<br />
Sex, age, body weight (or body mass index<br />
[BMI]), and level and types of physical activity have<br />
been found to have the greatest effect on total energy<br />
requirements [10, 24].<br />
Prediction equations now available are useful as<br />
initial estimates of energy requirements <strong>for</strong> other<br />
similar population groups, assuming that the in<strong>for</strong>mation<br />
about the population subgroup (i.e., age, body<br />
weight [BMI], and activity level) is known. Prediction<br />
(regression) equations developed to date have<br />
estimates of variation as well, and these provide the<br />
ranges (representing expected variation) that would<br />
be predicted in actual requirements as compared with<br />
the point estimates obtained from the regression equations<br />
[10, 24].<br />
Use of prediction equations as NIVs<br />
Tables have been constructed that translate the prediction<br />
equations into estimates of energy requirements<br />
by age, sex, physical activity, and/or body weight;<br />
these can be applied to other population groups after<br />
adjustment <strong>for</strong> known differences in physical activity,<br />
body size, and other variables that may not be included<br />
in the tables. In<strong>for</strong>mation on how best to use the data<br />
and in<strong>for</strong>mation is provided in the reports [10, 24] that<br />
have developed the prediction equations and should be<br />
used as a starting point <strong>for</strong> group-specific estimates of<br />
energy requirements.<br />
Summary<br />
In establishing nutrient intake values (NIVs) to meet<br />
requirements (and usually <strong>for</strong> excess intakes), it is<br />
important to specify the criterion or indicator of adequacy<br />
or excess that is selected and to be transparent in<br />
the dataset used to set the NIV. For almost all nutrients<br />
studied to date, there exists a continuum of definable<br />
functions, most of which are impaired at low levels of<br />
intake, whereas at high levels of intake all appear to<br />
function normally or to be within the normal range.<br />
Choice of the indicator will dictate the amount of the<br />
nutrient that meets an individual’s requirement, as<br />
defined by that indicator. Datasets from dose–response<br />
studies in which nutrients at multiple levels (at least<br />
three) are given to the same individuals and in which at<br />
least one level results in measured abnormal responses<br />
or functions are important to serve as the basis <strong>for</strong><br />
determining average nutrient requirements (ANRs).<br />
Of equal if not greater importance is the distribution<br />
of requirements in a group; variation in requirements<br />
can be due to differences in metabolism, but also to<br />
differences in environment and diet. A key component
S48<br />
in evaluating data of potential use is the sample size<br />
needed to provide a high degree of confidence in the<br />
level of intake determined to be required. In moving<br />
toward harmonizing NIVs, consensus and agreement<br />
on what data should be used to establish NIVs (which<br />
References<br />
1. King JC, Garza C. Introduction. Food Nutr Bull<br />
2007;28(suppl):S13–5.<br />
2. Murphy SP, Vorster HH. Methods <strong>for</strong> using nutrient<br />
intake values (NIVs) to assess or plan nutrient intakes.<br />
Food Nutr Bull 2007;28(suppl):S51–60.<br />
3. Vorster HH, Murphy SP, Allen LH, King JC. Application<br />
of nutrient intake values (NIVs). Food Nutr Bull 2007;<br />
28(suppl):S116–22.<br />
4. Atkinson SA, Koletzko B. Determining life-stage groups<br />
and extrapolating nutrient intake values (NIVs). Food<br />
Nutr Bull 2007;28(suppl):S61–76.<br />
5. Institute of Medicine. Dietary reference intakes: Applications<br />
in <strong>dietary</strong> assessment. Washington, DC: National<br />
Academy Press, 2000.<br />
6. Institute of Medicine. Dietary reference intakes <strong>for</strong><br />
vitamin C, vitamin E, selenium, and carotenoids. Washington,<br />
DC: National Academy Press, 2000.<br />
7. Institute of Medicine. Dietary reference intakes <strong>for</strong> vitamin<br />
A, vitamin K, arsenic, boron, chromium, copper,<br />
iodine, iron, manganese, molybdenum, nickel, silicon,<br />
vanadium, and zinc. Washington, DC: National Academy<br />
Press, 2001.<br />
8. Institute of Medicine. Dietary reference intakes <strong>for</strong> calcium,<br />
phosphorus, magnesium, vitamin D, and fluoride.<br />
Washington, DC: National Academy Press, 1997.<br />
9. Institute of Medicine. Dietary reference intakes <strong>for</strong><br />
thiamin, riboflavin, niacin, vitamin B 6 , folate, vitamin<br />
B 12 , pantothenic acid, biotin, and choline. Washington,<br />
DC: National Academy Press, 1998.<br />
10. Institute of Medicine. Dietary reference intakes <strong>for</strong><br />
energy, carbohydrate, fiber, fat, fatty acids, cholesterol,<br />
protein, and amino acids. Washington, DC: National<br />
Academies Press, 2002.<br />
11. Gibson RS. The role of diet- and host-related factors<br />
in nutrient bioavailability and thus in nutrient<strong>based</strong><br />
<strong>dietary</strong> requirement estimates. Food Nutr Bull<br />
2007;28(suppl):S77–100.<br />
12. Aggett PJ. Nutrition risk assessment:Setting upper levels<br />
and an opportunity <strong>for</strong> harmonization. Food Nutr Bull<br />
2007;28(suppl):S27–37.<br />
A. A. Yates<br />
of the possible criteria should be chosen, what datasets<br />
are the most appropriate, and how best to adjust<br />
when data are missing) represent a major obstacle to<br />
overcome.<br />
13. McShane LM, Altman DG, Saueerbrei W. Identification<br />
of clinically useful cancer prognostic factors: What are<br />
we missing? J Natl Cancer Inst 2005;97:1023–5.<br />
14. Lader EW, Cannon CP, Ohman EM, Newby LK, Sulmasy<br />
DP, Barst RJ, Fair JM, Flather M, Freedman JE, Frye RL,<br />
Hand MM, Jesse RL, Van de Werf F, Costa F; American<br />
Heart Association. The clinician as investigator. Participating<br />
in clinical trials in the practice setting. Appendix<br />
1: Fundamentals of study design. Circulation 2004;<br />
109:e302–4.<br />
15. Hill AB. Principles of medical statistics, 9th ed. New<br />
York: Ox<strong>for</strong>d University Press, 1971.<br />
16. McKeown-Eyssen GE, Thomas DC. Sample size determination<br />
in case-control studies: The influence of the<br />
distribution of exposure. J Chronic Dis 1985;38:559–68.<br />
17. Matthews DE, Farewell VT. Understanding and using<br />
medical statistics, 2nd revised ed. Basel, Switzerland:<br />
Karger, 1988.<br />
18. Rand WM. Variability in planning and assessment:<br />
Statistical considerations and models. J Nutr 2004;134(6<br />
suppl):1610S–6S.<br />
19. Rand WM, Young VR. Statistical analysis of nitrogen<br />
balance data with reference to the lysine requirement<br />
in adults. J Nutr 1999;129:1920–6.<br />
20. Zello GA, Pencharz PB, Ball RO. Phenylalanine flux,<br />
oxidation, and conversion to tyrosine in humans studied<br />
with L-[I- 13 C]phenylalanine. Am J Physiol 1990;259(6<br />
pt 1):E835–43.<br />
21. Rand WM, Pellett PL, Young VR. Meta-analysis of nitrogen<br />
balance studies <strong>for</strong> estimating protein requirements<br />
in healthy adults. Am J Clin Nutr 2003;77:109–27.<br />
22. Lehmann EL. Testing statistical hypotheses, 2nd ed. New<br />
York: Wiley, 1986.<br />
23. Kyzas PA, Loizou KT, Ioannidis JP. Selective reporting<br />
biases in cancer prognostic factor studies. J Natl Cancer<br />
Inst 2005;97:1023–55.<br />
24. Food and Agriculture Organization. Human energy<br />
requirements. Report of a Joint FAO/WHO/UNU<br />
Expert Consultation. Food and Nutrition Technical<br />
Report Series No. 1. Rome: FAO, 2004.
Establishing nutrient intake values<br />
Annex<br />
Example of deriving an average nutrient<br />
requirement (ANR): vitamin A<br />
Vitamin A functions in many biological systems:<br />
11-cis-retinal, the active aldehyde <strong>for</strong>m of vitamin A,<br />
is part of rhodopsin, required <strong>for</strong> vision in the brain,<br />
<strong>for</strong> normal growth and maintenance of the cornea<br />
and conjunctival membranes of the eye (to prevent<br />
xerophthalmia), and as a regulator of genes that <strong>for</strong>m<br />
structural proteins, enzymes, and retinol-binding proteins<br />
in the blood, including those involved in normal<br />
embryonic development and immune function related<br />
to cytokines and T and B lymphocyte production [7].<br />
It is not surprising that some of these functions continue<br />
normally at comparatively low levels of intake,<br />
while others are depressed or inactive, resulting in<br />
detectable changes in indicators that denote vitamin<br />
A inadequacy.<br />
In selecting the indicators or functional outcomes<br />
to use to establish an ANR and an NIV x <strong>for</strong> vitamin A,<br />
a number of choices are available (see Annex table 1).<br />
In reviewing research and studies available in the year<br />
2000, the DRI process selected as the main criterion<br />
to establish adequacy <strong>for</strong> vitamin A in Canada and<br />
the <strong>United</strong> States adequate liver stores, with adequacy<br />
defined as at least 20 µg retinol/g liver tissue. This<br />
resulted in an EAR (estimated average requirement,<br />
TABLE 1. Possible indicators <strong>for</strong> evaluating vitamin A adequacy<br />
S49<br />
equivalent to an ANR) of 625 µg/day <strong>for</strong> men and 500<br />
µg/day <strong>for</strong> women 19 years of age and older [7].<br />
However, it is recognized that significant liver retinol<br />
stores are not required <strong>for</strong> normal function. Thus, dark<br />
adaptation was identified as the most sensitive criterion<br />
<strong>for</strong> which adequate data were available to establish an<br />
average requirement. There were data supporting the<br />
ability of dark adaptation to identify individuals with<br />
inadequate intakes of vitamin A, and there were data<br />
from individuals inadequate in vitamin A whose dark<br />
adaptation was measured and who then were given various<br />
levels of vitamin A and underwent additional dark<br />
adaptation tests to ascertain at what level of intake the<br />
function returned to normal. The level at which dark<br />
adaptation returned to normal (defined as at least –4.6<br />
± 0.3 log candela/m 2 ) in half of those studied (while<br />
dark adaptation in the other half remained abnormal)<br />
was 300 µg/day. This could be considered the ANR<br />
<strong>for</strong> vitamin A <strong>based</strong> on dark adaptation. One of the<br />
primary limitations of selecting this criterion was that<br />
there were only 13 individuals studied in this way.<br />
According to this example, when the selected criterion<br />
or indicator of adequacy is dark adaptation, the<br />
ANR is 300 µg; this is less than half the amount identified<br />
if liver stores at the level of 20 µg/g are chosen (650<br />
µg) [7]. This demonstrates that the important question<br />
that must be asked in establishing nutrient requirements,<br />
and a potential barrier to harmonizing such<br />
Function Test Definition of adequacy<br />
Dark adaptation Dark adaptometry: final dark-adapted<br />
threshold after 35–40 min<br />
Circulating levels of vitamin<br />
A<br />
≥ – 4.6 ± 0.3 log candela/m 2<br />
Pupillary response test A high threshold in response to incremental<br />
pulses of light = low retinal sensitivity due to<br />
vitamin A deficiency<br />
Serum or plasma retinol concentration; retinol-binding<br />
protein concentration<br />
Total liver reserves (TLR) Isotope dilution using TLR = F × dose × [(H:<br />
D) – 1]; F = efficiency of storage of early<br />
administered dose; dose = dose of labeled<br />
retinol; H:D = ratio of H to 2 H-retinol in<br />
plasma after equilibration<br />
Relative dose–response<br />
(RDR)<br />
Modified relative dose–<br />
response (MRDR)<br />
Conjunctival impression<br />
cytology (CIC)<br />
Change in plasma retinol concentration in<br />
response to a test dose after 5 h<br />
Amount of test dose vitamin A 2 (dehydroretinol)<br />
appearing in plasma after 5 h<br />
Microscopic examination of periodic acid<br />
Schiff–hematoxylin-stained epithelial cells<br />
Immune function Humoral antibody responses and cell-mediated<br />
immunity<br />
Source: Institute of Medicine [7].<br />
Considered insensitive indicators and thus<br />
not used<br />
TLR ≥ 20 µg/g retinol<br />
RDR < 20%<br />
MRDR < 20%<br />
Lack of abnormal cells<br />
Normal number of natural killer cells and<br />
normal cytotoxic activity
S50<br />
requirements, is “adequate <strong>for</strong> what?” What criterion<br />
or outcome is selected?<br />
Given the small number of subjects (13) whose data<br />
were used in the DRI process to determine the EAR<br />
<strong>for</strong> dark adaptation <strong>for</strong> vitamin A, it was also difficult<br />
to estimate the variation in requirements <strong>based</strong> on this<br />
criterion. There<strong>for</strong>e, other data were used⎯the half-life<br />
of labeled vitamin A in individuals with the first clinical<br />
signs of vitamin A deficiency⎯to determine the<br />
variance to use <strong>for</strong> vitamin A. This half-life was estimated<br />
to have a coefficient of variation of 21%. Thus,<br />
20% was used in establishing the RDA <strong>for</strong> vitamin<br />
A. A. Yates<br />
A from the EAR, resulting in an RDA of 900 µg/day<br />
(650 µg + 2 × 20% = 900 µg) [7].<br />
The RDA might well have been 420 µg (300 µg + 2<br />
× 20%) if the criterion chosen as the basis <strong>for</strong> the recommendation<br />
had been prevention of night-blindness.<br />
This becomes a risk management question <strong>for</strong> policy<br />
makers: given the continuum of nutrient-related functions<br />
that demonstrate increasingly severe symptoms<br />
or functioning with decreasing intake, what should be<br />
the achievable goal? In the DRI process <strong>for</strong> Canada<br />
and the <strong>United</strong> States, a small amount of liver storage<br />
of vitamin A was selected.
Methods <strong>for</strong> using nutrient intake values (NIVs)<br />
to assess or plan nutrient intakes<br />
Suzanne P. Murphy and Hester H. Vorster<br />
Abstract<br />
This article describes the methods <strong>for</strong> using nutrient<br />
intake values (NIVs) to plan and assess intakes of both<br />
individuals and population groups. The advantages of<br />
the more recent standards, which use an average nutrient<br />
requirement (ANR) and its standard deviation to<br />
describe the distribution of nutrient requirements, are<br />
highlighted. The goal of assessing the intake of an individual<br />
is to determine the probability that the person’s usual<br />
diet is meeting his or her nutrient needs and whether the<br />
person is at risk <strong>for</strong> adverse effects from excessive intakes,<br />
whereas the goal of planning an individual’s intake is to<br />
ensure that the probability of inadequate intake and the<br />
likelihood of excessive intake are both small. The goal of<br />
assessing intakes of groups is to determine the prevalence<br />
of inadequate intakes and the prevalence of potentially<br />
excessive intakes, whereas the goal of planning nutrient<br />
intakes <strong>for</strong> groups is to minimize the prevalence of<br />
inadequate intakes and also to minimize the prevalence<br />
of potentially excessive intakes. For all of these goals, it is<br />
important to utilize appropriate <strong>food</strong>-composition tables<br />
and accurate <strong>dietary</strong> assessment methods. To fully utilize<br />
the new paradigm, it will be necessary <strong>for</strong> the professional<br />
nutrition community to identify ways to implement<br />
these new procedures in nutrition research and nutrition<br />
programs, to describe the strengths and weaknesses of<br />
the results, and to contribute to the evolution of both the<br />
theory and the application of the NIVs when planning<br />
and assessing diets.<br />
Suzanne P. Murphy is affiliated with the University of<br />
Hawaii, Honolulu, Hawaii, USA; Hester H. Vorster is affiliated<br />
with North-West University (Potchefstroom Campus),<br />
Potchefstroom, South Africa.<br />
Please direct queries to the corresponding author: Suzanne<br />
P. Murphy, Cancer Research Center of Hawaii, 1236 Lauhala<br />
Street, Suite 407, Honolulu, HI, 96813 USA; e-mail: suzanne@<br />
crch.hawaii.edu.<br />
Key words: Assessing diets, average nutrient requirement,<br />
individual nutrient level, nutrient intake values,<br />
planning diets, upper nutrient level<br />
Introduction<br />
In the last 20 years, new knowledge and approaches<br />
have led to many new ways to use nutrient intake<br />
values (NIVs). The purpose of this article is to describe<br />
the appropriate uses of nutrient-<strong>based</strong> <strong>dietary</strong> recommendations<br />
and to illustrate how they can be implemented<br />
<strong>for</strong> both individuals and population groups.<br />
The concepts and terminology <strong>for</strong> NIVs as described<br />
by King et al. [1] in this issue will be used: the average<br />
nutrient requirement (ANR), the individual nutrient<br />
level (INL x ), and the upper nutrient level (UNL).<br />
The uses of NIVs fall into two broad categories:<br />
they may be used to assess <strong>dietary</strong> intakes and to plan<br />
<strong>dietary</strong> intakes [2, 3]. Assessment involves determining<br />
the probable adequacy or inadequacy of intakes<br />
<strong>for</strong> individuals and the prevalence of adequate (or<br />
inadequate) intakes <strong>for</strong> population groups. Planning<br />
involves setting intake targets <strong>for</strong> individuals and<br />
determining desirable intake distributions <strong>for</strong> groups.<br />
Assessment and planning are often used iteratively, first<br />
to assess a nutritional situation, then to plan an intervention<br />
to improve the situation, and finally, to assess<br />
the impact of the intervention. Several hypothetical<br />
examples of the correct uses of NIVs are given at the<br />
end of this article.<br />
There are many specific applications that involve<br />
either assessing or planning diets. Assessment applications<br />
include evaluating the adequacy of a person’s diet<br />
and determining the prevalence of inadequacy using<br />
national surveys. Planning applications are numerous<br />
and include <strong>dietary</strong> counseling and the design of feeding<br />
programs. Vorster et al. [4] in this issue discuss<br />
these applications in more detail.<br />
Food and Nutrition Bulletin, vol. 28, no. 1 (supplement) © 2007, The <strong>United</strong> <strong>Nations</strong> University. S51
S52<br />
A new paradigm <strong>for</strong> calculating the<br />
probability of nutrient adequacy<br />
Because the ANR and its standard deviation describe a<br />
distribution of requirements, it is possible to calculate<br />
the probability that usual long-term intake at a given<br />
level is adequate. Such probability estimates require<br />
knowledge of the distribution of requirements and<br />
are not possible if the requirement is stated as a single<br />
number. The calculation is <strong>based</strong> on the assumption<br />
that intake is independent of requirement. That is, a<br />
person with a higher requirement <strong>for</strong> a nutrient does<br />
not necessarily select a diet that is higher in the nutrient.<br />
This assumption is clearly violated <strong>for</strong> energy<br />
intake, but there is no persuasive evidence that intakes<br />
are related to requirements <strong>for</strong> vitamins and minerals.<br />
On the assumption of independence of intake and<br />
requirement, the probability that a person’s usual intake<br />
is adequate can be statistically determined from the<br />
distribution of requirements that is described by the<br />
ANR and its variation (fig. 1). For example, if a person’s<br />
usual intake is equal to the ANR, the probability<br />
of adequacy (using the chosen criterion of adequacy)<br />
is, by definition, 50%, because it meets the needs of<br />
half of all the people who were studied. If a person’s<br />
usual intake is equal to the ANR plus 2 SD of the<br />
requirement, the probability of adequacy is about 98%,<br />
because only 2% of individuals in the group would have<br />
a higher requirement. If an individual’s usual intake<br />
is equal to the ANR minus 2 SD, then the probability<br />
of inadequacy is only 2%, because almost everyone<br />
would have a higher requirement. A simple statistical<br />
algorithm can calculate the probability of adequacy <strong>for</strong><br />
any given intake <strong>based</strong> on the ANR and its distribution<br />
(by calculating the area under the requirement curve,<br />
such as the one in figure 1, which is to the left of the<br />
intake value) [5]. Note that it is possible to calculate<br />
either the probability of adequacy (the area to the left of<br />
the intake value) or the probability of inadequacy (the<br />
area to the right of the intake value). The probability of<br />
���������<br />
�����������<br />
���<br />
��� ���<br />
������ ��������<br />
������� �������<br />
FIG. 1. Graph of a hypothetical distribution of nutrient<br />
requirements and adverse effects as the amount of a nutrient<br />
consumed increases<br />
inadequacy is 100 minus the probability of adequacy.<br />
For a group of individuals, the prevalence of adequacy<br />
(or inadequacy) can be estimated as the average probability<br />
of adequacy (or inadequacy) within the group.<br />
Although it is necessary to know (or estimate) the<br />
distribution of requirements to calculate the probability<br />
of adequacy (<strong>for</strong> individuals) or the prevalence<br />
of adequacy (<strong>for</strong> groups), requirements do not have<br />
to be normally distributed. For example, iron requirements<br />
<strong>for</strong> menstruating women are skewed, but a<br />
requirement distribution can be described in a tabular<br />
<strong>for</strong>mat, as was done <strong>for</strong> the <strong>dietary</strong> reference intakes<br />
(DRIs) <strong>for</strong> the <strong>United</strong> States and Canada [6]. For such<br />
nutrients, an individual’s probability of adequacy can<br />
be determined simply by locating the correct table (<strong>for</strong><br />
the person’s age and sex) and selecting the probability<br />
of adequacy that corresponds to the person’s usual<br />
intake. However, as discussed in more detail below,<br />
a shortcut to the probability approach <strong>for</strong> estimating<br />
the prevalence of adequacy <strong>for</strong> groups (the “cutpoint”<br />
method) cannot be used if the requirement distribution<br />
is not symmetrical.<br />
Using NIVs <strong>for</strong> assessment and planning<br />
<strong>for</strong> individuals<br />
Assessing nutrient intakes of individuals<br />
Goal<br />
The goal of assessing the intake of an individual is to<br />
determine the probability that the person’s usual diet<br />
is meeting his or her nutrient needs and whether the<br />
person is potentially at risk <strong>for</strong> adverse effects from<br />
excessive intake [2, 7, 8]. However, it is difficult to<br />
know if an individual’s nutrient intake is adequate,<br />
because the person’s actual nutrient requirements are<br />
usually unknown, and an accurate measure of the<br />
person’s usual, long-term nutrient intake is almost<br />
never available. Although the probability of adequacy<br />
can be calculated, as described above, the result is only<br />
meaningful if the usual nutrient intake <strong>for</strong> a person<br />
is known. Because of day-to-day variation in intakes,<br />
it is usually necessary to observe a person’s diet over<br />
many days when an accurate estimate of usual intake<br />
is needed. This is seldom feasible, so calculation of the<br />
probability of inadequacy <strong>for</strong> an individual may not<br />
be meaningful. Indeed, it may be more appropriate to<br />
monitor physiological measures (such as blood markers<br />
of anemia) rather than rely on intakes that were<br />
observed <strong>for</strong> a small number of days.<br />
Calculating the confidence of adequacy<br />
S. P. Murphy and H. H. Vorster<br />
Another approach to assessing an individual’s intake<br />
is to calculate the confidence that the usual intake is<br />
adequate, which considers the number of days on<br />
which the intake was observed, as well as how far the
Using nutrient intake values to assess intakes<br />
observed intake is above (or below) the ANR and the<br />
observed day-to-day variation in intake of that nutrient.<br />
For example, a usual intake that is 2 SD above the<br />
ANR should have a 98% probability of adequacy, but if<br />
intake was observed on only 3 days, the confidence of<br />
adequacy would be lowered to about 85% if the day-today<br />
variation in intake was about 40%. This calculation<br />
is described in detail in Appendix B of the Institute of<br />
Medicine report on using the DRIs <strong>for</strong> <strong>dietary</strong> assessment<br />
[2]. If the day-to-day variation is typically very<br />
high <strong>for</strong> a nutrient (as is the case <strong>for</strong> vitamins A and<br />
B 12 in the <strong>United</strong> States), it is not possible to calculate<br />
the confidence of adequacy, because it is likely that the<br />
assumption of normality is violated (the calculation of<br />
confidence of adequacy requires that the distribution<br />
of intakes across multiple days <strong>for</strong> the person must be<br />
normally distributed).<br />
Using the AI<br />
For nutrients <strong>for</strong> which an ANR cannot be established<br />
and only a safe intake or “adequate” intake (AI) is<br />
defined, a probability of adequacy cannot be calculated,<br />
because the distribution of requirements is unknown.<br />
In this case, it is only possible to make a qualitative<br />
evaluation of the person’s usual intake. If the AI is <strong>based</strong><br />
on the mean intake of a healthy population, then the<br />
usual intake of an individual above the AI is assumed to<br />
have a low probability of inadequacy. The adequacy of a<br />
usual intake below the AI cannot be evaluated. It is also<br />
possible to calculate the confidence that the usual intake<br />
is above the AI when intake is observed <strong>for</strong> only a few<br />
days [2]. This calculation is similar to the one described<br />
above <strong>for</strong> calculating the confidence of adequacy <strong>for</strong><br />
nutrients with an ANR. However, <strong>for</strong> nutrients with<br />
an AI, the result does not refer to adequacy in terms of<br />
meeting requirements, but only to the likelihood that<br />
the usual intake is above the AI.<br />
Assessing the risk of excessive intakes<br />
The possibility of excessive nutrient intakes may also<br />
be assessed qualitatively by comparing an individual’s<br />
usual intake with the UNL. Usual intake below the<br />
UNL has a low probability of being excessive, while<br />
usual intake above the UNL places a person at potential<br />
risk <strong>for</strong> adverse effects. As <strong>for</strong> the AI, it is possible to<br />
calculate the confidence that the usual intake is below<br />
the UL when intake is observed <strong>for</strong> only a few days<br />
[2]. However, a low confidence that the usual intake is<br />
below the UL does not mean that the adverse effect is<br />
likely to occur, but only that more days of intake should<br />
be observed be<strong>for</strong>e concluding that the risk of adverse<br />
effects is low.<br />
Assessing energy intakes<br />
Energy intakes <strong>for</strong> individuals may be assessed if an<br />
NIV <strong>for</strong> an average energy requirement has been<br />
established. The usual approach is to compare an indi-<br />
S53<br />
vidual’s usual energy intake to the NIV <strong>for</strong> energy. If<br />
the average energy requirement is accurately calculated<br />
(usually considering a person’s age, sex, and physical<br />
activity), then intakes above the mean would result<br />
in weight gain and intakes below the mean would<br />
result in weight loss. No probability of adequacy can<br />
be determined, because energy intake is almost always<br />
related to energy requirement, which violates one of the<br />
assumptions of the probability calculation.<br />
Assessing macronutrient intakes<br />
An individual’s macronutrient intakes (<strong>for</strong> percentage<br />
of energy from protein, fat, and carbohydrate) may also<br />
be compared with acceptable macronutrient distribution<br />
ranges (AMDRs) if this type of NIV has been set.<br />
Usual macronutrient intakes <strong>for</strong> an individual should<br />
fall within these ranges.<br />
Planning nutrient intakes of individuals<br />
Goal<br />
The goal of planning an individual’s intake is to ensure<br />
that the probability of inadequacy and the likelihood<br />
of excessive intake are both small [3, 9]. The goal <strong>for</strong> an<br />
individual’s usual nutrient intake is normally the INL x .<br />
If x = 98, then intake at INL 98 should be adequate <strong>for</strong><br />
almost all (98%) individuals. Other values of x could<br />
be considered, such as 95 or 90. An INL 95 would be<br />
adequate <strong>for</strong> 95% of individuals, whereas an INL 90<br />
would be adequate <strong>for</strong> 90%. The lower the value of x,<br />
the lower the probability that intake at that level will<br />
be adequate <strong>for</strong> an individual. The ANR is usually not<br />
an appropriate goal <strong>for</strong> an individual’s intake, because<br />
it would be adequate <strong>for</strong> only 50% of individuals <strong>based</strong><br />
on the chosen criterion of adequacy.<br />
Limitations of the INL x<br />
Setting an INL x requires knowledge about the distribution<br />
of requirements <strong>for</strong> the nutrient. Because these<br />
data are often sparse, an assumption is frequently made<br />
about the coefficient of variation of the requirement,<br />
because it is needed to adjust the ANR to obtain the<br />
INL x . For this reason, it has been argued that setting<br />
an INL x is not scientifically justified [10]. However,<br />
although more accurate data on distributions are<br />
needed, the INL x remains the best target <strong>for</strong> an individual’s<br />
nutrient intake [11].<br />
Considering upper levels<br />
Intakes of individuals should not exceed the UNL, since<br />
intakes above the UNL have a potential risk of adverse<br />
effects. Thus, to minimize the risk of inadequacy and<br />
the risk of excessive intakes, individuals should choose<br />
diets with usual nutrient intakes that are between the<br />
INL x and the UNL (fig. 1). For nutrients with an AI,<br />
nutrient intakes should be between the AI and the UL.
S54<br />
Planning energy and macronutrient intakes<br />
Energy intakes <strong>for</strong> individuals may be planned using<br />
the NIV <strong>for</strong> the average energy requirement as a<br />
target. An INL x is not usually set <strong>for</strong> energy intake,<br />
because intakes above the mean requirement would<br />
result in weight gain, which is usually undesirable.<br />
The calculation of the planned mean energy intake<br />
should consider both the person’s body size and his<br />
or her activity level. An example of this approach is<br />
provided in the DRI report on macronutrient intakes<br />
[12]. If AMDRs have been set <strong>for</strong> percentages of energy<br />
from fat, protein, and carbohydrate, then the goal <strong>for</strong><br />
planning an individual’s diet is to ensure that the usual<br />
intakes of these macronutrients by the individual fall<br />
within the ranges.<br />
Using NIVs <strong>for</strong> assessment and planning<br />
<strong>for</strong> groups<br />
Assessing nutrient intakes of groups<br />
Goal<br />
The goal of assessing intakes of groups is to determine<br />
the prevalence of inadequacy and the prevalence of<br />
potentially excessive intakes in the groups [2, 7, 8].<br />
Prevalence of inadequacy<br />
The prevalence of inadequacy is the proportion of the<br />
group whose intakes do not meet their requirements.<br />
Alternatively, the prevalence of adequacy can be calculated<br />
as the proportion of the group who do meet their<br />
requirements <strong>based</strong> on a defined criterion of adequacy.<br />
The prevalence of adequacy (expressed as a percentage)<br />
is equal to 100 minus the prevalence of inadequacy.<br />
Such prevalences should correspond to the proportion<br />
of the group that exhibits the functional outcome (or<br />
criterion) that was used to set the requirement distribution.<br />
If, <strong>for</strong> example, the vitamin C requirement was set<br />
at a level to prevent scurvy, then the prevalence of inadequacy<br />
should correspond to the prevalence of scurvy<br />
within the group. If it was set at a higher level with the<br />
goal of maintaining near-maximal neutrophil concentrations<br />
with minimal urinary loss, as was done in the<br />
<strong>United</strong> States and Canada [13], then the prevalence<br />
of inadequacy should correspond to the proportion<br />
of the population that does not exhibit near-maximal<br />
concentrations in their neutrophils.<br />
There are two ways to determine the prevalence of<br />
inadequacy (or adequacy) <strong>for</strong> a group: the full probability<br />
approach and the cutpoint method. The full<br />
probability approach involves calculating the probability<br />
of inadequacy <strong>for</strong> each person within the group and<br />
then taking the average [14]. The average probability<br />
of inadequacy is then equal to the prevalence of inadequacy.<br />
The cutpoint method is a shortcut of the full<br />
probability approach. The prevalence of inadequacy<br />
is estimated as the proportion of the group with usual<br />
intakes below the ANR. Neither of these methods<br />
requires that intakes be normally (or even symmetrically)<br />
distributed, but other assumptions must be met,<br />
as described below.<br />
Full probability approach<br />
The full probability approach uses the same calculation<br />
that was described <strong>for</strong> estimating the probability of<br />
inadequacy <strong>for</strong> an individual. This probability calculation<br />
is per<strong>for</strong>med by using the usual nutrient intake<br />
<strong>for</strong> each individual in the group and then determining<br />
the average probability. As noted above, the probability<br />
calculations assume that intake and requirements are<br />
independent, and of course, the distribution of requirements<br />
must be known.<br />
Cutpoint approach<br />
The cutpoint approach does not require the calculation<br />
of any probabilities and thus is easier to implement.<br />
The prevalence of inadequacy is simply estimated as<br />
the proportion of the group with usual intakes below<br />
the ANR (fig. 2). For example, if 35% of the group has<br />
usual intakes below the ANR, then the prevalence of<br />
inadequacy would be approximately 35%. However,<br />
the cutpoint approach still requires that intakes and<br />
requirements be independent. Although the requirement<br />
distribution does not have to be known <strong>for</strong> this<br />
method to be used, it must be approximately symmetrical.<br />
There<strong>for</strong>e, the cutpoint approach cannot be used<br />
to determine the prevalence of inadequate iron intakes<br />
<strong>for</strong> menstruating women, because the distribution of<br />
requirements is skewed. Finally, this approach works<br />
best if the actual prevalence of inadequacy is neither<br />
very high nor very low, and if the variability in intakes<br />
among individuals in the group is greater than the<br />
variability in requirements of the individuals. This last<br />
assumption is met by almost all intake distributions,<br />
but it is possible that the variability of intakes could be<br />
very low <strong>for</strong> groups who are eating similar amounts of<br />
���������<br />
���<br />
���� ���������<br />
���������� ��<br />
����������<br />
����� ������ ������������<br />
S. P. Murphy and H. H. Vorster<br />
�������<br />
FIG. 2. Graph of a hypothetical distribution of usual nutrient<br />
intakes <strong>for</strong> a group of people. The area to the left of the<br />
average nutrient requirement (ANR) represents an estimate<br />
of the proportion of the group with inadequate intakes (the<br />
prevalence of inadequacy)
Using nutrient intake values to assess intakes<br />
similar <strong>food</strong>s. In this case, the full probability approach<br />
should be used.<br />
As explained in more detail elsewhere [2], the cutpoint<br />
approach works <strong>for</strong> statistical reasons. It does<br />
not mean that the ANR is an appropriate cutpoint <strong>for</strong><br />
screening individuals. That is, it cannot be assumed<br />
that the individuals with intakes below the ANR are<br />
the ones who should be targeted <strong>for</strong> <strong>dietary</strong> interventions.<br />
Although it is true that intakes below the ANR<br />
have at least a 50% probability of inadequacy, it is not<br />
true that all of these individuals have intakes below<br />
their requirements. Even at the ANR, an intake still<br />
has a 50% probability of adequacy. Furthermore, some<br />
individuals with intakes above the ANR are still not<br />
meeting their requirements. As noted above, screening<br />
at the individual level is difficult unless usual long-term<br />
intakes have been measured. At the group level, however,<br />
the prevalence of inadequacy could be reduced by<br />
shifting the distribution of intakes so that fewer intakes<br />
fall below the ANR; this approach is described below in<br />
the section on Planning Nutrient Intakes <strong>for</strong> Groups.<br />
Adjusting intake distributions<br />
Both the full probability approach and the cutpoint<br />
approach require that the distribution of intakes represents<br />
usual intakes <strong>for</strong> the group of interest. Usual<br />
intakes could be obtained by having many days of<br />
observation <strong>for</strong> each individual, but this type of data<br />
is seldom available. Alternatively, the distribution can<br />
be statistically adjusted to remove the effect of day-today<br />
variation (fig. 3). Several methods are available <strong>for</strong><br />
making these adjustments [2, 14–17], but all require an<br />
estimate of the day-to-day variation in nutrient intakes<br />
<strong>for</strong> the group. These methods may be used even if data<br />
from only one day are available <strong>for</strong> each person, as long<br />
as a second day of <strong>dietary</strong> data is collected <strong>for</strong> at least<br />
a representative subset of the group of interest. Alternatively,<br />
an estimate of day-to-day variation may be<br />
obtained from multiday data <strong>for</strong> a similar population.<br />
The ability to statistically adjust intake distribution to<br />
remove the effect of day-to-day variation in intakes,<br />
rather than collecting many days of data <strong>for</strong> each<br />
� �� �����������<br />
���<br />
������ �������� ��������<br />
���� ������� ����<br />
������ �� �������� ������������<br />
����� ������������<br />
FIG. 3. Comparison of a distribution of one-day nutrient<br />
intakes with a distribution of usual nutrient intakes. The proportion<br />
of the group with intakes below the average nutrient<br />
requirement (ANR) is greater <strong>for</strong> the one-day distribution<br />
S55<br />
person, makes the assessment of groups more feasible<br />
than the assessment of individuals.<br />
Assessing intakes with an AI<br />
For nutrients without an ANR, it is possible to evaluate<br />
the intake of a group if an adequate intake (AI) has<br />
been set <strong>based</strong> on the mean intake of a healthy population.<br />
If the group’s mean intake approximates the AI,<br />
then the group can be assumed to have a low prevalence<br />
of inadequacy. However, no such qualitative judgment<br />
can be made if mean intake is below the AI. Because<br />
the distribution of requirements is not known, it is possible<br />
that mean intakes below the AI are also associated<br />
with a low prevalence of inadequacy. For this type of<br />
assessment, the intake distribution does not need to<br />
be adjusted <strong>for</strong> day-to-day variation, because only the<br />
mean intake is being examined.<br />
Assessing the prevalence of potentially excessive intakes<br />
To assess the prevalence of potentially excessive intakes,<br />
the proportion of the group with usual intakes above<br />
the UNL should be estimated. Because the UNL<br />
includes an uncertainty factor, it should not be assumed<br />
that everyone with an intake above the UNL is at risk<br />
<strong>for</strong> adverse effects. However, as the prevalence of<br />
intakes above the UNL increases, the likelihood that the<br />
group is at risk also increases. Prior to this evaluation,<br />
the intake distributions must be adjusted to remove the<br />
effect of day-to-day variation, as described above.<br />
Assessing energy intakes<br />
As was the case <strong>for</strong> assessing individuals, the probability<br />
approach cannot be used to evaluate the energy<br />
intakes of a group. Instead, the average energy intake of<br />
the group can be compared with the estimated average<br />
energy requirement <strong>for</strong> the group, taking into consideration<br />
the ages, sexes, and physical activity levels of<br />
the individuals within the group. If the average energy<br />
intake exceeds the estimated average requirement, then<br />
the group, on average, is likely to be gaining weight,<br />
assuming that the requirements and intakes have been<br />
accurately calculated. If the reverse is true, then the<br />
group may be, on average, losing weight. This type<br />
of comparison does not require adjusting the intake<br />
distribution <strong>for</strong> day-to-day variation, since only the<br />
mean is being evaluated. Energy balance can also be<br />
measured by weight changes, which can assist in assessing<br />
whether a group’s energy intake is inadequate or<br />
excessive.<br />
Assessing macronutrient intakes<br />
If AMDRs have been set, then the group’s macronutrient<br />
intakes may be assessed using these standards.<br />
The proportion of the group with intakes outside the<br />
AMDR is a measure of how well the group is meeting<br />
these standards. These would be interpreted as the<br />
prevalence of intakes that are too high or too low. If
S56<br />
the prevalence of intakes outside the range is high, then<br />
some type of intervention might be considered. The<br />
prevalence that is a cause <strong>for</strong> concern could vary among<br />
countries or regions, but prevalences greater than 2%<br />
to 3% would be consistent with the use of values like<br />
the INL 98 <strong>for</strong> other nutrients. Because this type of<br />
assessment is using the AMDR to define cutpoints, it<br />
is essential that the intake distribution be adjusted <strong>for</strong><br />
day-to-day variation first.<br />
Pitfalls to avoid<br />
When NIVs are used to assess the intakes of groups,<br />
there are several errors to avoid [18].<br />
In the past, the intakes of groups were evaluated by<br />
comparing the mean intake with the INL 98 and assuming<br />
that the prevalence of inadequacy was low if the<br />
mean was equal to or greater than the INL. However,<br />
it can be shown that this assumption was almost always<br />
incorrect due to the large variation in nutrient intakes.<br />
Because intakes are more variable than requirements,<br />
a substantial proportion of the group still has intakes<br />
below the ANR, even if the mean intake is equal to the<br />
INL 98 . Typically, a prevalence of inadequacy of 25% or<br />
more may be observed in this case. For the prevalence<br />
of inadequacy to be low (less than 5% to 10%), the<br />
mean intake must usually be well above the INL 98 . For<br />
this reason, it is preferable to use either the probability<br />
approach or the cutpoint method to calculate a more<br />
accurate estimate of the prevalence of inadequacy <strong>for</strong><br />
the group.<br />
Likewise, it is not helpful to compare the mean intake<br />
of a group with the ANR. If the mean intake is equal to<br />
the ANR, then the prevalence of inadequacy is 50%.<br />
Group intake distributions must be adjusted to<br />
remove the effect of day-to-day variation in intakes.<br />
Unless such an adjustment is made, the prevalence of<br />
inadequacy, the prevalence of excessive intakes, and<br />
the prevalence of intakes outside the AMDR will not<br />
be correctly estimated.<br />
Intakes must be accurately assessed, and the conversion<br />
of <strong>food</strong> intakes to nutrient intakes must use<br />
appropriate <strong>food</strong>-composition tables (both of these<br />
topics are covered in more detail below).<br />
Planning nutrient intakes <strong>for</strong> groups<br />
Goal<br />
The goal of planning the nutrient intakes <strong>for</strong> groups is<br />
to minimize the prevalence of inadequate intakes and<br />
also to minimize the prevalence of potentially excessive<br />
intakes [3, 19].<br />
Using the cutpoint approach to plan intakes<br />
The cutpoint approach, described above <strong>for</strong> assessing<br />
the intakes of groups, is also useful <strong>for</strong> planning<br />
the intakes of groups. To minimize the prevalence of<br />
inadequate intakes, the planner would try to minimize<br />
the proportion of the group with intakes below the<br />
ANR. As noted earlier, the cutpoint approach may be<br />
used <strong>for</strong> all nutrients with an ANR and a symmetrical<br />
requirement distribution. It also assumes that the<br />
distribution of intakes is greater than the distribution<br />
of requirements, although this assumption is seldom<br />
violated among free-living groups. To minimize the<br />
prevalence of excessive intakes, the planner would try<br />
to minimize the proportion of the group with intakes<br />
above the UNL.<br />
Steps in planning intakes<br />
S. P. Murphy and H. H. Vorster<br />
Planning diets <strong>for</strong> groups using the cutpoint approach<br />
consists of several steps [3, 19].<br />
1. Decide the exact goals <strong>for</strong> the planning process. This<br />
involves deciding what prevalences of inadequacy<br />
and prevalences of usual intakes above the UNL are<br />
acceptable. Although it might be considered ideal to<br />
have only 2% to 3% of the group below the ANR or<br />
above the UNL, these may not be practical goals in<br />
some situations.<br />
2. Select the target distribution of usual intakes that<br />
meets these goals. In order to select this target distribution,<br />
it is usually necessary to know the current<br />
intake distribution so that the need <strong>for</strong> change can be<br />
assessed. In some cases, the intake distribution may<br />
already be acceptable (i.e., very few intakes are below<br />
the ANR or above the UNL). In other situations, it<br />
may be necessary to increase intakes (i.e., move the<br />
current distribution to the right) so that fewer people<br />
would fall below the ANR, or it may be necessary to<br />
decrease intakes (move the current distribution to<br />
the left) so that fewer people are above the UNL.<br />
3. Plan menus or <strong>food</strong> patterns that achieve these goals<br />
<strong>for</strong> all of the nutrients of concern. This will usually<br />
require the use of <strong>dietary</strong> assessment software that<br />
will use an appropriate <strong>food</strong>-composition table to<br />
calculate the nutrient content of a menu. The goal<br />
might be <strong>for</strong> the menu to provide nutrient levels at<br />
the midpoint of the target distributions that were<br />
chosen <strong>for</strong> each nutrient. The <strong>food</strong>s and amounts<br />
that will actually be consumed, not just those provided<br />
by the menus, should also be considered.<br />
4. Because there are many uncertainties in the planning<br />
process, it is usually essential that the results<br />
be assessed after the menus or <strong>food</strong> patterns are<br />
implemented. If the planning goals are not met, then<br />
it may be necessary to repeat these steps until the<br />
results are satisfactory.<br />
Planning using the AI<br />
For nutrients with an NIV, such as an AI, intakes should<br />
be planned so that the mean amount consumed by the<br />
group is equal to the AI. The distribution of intakes<br />
does not need to be planned <strong>for</strong> these nutrients.
Using nutrient intake values to assess intakes<br />
Planning energy and macronutrient intakes<br />
The mean amount of energy provided should be<br />
approximately equal to the estimated mean energy<br />
requirement <strong>for</strong> the group. The distribution of intakes<br />
does not need to be planned <strong>for</strong> energy intake. For<br />
macronutrients with AMDRs, the planning goal is to<br />
minimize the prevalence of intakes outside this range.<br />
It may be useful to examine the current distribution of<br />
the percentage of energy from each macronutrient and<br />
decide if these distributions should be changed.<br />
Planning <strong>for</strong> heterogeneous groups<br />
The steps outlined above assume that the individuals<br />
within the group are similar in age and sex, so a single<br />
set of ANRs and UNLs can be used <strong>for</strong> the planning<br />
process. Planning <strong>for</strong> groups that are not homogeneous<br />
is more difficult. One approach <strong>for</strong> such groups<br />
is to identify the subgroup with the greatest nutrient<br />
requirement per 1,000 kcal (i.e., the subgroup that<br />
requires the most nutrient-dense diet) and then use<br />
the procedures described above to plan intakes <strong>for</strong> each<br />
nutrient. The assumption is made that a diet that is<br />
adequate <strong>for</strong> this subgroup will also be adequate <strong>for</strong> the<br />
other subgroups if they meet their energy requirements.<br />
The possibility of potentially excessive intakes by some<br />
subgroups should also be considered. Finally, it is particularly<br />
important to check the actual nutrient intake<br />
distributions after the new menus or <strong>food</strong> patterns have<br />
been implemented, to ensure that all subgroups have a<br />
low prevalence of inadequacy and a low prevalence of<br />
potentially excessive intakes. An alternative procedure<br />
is to estimate the nutrient density distribution <strong>for</strong><br />
S57<br />
the whole group and to plan using this distribution.<br />
Although this approach is theoretically preferable, the<br />
methods are still under development [3].<br />
Examples of assessing and planning intakes<br />
using NIVs<br />
Following are several examples of appropriate uses of<br />
the NIVs <strong>for</strong> assessing and planning nutrient intakes.<br />
The first two illustrate how the intakes of a hypothetical<br />
30-year-old man might be assessed (table 1) and<br />
what changes might be recommended in planning his<br />
intake (table 2). Intakes of thiamin and folate were well<br />
above the ANR and had a 98% probability of adequacy<br />
if observed intake was the same as usual intake. However,<br />
the confidence of adequacy <strong>for</strong> usual intake was<br />
reduced to 70% and 80%, respectively, because intake<br />
was observed <strong>for</strong> only three days. Riboflavin intake had<br />
only a 50% probability of adequacy because intake was<br />
equal to the ANR. Observed phosphorus intake was<br />
very high and had a 100% probability of adequacy.<br />
However, because observed intake was close to the<br />
UNL of 4,000 mg/d, the confidence that usual intake<br />
was below the UNL was only 80%. Assuming that<br />
the three days of intake reflected his usual intake, the<br />
individual would be advised to increase his riboflavin<br />
and zinc intakes (table 2). If these days were not typical,<br />
then it would be appropriate to collect additional<br />
days of intake data in order to better evaluate thiamin,<br />
folate, and phosphorus intakes. To make these recommendations<br />
meaningful to a consumer, <strong>food</strong>-<strong>based</strong><br />
TABLE 1. Assessing the nutrient intakes of a hypothetical individual (30-year-old man; intakes observed <strong>for</strong> 3 days) a<br />
Nutrient Intake ANR<br />
Probability<br />
of adequacy<br />
Confidence<br />
of adequacy UNL<br />
Confidence<br />
intake is < UNL<br />
Thiamin (mg/day) 1.3 1.0 98 70 None N/A<br />
Riboflavin (mg/day) 1.1 1.1 50 50 None N/A<br />
Folate (µg/day DFE) 400 320 98 80 1,000 100<br />
Zinc (mg/day) 10.3 9.4 86 65 40 100<br />
Phosphorus (mg/day) 3,800 580 100 100 4,000 80<br />
DFE, <strong>dietary</strong> folate equivalent; ANR, average nutrient requirement; UNL, upper nutrient level<br />
a. Using the <strong>dietary</strong> reference intakes (DRIs) <strong>for</strong> the <strong>United</strong> States and Canada; average nutrient requirement (ANR) = estimated average<br />
requirement (EAR); upper nutrient level (UNL) = tolerable upper intake level (UL). Adapted from Institute of Medicine [2].<br />
TABLE 2. Planning the nutrient intakes of the same hypothetical 30-year-old individual<br />
Nutrient<br />
Current<br />
intake INL 98 UNL<br />
Recommended<br />
change in intake a<br />
Thiamin (mg/day) 1.3 1.2 None None<br />
Riboflavin (mg/day) 1.1 1.3 None Increase<br />
Folate (µg/day DFE) 400 400 1,000 None<br />
Zinc (mg/day) 10.3 11.0 40 Increase slightly<br />
Phosphorus (mg/day) 3,800 700 4,000 None<br />
DFE, <strong>dietary</strong> folate equivalent; INL, individual nutrient level; UNL, upper nutrient level<br />
a. Assumes 3-day intake reflects usual intake.
S58<br />
guidance would be appropriate. Ideally, a reassessment<br />
would be per<strong>for</strong>med after the recommendations were<br />
implemented.<br />
The remaining two examples illustrate an approach<br />
to assessing (table 3) and planning (table 4) the nutrient<br />
intakes of a group of women 19–30 years of age.<br />
After adjusting the intake distributions to remove the<br />
effect of day-to-day variation in intakes, the prevalence<br />
of inadequacy ranged from 4% to 14% <strong>for</strong> the five nutrients<br />
shown in table 3, and the prevalence of potentially<br />
excessive intakes was low <strong>for</strong> the three nutrients with<br />
a UNL. If the goal is to reduce the prevalence of inadequacy<br />
<strong>for</strong> this group of women to 3%, then intakes<br />
would need to increase <strong>for</strong> each of the five nutrients so<br />
that only 3% of the group had intakes below the ANR<br />
(table 4). The necessary shift in the median intake of<br />
the group can be calculated, assuming that the shape<br />
of the distribution does not change [3]. For example,<br />
folate intake would need to increase from 491 μg of<br />
<strong>dietary</strong> folate equivalents (DFE)/d to 581 μg DFE/d <strong>for</strong><br />
the prevalence of inadequacy to decline from 14% to<br />
3%. To achieve these changes, nutrition education or<br />
intervention programs might be implemented. After<br />
the programs are in place, their effect on prevalence of<br />
adequacy should then be assessed.<br />
The impact of <strong>food</strong>-composition tables<br />
on uses of the NIVs<br />
It is not possible to plan or assess diets with the NIVs<br />
unless <strong>food</strong> intakes can be correctly converted into<br />
TABLE 4. Planning the nutrient intakes of the same group of US women aged 19–20 years<br />
Nutrient<br />
TABLE 3. Assessing the nutrient intakes of a group of US women aged 19–30 years a<br />
Nutrient<br />
Current median<br />
intake from <strong>food</strong><br />
Median intake<br />
from <strong>food</strong> ANR<br />
Current<br />
prevention of<br />
inadequacy (%)<br />
nutrient intakes. This conversion is accomplished<br />
with the aid of a <strong>food</strong>-composition table that contains<br />
nutrient profiles of <strong>food</strong>s, usually on a 100-gram basis.<br />
Such tables are frequently embedded in computer<br />
programs that may be used to both assess and plan<br />
<strong>food</strong> intakes.<br />
Although valid estimates of nutrient intakes require<br />
accurate and current <strong>food</strong>-composition data, use of<br />
the correct units <strong>for</strong> the nutrients is also crucial. The<br />
units <strong>for</strong> the nutrients in the composition table should<br />
match the units that are used <strong>for</strong> the NIVs. NIVs may<br />
evolve quickly, and there can be a delay while <strong>food</strong>composition<br />
methods and analyses catch up. In the<br />
<strong>United</strong> States and Canada, the disconnect between the<br />
DRIs and the national <strong>food</strong>-composition tables was<br />
particularly great <strong>for</strong> vitamin A, vitamin E, and folate<br />
[20–22]. The units <strong>for</strong> vitamin A changed from micrograms<br />
(μg) of retinol equivalents (RE) to micrograms of<br />
retinol activity equivalents (RAE) to reflect a reduced<br />
bioavailability of carotenoids as vitamin A precursors;<br />
the units <strong>for</strong> vitamin E changed from milligrams of αtocopherol<br />
equivalents to milligrams of α-tocopherol,<br />
because other tocopherols are no longer believed to<br />
have vitamin E activity; and the units <strong>for</strong> folate changed<br />
from micrograms of folate to micrograms of <strong>dietary</strong><br />
folate equivalents (DFE) to reflect an increased bioactivity<br />
of synthetic folic acid. These new units are now<br />
available in the national <strong>food</strong>-composition tables, but<br />
considerable time and ef<strong>for</strong>t was involved to accomplish<br />
these changes.<br />
Prevalence of<br />
inadequacy (%) UNL<br />
Desired<br />
prevalence of<br />
inadequacy (%)<br />
Change in<br />
median intake<br />
from <strong>food</strong> a<br />
New prevalence of<br />
excessive intakes<br />
(%)<br />
Thiamin (mg/day) 1.4 8 3 + 1 mg/day N/A<br />
Riboflavin (mg/day) 1.8 5 3 + 0.1 mg/day N/A<br />
Folate (µg/day DFE) 491 14 3 + 90 µg/day DFE < 3<br />
Zinc (mg/day) 9.8 13 3 + 1.5 mg/day < 3<br />
Phosphorus (mg/day) 1,136 4 3 +10 mg/day < 3<br />
DFE, <strong>dietary</strong> folate equivalent<br />
a. Assumes that everyone increases intake by this amount so that the shape of the distribution does not change.<br />
S. P. Murphy and H. H. Vorster<br />
Prevalence of<br />
excessive intakes (%)<br />
Thiamin (mg/day) 1.4 0.9 8 None N/A<br />
Riboflavin (mg/day) 1.8 0.9 5 None N/A<br />
Folate (µg/day DFE) 491 320 14 1,000 < 3<br />
Zinc (mg/day) 9.8 6.8 13 40 < 3<br />
Phosphorus (mg/day) 1,136 580 4 4,000 < 3<br />
DFE, <strong>dietary</strong> folate equivalent; ANR, average nutrient requirement; UNL, upper nutrient level<br />
a. Using the DRIs <strong>for</strong> the <strong>United</strong> States and Canada; ANR=EAR; UNL=UL. Adapted from Moshfegh et al. [28].
Using nutrient intake values to assess intakes<br />
The impact of <strong>dietary</strong> assessment methods<br />
on uses of the NIVs<br />
The accuracy of the assessment of diets <strong>for</strong> either<br />
individuals or groups is limited by the accuracy of the<br />
<strong>dietary</strong> assessment methods. Also, because assessment<br />
is often the first step in planning diets, an inaccurate<br />
assessment can lead to incorrect planning as well.<br />
Although a complete evaluation of various <strong>dietary</strong><br />
assessment methods is beyond the scope of this article,<br />
other publications provide more details [2, 23]. Some<br />
general considerations include the following:<br />
Assessment methods that depend on self-reported<br />
intakes over a specific period of time, such as 24-hour<br />
recalls or one-day <strong>food</strong> records, tend to result in underreporting<br />
of intakes of energy and probably of other<br />
nutrients as well [24, 25]. If <strong>food</strong> intakes are underreported,<br />
then nutrient intakes may be underestimated,<br />
and the probability of inadequacy may be overestimated<br />
<strong>for</strong> individuals and the prevalence of inadequacy<br />
overestimated <strong>for</strong> groups. Likewise, the prevalence of<br />
excessive intakes may be underestimated.<br />
Food-frequency questionnaires have been useful<br />
<strong>dietary</strong> assessment instruments <strong>for</strong> ranking intakes<br />
within a group, but their accuracy in estimating actual<br />
nutrient intake has been questioned [26]. Some <strong>food</strong>frequency<br />
questionnaires underestimate intake even<br />
more than recalls and records [27].<br />
None of the commonly used <strong>dietary</strong> assessment<br />
instruments captures usual long-term intake accurately.<br />
Even <strong>food</strong>-frequency questionnaires exhibit relatively<br />
high variation when administered to the same person<br />
at two different points in time [23]. For this reason, it<br />
is very difficult to accurately assess the usual nutrient<br />
intakes of individuals unless intakes are measured<br />
repeatedly. However, this concern can be addressed<br />
when assessing group intakes by using statistical<br />
techniques to remove the effect of day-to-day variation<br />
from the distribution of one-day intakes. These<br />
References<br />
1. King JC, Vorster HH, Tome DG. Nutrient intake values<br />
(NIVs): A recommended terminology and framework<br />
<strong>for</strong> the derivation of values. Food Nutr Bull 2007;<br />
28(suppl): S16–26.<br />
2. Institute of Medicine. Dietary reference intakes: Applications<br />
in <strong>dietary</strong> assessment. Washington, DC: National<br />
Academy Press, 2000.<br />
3. Institute of Medicine. Dietary reference intakes: Applications<br />
in <strong>dietary</strong> planning. Washington, DC: National<br />
Academies Press, 2003.<br />
4. Vorster HH, Murphy SP, Allen LH, King JC. Application<br />
of nutrient intake values (NIVs). Food Nutr Bull<br />
2007;28(suppl): S116–22.<br />
5. Murphy SP. Impact of the new <strong>dietary</strong> reference intakes<br />
on nutrient calculation programs. J Food Comp Anal<br />
S59<br />
techniques require that an estimate of day-to-day variation<br />
be obtained <strong>for</strong> the nutrients of interest, either by<br />
collecting a second day of intake data or by using an<br />
estimate obtained from a similar group.<br />
An accurate assessment of total nutrient intake must<br />
consider nutrients consumed in <strong>dietary</strong> supplements<br />
such as multivitamin/mineral supplements. These<br />
products are widely used in developed countries, and<br />
their use may be increasing in some segments of the<br />
population in developing countries as well.<br />
Summary and recommendations<br />
Nutrient intake values (NIVs) are now being developed<br />
by using a new paradigm. Whenever possible, average<br />
nutrient requirements (ANRs) are being set, and<br />
a standard deviation of the ANR is being assumed or<br />
specified. As a result, it is possible to better assess and<br />
plan diets <strong>for</strong> both individuals and groups. Furthermore,<br />
the availability of an upper nutrient level (UNL)<br />
permits consideration of nutrient intakes that may<br />
result in a possible risk of adverse effects. Although<br />
the new paradigm has resulted in more meaningful<br />
methods <strong>for</strong> using the NIVs to plan and assess intakes,<br />
the potential <strong>for</strong> misinterpretation has also increased.<br />
It is important to ensure that users of the new NIVs are<br />
in<strong>for</strong>med and educated in the potential uses as well as<br />
the responsible interpretation and application of these<br />
standards. To date, there have been few attempts to<br />
apply these uses to actual public health problems. The<br />
many possibilities are discussed by Vorster et al. [4] in<br />
this issue. To fully utilize the new paradigm, it will be<br />
necessary <strong>for</strong> the professional nutrition community to<br />
identify ways to implement these procedures in nutrition<br />
research and nutrition programs, to describe the<br />
strengths and weaknesses of the results, and to contribute<br />
to the evolution of both the theory and the application<br />
of the NIVs when planning and assessing diets.<br />
2003;16:365–72.<br />
6. Institute of Medicine. Dietary reference intakes <strong>for</strong> vitamin<br />
A, vitamin K, arsenic, boron, chromium, copper,<br />
iodine, iron, manganese, molybdenum, nickel, silicon,<br />
vanadium, and zinc. Washington, DC: National Academy<br />
Press, 2001.<br />
7. Barr SI, Murphy SP, Poos MI. Interpreting and using the<br />
<strong>dietary</strong> reference intakes in <strong>dietary</strong> assessment of individuals<br />
and groups. J Am Diet Assoc 2002;102:780–8.<br />
8. Murphy SP, Barr SI, Poos MI. Using the new <strong>dietary</strong><br />
reference intakes to assess diets: A map to the maze.<br />
Nutr Rev 2002;60:267–75.<br />
9. Barr SI, Murphy SP, Agurs-Collins T, Poos MI. Planning<br />
diets <strong>for</strong> individuals using the <strong>dietary</strong> reference intakes.<br />
Nutr Rev 2003;61:352–60.
S60<br />
10. Beaton GH. When is an individual an individual versus<br />
a member of a group? An issue in the application of the<br />
<strong>dietary</strong> reference intakes. Nutr Rev 2006;64:211–25.<br />
11. Murphy SP, Barr SI, Yates AA. The recommended<br />
<strong>dietary</strong> allowance (RDA) should not be abandoned:<br />
An individual is both an individual and a member of a<br />
group. Nutr Rev 2006;64:313–5.<br />
12. Institute of Medicine. Dietary reference intakes <strong>for</strong><br />
energy, carbohydrate, fiber, fat, fatty acids, cholesterol,<br />
protein, and amino acids. Washington, DC: National<br />
Academy Press, 2002.<br />
13. Institute of Medicine. Dietary reference intakes <strong>for</strong><br />
vitamin C, vitamin E, selenium, and carotenoids. Washington,<br />
DC: National Academy Press, 2000.<br />
14. National Research Council. Nutrient adequacy. Assessment<br />
using <strong>food</strong> consumption surveys. Washington,<br />
DC: National Academy Press, 1986.<br />
15. Carriquiry AL. Estimation of usual intake distributions<br />
of nutrients and <strong>food</strong>s. J Nutr 2003;133:601S–8S.<br />
16. Nusser SM, Carriquiry AL, Dodd KW, Fuller WA. A<br />
semiparametric trans<strong>for</strong>mation approach to estimating<br />
usual daily intake distributions. J Am Stat Assoc<br />
1996;91:1440–9.<br />
17. Dodd KW, Guenther PM, Freedman LS, Subar AF,<br />
Kipnis V, Midthune D, Tooze JA, Krebs-Smith SM.<br />
Statistical methods <strong>for</strong> estimating usual intake of nutrients<br />
and <strong>food</strong>s: A review of the theory. J Am Diet Assoc<br />
2006;106:1640–50.<br />
18. Murphy SP, Guenther PM, Kretsch MJ. Using the <strong>dietary</strong><br />
reference intakes to assess intakes of groups: Pitfalls to<br />
avoid. J Am Diet Assoc 2006;106:1550–3.<br />
19. Murphy SP, Barr SI. Challenges in using the <strong>dietary</strong><br />
reference intakes to plan diets <strong>for</strong> groups. Nutr Rev<br />
2005;63:267–71.<br />
20. Murphy SP. Changes in <strong>dietary</strong> guidance: Implications<br />
<strong>for</strong> <strong>food</strong> and nutrient databases. J Food Comp Anal<br />
S. P. Murphy and H. H. Vorster<br />
2001;14:269–78.<br />
21. Murphy SP. Dietary reference intakes <strong>for</strong> the U.S. and<br />
Canada: Update on implications <strong>for</strong> nutrient databases.<br />
J Food Comp Anal 2002;15:411–7.<br />
22. Gebhardt SE, Holden JM. Consequences of changes in<br />
the <strong>dietary</strong> reference intakes <strong>for</strong> nutrient databases. J<br />
Food Comp Anal 2006;19:S91–5.<br />
23. Beaton GH. Approaches to analysis of <strong>dietary</strong> data: Relationship<br />
between planned analyses and choice of methodology.<br />
Am J Clin Nutr 1994;59(1 suppl):253S–61S.<br />
24. Mertz W, Tsui JC, Judd JT, Reiser S, Hallfrisch J, Morris<br />
ER, Steele PD, Lashley E. What are people really eating?<br />
The relation between energy intake derived from estimated<br />
diet records and intake determined to maintain<br />
body weight. Am J Clin Nutr 1991;54:291–5.<br />
25. Briefel RR, Sempos CT, McDowell MA, Chien S,<br />
Alaimo K. Dietary methods research in the third<br />
National Health and Nutrition Examination Survey:<br />
Underreporting of energy intake. Am J Clin Nutr 1997;<br />
65(4 suppl):1203S–9S.<br />
26. Kristal AR, Peters U, Potter JD. Is it time to abandon<br />
the <strong>food</strong> frequency questionnaire? Cancer Epidemiol<br />
Biomarkers Prev 2005;14:2826–8.<br />
27. Subar AF, Kipnis V, Troiano RP, Midthune D, Schoeller<br />
DA, Bingham S, Sharbaugh CO, Trabulsi J, Runswick<br />
S, Ballard-Barbash R, Sunshine J, Schatzkin A. Using<br />
intake biomarkers to evaluate the extent of <strong>dietary</strong> misreporting<br />
in a large sample of adults: The OPEN Study.<br />
Am J Epidemiol 2003;158:1–13.<br />
28. Moshfegh A, Goldman J, Cleveland L. What we eat in<br />
America, NHANES 2001–2002: Usual nutrient intakes<br />
from <strong>food</strong> compared to <strong>dietary</strong> reference intakes. Agricultural<br />
Research Service, US Department of Agriculture,<br />
2006. Available at: www.ars.usda.gov/<strong>food</strong>survey.<br />
Accessed 28 October 2006.
Determining life-stage groups and extrapolating<br />
nutrient intake values (NIVs)<br />
Stephanie A. Atkinson and Berthold Koletzko<br />
Abstract<br />
The derivation of reference values in 11 current <strong>dietary</strong><br />
reference standards is often <strong>based</strong> on methods of extrapolation<br />
or interpolation, but these are not consistent across<br />
reports. Such methods are frequently employed to derive<br />
nutrient intake values (NIVs) <strong>for</strong> infants and children<br />
owing to the paucity of relevant research data available.<br />
The most common method is to extrapolate values <strong>for</strong><br />
children down from those of adults, employing a weight<br />
or metabolic factor and adjusting <strong>for</strong> growth. In some<br />
instances, values <strong>for</strong> young children are extrapolated up<br />
from infants, values <strong>for</strong> adults are extrapolated up from<br />
children, or values <strong>for</strong> older adults are extrapolated up<br />
from young adults. Extrapolation is employed to estimate<br />
not only nutrient requirement or adequate intake but<br />
also the upper tolerable levels of intake. Extrapolation<br />
methods may also <strong>for</strong>m the basis of estimates of tissue<br />
deposition of nutrients during growth in children and <strong>for</strong><br />
the maternal/fetal dyad in pregnancy with adjustments<br />
<strong>for</strong> metabolic efficiency. Likewise, recommended intakes<br />
during lactation are extrapolated from known secretion<br />
of the nutrient in milk with adjustments <strong>for</strong> bioavailability.<br />
For future <strong>dietary</strong> standards, a first priority is to<br />
obtain relevant scientific data using current methodology,<br />
such as stable isotope tracers, body composition analysis,<br />
and appropriate biomarkers, from which NIVs <strong>for</strong> each<br />
age group can be derived. Extrapolation to derive an NIV<br />
is only acceptable in the sheer absence of sound scientific<br />
data and must be modeled with a consistent approach.<br />
For the purpose of harmonization of <strong>dietary</strong> standards,<br />
Stephanie A. Atkinson is affiliated with the Department of<br />
Pediatrics, Faculty of Health Sciences, McMaster University,<br />
Hamilton, Ontario, Canada; Berthold Koletzko is affiliated with<br />
the Division of Metabolic Diseases and Nutritional Medicine,<br />
Dr. von Hauner Children’s Hospital, Ludwig-Maximilians-<br />
University of Munich, Munich, Germany.<br />
Please direct queries to the corresponding author: Stephanie<br />
A. Atkinson, Department of Pediatrics, Faculty of Health<br />
Sciences, 3G57, McMaster University, Hamilton, Ontario L8N<br />
3Z5, Canada; e-mail: satkins@mcmaster.ca.<br />
we recommend the following approaches that should<br />
be clearly described in reports: standardization of age<br />
groups on a biological basis (growth and pubertal stages)<br />
with consideration of relevant developmental milestones<br />
throughout childhood; application of internationally<br />
accepted standards <strong>for</strong> growth, body size, body composition,<br />
fetal and maternal nutrient accretion in pregnancy,<br />
and milk composition; and inclusion of appropriate<br />
adjustments (metabolic efficiency, weight change, or<br />
physical activity).<br />
Key words: Extrapolation, interpolation, lactation,<br />
milk composition, nutrient intake values, pregnancy,<br />
recommended nutrient intakes, reference body weights<br />
and heights<br />
Introduction<br />
The approach to determining nutrient requirements<br />
<strong>based</strong> on specific criteria of nutritional adequacy<br />
demands availability of data <strong>for</strong> each defined life-stage<br />
group as well as <strong>for</strong> specific physiological states such as<br />
pregnancy and lactation. In addition, the influence of<br />
environmental factors such as physical activity, smoking,<br />
and <strong>food</strong> sources may need to be accounted <strong>for</strong> in<br />
setting quantitative nutrient-<strong>based</strong> recommendations.<br />
For example, across all age groups, the influence of<br />
environmental variables or stresses has been recognized<br />
in the estimation of energy needs as a function<br />
of physical activity level.<br />
Growth and development are central characteristics<br />
of infancy, childhood, and adolescence and lead to relatively<br />
large substrate requirements. Meeting the nutritional<br />
needs of children and adolescents is of utmost<br />
importance to support their growth and development<br />
and their short- and long-term health, well-being,<br />
and per<strong>for</strong>mance [1]. For children and youth, current<br />
reference values <strong>for</strong> nutrient intakes vary widely, in<br />
part due to severe limitations in the available scientific<br />
Food and Nutrition Bulletin, vol. 28, no. 1 (supplement) © 2007, The <strong>United</strong> <strong>Nations</strong> University. S61
S62<br />
knowledge of nutrient requirements in childhood, and<br />
in part due to major differences in underlying concepts,<br />
definitions, and terminology [2]. Relevant scientific<br />
data that are age-specific are un<strong>for</strong>tunately unavailable<br />
<strong>for</strong> many nutrients, especially <strong>for</strong> infants over 6 months<br />
of age and young children, as well as <strong>for</strong> older age<br />
groups. Until appropriate data become available, the<br />
general approach to estimating nutrient needs of such<br />
populations has been to extrapolate values from one life<br />
stage to another using weighting <strong>for</strong> body size, energy<br />
requirement, and other metabolic differences.<br />
In a recent European concerted action, the methodological<br />
approaches and current nutritional recommendations<br />
in children and adolescents aged 2 to 18<br />
years have been reviewed [3]. An expert working group<br />
obtained in<strong>for</strong>mation <strong>for</strong> 29 of 39 countries in Europe,<br />
and a comprehensive compilation was made of the <strong>dietary</strong><br />
recommendations current up to September 2002<br />
and the concepts of <strong>dietary</strong> reference values and the<br />
methodological approaches used in each country [4].<br />
Brief critiques were included to indicate the scientific<br />
foundations of the reference values <strong>for</strong> children and to<br />
offer, where possible, an explanation <strong>for</strong> the wide differences<br />
that exist between countries. This compilation<br />
demonstrated that there are considerable disparities<br />
in the perceived nutritional requirements of children<br />
and adolescents. Although some of this diversity may<br />
be attributed to real physiological and environmental<br />
differences, most is due to differences in concepts about<br />
the best methodological approach to use, and in the<br />
way the theoretical approaches are applied.<br />
For physiological states such as pregnancy and<br />
lactation, metabolic data upon which estimates of<br />
requirements are <strong>based</strong> are often lacking due to practical<br />
difficulties or ethical limitations on conducting<br />
research in women during these reproductive stages.<br />
When data specific to physiological state are not<br />
available, methods employing a factorial approach<br />
or extrapolation from other growth states, with various<br />
adjustments <strong>for</strong> physical activity, weight loss, or<br />
metabolic efficiency, have been used instead to derive<br />
nutrient requirements.<br />
Grouping by age or physiological state to<br />
derive NIVs<br />
Great inconsistency exists between various countries<br />
and agencies in definitions of life-stage groups used<br />
to establish nutrient standards, and often clear explanation<br />
of the rationale <strong>for</strong> the age groups is lacking.<br />
Having reviewed the approaches used, we recommend<br />
that the following factors be considered when establishing<br />
age groups: biological patterns related to physical<br />
age; use of a functional characteristic such as growth<br />
or puberty, both of which put increased demands on<br />
nutrient needs, or aging that mark changes in nutrient<br />
S. A. Atkinson and B. Koletzko<br />
handling due to functional losses; and the potential<br />
applications such as <strong>guidelines</strong> <strong>for</strong> duration of breastfeeding<br />
or complementary feeding programs.<br />
For pregnancy and lactation, graded increases in<br />
NIV during stages of pregnancy and lactation do not<br />
appear to be <strong>based</strong> on strong science. Recent evidence<br />
supports the concept that physiological adjustments<br />
in nutrient utilization occur during pregnancy and<br />
lactation that generally compensate <strong>for</strong> the shifts in<br />
nutrient requirements with stages of gestation or lactation.<br />
Furthermore, having more than one NIV <strong>for</strong><br />
pregnancy and lactation is essentially impossible to<br />
implement; advising a women to eat one diet during<br />
early pregnancy and another in late pregnancy is not<br />
practical. This combination of factors leads us to recommend<br />
that pregnancy and lactation not be divided<br />
into different stages such as trimesters of pregnancy or<br />
early and late lactation.<br />
Reference weights and heights <strong>for</strong><br />
application in deriving NIVs<br />
Population reference weights and heights are applied<br />
in setting recommended nutrient intakes in several<br />
situations. The adoption of reference body weights and<br />
heights should be specific <strong>for</strong> countries or geographic<br />
regions, since populations can vary significantly in<br />
stature and weight.<br />
For the <strong>dietary</strong> reference intake (DRI) reports <strong>for</strong><br />
Canada and the <strong>United</strong> States, the initial report [5] used<br />
data on heights and body mass index (BMI) collected<br />
between 1988 and 1994 <strong>for</strong> the Third National Health<br />
and Nutrition Examination Survey (NHANES III) in<br />
the <strong>United</strong> States. Using the reported median heights<br />
<strong>for</strong> life stage and sex groups up to age 30, the median<br />
weights were computed from the reported median BMI<br />
<strong>for</strong> the same groups. The reference weights of adults<br />
aged 19 to 30 were applied to all adult age groups on the<br />
assumption that weight should not change at the older<br />
ages if activity is maintained. Beginning with the DRI<br />
report on macronutrients [6], the reference weights<br />
and heights were updated on the basis of new data on<br />
median BMI and height-<strong>for</strong>-age data from the Centers<br />
<strong>for</strong> Disease Control and Prevention/National Center<br />
<strong>for</strong> Health Statistics (CDC/NCHS) growth charts [7].<br />
The D-A-CH (Germany, Austria, Switzerland, and<br />
Slovenia) report [8] used body weight data <strong>for</strong> adults<br />
from the 1985 Food and Agriculture Organization/<br />
World Health Organization/<strong>United</strong> <strong>Nations</strong> University<br />
(FAO/WHO/UNU) report [9] and <strong>for</strong> children from<br />
the US National Center <strong>for</strong> Health Statistics Growth<br />
Charts [7].<br />
The report on “Nutrient and Energy Intakes <strong>for</strong> the<br />
European Community” [10] <strong>based</strong> its calculations of<br />
intakes of energy and selected nutrients on rounded<br />
values <strong>for</strong> mean body weights and heights of children
Life-stage groups and nutrient intake values<br />
at different ages, <strong>based</strong> on pooling national datasets<br />
from Belgium, Denmark, France, Germany, Greece,<br />
Italy, Spain, the Netherlands, and the <strong>United</strong> Kingdom,<br />
weighted on the basis of each country’s population at<br />
any given age. It is noteworthy that the data <strong>for</strong> mean<br />
body weights and heights of children in the European<br />
Union report and the US National Center <strong>for</strong> Health<br />
Statistics Growth Charts [7] correspond closely. Assessments<br />
<strong>for</strong> pregnant women were <strong>based</strong> on ranges of<br />
prepregnancy weight and desirable weight gains during<br />
pregnancy assessed by the US National Academy of<br />
Science [11].<br />
In the Finnish report of 1999 [12], a reference weight<br />
of 70 kg <strong>for</strong> men and 60 kg <strong>for</strong> women was adopted, but<br />
mean body weights <strong>for</strong> children and adolescents were<br />
taken from the 1996 Nordic report [13]. Similarly, the<br />
French report in 2001 [14] adopted the standard 70kg<br />
and 60-kg values <strong>for</strong> adult men and women when<br />
reporting estimated energy intakes <strong>for</strong> groups of subjects,<br />
but also provided values <strong>for</strong> energy expenditure<br />
by 5-kg intervals at various age intervals <strong>for</strong> adults,<br />
although these do not appear to represent population<br />
reference weights.<br />
In the most recent Mexican <strong>dietary</strong> standard [15], it<br />
was recognized that the Mexican population is shorter<br />
than the average of some other populations, and thus<br />
data from several representative National Surveys in<br />
Mexico were adopted <strong>for</strong> use as reference weights and<br />
heights. These include the National Nutrition Survey<br />
(1999), the National Chronic Diseases Survey (2000),<br />
and the Federal District Survey <strong>for</strong> men and women<br />
over 60 years of age (as cited by Bourges [15]). Using<br />
the height data from the Mexican population, the<br />
desirable body weight was then derived from the 50th<br />
percentile of weight-<strong>for</strong>-height in the American reference<br />
population from the National Center <strong>for</strong> Health<br />
Statistics <strong>for</strong> ages 0 to 9 years, and the body weight to<br />
reach a BMI at the 50th percentile of each height from<br />
the same database <strong>for</strong> 10 to 18 years. For adults, the<br />
Mexican report adopted data from the FAO/WHO/<br />
UNU report [9] to calculate a body weight to reach a<br />
BMI of 22 in women and 21 in men. The Caribbean<br />
report [16] used reference weights and heights updated<br />
from the 1976 report, but the source of the data was<br />
not identified.<br />
The Nordic report [13] used rounded body weight<br />
values <strong>for</strong> adults <strong>based</strong> on mean population weights<br />
in Denmark, Sweden, and Finland, with adjustments<br />
<strong>for</strong> individuals outside a BMI range of 18.5 to 25. The<br />
values used are thus estimates, assuming that all individuals<br />
are of normal weight. Values <strong>for</strong> body weight<br />
of children aged 0 to 5 years were <strong>based</strong> on the mean of<br />
reference values from Denmark, Finland, Norway, and<br />
Sweden, whereas values <strong>for</strong> the age group 6 to 17 years<br />
were <strong>based</strong> on mean values from 1973–1977 because<br />
of a gradual increase in weight-<strong>for</strong>-height and in overweight<br />
prevalence in recent years [13]. The UK report<br />
S63<br />
in 1992 [17] used weight and height data compiled<br />
from different surveys of the UK population.<br />
The reference values <strong>for</strong> body weights and heights<br />
are applied in a number of situations. For some nutrients,<br />
such as protein, nutrient requirements may be<br />
expressed on a body weight basis, but such values are<br />
more applicable to end users if they are expressed as<br />
total nutrient intake per day. In this case, an average<br />
weight-<strong>for</strong>-age and sex is applied to compute nutrient<br />
intake per day from the value established <strong>for</strong> nutrient<br />
intake per kilogram of body weight.<br />
Another application <strong>for</strong> reference weights and<br />
heights is in the computation of estimated energy<br />
expenditure <strong>for</strong> a group of subjects of given sex and<br />
age. A third application is the use of reference weights<br />
when biological data <strong>for</strong> a specific criterion of adequacy<br />
are not available <strong>for</strong> a specific age or sex category. In<br />
this instance, weights may be used to extrapolate values<br />
from older or younger individuals using an appropriate<br />
mathematical model, as described below.<br />
After reviewing the above-noted reports, we recommend<br />
that <strong>for</strong> infants and children between 0 and 5<br />
years of age, the new WHO growth standards [18]<br />
be used as the basis <strong>for</strong> normalizing NIV when such<br />
adjustments <strong>based</strong> on weight are appropriate. For all<br />
other age groups, data from NCHS/WHO can be used<br />
to derive a standard weight and height [9]. For adults,<br />
it is recommended that the average weight of men and<br />
women at 18 years of age be used throughout the adult<br />
years rather than reflecting the typical secular increase<br />
in body weight with age. It is uncertain whether this<br />
secular increase is consistent with good health. It is<br />
important to adjust energy NIVs <strong>for</strong> overweight or<br />
obese individuals with a BMI greater than 25. For all<br />
other nutrients, standard body weight uncorrected <strong>for</strong><br />
overweight status is appropriate <strong>for</strong> estimating NIVs.<br />
Nutrient recommendations established<br />
using an extrapolation model among<br />
age groups<br />
For many nutrients, sufficient research is not available<br />
that allows <strong>for</strong> derivation of requirements <strong>for</strong> every age<br />
group and <strong>for</strong> both genders. This is particularly true <strong>for</strong><br />
older infants (7 months to 2 years) and <strong>for</strong> children of<br />
preschool and school age. In contrast to adult organisms,<br />
the nutrient supply <strong>for</strong> children and adolescents<br />
needs to cover not only the requirements <strong>for</strong> maintenance<br />
metabolism, but also obligate losses and physical<br />
activity. In addition, children have high and specific<br />
substrate needs <strong>for</strong> growth, which are particularly large<br />
during the phases of rapid growth in infancy, during<br />
the preschool growth spurt, and during the pubertal<br />
growth spurt [1]. In contrast to their high metabolic<br />
demands, children tend to have a more limited ability<br />
than adults to compensate <strong>for</strong> unbalanced nutrient
S64<br />
supplies by homeostatic adaptation, primarily because<br />
of their smaller body stores of nutrients. Moreover, the<br />
metabolic handling of various substrates differs with<br />
age and body size.<br />
Documentation of the paucity of existing data from<br />
which to derive nutrient requirements <strong>for</strong> children<br />
was exemplified by an electronic literature search per<strong>for</strong>med<br />
in August 2003 in PubMed, National Library of<br />
Medicine (http://www.ncbi.nlm.nih.gov/entrez/query.<br />
fcgi) [3]. The search term “nutrient requirement” limited<br />
to “clinical trial” and “human” yielded 176 hits <strong>for</strong><br />
adults and 53 <strong>for</strong> newborn infants, but only 21 hits <strong>for</strong><br />
preschool children aged 2 to 5 years, 29 <strong>for</strong> children<br />
aged 6 to 12 years, and 45 <strong>for</strong> children and adolescents<br />
aged 13 to 18 years. Such a lack of relevant data from<br />
which to derive evidence-<strong>based</strong> population reference<br />
intakes <strong>for</strong> children and youth leads to the application<br />
of linear models of extrapolation <strong>for</strong> requirements and<br />
upper intakes from values established <strong>for</strong> adults and <strong>for</strong><br />
young infants, usually <strong>based</strong> on average data <strong>for</strong> body<br />
weight or body surface area [2, 10]. These extrapolation<br />
approaches have several limitations. Major concerns<br />
about these shortcomings were recently emphasized<br />
by the Scientific Committee on Food of the European<br />
Community with regard to upper levels of intake:<br />
The Committee recognises limitations in the methods<br />
available and in the approach it has used to extrapolate<br />
tolerable upper intake levels (UL) of nutrients from<br />
those established <strong>for</strong> adult populations to children, <strong>based</strong><br />
solely either on body weight or on body surface area.<br />
For some nutrients, the Committee concluded that an<br />
extrapolation on the basis of body weight or body surface<br />
area would yield UL <strong>for</strong> children that were incompatible<br />
with known nutrient requirements and refrained from<br />
recommending UL <strong>for</strong> children. Physiological differences<br />
between adults and young children, especially<br />
at a young age, are both quantitative and qualitative<br />
in nature. Existing differences in substrate absorption,<br />
metabolism, deposition in tissues during growth, and<br />
renal or other excretion that may affect UL of nutrient<br />
intakes are not always closely related to body size. The<br />
Committee recommends this issue be reviewed in order<br />
to establish whether further refinements in the approach<br />
or further research are needed. [19]<br />
That being said, until appropriate data are available,<br />
extrapolation models will have to be considered <strong>for</strong><br />
predicting NIVs <strong>for</strong> some nutrients.<br />
With regard to adults, the major need <strong>for</strong> extrapolation<br />
is in setting nutrient recommendations <strong>for</strong> older<br />
adults. Although the approach used is generally <strong>based</strong><br />
on adjustment <strong>for</strong> reference body weights between the<br />
two age groups, this would not account <strong>for</strong> differences<br />
in absorption or excretion of nutrients owing to degenerative<br />
processes, metabolic rate, or activity levels. To<br />
address these biological variables, metabolic studies in<br />
age-specific populations are much needed.<br />
Approaches used <strong>for</strong> extrapolations between ages to<br />
derive nutrient recommendations<br />
Extrapolation <strong>based</strong> on indicators of average body size<br />
or metabolic turnover is the easiest way to calculate<br />
nutrient reference values <strong>for</strong> different age groups but<br />
obviously will result in marked errors, particularly<br />
<strong>for</strong> those nutrients which are deposited in significant<br />
amounts in tissues during growth, such as amino acids,<br />
calcium, iron, and others.<br />
Extrapolation <strong>based</strong> on body size<br />
If there is no evidence of an association between<br />
metabolic rate and nutrient requirement, the nutrient<br />
requirement is often estimated as directly proportional<br />
to total body weight using age- and sex-appropriate<br />
reference body weights. Between countries, the<br />
population-<strong>based</strong> reference weights employed in such<br />
calculations will vary, thus leading to one significant<br />
source of variation between derived nutrient recommendations.<br />
A generic mathematical model <strong>based</strong> on body weight<br />
is<br />
Calculated<br />
reference<br />
intake age<br />
=<br />
adult<br />
reference<br />
intake<br />
×<br />
representative<br />
weight age<br />
representative<br />
weight adult<br />
Such a direct extrapolation <strong>based</strong> on body weight alone<br />
does not take into account intermediary metabolic<br />
rates, energy intake, and basal metabolic rates and will<br />
result in consistently lower values than values <strong>based</strong> on<br />
body surface area or metabolic body weight.<br />
Extrapolation <strong>based</strong> on metabolic turnover<br />
When appropriate data are not available to determine<br />
a nutrient requirement or upper level of intake <strong>for</strong><br />
children or adolescents, estimates have been derived<br />
by extrapolating down by taking the values derived <strong>for</strong><br />
adults to the 0.75 power of body mass, which adjusts<br />
<strong>for</strong> metabolic differences related to body weight [20,<br />
21]. This method assumes that the maintenance needs<br />
of the nutrient, expressed with respect to metabolic<br />
weight, are similar <strong>for</strong> adults and children.<br />
Calculations may be related to metabolic turnover.<br />
Nutrient reference intakes might be estimated on the<br />
basis of relative body surface area, which shows some<br />
correlation with basal metabolic rate (BMR), following<br />
the <strong>for</strong>mula<br />
Calculated<br />
reference<br />
intake age<br />
=<br />
adult<br />
reference<br />
intake<br />
S. A. Atkinson and B. Koletzko<br />
×<br />
representative body<br />
surface areaage<br />
representative body<br />
surface area adult<br />
This method of calculation will result in higher relative
Life-stage groups and nutrient intake values<br />
nutrient reference intake values than those <strong>based</strong> on<br />
body weight, as exemplified in table 1.<br />
It was first proposed in the 19th century that BMR<br />
can also be roughly estimated by calculating metabolic<br />
body mass as body mass 0.66 [23], whereas an estimation<br />
as body mass 0.75 was proposed in the first half of<br />
the 20th century [20, 24]. The controversy about the<br />
adequate choice of the exponent to be used in the calculation<br />
of metabolic body mass has not been resolved<br />
today, and values in the range from 0.6 to 0.8 are currently<br />
proposed [21, 25–27]. With these considerations<br />
taken into account, nutrient reference intake values can<br />
be estimated <strong>based</strong> on different approaches to estimating<br />
metabolic body mass, such as<br />
or<br />
Calculated<br />
reference<br />
intake<br />
age<br />
Calculated<br />
reference<br />
intake<br />
age<br />
� representative �<br />
adult � weightage<br />
�<br />
= reference<br />
� �<br />
�<br />
intake � representative<br />
�<br />
�<br />
�<br />
weight adult<br />
adult<br />
= reference<br />
intake �<br />
� representative �<br />
� weightage<br />
�<br />
�<br />
�<br />
� representative<br />
�<br />
�<br />
�<br />
weight adult<br />
0. 66<br />
0. 75<br />
Either of these models will produce higher reference<br />
intake values <strong>for</strong> children than those <strong>based</strong> on body<br />
mass.<br />
It cannot be stressed enough that these approaches to<br />
calculation of nutrient requirements cannot account <strong>for</strong><br />
age-related and maturational differences in absorption,<br />
metabolism, deposition, excretion, and homeostatic<br />
mechanisms, which are known to vary considerably<br />
<strong>for</strong> different nutrients. Thus, a science-<strong>based</strong> approach<br />
should take into account the specific conditions of<br />
turnover <strong>for</strong> each nutrient.<br />
Approaches to extrapolation employed in <strong>dietary</strong><br />
standards<br />
For the DRI reports adopted in Canada and the <strong>United</strong><br />
States, the specific equations employed are summarized<br />
in table 2. For adults, the estimated average requirement<br />
reflects maintenance needs only. When such data<br />
are extrapolated down to growing children, a factor <strong>for</strong><br />
growth must be added. The factor <strong>for</strong> growth applied<br />
<strong>for</strong> all nutrients was the approximate proportional<br />
increase in protein requirements <strong>for</strong> growth [9], as<br />
indicated under (2) in table 2. In situations where an<br />
average intake (AI) was set <strong>for</strong> adults (not an estimated<br />
average requirement [EAR]), the value <strong>for</strong> the AI <strong>for</strong><br />
adults was substituted <strong>for</strong> EAR in the equations, an AI<br />
was calculated, and no recommended <strong>dietary</strong> allowance<br />
(RDA) was set.<br />
S65<br />
TABLE 1. Relative nutrient intake reference values obtained<br />
by extrapolation from adult reference values <strong>based</strong> on a comparison<br />
of body weights or body surface areas, respectively a<br />
Age<br />
Relative nutrient<br />
intake <strong>based</strong> on<br />
child/adult weight<br />
Relative nutrient<br />
intake <strong>based</strong> on<br />
child/adult body<br />
surface area<br />
Newborn 0.05 0.11<br />
0.5 yr 0.10 0.19<br />
1 yr 0.14 0.23<br />
10 yr 0.46 0.59<br />
Source: calculated from data of Przyrembel [22].<br />
The vitamins and minerals <strong>for</strong> which extrapolation<br />
models were employed in the DRI reports of the <strong>United</strong><br />
States and Canada [28–31], the age groups, and the<br />
model employed <strong>for</strong> extrapolation are summarized in<br />
table 3. For most nutrients, the model <strong>for</strong> extrapolation<br />
included an adjustment <strong>for</strong> body weight whether the<br />
value was being extrapolated from younger to older<br />
age groups or vice versa. A growth factor was added<br />
if the extrapolation was from adults to children. The<br />
exception to the adjustment to body weight was <strong>for</strong><br />
sodium in older adults, <strong>for</strong> which an adequate intake<br />
was extrapolated from that <strong>for</strong> younger adults <strong>based</strong><br />
on the combined average of median energy intakes <strong>for</strong><br />
men and women according to the NHANES III data,<br />
since energy intake declines with age.<br />
The macronutrients <strong>for</strong> which extrapolations were<br />
employed to set the EAR or AI are summarized in<br />
table 4. For the DRI report on macronutrients [6], the<br />
recommendations <strong>for</strong> carbohydrate and fiber intake<br />
in children over 1 year of age are all extrapolated from<br />
adult values. For energy, the values <strong>for</strong> energy deposition<br />
during growth were derived from the calculated<br />
energy content of tissue deposition, using various<br />
reference growth rates, depending on age category.<br />
Similarly, <strong>for</strong> protein intakes beyond 6 months, the<br />
value <strong>for</strong> protein deposition was derived from data <strong>for</strong><br />
protein accumulation in children fitted to a polynomial<br />
equation.<br />
In other reports reviewed, there was meager specific<br />
in<strong>for</strong>mation as to methods of extrapolation employed in<br />
deriving recommendations <strong>for</strong> macronutrient intakes,<br />
and often the method was adopted from another country<br />
report. The <strong>dietary</strong> allowances <strong>for</strong> the Caribbean<br />
[16] rely heavily on recommendations from the WHO<br />
report [9] or countries such as Canada. For example,<br />
recommendations <strong>for</strong> energy intake were <strong>based</strong> on<br />
BMR from body weight using equations found in the<br />
WHO report of 1985 [9]. Total energy expenditure<br />
(TEE) was then calculated by multiplying the BMR<br />
by a factor <strong>for</strong> physical activity level (PAL), which was<br />
classified as light, moderate, or heavy. For children,<br />
assuming that physical activity might be greater than<br />
in developed countries, 5% was added to the TEE to
S66<br />
TABLE 2. Extrapolation equations used in the DRI reports of Canada and the <strong>United</strong> States [5, 6, 28–31 a ]<br />
1. Extrapolation up from the AI <strong>for</strong> younger infants (0–6 mo) to older infants (7–12 mo):<br />
AI 7–12 mo = AI 0–6 mo × (F)<br />
allow <strong>for</strong> desirable physical activity, as described in<br />
the WHO report [9]. Reference body weights were<br />
adopted from the NCHS data from 1977. The report<br />
did not contain any further examples of extrapolations<br />
or interpolations.<br />
In the D-A-CH reference values <strong>for</strong> nutrient intakes<br />
[8], the method of extrapolation or interpolation could<br />
not be discerned from the statement, “In those frequent<br />
cases in which recommendations could not be made <strong>for</strong><br />
every age group, values <strong>for</strong> intermediate age groups had<br />
to be interpolated.”<br />
In the population reference intake (PRI) report <strong>for</strong><br />
the European Community provided by the Scientific<br />
F = (weight 7–12 mo /weight 0–5 mo ) 0.75<br />
2. Extrapolation from AI or the EAR <strong>for</strong> adults to an AI or EAR <strong>for</strong> children <strong>for</strong> all nutrients except potassium and<br />
sodium:<br />
(AI) EAR child = (AI) EA adult × (F)<br />
F = (weight child /weight adult ) 0.75 (1 + growth factor*)<br />
*Growth factors (proportional increase in protein requirements <strong>for</strong> growth from FAO/WHO/UNU [9])<br />
Age group Growth factor<br />
7 mo–3 yr 0.30<br />
4–8 yr 0.15<br />
9–13 yr 0.15<br />
14–18 yr (males) 0.15 (0 <strong>for</strong> females)<br />
3. For water, potassium, and sodium [31], extrapolation from AI <strong>for</strong> adults to an AI <strong>for</strong> children:<br />
AI child = AI adult × (F)<br />
S. A. Atkinson and B. Koletzko<br />
Where F = (energy intake child /energy intake adult )<br />
Energy intakes rather than body weights were used in the extrapolation equations because high levels of physical<br />
activity are associated with increased losses of electrolytes in sweat. The energy intake values were <strong>based</strong> on the average<br />
of median energy intakes <strong>for</strong> both sexes <strong>for</strong> each age group <strong>based</strong> on data from NHANES III.<br />
4. Extrapolation of EAR/AI up from younger adults <strong>for</strong> older adults vice versa was accomplished using reference body<br />
weights, except in the case of sodium:<br />
EAR/AI younger adults = EAR/AI older adults × (F)<br />
F = weight younger adults /weight older adults<br />
For sodium [31], the extrapolation equation employed was adjusted <strong>for</strong> combined median energy intakes <strong>for</strong> men and<br />
women:<br />
AI older adults = AI younger adults × energy intake older adults /energy intake younger adults<br />
5. In situations in which data were not available to set the UL <strong>for</strong> children (which occurred frequently), the UL <strong>for</strong> adults<br />
was extrapolated down using reference body weights <strong>for</strong> all nutrients except sodium, and in this case median energy<br />
intake was used in the adjustment equations:<br />
UL child = UL adult × weight child /weight adult<br />
For sodium the extrapolation equation was:<br />
UL child = UL adult × energy intake child /energy intake adult<br />
DRI, <strong>dietary</strong> reference intake; AI, average intake; EAR, estimated average requirement; UL, upper tolerable limit of nutrient intake.<br />
a. Median reference weights <strong>for</strong> children, adolescents, and adults were derived from reference weights <strong>for</strong> children and adults in the <strong>United</strong><br />
States (NHANES III, 1988-94) in DRI reports [5, 28–30] published prior to 2002. After that the time, in reports published <strong>for</strong> macronutrients<br />
[6] and water and electrolytes [31], updated data that provided median reference heights and weights <strong>for</strong> the US population were<br />
used [7].<br />
Committee <strong>for</strong> Food [10], PRIs <strong>for</strong> children aged<br />
1 year or more have generally been derived, in the<br />
absence of reliable data, by extrapolation from the PRI<br />
of young adults on the basis of energy expenditure<br />
(e.g., thiamin, riboflavin, niacin, folate, vitamin B 12 ,<br />
and iodine), unless specific other statements were<br />
made. In the case of some nutrients, recommended<br />
intake values <strong>for</strong> children were derived on the basis of<br />
further considerations. The specific considerations <strong>for</strong><br />
each nutrient are summarized in table 5. For infants<br />
aged 6 to 11 months, the values were usually derived<br />
by interpolation between those <strong>for</strong> infants under<br />
6 months, which are often derived from intakes of
Life-stage groups and nutrient intake values<br />
TABLE 3. Summary of vitamins and minerals <strong>for</strong> which AI/EAR was derived from extrapolations<br />
in the Canada/USA DRI reports [28–31]<br />
Age group Vitamins Macro minerals Micro minerals<br />
7–12 mo Vitamin A a<br />
Vitamin K a<br />
Thiamin b<br />
Riboflavin a,b<br />
Niacin b<br />
Vitamin B 6 a,b<br />
Folate a,b<br />
Pantothenate a,b<br />
Biotin a<br />
Choline a<br />
1–3 yr Vitamin A b<br />
Thiamin b<br />
Riboflavin b<br />
Niacin b<br />
Vitamin B 6 b<br />
Folate b<br />
Pantothenate b<br />
Biotin a<br />
Choline b<br />
Vitamin C c<br />
Vitamin E c<br />
Calcium e<br />
Magnesium c<br />
Potassium f<br />
Sodium f<br />
4–8 yr As <strong>for</strong> 1–3 yr Magnesium c<br />
Potassium f<br />
Sodium f<br />
9–13 yr As <strong>for</strong> 4–8 yr Potassium f<br />
Sodium f<br />
14–18 yr As <strong>for</strong> 4–8 yr Potassium f<br />
Sodium f<br />
19–30 yr<br />
31–50 yr Vitamin C d<br />
Vitamin E d<br />
51–70 yr Vitamin C d<br />
Vitamin E d<br />
> 70 yr Vitamin C d<br />
Vitamin E d<br />
Phosphorus d<br />
Sodium g<br />
Calcium h<br />
Phosphorus d<br />
Sodium g<br />
Iodine a<br />
Manganese b<br />
Molybdenum a<br />
Chromium b<br />
Copper c<br />
Molybdenum c<br />
Selenium c<br />
Chromium b<br />
Copper c<br />
Molybdenum c<br />
Selenium c<br />
Chromium b<br />
Copper c<br />
Molybdenum c<br />
Selenium c<br />
Chromium b<br />
Copper c<br />
Iodine c<br />
Molybdenum c<br />
Selenium d<br />
Selenium d<br />
Iodine d<br />
Copper d<br />
Molybdenum d<br />
Zinc d<br />
Selenium d<br />
Iodine d<br />
Iron d<br />
Copper d<br />
Molybdenum d<br />
Zinc d<br />
Selenium d<br />
a. Average intake (AI) extrapolated up from AI <strong>for</strong> infants 0–6 months.<br />
b. AI extrapolated down from adults to children adjusted <strong>for</strong> body weight.<br />
c. Estimated average requirement (EAR) extrapolated down from adults or older children to young<br />
children adjusted <strong>for</strong> body weight.<br />
d. EAR extrapolated up from younger adults to older adults.<br />
e. AI extrapolated down from older children to younger children adjusted <strong>for</strong> body weight.<br />
f. AI extrapolated down from adult values adjusted <strong>for</strong> median energy intakes.<br />
g. AI extrapolated up from younger adults <strong>based</strong> on median energy intakes.<br />
h. AI extrapolated up from younger adults.<br />
S67
S68<br />
TABLE 4. Summary of macronutrients <strong>for</strong> which AI/EAR was derived in all or part from extrapolations in the Canada/USA<br />
DRI report [6]<br />
Age group Carbohydrates Fiber Protein Energy<br />
0–6 mo Value <strong>for</strong> energy deposition<br />
during growth was<br />
derived from the calculated<br />
energy content<br />
of tissue deposition c<br />
adjusted to the 50th percentile<br />
of weight gain d<br />
7–12 mo Value <strong>for</strong> protein deposition<br />
during growth was<br />
derived from data <strong>for</strong><br />
protein accumulation<br />
in children a,b that were<br />
fitted to polynomial<br />
equations<br />
1–3 yr Extrapolated from adult<br />
values (EAR = 100 g/<br />
day; RDA = 130 g/day)<br />
without adjustment<br />
Extrapolated from adult<br />
AI of 14 g fiber/1,000<br />
kcal × median energy<br />
intake level (kcal/1000<br />
kcal/day)<br />
TABLE 5. Population reference intakes <strong>for</strong> children in the European Community aged 1 year and over derived, in the absence<br />
of adequate data, by extrapolation from the population reference intakes (PRIs) of young adults on the basis of energy expenditure<br />
or other criteria by the Scientific Committee <strong>for</strong> Food [10]<br />
Nutrient Basis <strong>for</strong> extrapolation<br />
S. A. Atkinson and B. Koletzko<br />
Same as <strong>for</strong> 0–6 mo<br />
Same as <strong>for</strong> 7–12 mo Same as <strong>for</strong> 0–6 mo<br />
4–8 yr Same as <strong>for</strong> 1–3 yr Same as <strong>for</strong> 1–3 yr Same as <strong>for</strong> 7–12 mo Value <strong>for</strong> energy deposition<br />
during growth was<br />
derived from the calculated<br />
rates of weight gain<br />
of children in the FELS<br />
longitudinal study e and<br />
rates of protein and fat<br />
deposition <strong>for</strong> children f<br />
9–13 yr Same as <strong>for</strong> 1–3 yr Same as <strong>for</strong> 1–3 yr Same as <strong>for</strong> 7–12 mo Same as <strong>for</strong> 3–8 yr<br />
14–18 yr Same as <strong>for</strong> 1–3 yr Same as <strong>for</strong> 1–3 yr Same as <strong>for</strong> 7–12 mo Same as <strong>for</strong> 3–8 yr<br />
AI, average intake; EAR, estimated average requirement; DRI, <strong>dietary</strong> reference intake; RDA, recommended <strong>dietary</strong> allowance<br />
a. Butte et al. [32]. c. Butte et al. [34]. e. Baumgartner et al. [36].<br />
b. Ellis et al. [33]. d. Guo et al. [35]. f. Fomon et al. [37].<br />
Thiamin, riboflavin, niacin, folate,<br />
vitamin B12 , iodine<br />
Energy expenditure<br />
Protein Amount of high-quality egg or milk protein needed <strong>for</strong> achieving nitrogen balance<br />
plus the additional need <strong>for</strong> growth<br />
Polyunsaturated fatty acids Estimated needs <strong>for</strong> tissue deposition<br />
Retinol Smooth transition (interpolation) from infant values, <strong>based</strong> on provision with<br />
breastmilk, to adult values<br />
Vitamin B6 Reference intake <strong>for</strong> protein<br />
Vitamin C Gradual increase (interpolation) from infant to adult reference values<br />
Vitamin E Dietary intake of polyunsaturated fatty acids<br />
Calcium Estimated deposition <strong>for</strong> skeletal development<br />
Magnesium Body weight with additional adjustments <strong>based</strong> on physiological considerations<br />
Potassium Factorial approach<br />
Iron Estimated tissue deposition and losses<br />
Zinc Factorial approach<br />
Copper Estimated tissue deposition and losses<br />
Selenium Body weight
Life-stage groups and nutrient intake values<br />
breastfed infants, and those calculated <strong>for</strong> the group<br />
from 1 to 3 years of age.<br />
The Finnish Nutrition Recommendations [12] rely<br />
on the Nordic Nutrition Recommendations [13] and<br />
the WHO report [9]. For example, the energy recommendations<br />
are <strong>based</strong> on BMR corrected to a PAL;<br />
however, estimates were <strong>based</strong> on a reference man or<br />
woman rather than reference weights <strong>for</strong> age, as was<br />
done in the DRIs of the <strong>United</strong> States and Canada<br />
and the Caribbean reports. This report did not contain<br />
any examples of application of extrapolations<br />
or interpolations in the derivation of the nutrient<br />
recommendations.<br />
The report from France [14] does not appear to<br />
employ extrapolations in the development of nutrient<br />
recommendations. The values provided in this report<br />
represent recommended intakes <strong>for</strong> populations, not<br />
individuals.<br />
The Mexican report [15] employed reference weights,<br />
derived as outlined above, in developing some of the<br />
nutrient recommendations. No in<strong>for</strong>mation was provided<br />
as to whether extrapolations were employed<br />
across age groups. For the <strong>dietary</strong> reference values<br />
(DRVs) from the <strong>United</strong> Kingdom, it was not possible<br />
to determine the basis of the DRVs <strong>for</strong> children from<br />
the statement, “Some DRVs are also related to body<br />
weight.”<br />
Extrapolations of upper safe levels of nutrient intakes<br />
<strong>for</strong> children<br />
In the DRI reports of Canada and the <strong>United</strong> States,<br />
extrapolations <strong>based</strong> on body weight were used to<br />
establish tolerable upper levels <strong>for</strong> children from adult<br />
values when scientific data were not available.<br />
In Europe, the upper safe levels (ULs) of nutrient<br />
intake established by the Scientific Committee <strong>for</strong><br />
Food and the European Food Safety Authority [19]<br />
were estimated <strong>for</strong> children, in the absence of adequate<br />
data, on the basis of criteria specific <strong>for</strong> each nutrient.<br />
For instance, relative body weight (using reference<br />
weights), was used <strong>for</strong> vitamin B 6 , niacin, folate,<br />
copper, selenium, and molybdenum; or body surface<br />
area (body weight 0.75 ) was used <strong>for</strong> zinc and boron.<br />
In some instances, the upper level was <strong>based</strong> on agespecific<br />
outcomes, such as <strong>for</strong> fluoride, where dental<br />
fluorosis in young children and bone health in older<br />
children were the outcomes used to set the UL. In the<br />
case of magnesium, the same UL was set <strong>for</strong> adults and<br />
children over 4 years of age, but the available data did<br />
not allow the definition of a UL <strong>for</strong> younger children.<br />
However, the committee expressed severe concerns<br />
regarding the limitations in the methods available and<br />
in the approach it has used to extrapolate ULs <strong>for</strong> children,<br />
and it recommended that this issue “be reviewed<br />
in order to establish whether further refinements in the<br />
approach or further research are needed” [19].<br />
Nutrient recommendations established<br />
using an extrapolation model <strong>for</strong><br />
physiological states of pregnancy<br />
and lactation<br />
S69<br />
Adequate research results from which to derive the<br />
requirements <strong>for</strong> human subjects during pregnancy<br />
and lactation are not available <strong>for</strong> a great number of<br />
nutrients. For pregnancy, often a factorial model is<br />
applied using knowledge of fetal accretion of nutrients<br />
and addition of nutrients in the expanded fluid volume<br />
of a woman during pregnancy [10]. Insensible losses<br />
of nutrients and altered efficiency of absorption of<br />
nutrients during pregnancy are applied to adjust the<br />
nutrient accretion value, if such in<strong>for</strong>mation is known.<br />
If the basis <strong>for</strong> the estimate of nutrient accretion is not<br />
normally distributed, then modeling of the data is done<br />
<strong>for</strong> some nutrients, such as iron.<br />
For example, a factorial estimate of nutrient intake<br />
during pregnancy is calculated as the sum of the following:<br />
» Nutrient intake <strong>for</strong> age in the nonpregnant state;<br />
» Fetal accretion of nutrients (or glucose/free fatty acid<br />
utilization);<br />
» Nutrients to supply expanded maternal tissue, metabolic<br />
activity, and/or fluid volume;<br />
» Adjustment <strong>for</strong> change in insensible losses, physical<br />
activity, or efficiency of absorption, if known;<br />
If the values used as the basis of this estimate are not<br />
normally distributed, then modeling of data is required,<br />
<strong>for</strong> example, <strong>for</strong> nutrients such as iron.<br />
For lactation, the general approach to the factorial<br />
model is simply to sum the nutrient needs <strong>for</strong> a woman<br />
of similar periconceptional age who is not lactating<br />
with the amount of nutrient delivered into an average<br />
volume of breastmilk, as used in the Canada/USA<br />
DRI reports [5, 6, 28–31] and the PRI report <strong>for</strong> the<br />
European Community provided by the Scientific<br />
Committee <strong>for</strong> Food [10]. However, the average daily<br />
intake of breastmilk has been reported to vary between<br />
studies [38], as does milk composition [39]. Whereas<br />
average milk volume might vary between populations<br />
in regions with different temperatures or population<strong>based</strong><br />
body size, the composition of human milk should<br />
be relatively stable in well-nourished mothers. In addition,<br />
adjustments are sometimes applied in estimating<br />
needs <strong>for</strong> energy, protein, or carbohydrate to account<br />
<strong>for</strong> utilization (e.g., protein), conversion efficiency (e.g.,<br />
energy), or maternal weight loss during lactation.<br />
The approaches to derivation of estimates of recommended<br />
intakes in pregnancy and lactation across<br />
agencies and countries are summarized in table 6<br />
<strong>for</strong> macronutrients and in table 7 <strong>for</strong> vitamins. Since<br />
many reports provide nutrient recommendations <strong>for</strong><br />
different stages of pregnancy and lactation, these are<br />
individually noted. Although the general method of<br />
extrapolation might be similar across reports, the
S70<br />
TABLE 6. Summary of extrapolations used to determine recommended macronutrient intakes <strong>for</strong> pregnancy and lactation <strong>for</strong> all reports reviewed<br />
Agency Pregnancy Lactation<br />
Protein<br />
The EAR <strong>for</strong> age plus the amount of protein secreted in breastmilk<br />
adjusted <strong>for</strong> <strong>dietary</strong> protein utilization. RDA is the EAR plus an estimated<br />
CV of 12%<br />
Canada/USA[6] a Only <strong>for</strong> 2nd half of pregnancy: the EAR <strong>for</strong> age plus the amount <strong>for</strong><br />
tissue deposition in mother and fetus and maintenance of the expanded<br />
protein tissue pool<br />
RDA is the EAR plus an estimated CV of 12%<br />
Addition of the amount of protein secreted in breastmilk (no adjustment<br />
<strong>for</strong> efficiency of conversion of <strong>dietary</strong> protein to milk protein owing to<br />
Caribbean [16] Adopted from WHO (1985) [9]: an increase of 6 g/day to nonpregnant<br />
allowance<br />
25% nonprotein nitrogen in breastmilk)<br />
Recommended protein intake is derived from the amount of protein<br />
secreted in the milk and given a 70% protein utilization:<br />
D-A-CH [8] From 4th month additional * 10 g (= 58 g/day) or 6.3 g/MJ<br />
(general: upper limit <strong>for</strong> adults of protein intake at 2.0 g/kg/day)<br />
+ 15 g (= 63 g/day) or 5.8 g/MJ (p32)<br />
(p32)<br />
Individual variation depending on amount of breastmilk provided:<br />
1st 6 mo + 16 g/day<br />
2nd 6 mo + 12 g/day<br />
Based on FAO/WHO/UNU (1985) [9], body compositional changes,<br />
increased efficiency of utilization of amino acids:<br />
Pregnancy + 10 g/day<br />
European Community<br />
[10]<br />
Finland [12] b<br />
France [14] c<br />
EAR 0.8 g/kg/day<br />
RDA 1.0 g/kg/day<br />
UL 25%<br />
(p75)<br />
Mexico [15] a<br />
Netherlands [40] d Derived from amount of nitrogen lost and additional nitrogen required<br />
<strong>for</strong> pregnancy and lactation<br />
EAR 0.7 g/kg/day<br />
RDA 0.9 g/kg/day<br />
UL 25%<br />
(p65 + 75)<br />
New Zealand/<br />
Australia [41] e<br />
Nordic [13] 10%–20% of energy intake, <strong>based</strong> on physiological considerations 10%-20% of energy intake, <strong>based</strong> on physiological considerations<br />
S. A. Atkinson and B. Koletzko<br />
Requirements are <strong>based</strong> on protein content of milk added to value <strong>for</strong><br />
nonpregnancy<br />
RNI:<br />
0-4 mo: +11 g/day<br />
4 + mo: + 8 g/day<br />
<strong>United</strong> Kingdom [17] f Requirements were calculated to allow <strong>for</strong> protein retention in the products<br />
of conception and in the maternal tissue associated with the birth of<br />
a 3.3-kg infant<br />
DRV: + 6 g/day<br />
(<strong>for</strong> 100% digestibility)<br />
Carbohydrates<br />
Canada/USA [6] a EAR <strong>for</strong> age plus fetal brain glucose utilization EAR <strong>for</strong> age plus average human milk content of carbohydrate<br />
Caribbean [16] Proportion of additional energy as carbohydrate calculated as 55%–60% Same as <strong>for</strong> pregnancy<br />
of energy
Life-stage groups and nutrient intake values<br />
D-A-CH [8] A guiding value of > 50% of <strong>dietary</strong> energy from carbohydrates is substantiated<br />
by epidemiologic findings. No special recommendations <strong>for</strong><br />
pregnant or lactating women<br />
European Union [10] No recommendation given No recommendation given<br />
Finland [12] b<br />
France [14] c<br />
Mexico [15] a<br />
RDA 40%<br />
Netherlands [40] d Digestible carbohydrates: RDA 40%, <strong>based</strong> on the 97.5 percentile of<br />
endogenous glucose production. This remains unchanged during pregnancy;<br />
RDA is the same <strong>for</strong> pregnant and nonpregnant women<br />
(p137 + 145)<br />
New Zealand/<br />
Australia [40] e<br />
Nordic [13] No specific recommendation No specific recommendation<br />
<strong>United</strong> Kingdom [17] f<br />
Energy<br />
EER <strong>for</strong> age plus milk energy output minus weight loss<br />
Canada/USA [6] a EER <strong>for</strong> age plus change in TEE plus pregnancy energy deposition (different<br />
<strong>for</strong> each of 3 trimesters)<br />
Caribbean [16] Additional energy suggested by WHO [9] (285 kcal/day) Energy <strong>for</strong> age plus milk energy, the energy cost of producing the milk<br />
and an assumed 80% efficiency of conversion of <strong>food</strong> energy to milk<br />
minus energy from weight loss<br />
Considering the energy contents of breastmilk, energy needs <strong>for</strong> milk synthesis<br />
and utilization of maternal endogenous fat stores during lactation,<br />
the recommended additional energy intake independent of PAL is:<br />
Up to completion of 4th month: + 2.7 MJ (635 kcal)/day<br />
After the 4th month:<br />
Full breastfeeding + 2.2 MJ (525 kcal)/day, partial breastfeeding + 1.2 MJ<br />
D-A-CH [8] f Energy requirement is calculated by considering the BMR, physical activity,<br />
thermogenesis after <strong>food</strong> intake, and needs <strong>for</strong> growth, pregnancy<br />
and lactation. Pregnant women should receive an additional 1.1 MJ (255<br />
kcal)/day <strong>for</strong> the duration of pregnancy, independent of PAL<br />
(285 kcal)/day<br />
Energy requirements proportional to quantity of milk produced, considering<br />
the conversion efficiency of <strong>dietary</strong> energy to milk energy (now<br />
proposed 97%) and average weight loss following delivery<br />
EER estimated with BMR (WHO/FAO/UNU, 1985) [9] and PAL<br />
Thin women: 1.7 MJ/day<br />
Overweight and normal-weight women: 0.75 MJ/day from 10th week of<br />
pregnancy to reach lowest neonatal and postnatal mortality<br />
European Community<br />
[10]<br />
EAR + 2.1 MJ/day<br />
Based on energy required <strong>for</strong> the production of human milk and an average<br />
metabolic combustion of 0.5 kg of body fat/mo (method used: factorial)<br />
(p58 + 59)<br />
continued<br />
Netherlands [40] d EAR + 1.2 MJ/day<br />
Based on increased metabolic rate and reduced level of physical activity<br />
during pregnancy (method used: factorial and 2H20 18O) (p57 + 58)<br />
S71
S72<br />
TABLE 6. Summary of extrapolations used to determine recommended macronutrient intakes <strong>for</strong> pregnancy and lactation <strong>for</strong> all reports reviewed (continued)<br />
Agency Pregnancy Lactation<br />
Based on a factorial approach, an extra energy intake of 2.0 MJ (280 kcal)/<br />
day is recommended<br />
Nordic [13] Increased daily energy needs estimated as 1,500 kJ (350 kcal) in the 2nd<br />
trimester and 2,100 kJ (350 kcal) in the 3rd trimester, which can be at<br />
least partly covered by reduced PAL. Increased <strong>dietary</strong> energy need<br />
acknowledged but not specified<br />
Values <strong>for</strong> milk output derived from combined data from British and<br />
Swedish women, including a 4% correction to allow <strong>for</strong> insensible water<br />
losses. These values are considered representative of well-nourished<br />
women and differ from those in the FAO/WHO/UNU) [9] by less than<br />
10% in the early months.<br />
Gross energy supplied by the mother, conversion from maternal diet to<br />
gross milk energy (80%), maternal weight loss (500 g/mo), and maternal<br />
EAR<br />
EAR:<br />
1 mo: + 1.90 MJ or<br />
450 kcal/day<br />
2 mo: + 2.2 MJ or<br />
530 kcal/day<br />
3 mo: + 2.40 MJ or<br />
570 kcal/day<br />
EARs recognize 2 distinct groups of breastfeeding women:<br />
Group 1: exclusive or almost exclusive breastfeeders who progressively<br />
introduce weaning <strong>food</strong><br />
Group 2: women who introduce only limited complementary <strong>food</strong> after<br />
3–4 mo and intend that breastfeeding provide primary source <strong>for</strong> 6 or<br />
more months<br />
<strong>United</strong> Kingdom [17] d Increase of tissue mass and metabolic activity (resulting in greater BMR<br />
and energy cost of movement):<br />
EAR + 0.8 MJ/day or 200 kcal/day only during the 3rd trimester<br />
S. A. Atkinson and B. Koletzko<br />
EAR, estimated average requirement; RDA, recommended <strong>dietary</strong> allowance; D-A-CH, Germany-Austria-Switzerland-Slovenia; CV, coefficient of variation; UL, upper tolerable limit of nutrient intake;<br />
DRV, <strong>dietary</strong> reference value; RNI, reference nutrient intake; EER, estimated energy requirement; TEE, total energy expenditure; BMR, basal metabolic rate; PAL, physical activity level<br />
a. The reports from Canada/USA [6] and Mexico [15] assumed a milk volume of 780 mL/day during lactation <strong>for</strong> the first 6 months and 640 mL/day after 6 months.<br />
b. The Finnish recommendations [12] <strong>for</strong> some nutrients are higher <strong>for</strong> pregnant and lactating women than <strong>for</strong> women of periconceptual age, but no in<strong>for</strong>mation is provided in the report as to the basis<br />
of these special recommendations. The recommended intakes are intended <strong>for</strong> use in diet planning <strong>for</strong> groups, but it is noted that the individual requirements are often lower than the recommended<br />
intake <strong>for</strong> populations.<br />
c. In the report from France [14], the average volume of milk produced on which the recommended intake was derived <strong>for</strong> lactation was 750 to 850 mL/day.<br />
d. A committee of the Health Council has drawn up these recommendations, and the Standing Committee on Nutrition and the Standing Committee on Medicine have reviewed them [40].<br />
e. As an interim measure, Australian Dietary Intakes [41] were adopted, and adapted where necessary <strong>for</strong> use in New Zealand.<br />
f. The Panel on Dietary Reference Values (DRVs) was set up by 1987 by the Committee on Medical Aspects of Food Policy (COMA) to review the RDAs, set in 1979. Four expert working groups reported<br />
their considerations and conclusions to the panel [17].
Life-stage groups and nutrient intake values<br />
TABLE 7. Summary of extrapolations used to determine recommended vitamin intakes <strong>for</strong> pregnancy and lactation <strong>for</strong> all<br />
reports reviewed<br />
Agency Pregnancy Lactation<br />
Vitamin A<br />
Canada/USA [28] a EAR <strong>for</strong> age plus estimated daily accumulation<br />
by fetus<br />
Caribbean [16] Add amount <strong>for</strong> maternal stores and fetal growth<br />
to nonpregnant value<br />
European<br />
Community [10]<br />
Plus 100 µg RE/day (= total 700 µg RE/day) to<br />
enhance maternal storage and provide <strong>for</strong> fetal<br />
supply.<br />
Intakes > 6,000 µg/day have been associated with<br />
birth defects<br />
Nordic [13] An additional 50 µg/day would be needed to<br />
achieve adequate accretion in fetal liver; to cover<br />
individual variation an additional 100 µg/day<br />
(total 800 µg/day) is recommended (p4 + 6)<br />
<strong>United</strong> Kingdom<br />
[17]<br />
Vitamin E<br />
Additional vitamin A supply to support fetal<br />
growth and maternal tissue growth, in line with<br />
FAO/WHO recommendations <strong>based</strong> on body<br />
pool size<br />
RNI: + 100 µg/day<br />
S73<br />
EAR <strong>for</strong> age plus amount secreted in human milk<br />
Add amount secreted in human milk (400 µg RE/<br />
day) in addition to nonpregnant value<br />
Plus 350 µg RE/day (= total 950 µg RE/day) <strong>based</strong><br />
on amount secreted with human milk<br />
An additional 400 µg/day (total 1,100 µg/day) is<br />
recommended to cover average milk excretion<br />
reported in Western countries as about 350–450<br />
µg/day<br />
To cover amounts secreted with milk RNI: 0–4<br />
mo and<br />
4+ mo: + 350 µg/day<br />
Canada/USA [28] a Add amount secreted in milk<br />
Caribbean [16] Add amount <strong>for</strong> fetal growth adjusted <strong>for</strong> incomplete<br />
absorption<br />
D-A-CH [8] Additional intake + 1 mg TE/day (total 13 mg<br />
TE/day) <strong>based</strong> on increased intakes of energy<br />
and polyunsaturated fatty acids<br />
European<br />
Community[10]<br />
Nordic [13] + 2 mg TE/day (2nd and 3rd trimesters) to cover<br />
additional needs<br />
<strong>United</strong> Kingdom<br />
[17]<br />
Vitamin C<br />
Add amount <strong>for</strong> vitamin E secreted in milk<br />
adjusted <strong>for</strong> incomplete absorption<br />
Additional intake + 5 mg TE/day (total 17 mg<br />
TE/day) <strong>based</strong> on increased intakes of energy<br />
and polyunsaturated fatty acids<br />
No specific recommendation No specific recommendation<br />
+ 2 mg TE/day to cover secretion with milk<br />
No specific recommendation No specific recommendation<br />
Canada/USA [28] a EAR <strong>for</strong> age plus amount secreted in human milk<br />
Caribbean [16] NA<br />
D-A-CH [8] Additional intake + 10 mg/day (total 110 mg/<br />
day), considering reduced plasma concentration<br />
and decreased body reserves during pregnancy,<br />
and bioavailability<br />
European Community<br />
[10]<br />
Additional intake + 10 mg/day (total 55 mg/day)<br />
to allow <strong>for</strong> the 50% higher fetal plasma levels<br />
and higher catabolic rate of the fetus<br />
Nordic [13] Additional intake + 10 mg/day (total 85 mg/day)<br />
to cover increased needs <strong>for</strong> fetal growth and<br />
catabolized vitamin C<br />
<strong>United</strong> Kingdom<br />
[17]<br />
Additional intake + 10 mg/day (total 50 mg/day)<br />
during the 3rd trimester to allow <strong>for</strong> the 50%<br />
higher fetal plasma levels and higher catabolic<br />
rate of the fetus<br />
Additional intake + 50 mg/day (total 150 mg/<br />
day), to cover excretion with breastmilk<br />
Additional intake + 25 mg/day (total 70 mg/day)<br />
to cover at least 20 mg/day excreted with breastmilk,<br />
assuming 85% bioavailability<br />
Additional intake + 25 mg/day (total 100 mg/day)<br />
to cover excretion with breastmilk<br />
Additional intake + 30 mg/day (total 70 mg/day)<br />
to ensure that maternal stores are maintained<br />
and breastmilk levels are in the upper half of<br />
physiological range<br />
EAR, estimated average requirement; RE, retinol equivalent; RNI, reference nutrient intake; D-A-CH, Germany-Austria-Switzerland-Slovenia;<br />
TE, alpha-tocopherol equivalent<br />
a. The reports from Canada/USA [5, 6, 28-31] assumed a milk volume of 780 mL/day during lactation <strong>for</strong> the first 6 months and 640 mL/day<br />
after 6 months.
S74<br />
reference values applied <strong>for</strong> fetal accretion of nutrients<br />
or nutrient composition of milk were often different;<br />
thus, variation between reports in the recommended<br />
intakes is likely. Unless geographic or racial differences<br />
can be proven <strong>for</strong> fetal accretion of nutrients<br />
or breastmilk composition, a future goal would be to<br />
standardize reference values across individual <strong>dietary</strong><br />
standard reports. For fetal accretion of nutrients, it is<br />
important that consistent source evidence be used.<br />
Most commonly, such in<strong>for</strong>mation is derived from<br />
the body composition of fetuses aborted or dying in<br />
the third trimester of pregnancy [42]. We recommend<br />
that when NIVs are developed <strong>for</strong> lactating women,<br />
the values <strong>for</strong> average daily milk volume provided by<br />
the WHO report on complementary feeding of young<br />
children in developing countries [38] should be used,<br />
and <strong>for</strong> milk nutrient composition the values cited<br />
in the DRI reports [5, 6, 29–32] <strong>for</strong> well-nourished<br />
women should be adopted.<br />
Future development of NIVs <strong>based</strong> on<br />
human research<br />
It is evident that further systematic scientific research<br />
is urgently required to provide adequate data on physiological<br />
nutrient requirements, especially <strong>for</strong> children<br />
and adolescents [2], pregnant and lactating women,<br />
and older adults. The opportunity is there, because<br />
methodological progress has made less invasive or noninvasive<br />
approaches available that allow ethical investigations<br />
of a number of these issues in healthy children,<br />
<strong>for</strong> example, and also in pregnant and lactating women.<br />
There<strong>for</strong>e, it would be feasible today to narrow many<br />
of the existing gaps in knowledge in this respect, if<br />
such research were given sufficient priority both by<br />
academic institutions and by funding agencies.<br />
A clear priority <strong>for</strong> the future development of NIVs<br />
is to conduct research that will provide <strong>for</strong> internationally<br />
applicable physiological data (e.g., on absorption,<br />
distribution, deposition, metabolism, and excretion of<br />
nutrients <strong>for</strong> different sex and life-stage groups) using<br />
state-of-the-science techniques. Opportunity exists<br />
with noninvasive measurements using stable isotope<br />
tracer methodology <strong>for</strong> energy expenditure, amino acid<br />
oxidation using stable isotope breath tests <strong>for</strong> the estimation<br />
of amino acid requirements [43], and turnover<br />
of macrominerals (e.g., calcium and magnesium) and<br />
trace elements (e.g., iron and zinc). Body composition<br />
measurements to obtain data on nutrient accretion<br />
can be obtained longitudinally by methods such as<br />
dual-energy x-ray absorptiometry, total body electrical<br />
conductivity (TOBEC), and magnetic resonance<br />
imaging (MRI).<br />
Summary<br />
This review of <strong>dietary</strong> standards revealed that the<br />
approach of extrapolation to obtain nutrient recommendations<br />
is used frequently and that a great amount<br />
of inconsistency exists in the factors considered in<br />
extrapolation. The use of original research data is the<br />
preferable way to estimate nutrient requirements <strong>for</strong><br />
different life-stage groups. However, because of the<br />
paucity of research data <strong>for</strong> some subgroups, it is often<br />
necessary to extrapolate in<strong>for</strong>mation from other groups<br />
in order to derive estimated requirements. Extrapolation<br />
should always be a second choice, and scientists<br />
are encouraged to develop new, innovative, noninvasive<br />
methods or use existing methods, e.g., stable isotopes,<br />
to specifically determine the nutrient requirements of<br />
understudied groups, such as pregnant and lactating<br />
women, infants, children, and the elderly.<br />
Until data are available <strong>for</strong> all life-stage groups,<br />
extrapolation from one group to another is necessary.<br />
Frequently, this involves extrapolation from adults to<br />
children and adolescents and from younger adults to<br />
older adults. The rationale or scientific basis <strong>for</strong> the<br />
method chosen should be completely transparent and<br />
thoroughly described <strong>for</strong> each nutrient and life-stage<br />
group. It is likely that different approaches will be used<br />
<strong>for</strong> different nutrients and different extrapolations <strong>for</strong><br />
a single nutrient. There is no one “correct” method of<br />
extrapolation and scientific judgment will probably be<br />
part of the process. Examples of approaches to extrapolation<br />
models include adjustments <strong>for</strong> body size (weight<br />
or metabolic weight), energy intakes <strong>for</strong> age, or application<br />
of factorial estimates of requirements <strong>for</strong> growth,<br />
pregnancy, and lactation. However, extreme caution is<br />
advised if the extrapolation is <strong>based</strong> on energy intakes,<br />
median body weights, or activity levels, which may vary<br />
widely among populations.<br />
Note<br />
S. A. Atkinson and B. Koletzko<br />
The following reports were reviewed but, because<br />
they do not constitute nutrient-<strong>based</strong> <strong>dietary</strong> recommendations,<br />
were not included in this review: Swedish<br />
National aims and strategies <strong>for</strong> nutrition 1999–2004<br />
[44]; National Institute of Nutrition, Hyderabad, India,<br />
Annual Report 1998–99 [45]; Socialist Republic of Vietnam,<br />
National Plan of Action <strong>for</strong> nutrition 1995–2000<br />
[46]; Warsaw, Poland: Programme of health improvement<br />
of the Polish population through improvement<br />
of health quality of <strong>food</strong> and modification of pattern<br />
of nutrition (1996) [47]; and South African <strong>food</strong>-<strong>based</strong><br />
<strong>dietary</strong> <strong>guidelines</strong> (2001) [48].
Life-stage groups and nutrient intake values<br />
Acknowledgments<br />
The dedicated help of Sonia Schiess in compiling data<br />
included in table 5 is gratefully acknowledged.<br />
References<br />
1. Koletzko B, Aggett PJ, Bindels JG, Bung P, Ferre P, Gil<br />
A, Lentze MJ, Roberfroid M, Strobel S. Growth, development<br />
and differentiation: a functional <strong>food</strong> science<br />
approach. Br J Nutr 1998;80(suppl 1):S5–45.<br />
2. Aggett P, Bresson J, Haschke F, Hernell O, Koletzko B,<br />
Lafeber HN, Michaelsen KF, Micheli J, Ormisson A, Rey<br />
J, Salazar de Sousa J, Weaver L. Recommended <strong>dietary</strong><br />
allowances (RDAs), recommended <strong>dietary</strong> intakes<br />
(RDIs), recommended nutrient intakes (RNIs), and population<br />
reference intakes (PRIs) are not “recommended<br />
intakes.“ J Pediatr Gastroenterol Nutr 1997;25:236–41.<br />
3. Koletzko B, de la Guéronnière V, Toschke AM, von Kries<br />
R. Nutrition in children and adolescents in Europe:<br />
What is the scientific basis? Introduction. Br J Nutr<br />
2004;92(suppl 2):S67–73.<br />
4. Prentice A, Branca F, Decsi T, Michaelsen KF, Fletcher<br />
RJ, Guesry P, Manz F, Vidailhet M, Pannemans D,<br />
Samartin S. Energy and nutrient <strong>dietary</strong> reference values<br />
<strong>for</strong> children in Europe: methodological approaches<br />
and current nutritional recommendations. Br J Nutr<br />
2004;92(suppl 2):S83–146.<br />
5. Institute of Medicine. Dietary reference intakes <strong>for</strong> calcium,<br />
phosphorus, magnesium, vitamin D, and fluoride.<br />
Washington, DC: National Academy Press, 1997.<br />
6. Institute of Medicine. Dietary reference intakes <strong>for</strong><br />
energy, carbohydrate, fiber, fat, fatty acids, cholesterol,<br />
protein, and amino acids. Washington, DC: National<br />
Academies Press, 2003.<br />
7. Kuczmarski RJ, Ogden CL, Grummer-Strawn LM,<br />
Flegal KM, Guo SS, Wei R, Mei Z, Curtin LR, Roche AF,<br />
Johnson CL. 2000 CDC growth charts: <strong>United</strong> States,<br />
Advance Data No. 314. National Center <strong>for</strong> Health Statistics.<br />
Available at: http://www.cdc.gov/growthcharts.<br />
Accessed 28 October 2006.<br />
8. German Nutrition Society, Austrian Nutrition Society,<br />
Swiss Society <strong>for</strong> Nutrition Research, Swiss Nutrition<br />
Association. Reference values <strong>for</strong> nutrient intake. Frankfurt/Main,<br />
Germany: Umschau Braus, 2003.<br />
9. Energy and protein requirements. Report of a joint<br />
FAO/WHO/UNU Expert Consultation. World Health<br />
Organ Tech Rep Ser 1985;724:1–206.<br />
10. The Scientific Committee <strong>for</strong> Food. Nutrient and<br />
energy intakes <strong>for</strong> the European Community (Opinion<br />
expressed on 11 December 1992). Luxembourg, Office<br />
<strong>for</strong> Official Publications of the European Communities.<br />
Reports of the Scientific Committee <strong>for</strong> Food (Thirtyfirst<br />
series) 1993, pp 1–248. Available at: http://europa.<br />
eu.int/comm/<strong>food</strong>/fs/sc/scf/out89.pdf. Accessed 26<br />
November 2006.<br />
11. National Research Council. Nutrition during pregnancy.<br />
Washington, DC: National Academy Press, 1990.<br />
12. National Nutrition Council. Committee report. Finnish<br />
nutrition recommendations. Helsinki, Finland, 1999.<br />
13. Nordic Nutrition Recommendations 2004, 4th ed.<br />
S75<br />
Copenhagen, Denmark: Nordic Council of Ministers,<br />
2005.<br />
14. Apports nutritionnels conseillés pour la population<br />
française. AFSSA, CNERNA, CNRS, coord. Ambroise<br />
Martin. Paris: Editions Tec & Doc, 2001, 650 p. (3ème<br />
édition). Available at: http://www.inra.fr/sia2002/biblio.<br />
html. Accessed 26 November 2006.<br />
15. Bourges H, Casanueva E, Rosado JL, eds. Recomendaciones<br />
de ingestion de nutrimentos para la población<br />
mexicana. Instituto Nacional de Nutrición. México,<br />
División de Nutrición. Publicación L-17 de la División<br />
de Nutrición. Bases fisiological. 1. Vitaminas y nutritmentos<br />
inorganico. México: Editorial Medial Panamericana,<br />
2005.<br />
16. Committee of the Expert Group on Caribbean Food and<br />
Nutrition Surveillance System. Recommended <strong>dietary</strong><br />
allowances <strong>for</strong> the Caribbean. Kingston, Jamaica: Caribbean<br />
Food and Nutrition Institute, 1994.<br />
17. Department of Health. Report on Health and Social<br />
Subjects. 41. Dietary Reference Values <strong>for</strong> Food, Energy<br />
and Nutrients <strong>for</strong> the <strong>United</strong> Kingdom. Report of the<br />
Panel on Dietary Reference Values of the Committee on<br />
Medical Aspects of Food Policy. London: Her Majesty’s<br />
Stationery Office, 1991. Available at: www.opsi.gov.<br />
uk/si/em2006/uksiem_20062381_en.pdf. Accessed 26<br />
November 2006.<br />
18. World Health Organization Multicentre Growth Reference<br />
Study Group. WHO child growth standards<br />
<strong>based</strong> on length/height, weight and age. Acta Paediatr<br />
2006;95(suppl 450):76–85.<br />
19. European Commission, Health and Consumer Protection<br />
Directorate-General. Scientific Committee on<br />
Food. Minutes of the 137th Plenary Meeting of the<br />
Scientific Committee on Food held on 2/3/4 April 2003<br />
in Brussels. SCF/CS/PLEN/MINS 137, 14 May 2003.<br />
Available at: http://www.europa.eu.int/comm/<strong>food</strong>/fs/<br />
sc/scf/out198_en.pdf. Accessed 28 October 2006.<br />
20. Kleiber M. Body size and metabolic rate. Physiol Rev<br />
1947;27:511–41.<br />
21. West GB, Brown JH, Enquist BJ. A general model <strong>for</strong><br />
the origin of allometric scaling laws in biology. Science<br />
1997;276:122–6.<br />
22. Przyrembel H. Uncertainty and adjustment. FAO/WHO<br />
Nutrient Risk Assessment Workshop. Geneva: World<br />
Health Organization, 2–5 May 2005.<br />
23. Rubner M. Über den Einfluss der Körpergrösse auf<br />
Stoff- und Kraftwechsel. Z Biol 1883;19:536–62.<br />
24. Kleiber M. Body size and metabolism. Hilgardia<br />
1932;6:315–53.<br />
25. West GB, Woodruff WH, Brown JH. Allometric scaling<br />
of metabolic rate from molecules and mitochondria<br />
to cells and mammals. Proc Natl Acad Sci USA<br />
2002;99(suppl 1):2473–8.<br />
26. White CR, Seymour RS. Mammalian basal metabolic
S76<br />
rate is proportional to body mass 2/3 . Proc Natl Acad Sci<br />
USA 2003;100:4046–9.<br />
27. Rucker R, Storms D. Interspecies comparisons of micronutrient<br />
requirements: metabolic vs. absolute body size.<br />
J Nutr 2002;132:2999–3000.<br />
28. Institute of Medicine. Dietary reference intakes <strong>for</strong><br />
thiamin, riboflavin, niacin, vitamin B 6 , folate, vitamin<br />
B 12 , pantothenic acid, biotin, and choline. Washington,<br />
DC: National Academy Press, 1998.<br />
29. Institute of Medicine. Dietary reference intakes <strong>for</strong><br />
vitamin C, vitamin E, selenium, and carotenoids. Washington,<br />
DC: National Academy Press, 2000.<br />
30. Institute of Medicine. Dietary reference intakes <strong>for</strong> vitamin<br />
A, vitamin K, arsenic, boron, chromium, copper,<br />
iodine, iron, manganese, molybdenum, nickel, silicon,<br />
vanadium, and zinc. Washington, DC: National Academy<br />
Press, 2001.<br />
31. Institute of Medicine. Dietary reference intakes <strong>for</strong> water,<br />
potassium, sodium, chloride, and sulfate. Washington,<br />
DC: National Academies Press, 2004.<br />
32. Butte NF, Hopkinson JM, Wong WW, Smith EO, Ellis<br />
KJ. Body composition during the first 2 years of life: an<br />
updated reference. Pediatr Res 2000;47:578–85.<br />
33. Ellis KJ, Shypailo RJ, Abrams SA, Wong WW. The reference<br />
child and adolescent models of body composition.<br />
A contemporary comparison. Ann NY Acad Sci<br />
2000;904:374–82.<br />
34. Butte NF, Wong WW, Hopkinson JM, Heinz CJ, Mehta<br />
NR, Smith EO. Energy requirements derived from total<br />
energy expenditure and energy deposition during the<br />
first 2 y of life. Am J Clin Nutr 2000;72:1558–69.<br />
35. Guo SM, Roche AF, Fomon SJ, Nelson SE, Chumlea WC,<br />
Rogers RR, Baumgartner RN, Ziegler EE, Siervogel RM.<br />
Reference data on gains in weight and length during the<br />
first two years of life. J Pediatr 1991;119:355–62.<br />
36. Baumgartner RN, Roche AF, Himes JH. Incremental<br />
growth tables: supplementary to previously published<br />
charts. Am J Clin Nutr 1986;43:711–22.<br />
37. Fomon SJ, Haschke F, Ziegler EE, Nelson SE. Body<br />
composition of reference children from birth to age 10<br />
years. Am J Clin Nutr 1982;35(5 suppl):1169–75.<br />
S. A. Atkinson and B. Koletzko<br />
38. World Health Organization. Complementary feeding<br />
of young children in developing countries: review of<br />
current scientific knowledge. Geneva: WHO, 1998.<br />
39. Jensen RJ, ed. Handbook of milk composition. San<br />
Diego, Calif, USA: Academic Press, 1995.<br />
40. Health Council of the Netherlands. Dietary reference<br />
intakes: energy, proteins, fats and digestible carbohydrates.<br />
The Hague: Health Council of the Netherlands, 2001.<br />
Publication no. 2001/19. Available at: http://www.gr.nl/<br />
referentie.php?ID=337. Accessed 26 November 2006.<br />
41. Nutrient reference values <strong>for</strong> Australia and New Zealand<br />
including recommended <strong>dietary</strong> intakes. Australian<br />
Government, Department of Health and Ageing,<br />
National Health and Medical Research Council, 2006.<br />
Available at: http://www.nhmrc.gov.au/publications/_<br />
files/n35.pdf. Accessed 28 October 2006.<br />
42. Widdowson EM, Southgate DA, Hey E. Fetal growth<br />
and body composition. In: Linblad BS, ed. Perinatal<br />
nutrition. New York: Academic Press, 1988:3–14.<br />
43. Pencharz P, Ball RO. How to assess amino acid requirements.<br />
In: Bachmann C, Koletzko B, eds. Genetic<br />
expression and nutrition. Philadelphia, Pa, USA: Lippincott<br />
Williams & Wilkins, 2003:37–50.<br />
44. Swedish National Institute of Public Health and the<br />
Swedish National Food Administration. Swedish<br />
national aims and strategies <strong>for</strong> nutrition 1999–2004.<br />
Stokholm: Folkhalsoinstitutet/Livsmedelsverket, 2004.<br />
45. National Institute of Nutrition. Annual Report 1998–<br />
1999. Hyderabad, India: National Institute of Nutrition,<br />
1999.<br />
46. Socialist Republic of Vietnam. National Plan of Action<br />
<strong>for</strong> Nutrition 1995–2000. Government No. 576/TTg.<br />
Hanoi: Medical Publishing House, 1995.<br />
47. Szponar L, Radiukiewicz S, Sekula W. Programme of<br />
health improvement of the Polish population through<br />
improvement of health quality of <strong>food</strong> and modification<br />
of pattern of nutrition. Warsaw: National Food and<br />
Nutrition Institute, 1996.<br />
48. Vorster HH. South African <strong>food</strong>-<strong>based</strong> <strong>dietary</strong> <strong>guidelines</strong>.<br />
S Afr J Clin Nutr 2001;14:S1–70.
The role of diet- and host-related factors in nutrient<br />
bioavailability and thus in nutrient-<strong>based</strong> <strong>dietary</strong><br />
requirement estimates<br />
Rosalind S. Gibson<br />
Abstract<br />
To convert physiological requirements into <strong>dietary</strong><br />
requirements, adjustments are needed <strong>for</strong> some nutrients<br />
that take into account certain diet- and host-related<br />
factors specific to a country or region. Nutrients whose<br />
requirements should be adjusted in this way include<br />
calcium, magnesium, iron, zinc, protein, folate, vitamin<br />
A, and carotenoids. The diet-related factors that must be<br />
considered depend on the nature of the habitual diet and<br />
may include the chemical <strong>for</strong>m of the nutrient and the<br />
nature of the <strong>dietary</strong> matrix, interactions between nutrients<br />
and/or organic components, and <strong>food</strong> preparation<br />
and processing practices within the country or region.<br />
The host-related factors can be further subdivided into<br />
intestinal and systemic factors. Reductions in the secretion<br />
of hydrochloric acid, gastric acid, and/or intrinsic<br />
factor, together with alterations in the permeability of<br />
the intestinal mucosa, are all examples of intestinal<br />
factors that can markedly influence the absorption of<br />
certain nutrients, but that are often ignored when setting<br />
<strong>dietary</strong> requirements. Systemic factors that should also<br />
be considered include nutrient status of the host, age,<br />
sex, ethnicity, genotype, and physiological state (e.g.,<br />
pregnancy or lactation), and chronic and acute infectious<br />
disease states. Algorithms can estimate the bioavailability<br />
of iron, zinc, protein, folate, vitamin A, and carotenoids,<br />
although their accuracy is limited by the complex interactions<br />
among the absorption modifiers in the whole<br />
diet. For calcium and magnesium, the amount available<br />
<strong>for</strong> absorption is still estimated from their major <strong>food</strong><br />
sources in the habitual diet. Currently, there are often<br />
large differences in the adjustments employed to convert<br />
physiological requirements to <strong>dietary</strong> requirements, even<br />
among countries consuming diets of similar patterns.<br />
Rosalind S. Gibson is affiliated with the Department of<br />
Human Nutrition, University of Otago, New Zealand.<br />
Please direct queries to the corresponding author: Rosalind<br />
S. Gibson, Department of Human Nutrition, University of<br />
Otago, PO Box 56, Dunedin, New Zealand; e-mail: Rosalind.<br />
Gibson@stonebow.otago.ac.nz.<br />
Key words: Dietary requirements, bioavailability,<br />
bioefficacy, diet-related factors, intestinal factors, systemic<br />
factors, algorithms<br />
Introduction<br />
Variations exist among countries in estimates of nutrient<br />
requirements, even <strong>for</strong> a specified class of individuals.<br />
There are several reasons <strong>for</strong> the differences<br />
observed. This paper focuses on the factors that must<br />
be taken into account when the physiological requirements<br />
of a nutrient <strong>for</strong> an individual are translated into<br />
<strong>dietary</strong> requirement estimates. It is at this stage that<br />
adjustments are made to the <strong>dietary</strong> requirement to<br />
take into account particular types of diets consumed<br />
by individuals and certain host-related factors. The<br />
magnitude of these adjustments and their relative<br />
importance varies with the nutrient, life-stage group,<br />
and setting (e.g., environment). In this paper the following<br />
operational definitions will be used:<br />
Physiological requirement is the requirement of<br />
absorbable and utilizable nutrient. In environments<br />
where the nature of the diet ingested and/or the intestinal<br />
or systemic conditions of the host affect either the<br />
absorption or the utilization of an ingested nutrient,<br />
the <strong>dietary</strong> requirements will be higher than the physiological<br />
requirements.<br />
Dietary requirement is the requirement of the nutrient<br />
as ingested in a specified type of <strong>dietary</strong> pattern<br />
and under specified conditions of the host. Hence, this<br />
requirement takes into account both <strong>dietary</strong> and hostrelated<br />
factors that affect the absorption or utilization<br />
of the nutrient or both. The host-related factors include<br />
systemic factors (e.g., nutrient status, age, and physiological<br />
status) and the possible coexistence of intestinal<br />
factors (e.g., atrophic gastritis) known to influence<br />
the efficiency of intestinal digestion and absorption.<br />
Because these factors vary markedly according to the<br />
nature of the habitual <strong>dietary</strong> pattern and the conditions<br />
of the host, it follows that the <strong>dietary</strong> requirement<br />
may differ among countries, even if there is approxi-<br />
Food and Nutrition Bulletin, vol. 28, no. 1 (supplement) © 2007, The <strong>United</strong> <strong>Nations</strong> University. S77
S78<br />
mate agreement on the physiological requirements.<br />
Bioavailability is the proportion of the ingested<br />
nutrient that is absorbed and utilized through normal<br />
metabolic pathways [1]. It is influenced by diet- and<br />
host-related factors.<br />
Bioefficacy is the efficiency with which ingested<br />
nutrients are absorbed and converted to the active <strong>for</strong>m<br />
of the nutrient [2].<br />
The objective of this paper is to examine the diet- and<br />
host-related factors that may influence the bioavailability<br />
of certain nutrients and hence the adjustments<br />
required to translate physiological requirements of<br />
these nutrients to <strong>dietary</strong> requirement estimates. For<br />
this review, the diet-related factors have been classified<br />
into the chemical <strong>for</strong>m of the nutrient and the nature<br />
of the <strong>dietary</strong> matrix; interactions occurring among<br />
nutrients themselves or with other components of the<br />
diet; and pretreatment of <strong>food</strong> as a result of processing<br />
and/or preparation practices. The host-related factors<br />
considered in this paper include intestinal factors<br />
that influence the efficiency of luminal and mucosal<br />
digestion and absorption, and systemic factors such<br />
as nutrient status of the host, age, physiological status,<br />
and illness due to chronic or acute infections. The final<br />
step in setting <strong>dietary</strong> requirement estimates takes into<br />
account the variations in requirements among individuals,<br />
according to life stage and sex.<br />
Most of the literature cited in this review encompasses<br />
results of in vivo human isotope studies, where<br />
possible and relevant, although some results <strong>based</strong> on<br />
in vitro methods and epidemiologic studies have also<br />
been included.<br />
Dietary factors affecting the bioavailability<br />
of nutrients<br />
Several factors in the diet can influence the bioavailability<br />
of nutrients. The magnitude depends on inhibitors<br />
and promoters in any one meal, and hence the<br />
composite diet. Increasingly, the influence on bioavailability<br />
of <strong>for</strong>tificants or supplements as well as intrinsic<br />
components of the diet must be considered.<br />
There are some concerns about the predictive value<br />
of certain methods (e.g., in vitro assays) used to investigate<br />
the <strong>dietary</strong> factors affecting the bioavailability of<br />
inorganic nutrients in <strong>food</strong>s, and inconsistent results<br />
have been reported. Moreover, most of the in vivo<br />
isotope studies have been <strong>based</strong> on single meals. However,<br />
there is some evidence that the effects of <strong>dietary</strong><br />
modifiers on the absorption of iron, and possibly other<br />
trace elements, from single-meal studies differ from<br />
those <strong>based</strong> on a total diet of similar composition as<br />
the single test meal [3, 4]. There<strong>for</strong>e, caution must be<br />
used when interpreting the results in the literature on<br />
diet-related factors affecting nutrient bioavailability.<br />
In general, diet-related factors have less influence on<br />
the bioavailability of macronutrients than micronutrients.<br />
Of the latter, the bioavailability of iron and zinc<br />
is especially affected. For some micronutrients (e.g.,<br />
iodine, vitamin C, thiamin), the effect of <strong>dietary</strong> factors<br />
on bioavailability appears to be very limited, and<br />
<strong>for</strong> micronutrients such as riboflavin [5], vitamin B 12<br />
[6], magnesium [7], and chromium [8] bioavailability<br />
data in humans are sparse. In some cases (e.g., vitamin<br />
B 6 ), existing bioavailability data are difficult to interpret<br />
because of methodological difficulties [9]. The three<br />
groups of <strong>dietary</strong> factors known to influence nutrient<br />
bioavailability are discussed in turn below.<br />
Chemical <strong>for</strong>m of the nutrient and nature of the<br />
<strong>dietary</strong> matrix<br />
The absorption and/or utilization of several micronutrients<br />
are affected by the chemical <strong>for</strong>m of the nutrient<br />
(i.e., speciation); some examples are given in table 1. Of<br />
these, the bioavailability of intrinsic iron in indigenous<br />
diets as well as the <strong>for</strong>m in supplements and <strong>for</strong>tificants<br />
TABLE 1. Examples of nutrients <strong>for</strong> which bioavailability is<br />
affected by chemical <strong>for</strong>m<br />
Nutrient Forms<br />
Iron Heme iron (bound in a porphyrin ring)<br />
in hemoglobin and myoglobin from<br />
meat, poultry, and fish is more readily<br />
absorbed than nonheme iron found in<br />
<strong>food</strong>s of plant and animal origin. Bioavailability<br />
of iron from <strong>for</strong>tificants or<br />
supplements depends on their chemical<br />
<strong>for</strong>m<br />
Selenium Main <strong>food</strong> sources of selenium are<br />
the organic <strong>for</strong>ms, selenocysteine and<br />
selenomethionine. These tend to be<br />
better absorbed than the inorganic <strong>for</strong>m<br />
of selenium, selenite<br />
Zinc Organic zinc complexes (e.g., from<br />
oysters) are more readily absorbed than<br />
inorganic zinc salts<br />
Folate Polyglutamates (mainly 5-methyl tetrahydrofolate<br />
[5MeTHF] in fresh <strong>food</strong>)<br />
are less well absorbed than synthetic<br />
monoglutamate <strong>for</strong>m (i.e., folic acid<br />
used as <strong>for</strong>tificant and supplements)<br />
Vitamin B 6<br />
R. S. Gibson<br />
Free pyridoxine, pyridoxamine (plus<br />
phosphorylated <strong>for</strong>ms) in plants and<br />
pyridoxal (plus phosphorylated <strong>for</strong>ms in<br />
animal <strong>food</strong>s) are better absorbed than<br />
pyridoxine β-D-glucoside in heat-processed<br />
milk products<br />
Niacin Niacin in mature maize is present as<br />
niacytin (nicotinic acid esterified to<br />
polysaccharides), which is unavailable<br />
<strong>for</strong> absorption
Diet- and host-related factors in nutrient bioavailability<br />
has been most extensively studied. Two <strong>for</strong>ms of iron<br />
exist in <strong>food</strong>s: heme iron and nonheme iron. They are<br />
absorbed by separate pathways, but once inside the<br />
mucosal cells of the small intestine all iron enters a<br />
common pool. Heme iron, bound in a porphyrin ring,<br />
is derived mainly from hemoglobin and myoglobin in<br />
meat, poultry, and fish, whereas nonheme iron is found<br />
primarily as iron salts in a wide variety of <strong>food</strong>s of both<br />
plant and animal origin, and possibly as contaminant<br />
iron introduced during processing, preparation, and<br />
storage and by contamination from the soil [10]. Heme<br />
iron is absorbed as the intact moiety and nonheme<br />
iron from the common pool within the gastrointestinal<br />
tract [11]. Of the two <strong>for</strong>ms, heme iron is much more<br />
readily absorbed than nonheme iron. Absorption of<br />
heme iron depends on the iron status of the individual,<br />
whereas absorption of nonheme iron depends not only<br />
on the individual’s iron status, but also on the content<br />
of absorption modifiers consumed during the same<br />
meal. In general, <strong>for</strong> any given individual, the higher<br />
the nonheme iron content of the diet, the lower the<br />
absorption efficiency [12].<br />
Hurrell [13] reviewed the bioavailability of the <strong>for</strong>ms<br />
of iron used as <strong>for</strong>tificants. Their bioavailability is usually<br />
expressed as relative bioavailability value (RBV),<br />
i.e., bioavailability relative to that of ferrous sulfate,<br />
the latter being assigned a standard RBV of 100%.<br />
Absorption is highest <strong>for</strong> those iron compounds that<br />
are soluble in water or dilute acids (e.g., ferrous sulfate,<br />
ferrous fumurate, ferric saccharate). However, such<br />
compounds often cause oxidative reactions when added<br />
as <strong>for</strong>tificants to <strong>food</strong> unless they are manufactured in<br />
encapsulated <strong>for</strong>ms. Consequently, compounds that are<br />
less likely to interact with <strong>food</strong> components (e.g., ferric<br />
pyrophosphate, ferric orthophosphate, and elemental<br />
iron) are often used, despite their lower RBV. Note<br />
that the composition of the native diet can be a more<br />
important determinant of iron absorption than the type<br />
of <strong>for</strong>tificant itself, especially in plant-<strong>based</strong> diets.<br />
Absorption of zinc and selenium is also influenced<br />
by chemical <strong>for</strong>m. In both cases, the organic <strong>for</strong>ms<br />
tend to be more readily absorbed than the inorganic<br />
<strong>for</strong>ms. For zinc, the organic <strong>for</strong>m (in oysters) appears<br />
to be less affected by absorption modifiers than the<br />
inorganic <strong>for</strong>ms [14]. Selenomethionine, the organic<br />
<strong>for</strong>m of selenium found in most plant tissues (and<br />
selenized yeast) is absorbed more efficiently than the<br />
inorganic <strong>for</strong>m (e.g., selenite) used in supplements [15],<br />
although absorption rates <strong>for</strong> all <strong>for</strong>ms of selenium are<br />
high (70% to 95%).<br />
Chemical <strong>for</strong>m also affects the bioavailability of<br />
some vitamins. For example, the bioavailability of<br />
carotenoids varies depending on their isomeric <strong>for</strong>m<br />
[16]. In contrast, there is some evidence that the bioavailability<br />
of polyglutamyl and monoglutamyl <strong>for</strong>ms<br />
of native folate in <strong>food</strong>s is probably similar [17]. Nevertheless,<br />
some inconsistencies have been reported<br />
S79<br />
among studies that have been associated with differences<br />
in the study design and protocols used, variation<br />
among individuals in folate digestion, absorption, and<br />
metabolism, and analytic difficulties [18]. In contrast,<br />
the native polyglutamyl <strong>for</strong>ms of <strong>food</strong> folate have a<br />
much lower bioavailability than does the synthetic<br />
<strong>for</strong>m, folic acid, a monoglutamate used as a supplement<br />
or <strong>for</strong>tificant [6, 19, 20]. To take into account some<br />
of these differences, the Institute of Medicine [6] has<br />
introduced a new term: <strong>dietary</strong> folate equivalent (DFE).<br />
Certain <strong>for</strong>ms of vitamin B 6 found in heat-processed<br />
milk products (e.g., pyridoxine β-D-glucoside) are also<br />
less available than those normally found in <strong>food</strong>s [9].<br />
Likewise, niacin in cereals such as maize is present as<br />
niacytin, an unavailable <strong>for</strong>m of which only a small<br />
amount is hydrolyzed by gastric acid in the gastrointestinal<br />
tract. Coffee beans also contain an unavailable<br />
<strong>for</strong>m of nicotinic acid (trigonellin, 1-methyl nicotinic<br />
acid) that becomes available after roasting [21]. In<br />
contrast, <strong>for</strong> thiamin, chemical <strong>for</strong>m has little effect on<br />
its bioavailability [22].<br />
The <strong>food</strong> matrix probably has the greatest effect on<br />
the absorption of provitamin A carotenoids [23] and<br />
folates [17, 24]. Both of these micronutrients may be<br />
entrapped in the insoluble matrix or cellular structure<br />
of certain plant <strong>food</strong>s, reducing their bioavailability.<br />
For example, β-carotene is bound to proteins in the<br />
chloroplasts in dark-green leafy vegetables, whereas<br />
in orange and yellow fruits (mango, papaya, etc.) and<br />
pumpkin and sweet potato, carotenoids are dissolved<br />
in oil droplets in chromoplasts and are more readily<br />
extracted during digestion, so that their bioefficacy<br />
is fourfold higher than that from dark-green leafy<br />
vegetables [23]. In spinach, bioavailability of folate is<br />
higher after the leaves have been chopped, minced, or<br />
enzymatically liquefied than <strong>for</strong> the same amount of<br />
whole spinach leaves [25]. Vitamin B 12 is also bound<br />
to enzymes or other carrier proteins in <strong>food</strong> and must<br />
be released prior to absorption.<br />
Interactions among nutrients themselves and with<br />
other components in the whole diet<br />
The mechanisms whereby components in the diet<br />
influence the bioavailability of nutrients may involve<br />
noncompetitive interactions between nutrients and<br />
organic components in diets whereby insoluble or<br />
soluble complexes are <strong>for</strong>med in the acid pH of the<br />
stomach and proximal duodenum, and direct competitive<br />
interactions between two (or more) inorganic<br />
nutrients with chemical similarities that share the same<br />
absorptive pathways.<br />
Note that the bioavailability of nutrients from supplements<br />
or <strong>for</strong>tificants when taken together with a<br />
meal is affected by the same factors as those present<br />
in a <strong>food</strong> [26]. Their net effect depends on the balance<br />
between those factors inhibiting and those factors
S80<br />
enhancing nutrient absorption and/or utilization in<br />
the diet. In addition, some of the isotope studies are<br />
<strong>based</strong> on single meals, which tend to exaggerate the<br />
results of nutrient interactions involving iron absorption<br />
compared with studies <strong>based</strong> on whole diets [3, 4].<br />
Hence, caution must be used when interpreting some<br />
of the bioavailability results reported in the literature<br />
<strong>based</strong> on single-meal studies.<br />
Noncompetitive interactions<br />
Several organic <strong>dietary</strong> components have the capacity<br />
to <strong>for</strong>m insoluble or soluble complexes with certain<br />
nutrients in the gut, thus inhibiting or facilitating<br />
absorption. In some cases, reabsorption of certain inorganic<br />
nutrients that are excreted endogenously in the<br />
gastrointestinal tract (e.g., calcium, zinc, copper) may<br />
also be affected [27, 28]. Table 2 lists these naturally<br />
occurring organic substances, their major <strong>food</strong> sources,<br />
and summarizes their nutritional consequences. Some<br />
occur in large amounts in many of the plant-<strong>based</strong><br />
diets in developing countries; they are discussed<br />
briefly below. Note that the effects of these organic<br />
components on bioavailability can often be modulated<br />
by pretreatment of the <strong>food</strong> with commercial and/or<br />
traditional <strong>food</strong> processing and preparation methods.<br />
Phytate refers to phytic acid (myo-inositol hexaphosphate)<br />
as well as the salts: magnesium, calcium, or<br />
potassium phytate. Phytate is the major storage <strong>for</strong>m of<br />
phosphorus in cereals, legumes, and oleaginous seeds,<br />
so that diets <strong>based</strong> on unrefined, unfermented cereals<br />
are especially high in phytate, whereas those <strong>based</strong> on<br />
starchy roots and tubers are low [29]. Phytate chelates<br />
metal ions, especially zinc, iron, and calcium, but not<br />
copper [30], in the gastrointestinal tract, making them<br />
unavailable <strong>for</strong> absorption. It also complexes endogenously<br />
secreted minerals such as zinc [26, 28] and<br />
calcium [31], making them unavailable <strong>for</strong> reabsorption<br />
into the body.<br />
Myo-inositol hexaphosphate can be hydrolyzed by<br />
certain <strong>food</strong> processing and preparation methods to<br />
lower myo-inositol phosphates, which do not <strong>for</strong>m<br />
insoluble complexes with iron and zinc. For example,<br />
myo-inositol phosphates with fewer than five phosphate<br />
groups (i.e., IP-1 to IP-4) do not have a negative effect<br />
on zinc absorption [32], whereas those with fewer than<br />
three phosphate groups do not inhibit nonheme iron<br />
absorption [33]. There appears to be no adaptation<br />
to the inhibitory effect of a high-phytate diet on iron<br />
absorption in long-term vegetarians [34]; whether the<br />
same is true <strong>for</strong> zinc is uncertain.<br />
High amounts of calcium may exacerbate the inhibitory<br />
effect of phytate on zinc absorption by <strong>for</strong>ming a<br />
calcium-zinc-phytate complex in the intestine that is<br />
even less soluble than phytate complexes <strong>for</strong>med by<br />
either ion alone [35]. In general, because the calcium<br />
content of most plant-<strong>based</strong> diets is low, such an<br />
effect is probably rare. Indeed, calcium did not add<br />
R. S. Gibson<br />
significant predictive power in a model developed by<br />
the International Zinc Nutrition Consultative Group<br />
(IZiNCG) [36] to predict zinc absorption. Nevertheless,<br />
some diets may be exceptions, notably diets in<br />
Latin America <strong>based</strong> on lime-soaked maize, diets of<br />
some lacto-ovo vegetarians, diets in regions where betel<br />
nut is chewed with lime [31], and cases of geophagia<br />
involving calcareous soils [37].<br />
Soybean protein inhibits absorption of zinc as a result<br />
of its phytate content, although the magnitude of its<br />
effect may depend on the processing method. The<br />
effect of soybean protein on iron absorption depends<br />
on the processing method and <strong>food</strong> source. Some fractions<br />
of soybean protein inhibit iron absorption even<br />
when completely dephytinized (e.g., conglycinin) [38],<br />
whereas ferritin present in nodulating soybeans may<br />
be a bioavailable source of iron <strong>for</strong> persons with low<br />
iron stores [39].<br />
Polyphenols are almost ubiquitous in plant <strong>food</strong>s.<br />
Some examples of <strong>food</strong>s and beverages that contain<br />
high levels are shown in table 2. Genetic and environmental<br />
factors, as well as germination, processing<br />
and storage, and degree of ripeness, influence the<br />
polyphenol content of plant <strong>food</strong>s; polyphenols are not<br />
denatured by heat [40].<br />
Polyphenols, like phytate, <strong>for</strong>m insoluble complexes<br />
with metal cations that inhibit intestinal absorption<br />
of nonheme iron [41], perhaps copper [42] and zinc<br />
[43], but not calcium [44] or manganese [45]. The<br />
active compounds are the galloyl group found in tannin<br />
and gallic acid [41]. The effect of polyphenols is independent<br />
of that of phytate [46]. Foods and beverages<br />
containing these compounds are shown in table 2.<br />
Several in vivo intervention studies <strong>based</strong> on radioiron<br />
isotopes have confirmed the inhibitory effect of tea on<br />
iron absorption [47]. The effect can be partly counteracted<br />
by simultaneous consumption of ascorbic acid<br />
[48]. Some epidemiologic studies of adults have shown<br />
that a high consumption of tea [49] or coffee [50] is<br />
associated with low iron stores. The inhibitory effect<br />
of polyphenol-containing beverages can be significant<br />
even during infancy in countries where tea (e.g., Egypt<br />
and Israel) or coffee (e.g., Guatemala) is fed to infants<br />
[51, 52].<br />
Certain polyphenols, such as caffeic acid, chlorogenic<br />
acid, and tannins, also exhibit thiamin-inactivating<br />
properties by oxidizing the thiazole ring to the<br />
disulfide, which in turn reduces thiamin absorption<br />
[53]. Some polyphenols can also influence the digestibility<br />
of macronutrients by binding endogenous proteins<br />
such as salivary enzymes and digestive enzymes<br />
in the intestinal tract. Hence, they can reduce the<br />
digestibility of starch, protein, and lipids [54–56].<br />
Tannins can also interfere with protein digestibility by<br />
enhancing excretion of endogenous protein, and they<br />
increase fecal fat excretion [40, 57].<br />
Dietary fiber is composed of nonstarch polysaccha-
Diet- and host-related factors in nutrient bioavailability<br />
TABLE 2. Effects of noncompetitive interactions involving organic substances on nutrient bioavailability: inhibiting and<br />
enhancing factors<br />
Dietary component Food sources Main technical influences Nutritional consequences<br />
Phytate (myo-inositol<br />
hexaphosphate) plus magnesium,<br />
calcium, or potassium<br />
phytate a<br />
Unrefined cereals, legumes,<br />
nuts, oil seeds<br />
Soybean protein Soybeans and unfermented<br />
soy products (e.g., textured<br />
vegetable protein)<br />
Polyphenols Certain cereals (red sorghum),<br />
legumes (red<br />
kidney beans, black beans,<br />
black grams), spinach, betel<br />
leaves, oregano<br />
Beverages: tea, coffee, cocoa,<br />
red wine<br />
Dietary fiber Unrefined cereals, legumes,<br />
nuts, oilseeds, fruits, and<br />
vegetables<br />
Oxalic acid Amaranth, spinach, rhubarb,<br />
yam, taro, sweet potato,<br />
sorrel, sesame seeds, black<br />
tea<br />
Organic acids (citric, lactic,<br />
acetic, butyric, propionic,<br />
<strong>for</strong>mic acids)<br />
Fermented milk products<br />
(e.g., yogurt), vegetables<br />
(e.g., sauerkraut), soy sauce,<br />
cereals (e.g., tobwa)<br />
Ascorbic acid Citrus fruits and juices, other<br />
fruits (e.g., guava, mango,<br />
papaya, kiwi, strawberry),<br />
vegetables (e.g., tomato,<br />
asparagus, Brussels sprouts)<br />
Binds certain cations to <strong>for</strong>m<br />
insoluble complexes in gut<br />
Contain phytate<br />
In nodulating soybeans, ferritin<br />
is main source of iron<br />
Form insoluble complexes<br />
with iron<br />
Some polyphenols inactivate<br />
thiamin<br />
Bind certain salivary and<br />
digestive enzymes<br />
Enhance excretion of endogenous<br />
protein<br />
Lignin and pectin bind bile<br />
acids<br />
Pectins/psyllium/gums retain<br />
water and <strong>for</strong>m viscous<br />
solutions in the gut<br />
Dietary fiber is fermented in<br />
large intestine by microflora<br />
Oxalates <strong>for</strong>m insoluble complexes<br />
with calcium and<br />
possibly iron<br />
May <strong>for</strong>m soluble ligands<br />
with some trace minerals<br />
in the gut<br />
Reduces ferric iron to more<br />
soluble ferrous iron; <strong>for</strong>ms<br />
iron–ascorbate chelate<br />
Protein Amount and type (e.g.,<br />
animal protein) enhance<br />
bioavailability of zinc, iron,<br />
and copper, but not calcium<br />
Fat Fats and oils, animal adipose<br />
tissue, milk and milk products,<br />
vegetables, seeds, nuts<br />
Products of fat digestion (fatty<br />
acids, monoglycerides, cholesterol,<br />
and phospholipids)<br />
plus bile salts solubilize fatsoluble<br />
vitamins and carotenoids<br />
in intestinal milieu<br />
Zinc, iron, calcium, and<br />
probably magnesium are<br />
poorly absorbed<br />
S81<br />
Inhibits zinc absorption<br />
Nodulating soybeans may be<br />
a bioavailable iron source<br />
when iron stores are low<br />
Inhibit nonheme iron<br />
absorption<br />
Reduce thiamin absorption<br />
Reduce digestibility of starch,<br />
protein, and lipids<br />
Interfere with protein digestibility<br />
Reduces absorption of fats,<br />
fat-soluble vitamins, and<br />
carotenoids<br />
Slows gastric emptying and<br />
digestion and absorption of<br />
nutrients<br />
Short-chain fatty acids that<br />
are produced enhance calcium<br />
solubility<br />
Reduce absorption of calcium<br />
and possibly iron<br />
Increase urinary calcium<br />
May enhance absorption of<br />
zinc and iron<br />
Enhances nonheme iron<br />
absorption; may counteract<br />
inhibitory effect of phytate<br />
May enhance selenium and<br />
chromium absorption<br />
Enhance absorption, possibly<br />
by <strong>for</strong>mation of soluble<br />
ligands<br />
Increase urinary calcium<br />
excretion<br />
Enhance absorption of fatsoluble<br />
vitamins and provitamin<br />
A carotenoids<br />
a. Myo-inositol phosphates with fewer than five phosphate groups (i.e., IP-1 to IP-4) do not inhibit zinc absorption [32], and those with fewer<br />
than three phosphate groups do not inhibit nonheme iron absorption [33].
S82<br />
rides, which include cellulose, mixed-linkage β-glucans,<br />
hemicelluloses, pectins, and gums. These constituents<br />
are found especially in unrefined cereals, legumes, nuts,<br />
and fruits and vegetables. The effect of <strong>dietary</strong> fiber on<br />
nutrient bioavailability is linked to some of its physical<br />
properties in the gastrointestinal tract, such as cation<br />
exchange capacity, bile acid binding, water-holding<br />
capacity, viscosity, and its ability to act as a substrate<br />
<strong>for</strong> fermentative microorganisms [58].<br />
In general, <strong>dietary</strong> fiber alone does not have a major<br />
effect on the absorption of minerals (e.g., calcium or<br />
magnesium) [59] or trace elements [26, 60], assessed<br />
in vivo using isotope techniques, although α-cellulose<br />
may affect the utilization or endogenous losses of<br />
copper [61]. Note that these findings are in contrast<br />
to earlier in vivo results in which pure fiber fractions<br />
were not used [62].<br />
The effect of <strong>dietary</strong> fiber on the absorption of most<br />
water-soluble vitamins appears to be minimal [63]. Possible<br />
exceptions may be an interference with the bioavailability<br />
of naturally occurring vitamin B 6 in wheat,<br />
rice, and corn bran in humans, although in vitro studies<br />
with isolated <strong>for</strong>ms of fiber have not confirmed this [9].<br />
Absorption of fat-soluble vitamins (e.g., vitamin E)<br />
and carotenoids [23] may also be impaired by diets<br />
high in pectin and ligin through their capacity to bind<br />
bile acids in vivo [64] at an acidic pH and affect micelle<br />
<strong>for</strong>mation in the small intestine. A high-fiber diet may<br />
also lead to enhanced elimination of vitamin D [65],<br />
probably as a result of a reduction in transit time.<br />
Absorption of nutrients such as fatty acids is also<br />
affected by the water-holding capacity of <strong>dietary</strong> fibers<br />
such as pectins, psyllium, and various gums, which<br />
retain water within their matrix, <strong>for</strong>ming highly viscous<br />
solutions in the small intestine. These can in turn alter<br />
gastric emptying time and slow the rate of nutrient<br />
digestion and absorption, although the total amount<br />
absorbed will be unaffected [58].<br />
Fermentation of <strong>dietary</strong> fibers by the microflora in<br />
the large intestine may lead to an increase in shortchain<br />
fatty acids (SCFA) (acetate, propionate, and<br />
butyrate), depending on the type of fiber. These SCFAs<br />
are absorbed across the colonic mucosa and can serve<br />
as a source of energy (150 to 200 kcal/day) that would<br />
otherwise be lost in the stool. In addition, the acidic pH<br />
in the colon created by these SCFAs enhances the solubility<br />
of calcium and in turn calcium absorption [66].<br />
Oxalic acid is present in many plants, the level<br />
varying with the cultivar, growing conditions, and<br />
distribution within the plant [67]; examples of <strong>food</strong><br />
plants that contain high levels are shown in table 2.<br />
Some animal species (e.g., snails and certain other mollusks)<br />
also contain high levels of oxalate [68]. Oxalates<br />
<strong>for</strong>m insoluble complexes with calcium, thus reducing<br />
absorption [69, 70]. Their inhibitory effect can be<br />
reduced by soaking and boiling, both of which reduce<br />
the oxalate content of <strong>food</strong>s. Whether oxalic acid inhib-<br />
R. S. Gibson<br />
its the bioavailability of trace minerals such as iron and<br />
zinc is less clear. Some early human studies reported<br />
that the addition of 1 g of oxalic acid to a cabbage meal<br />
significantly reduced iron absorption [71], and <strong>food</strong>s<br />
rich in both fiber and oxalic acid, such as spinach, were<br />
reported to decrease zinc balance [72].<br />
Vitamin C has a strong enhancing effect on absorption<br />
of nonheme iron when it is consumed in the<br />
same meal. This effect is now attributed largely to the<br />
<strong>for</strong>mation of an iron–ascorbate chelate in the acid<br />
milieu of the stomach, which prevents it from <strong>for</strong>ming<br />
a complex with phytate or tannin; Teucher et al. have<br />
presented a detailed review [73]. The magnitude of the<br />
enhancing effect depends on the level of ascorbic acid<br />
and the composition and properties of the meal; the<br />
effect is greater <strong>for</strong> meals that contain inhibitors of iron<br />
absorption. Vitamin C appears to enhance chromium<br />
absorption [74] and may influence the bioavailability<br />
of selenium [75]. Whether vitamin C affects copper<br />
absorption is still uncertain [76]. Note that the bioavailability<br />
of ascorbic acid from <strong>food</strong> sources is similar to<br />
its bioavailability from supplements and is not affected<br />
by the type of <strong>food</strong> consumed [77].<br />
Organic acids (citric, lactic, acetic, butyric, propionic,<br />
and <strong>for</strong>mic acids) produced during fermentation of<br />
cereals (e.g., tobwa) [78], vegetables (e.g., sauerkraut)<br />
[79], and some soy sauces [80], have the potential to<br />
<strong>for</strong>m soluble ligands with trace minerals in the gastrointestinal<br />
tract [73] and thus may facilitate absorption<br />
of nonheme iron [71] and zinc [26]. Their effect<br />
on iron absorption appears to depend on the type of<br />
organic acid, the molar ratio of organic acid to iron,<br />
and the iron source, <strong>based</strong> on the results of a study in<br />
human Caco-2 cells [81]. The effect is not as consistent<br />
as that of ascorbic acid [82].<br />
Protein, both the type and the amount, influences<br />
the bioavailability of nonheme iron, zinc, and copper.<br />
The enhancing effect of cellular animal protein on<br />
nonheme iron absorption is well documented [83]. The<br />
mechanism is not clear, but some “meat factor” may<br />
be implicated, perhaps through the release of certain<br />
amino acids, oligosaccharides, or possibly cysteinecontaining<br />
peptides, during the digestion of cellular<br />
animal protein. Other proteins from eggs and from<br />
milk and dairy products (especially casein) impair iron<br />
absorption [84]. Hence, it is not surprising that some<br />
epidemiologic studies have shown positive correlations<br />
of serum ferritin with meat and fish intake but negative<br />
correlations with dairy products in adults [85, 86].<br />
In contrast, increasing the amount of total protein<br />
enhances zinc absorption, and if the protein is from<br />
cellular animal sources, the enhancing effect is even<br />
greater [87]. Animal protein may also enhance copper<br />
absorption [88]. In contrast, diets high in protein<br />
increase the urinary excretion of calcium (i.e., hypercalciurea),<br />
which is not compensated by increased<br />
calcium absorption. However, this negative effect of
Diet- and host-related factors in nutrient bioavailability<br />
protein is probably significant only when calcium<br />
intakes are low. It also depends on other constituents,<br />
such as potassium and phosphorus, both of which<br />
blunt the hypercalciuric response [89]. Weaver et al.<br />
[70] provide data on calcium intakes required to offset<br />
urinary losses in adults consuming various amounts<br />
of <strong>dietary</strong> protein.<br />
The presence of protein in the small intestine also<br />
helps to stabilize fat emulsions and enhances micelle<br />
<strong>for</strong>mation and thus uptake of carotenoids [23] and<br />
vitamin A [90].<br />
Flesh <strong>food</strong>s (meat, poultry, fish, and sea<strong>food</strong>) enhance<br />
the absorption of nonheme iron and zinc from plant<strong>based</strong><br />
<strong>food</strong>s. In meals containing meat, fish, or chicken,<br />
nonheme iron absorption is about four times greater<br />
than that from a meal containing equivalent portions<br />
of milk, cheese, or eggs [12]. The relative enhancing<br />
effect of animal muscle proteins on nonheme iron<br />
absorption varies: beef apparently has the highest<br />
effect, followed by lamb, pork, liver, chicken, and fish<br />
[91]. No comparable data exist <strong>for</strong> zinc. The precise<br />
mechanism is unclear, as noted earlier. The enhancing<br />
effect of flesh <strong>food</strong>s on nonheme iron absorption is<br />
evident even in the presence of phytic acid [91], but its<br />
magnitude appears less when a meal is already high in<br />
ascorbic acid [82].<br />
Carbohydrates can stimulate bacterial fermentation<br />
in the intestine and enhance absorption of certain<br />
minerals by increasing their solubility in the ileum.<br />
Examples include lactose, known to enhance both<br />
calcium and magnesium absorption [7].<br />
Fat, both the type and the amount, influences the<br />
absorption of fat-soluble vitamins (e.g., retinol) and<br />
provitamin A carotenoids. Hence, in the low-fat, plant<strong>based</strong><br />
diets characteristic of developing countries,<br />
absorption of fat-soluble vitamins and carotenoids may<br />
be impaired. The minimum amount of fat required<br />
<strong>for</strong> optimal absorption of provitamin A carotenoids<br />
ranges from 5 to 10 g per day [92]. Further, there is no<br />
dose–response relationship above the threshold value.<br />
Such low levels of fat have been reported in diets of<br />
children living in rural Malawi [93]. The type of <strong>dietary</strong><br />
fat may also be important <strong>for</strong> absorption of β-carotene:<br />
absorption may be higher with <strong>dietary</strong> fats rich in<br />
polyunsaturated fatty acids than with <strong>dietary</strong> fats rich<br />
in monounsaturated fatty acids [23].<br />
Competitive interactions between two<br />
or more inorganic nutrients<br />
Inorganic nutrients with similar physicochemical<br />
properties that share the same absorptive pathways are<br />
known to interact with one another by several mechanisms,<br />
only some of which are understood. They may<br />
compete <strong>for</strong> carrier sites on transport proteins. In most<br />
indigenous diets, such competitive interactions are<br />
unlikely to modify bioavailability, because the intrinsic<br />
levels of inorganic nutrients are not high enough to<br />
S83<br />
induce antagonistic interactions. Even if plant <strong>food</strong>s<br />
or diets are <strong>for</strong>tified with micronutrients, the risk of<br />
antagonistic interactions appears to be low, because<br />
the micronutrients become chelated to <strong>dietary</strong> ligands<br />
resulting from the digestion of <strong>food</strong> and thus are<br />
absorbed by different pathways [94]. However, these<br />
interactions could become important if high doses<br />
of micronutrient supplements are consumed without<br />
<strong>food</strong>, as may occur among certain population groups<br />
with high micronutrient requirements, such as infants,<br />
adolescents, and pregnant and lactating women. Excess<br />
zinc (25 or 50 mg/day) has been shown to decrease<br />
biochemical indices of copper status [95, 96] and in<br />
some cases also of iron status [96] in adults. In a stable<br />
isotope study of fasting pregnant Peruvian women, zinc<br />
absorption in the third trimester of pregnancy was significantly<br />
less in women receiving daily supplementation<br />
with a combination of iron (60 mg) and folate (250<br />
µg) than in their unsupplemented counterparts [97].<br />
Among adult ileostomy subjects, iron supplements<br />
inhibited zinc (but not copper) absorption [98]. An<br />
adverse effect of supplemental iron on biochemical zinc<br />
status [99, 100] has also been observed among infants.<br />
The mechanism <strong>for</strong> this adverse effect of supplemental<br />
iron on zinc absorption is not clear, but studies suggest<br />
that iron may inhibit both the uptake and the transfer<br />
of zinc through the intestinal cell [101].<br />
Calcium has an acute inhibitory effect on iron<br />
absorption [102], although the mechanism <strong>for</strong> this<br />
effect is uncertain and its impact is controversial. The<br />
adverse effects have been noted in single-meal [102]<br />
and short-term [103] intervention studies; long-term<br />
studies have failed to demonstrate any significant<br />
inhibitory effect [104–106]. For example, a recent<br />
year-long study of calcium supplementation (500<br />
mg calcium/day) in adolescent girls failed to show<br />
any adverse effect on biochemical iron indices [106].<br />
Nevertheless, a cross-sectional study in six European<br />
countries has demonstrated a weak but inverse association<br />
between calcium and serum ferritin, but the<br />
effect was not dependent on simultaneous ingestion of<br />
calcium and iron, and no dose–response relationship<br />
was noted [107].<br />
In some emerging countries, where pollution is a<br />
problem and where controls <strong>for</strong> landfills in mining<br />
operations are inadequate, antagonistic interactions<br />
between zinc and cadmium, iron and lead, chromium<br />
and zinc, copper and cadmium, and selenium and<br />
mercury may be of concern [27].<br />
Influence of <strong>food</strong> processing and/or preparation<br />
practices on nutrient bioavailability<br />
Increasingly, research has emphasized that prior treatment<br />
of <strong>food</strong> be<strong>for</strong>e consumption may have a marked<br />
effect on the bioavailability of nutrients and hence must<br />
be taken into account when <strong>for</strong>mulating nutrient-<strong>based</strong>
S84<br />
<strong>dietary</strong> requirements. Such treatments may involve<br />
commercial and/or traditional household <strong>food</strong> preparation<br />
and processing practices. The treatments may<br />
involve thermal processing (including canning, extrusion,<br />
baking, and boiling), milling or home pounding,<br />
malting, fermentation, and soaking at the commercial<br />
TABLE 3. Examples of the influence of <strong>food</strong> processing and preparation practices on nutrient bioavailability<br />
Processing method Main technical influences Nutritional consequences<br />
Thermal processing Destroys heat-labile vitamins such as thiamin,<br />
vitamin C, and riboflavin<br />
Releases some vitamins from poorly digested<br />
complexes<br />
Inactivates heat-labile antinutritional factors<br />
May degrade phytate, depending on temperature,<br />
but losses are modest<br />
Gelatinizes starch<br />
Baking Induces Maillard browning in <strong>food</strong>s containing<br />
reducing sugars<br />
Boiling Reduces oxalate content<br />
Some leaching of water-soluble components<br />
Extrusion May degrade phytic acid, causing modest<br />
losses<br />
Induces starch gelatinization<br />
Induces Maillard browning<br />
Milling or home<br />
pounding<br />
Malting, also known as<br />
germination<br />
Reduces phytate content of those cereals with<br />
phytate localized in outer aleurone layer:<br />
(rice, wheat, sorghum) or in germ (maize)<br />
Reduces B-vitamin content<br />
Increases phytase activity via de novo synthesis<br />
or activation of endogenous phytases<br />
Reduces polyphenol content of some legumes<br />
(Vicia faba)<br />
Increases α-amylase content of cereals: sorghum<br />
and millet<br />
Microbial fermentation Induces hydrolysis of phytate by microbial<br />
phytase<br />
Increases content of organic acids<br />
Soaking in water and<br />
decanting<br />
Microbial enzymes may destroy protein inhibitors<br />
that interfere with nitrogen digestibility<br />
Passive diffusion of water-soluble sodium and<br />
potassium phytates in cereal and legume<br />
flours<br />
May activate some endogenous phytases in<br />
cereals and legumes<br />
Soaking maize with lime releases niacin from<br />
niacytin<br />
Reduces amount in final product<br />
R. S. Gibson<br />
Enhances bioavailability of vitamin B 6 , niacin,<br />
folate, certain carotenoids<br />
May enhance bioavailability of vitamin B 1 ,<br />
iodine, biotin, etc., depending on <strong>food</strong> item<br />
Possibly small improvements in bioavailability<br />
of zinc, iron, calcium<br />
Enhances starch digestibility<br />
Destroys basic essential amino acids: lysine,<br />
arginine, methionine; reduces protein quality<br />
and protein digestibility (specific to<br />
baking)<br />
Enhances calcium and possibly iron bioavailability<br />
Some loss of water-soluble vitamins and inorganic<br />
nutrients (specific to boiling)<br />
Possibly small improvements in bioavailability<br />
of zinc, iron, calcium<br />
Enhances starch digestibility<br />
Destroys basic essential amino acids; reduces<br />
protein quality (specific to extrusion)<br />
May enhance bioavailability of zinc, iron, and<br />
calcium, although mineral content simultaneously<br />
reduced<br />
Induces hydrolysis of phytate to lower inositol<br />
phosphates and hence may increase zinc,<br />
iron, and calcium bioavailability<br />
May enhance nonheme iron absorption<br />
Facilitates starch digestion; may increase nonheme<br />
iron absorption through a change in<br />
consistency<br />
May enhance bioavailability of zinc, iron,<br />
calcium<br />
May <strong>for</strong>m soluble ligands with iron and zinc<br />
and enhance bioavailability<br />
May improve protein quality in maize, legumes,<br />
groundnuts, pumpkin, millet seeds<br />
May enhance bioavailability of zinc, iron,<br />
calcium, but some loss of water-soluble<br />
vitamins<br />
Some phytate hydrolysis and thus enhanced<br />
bioavailability of zinc, iron, and calcium<br />
Enhances bioavailability of niacin
Diet- and host-related factors in nutrient bioavailability<br />
or household levels; they are summarized in table 3 and<br />
discussed in turn below. When a combination of strategies<br />
is used, such as soaking, germination, and fermentation,<br />
phytate can be almost completely removed. This<br />
is important, because phytic acid is a potent inhibitor<br />
of iron absorption at low concentrations [38]. During<br />
commercial <strong>food</strong> processing, the use of certain <strong>food</strong><br />
additives, as well as some inadvertent or intentional<br />
contaminants, may also influence the bioavailability<br />
of some nutrients.<br />
Thermal processing<br />
Thermal processing generally enhances the digestibility<br />
of proteins and carbohydrates and may improve<br />
the bioavailability of iodine and certain vitamins (e.g.,<br />
niacin, thiamin, vitamin B 6 , and some carotenoids)<br />
(table 3). In some cases, these improvements in nutrient<br />
bioavailability arise because of the destruction of<br />
some heat-labile antinutrients summarized in table 4.<br />
The digestibility of protein, <strong>for</strong> example, is enhanced<br />
by the destruction of protease inhibitors found in many<br />
legumes, grains, and other <strong>food</strong>s. Protease inhibitors<br />
block the activity of pancreatic enzymes such as trypsin<br />
and chymotrypsin but are destroyed during roasting<br />
and toasting, although boiling may not fully deactivate<br />
them. Similarly, the harmful effects of lectins (agglutinins)<br />
found in certain legumes, including soybeans and<br />
peanuts, can also be removed by heat treatment. Lectins<br />
can agglutinate red blood cells, and they also have the<br />
capacity to adhere to glycoproteins of the intestinal<br />
mucosal membrane surface, leading to a decrease in<br />
digestive and absorptive capacity as well as symptoms<br />
of nausea and diarrhea [108].<br />
Goitrogens can also be inactivated by thermal<br />
processing. The major goitrogens in plant <strong>food</strong>s are<br />
sulfur-containing glucosides (glucosinolates) which<br />
can block the absorption or utilization of iodine, and<br />
thus its uptake into the thyroid gland. More details are<br />
given by Gaitan [109]. Their action is especially important<br />
when iodine intake is low [110]. Neonates, and to<br />
a lesser extent pregnant women, are more sensitive to<br />
S85<br />
the antithyroid action of <strong>dietary</strong> goitrogens than are<br />
infants and children.<br />
Reports on the effects of thermal processing on<br />
phytate degradation are inconsistent and depend on<br />
the plant species, temperature, and/or pH. Thermal<br />
processing involving high temperatures, such as those<br />
used in canning, has been reported to reduce the<br />
phytate content of beans by 70% to 91% [111]. An in<br />
vivo study by Hurrell and co-workers [112], however,<br />
concluded that the extent of phytate degradation in<br />
industrially thermally processed cereal porridges or<br />
home-prepared pancakes or chappattis made from the<br />
same cereal flours (i.e., unrefined and refined wheat<br />
flour) was not sufficient to improve iron absorption.<br />
Thermal processing can also enhance the bioavailability<br />
of some vitamins. Heat-labile thiaminases in<br />
brussels sprouts and red cabbage are destroyed (table<br />
4), whereas any thiamin, vitamin B 6 , niacin, or folate<br />
entrapped in the cellular structure or insoluble matrix<br />
of certain <strong>food</strong>s may be released. For example, significantly<br />
greater increases in serum β-carotene levels after<br />
consumption of cooked carrots and spinach [113] and<br />
in serum lycopene levels after consumption of cooked<br />
tomatoes [114] have been reported than after consumption<br />
of the same amounts raw. This effect is attributed<br />
to softening or disruption of plant cell walls and disruption<br />
of carotenoid–protein complexes.<br />
In contrast, as noted in table 3, thermal processing,<br />
especially when it involves baking or extrusion cooking,<br />
can reduce the biological value of some proteins. This is<br />
caused by the induction of Maillard browning, which<br />
results in the destruction of certain essential amino<br />
acids, especially lysine, and to a lesser extent arginine<br />
and methionine. Oxidation of sulfur-containing amino<br />
acids can also occur. Losses of heat-labile (thiamin,<br />
vitamin C, and riboflavin) and water-soluble vitamins<br />
also occur, the extent of the losses depending on the<br />
temperature, pH, oxygen, light, and amount of water<br />
used [108]. Extrusion may also inhibit degradation of<br />
phytic acid through inactivation of phytase, resulting<br />
in less efficient apparent absorption of zinc compared<br />
TABLE 4. Heat-labile antinutritional factors that have the potential to influence nutrient bioavailability<br />
Antinutritional factor Common <strong>food</strong> sources Effects of antinutritional factor<br />
Avidin Egg whites Binds biotin, making it biologically unavailable<br />
Protease inhibitors Legumes, grains, egg white, potatoes, sweet<br />
potatoes, soy products<br />
Lectins (agglutinins) Legumes: red kidney beans, black beans,<br />
yellow wax beans, soybeans, peanuts<br />
Goitrogens Sweet potato, cassava, millet, beans, cabbage,<br />
Brussels sprouts, turnip<br />
α-Amylase inhibitors Cereals (wheat, barley, maize, rice), peas, beans Slow starch digestion<br />
Thiaminases Fish, shellfish, Brussels sprouts, red cabbage Destroy thiamin<br />
Source: modified from Erdman and Poneros-Schneier [108].<br />
Inhibit activity of digestive enzymes trypsin<br />
and chymotrypsin<br />
Can agglutinate red blood cells and may also<br />
decrease digestive and absorptive capacity of<br />
GI tract<br />
Cause goiter by interfering with absorption or<br />
utilization of iodine
S86<br />
with that from similar but nonextruded cereal products<br />
[79, 115], although not all studies have confirmed these<br />
findings [116]. At the same time, extrusion induces<br />
starch gelatinization, rendering it more accessible to<br />
enzymatic digestion.<br />
Milling or household pounding<br />
Milling or household pounding is used to remove<br />
the bran and/or germ from cereal grains such as rice,<br />
maize, sorghum, and wheat. These processes reduce the<br />
phytate content of those cereals in which the phytate<br />
is localized in the outer aleurone layer (e.g., rice, sorghum,<br />
and wheat) or in the germ (i.e., maize) [117]<br />
and thus may enhance mineral bioavailability, although<br />
the content of minerals and certain B vitamins in the<br />
milled cereals is simultaneously reduced. As a result,<br />
in some countries, milled cereal flours are sometimes<br />
enriched to compensate <strong>for</strong> the nutrients lost. Sieving<br />
unrefined maize grits, as practiced in the Philippines,<br />
can potentially enhance the bioavailability of iron and<br />
zinc in the sieved maize by removing the germ, which<br />
contains as much as 90% of the phytic acid [117].<br />
Malting or germination<br />
Malting, also called germination, involves soaking<br />
cereal grains or legumes in water until sprouting<br />
occurs. This leads to an increase in phytase activity<br />
through de novo synthesis, activation of endogenous<br />
phytase, or both, and as a result some reduction in the<br />
IP-5 and IP-6 content of the germinated whole cereal<br />
grains, most legume seeds, and most oil seeds [38,<br />
118]. The rate of hydrolysis via phytases (myo-inositol<br />
hexakisphosphate 3-phosphohyrolase) (EC 3.1.3.8)<br />
varies with the species and variety, as well as stage<br />
of germination, pH, moisture content, temperature<br />
(optimal range, 45° to 57°C), solubility of phytate, and<br />
presence of certain inhibitors [119, 120]. Egli et al.<br />
[118] observed that during germination, rice, millet,<br />
and mung beans had the largest reductions in phytate<br />
content. Some loss of water-soluble sodium and potassium<br />
phytates may also occur during germination.<br />
Germination may also reduce the content of tannins<br />
and other polyphenols in some legumes (e.g., Vicia<br />
faba) and red sorghum by complexing with proteins<br />
[121].<br />
α-Amylase activity is also increased during germination<br />
of cereals, especially sorghum and millet. Because<br />
these enzymes hydrolyze amylase and amylopectin<br />
to dextrins and maltose, the viscosity of thick cereal<br />
porridges is reduced to an easy-to-swallow, semiliquid<br />
consistency, which may facilitate iron absorption. A<br />
threefold increase in iron absorption has been reported<br />
in amylase-treated, roller-dried rice cereal compared<br />
with untreated roller-dried cereal, which Hurrell et al.<br />
[112] attributed to the viscosity changes induced by<br />
α-amylase.<br />
Microbial fermentation<br />
Microbial fermentation also results in some hydrolysis<br />
of IP-5 and IP-6 to lower inositol phosphates through<br />
the action of microbial phytase enzymes [79]. The<br />
extent of the reduction depends on the type of fermentation;<br />
sometimes as much as 90% or more of phytate<br />
can be reduced by fermentation of maize, soybeans,<br />
sorghum, cassava, cocoyam, cowpeas, and lima beans<br />
[79, 122, 123]. The action of microbial phytase is<br />
important, because there is no phytase activity in the<br />
human intestine [124]. Such reductions in phytate can<br />
have a major impact on enhancing calcium, iron, and<br />
zinc bioavailability, as shown by in vivo isotope studies<br />
in which adults have been fed tortillas or polenta<br />
made from low-phytate maize hybrids compared with<br />
wild-type unmodified maize [125–127]. This effect is<br />
important, since fermented maize, sorghum, and soybean<br />
products are widely consumed in Africa and Asia.<br />
Fermentation of bread dough with yeast also induces<br />
phytate hydrolysis, although if calcium is added as a<br />
<strong>for</strong>tificant, phytase activity in yeast is inhibited.<br />
Organic acids produced during fermentation also<br />
have the potential to enhance iron and zinc absorption<br />
via the <strong>for</strong>mation of soluble ligands with iron and zinc,<br />
as noted earlier [73], and also create the low pH that<br />
is optimal <strong>for</strong> the native phytases. Improvements in<br />
protein quality have also been documented after fermenting<br />
blends of maize and legume flours [128] and<br />
groundnuts, pumpkin, and millet seeds [129], possibly<br />
associated with the destruction of protein inhibitors by<br />
microbial enzymes that interfere with nitrogen digestibility<br />
[128].<br />
Soaking<br />
R. S. Gibson<br />
Soaking can also reduce the IP-5 and IP-6 content of<br />
unrefined cereal (and most legume) flours by passive<br />
diffusion of water-soluble sodium and potassium<br />
phytate [130–132]. Reported reductions in IP-5 and<br />
IP-6 after soaking white rice, maize, and legume flours<br />
(e.g., mung bean flour) range from 57% <strong>for</strong> maize flour<br />
[133, 134] to more than 90% <strong>for</strong> white rice flour [135].<br />
Note that only modest losses occur after soaking whole<br />
legume seeds and cereal grains, with the exception of<br />
rice [135]. This has important implications <strong>for</strong> diets in<br />
Southeast Asia <strong>based</strong> on glutinous rice, which is often<br />
soaked overnight and then steamed, because these<br />
practices result in a substantial loss of water soluble<br />
phytate (the author, personal communication). The<br />
extent of the losses depends on the species, pH, moisture<br />
content, temperature, and solubility of phytate,<br />
the presence of certain inhibitors, and the length and<br />
conditions of soaking. Soaking under optimal conditions<br />
may also activate endogenous phytases and result<br />
in some phytate hydrolysis, as well as some reduction in<br />
the content of other antinutrients, such as saponins and<br />
polyphenols [79]. Note that some losses of water-soluble<br />
B vitamins, such as thiamin, riboflavin, and niacin,
Diet- and host-related factors in nutrient bioavailability<br />
may occur during soaking, so that alternative <strong>dietary</strong><br />
sources of these vitamins must be considered.<br />
The polyphenol content of some legumes (e.g., Vicia<br />
faba) and red sorghum may also be reduced by germination<br />
as a result of the complexation with proteins<br />
and gradual degradation of oligosaccharides [121].<br />
Naturally occurring polyphenol oxidase extracted from<br />
banana or avocado can also been used to reduce the<br />
polyphenol content of red sorghum [136].<br />
Food additives and contaminants<br />
Some <strong>food</strong> additives used in processed <strong>food</strong>s can also<br />
influence nutrient bioavailability. An example is the<br />
practice of nixtamalization or liming used in Central<br />
America <strong>for</strong> processing maize. This increases the<br />
calcium content of tortilla-<strong>based</strong> diets to a level that<br />
may potentiate the inhibitory effect of phytate on zinc<br />
absorption [137]. This practice, however, also releases<br />
niacin from niacytin in maize [138].<br />
In industrialized countries, erythorbic acid (also<br />
termed isoascorbic acid, D-arabo-ascorbic acid) is<br />
widely used as a preservative in processed <strong>food</strong>s.<br />
Erythorbic acid is a steroisomer of ascorbic acid that<br />
does not have any antiscorbutic activity but is a potent<br />
enhancer of nonheme iron absorption [139]. US diets<br />
can provide as much as 200 mg of erythorbic acid per<br />
day, which could enhance nonheme iron bioavailability.<br />
Contaminants in the <strong>food</strong> supply arising, <strong>for</strong> example,<br />
from plant-<strong>based</strong> <strong>food</strong>s grown in soils contaminated<br />
with sewage sludge, phosphate fertilizers, or<br />
pesticides may influence nutrient bioavailability. Heavy<br />
metal contaminants (e.g., cadmium, lead) can cause<br />
antagonistic interactions between cadmium and zinc,<br />
cadmium and iron, lead and zinc, lead and iron, and<br />
lead and calcium, resulting in reduced bioavailability of<br />
zinc, iron, and calcium. Environmental contaminants<br />
can also accumulate in aquatic <strong>food</strong> chains, the most<br />
well-known example being methyl mercury in fish<br />
[140], which is known to bind selenium in <strong>food</strong>s and<br />
reduce its bioavailability.<br />
Inadvertent or intentional ingestion of soil<br />
(geophagia) may also have an impact on mineral<br />
bioavailability. Indeed, geophagia was implicated in<br />
the etiology of the first cases of human zinc and iron<br />
deficiency reported in the Middle East [141, 142].<br />
Although soils are a rich source of minerals, their<br />
ingestion does not necessarily provide a source of<br />
absorbable minerals. Absorption of minerals depends<br />
on the soil type and the timing of the consumption of<br />
soil in relation to the consumption of <strong>food</strong>s. Calcareous<br />
soils may provide a source of absorbable calcium [37],<br />
but others, such as clay, contain inhibiting constituents<br />
(e.g., silicates) that may prevent the absorption both of<br />
inorganic nutrients derived from the soil and of those<br />
intrinsic to <strong>food</strong> [143]. A detailed review of the possible<br />
impact of non<strong>food</strong> sources of iron on iron status<br />
S87<br />
is available [10].<br />
In contrast to contaminants from the soil, trace<br />
element contaminants in <strong>food</strong> from cooking equipment,<br />
cooking pots, or storage conditions, acquired<br />
either during commercial <strong>food</strong> processing or in the<br />
household, may be readily absorbed [10]. Examples<br />
include sources of iron or zinc in <strong>food</strong>s cooked in iron<br />
or galvanized pots. A study in Ethiopia reported lower<br />
rates of anemia and higher serum ferritin concentrations<br />
among children whose <strong>food</strong> was cooked in iron<br />
pots than among those whose <strong>food</strong> was cooked in<br />
aluminum pots [144], suggesting that contaminant iron<br />
from cast-iron cookware may be sufficiently bioavailable<br />
to influence iron status under certain conditions.<br />
Note that the bioavailability of trace elements from the<br />
cooking utensils will be subject to the same interactions<br />
with components in the whole diet as the trace<br />
elements intrinsic to the <strong>food</strong>. Thus bioavailability of<br />
iron and zinc will be low in high-phytate <strong>food</strong>s.<br />
Influence of host-related factors<br />
on bioavailability of nutrients<br />
Several host-related factors are known to influence the<br />
bioavailability of nutrients. They can be classified as<br />
intestinal or systemic factors. Because in<strong>for</strong>mation on<br />
these host-related factors is often limited, their effects<br />
on nutrient bioavailability are often ignored when<br />
<strong>dietary</strong> requirement estimates are set. This is un<strong>for</strong>tunate,<br />
because in some developing countries they<br />
might have a further modifying influence on nutrient<br />
bioavailability over and above that of the <strong>dietary</strong> factors<br />
discussed earlier. The extent to which they influence<br />
absorption and/or utilization varies with the nutrient,<br />
life-stage group, and environment.<br />
Intestinal factors<br />
Both luminal and mucosal factors can influence intestinal<br />
digestion and absorption of nutrients; some<br />
examples are summarized briefly below.<br />
Atrophic gastritis is probably one of the most significant<br />
luminal factors influencing nutrient bioavailability,<br />
predominantly through its association with hypochlorhydria.<br />
The latter is a condition in which there is a<br />
progressive decrease in the capacity of the parietal<br />
cells of the stomach to secrete hydrochloric acid [145].<br />
Hypochlorhydria is linked to infection with the bacterium<br />
Helicobacter pylori, an infection that is especially<br />
prevalent among children in developing countries,<br />
where it is typically acquired in childhood and persists<br />
throughout life. Even in Western countries, infection<br />
with H. pylori has been linked to the hypochlorhydria<br />
that may affect as many as 10% to 30% of persons over<br />
60 years of age.<br />
Absorption of several vitamins and minerals that are
S88<br />
dependent on pH <strong>for</strong> absorption can be impaired as a<br />
result of the pH changes that accompany hypochlorhydria.<br />
For example, low acid conditions of the stomach<br />
can impair the release of protein-bound vitamin B 12<br />
contained in <strong>food</strong> [146] and the absorption of β-carotene<br />
[147] and folate [148]. Alterations in the pH of the<br />
jejunum may also impair deconjugation of folate and<br />
thus folate absorption [24].<br />
Absorption of iron, calcium, and possibly zinc may<br />
also be affected by reduced gastric acid secretion,<br />
because gastric acid affects the solubilization of these<br />
inorganic nutrients [149–151]. Hence, reduced gastric<br />
output arising from infection with H. pylori could limit<br />
the absorption of iron, calcium, and possibly zinc and<br />
may be an important factor in the etiology of iron deficiency<br />
and iron-deficiency anemia, especially among<br />
children in developing countries. However, in a recent<br />
study of H. pylori-infected Bangladeshi children, no<br />
increase in iron absorption was observed, despite an<br />
improvement in gastric acid output and hemoglobin<br />
concentration after treatment with antibiotics [152].<br />
Other physiological consequences of atrophic gastritis<br />
include decreased acid-pepsin digestion in the<br />
stomach and decreased secretion of intrinsic factor,<br />
both of which result in malabsorption of vitamin B 12 .<br />
Bacterial overgrowth in the stomach and proximal<br />
small intestine is also often associated with atrophic<br />
gastritis and may exacerbate vitamin B 12 deficiency<br />
because the bacteria take up any freed vitamin B 12<br />
from <strong>food</strong> [153].<br />
Bacterial overgrowth and infection with Giardia lamblia,<br />
Ascaris lumbricoides, rotavirus, and salmonella, as<br />
well as malaria and iron deficiency [154], can alter the<br />
integrity of the intestinal mucosal, causing increases<br />
in intestinal permeability and reductions in nutrient<br />
absorption. Such perturbations in the morphology<br />
and function of the intestine may even arise in normal<br />
healthy persons residing in tropical areas [155] and are<br />
known to reduce the absorption of vitamin A [156],<br />
folate [157], and probably those nutrients <strong>for</strong> which<br />
secretion and absorption of endogenous sources in the<br />
intestine are key homeostatic mechanisms (e.g., zinc,<br />
copper, calcium). For example, the large endogenous<br />
fecal losses of zinc that perturbed zinc homeostasis<br />
in young, apparently healthy Malawian children aged<br />
2 to 5 years [28] may have resulted from abnormal<br />
intestinal permeability [158]. Alternatively, the high<br />
phytate content of the maize-<strong>based</strong> diets of the children<br />
may have bound endogenously secreted zinc, making<br />
it unavailable <strong>for</strong> reabsorption [26]. Alterations in the<br />
structure of the intestinal mucosa will also compromise<br />
iron homeostasis, because iron is regulated by uptake<br />
and transfer by the intestinal mucosa. The proportion<br />
of bioavailable carotene converted to retinol (bioconversion)<br />
is probably also affected, because the enzyme<br />
(15-15’-carotenoid dioxygenase) responsible <strong>for</strong> this<br />
cleavage is present in the intestinal mucosal brush<br />
border [23]. In addition, reductions in transit time are<br />
often associated with many of these infections, which<br />
will in turn decrease the time required <strong>for</strong> extensive solubilization<br />
of nutrients in the intestinal tract and again<br />
further compromise intestinal nutrient absorption.<br />
Systemic factors<br />
R. S. Gibson<br />
Systemic factors that can influence absorption and utilization<br />
of nutrients include age, sex, possibly ethnicity,<br />
genotype, physiological state (e.g., pregnancy, lactation),<br />
and the nutrient status of the host, together with<br />
the presence of coexisting gastrointestinal disorders<br />
or disease such as chronic and acute infections [159].<br />
For example, during the first 6 months of infancy,<br />
maturation of both the gastrointestinal tract and the<br />
digestive and absorptive processes are known to affect<br />
bioavailability of macronutrients and probably of<br />
micronutrients as well, although no data are available<br />
at the present time [160].<br />
Potential reductions in nutrient absorption with<br />
advancing age are especially important in those countries<br />
with an aging population. Alterations in the secretory<br />
and absorptive capacity of the intestine occur with<br />
advancing age, which in turn affect the bioavailability<br />
of certain micronutrients; macronutrients are unaffected.<br />
The micronutrients most affected are vitamin<br />
B 12 , as noted earlier, as well as calcium, vitamin D,<br />
and possibly vitamin B 6 [153]. Decreased absorption<br />
of calcium is linked to age-related changes in vitamin<br />
D metabolism involving a reduction in the number<br />
of vitamin D receptors in the intestinal mucosa, and<br />
thus diminished capacity to absorb vitamin D [161].<br />
Additional problems with vitamin D metabolism in<br />
the elderly include decreased ability of the kidneys to<br />
dihydroxylate 25-hydroxyvitamin D to the active 1,25dihydroxy<br />
<strong>for</strong>m and decreased ability of the skin to<br />
synthesize vitamin D after exposure to ultraviolet light<br />
[162]. Such disturbances may lead to malabsorption<br />
of both vitamin D and calcium; decreases in <strong>dietary</strong><br />
intakes of vitamin D and sun exposure among the elderly<br />
may be exacerbating factors. Whether changes also<br />
occur during aging in the bioconversion of provitamin<br />
A carotenoids to vitamin A is unknown.<br />
Increases in vitamin B 6 requirements with age have<br />
also been reported, although they have not been related<br />
to malabsorption, but instead to problems with cellular<br />
uptake or metabolism of the vitamin [151, 163]. Similar<br />
disturbances may also occur with thiamin during<br />
aging, but this question requires more investigation<br />
[22]. In contrast, body stores of vitamin A in the elderly<br />
do not decline, despite lower intakes. Initially, an<br />
increase in the efficiency of absorption with advancing<br />
age was said to be responsible [164], but later research<br />
confirmed that such well-maintained vitamin A stores<br />
were due to decreased clearance of the vitamin from<br />
the circulation into peripheral tissues [165]. Whether
Diet- and host-related factors in nutrient bioavailability<br />
decreased clearance from the circulation occurs with<br />
other fat-soluble substances with advancing age is<br />
not clear. Renal function is also known to decline<br />
with advancing age [166], which could influence the<br />
bioavailability of those nutrients (or nutrient metabolites)<br />
which are excreted mainly via the kidney (e.g.,<br />
selenium, iodine, chromium) and <strong>for</strong> which renal<br />
conservation plays a key role in homeostasis.<br />
Certain physiological adaptations may occur that<br />
alter nutrient bioavailability in circumstances when<br />
nutrient needs are high (e.g., during periods of rapid<br />
growth, pregnancy, and lactation) or habitual <strong>dietary</strong><br />
intakes are low. These adaptations may include<br />
increased gastrointestinal absorption of nutrients from<br />
the diet, enhanced renal conservation of nutrients,<br />
enhanced utilization of absorbed nutrients by tissues,<br />
and/or bone resorption [160, 167]. Conversely, when<br />
nutrient needs are low, intestinal absorption may be<br />
reduced and/or the mechanisms <strong>for</strong> renal clearance<br />
increased. Note that the extent to which these physiological<br />
adaptations compensate <strong>for</strong> the increased or<br />
decreased needs <strong>for</strong> these inorganic nutrients is not<br />
always known. Likewise, the time scale over which such<br />
homeostatic mechanisms occur is uncertain.<br />
Table 5 summarizes the homeostatic adaptations<br />
that may occur <strong>for</strong> certain inorganic nutrients to meet<br />
S89<br />
these increased nutrient needs during pregnancy and<br />
lactation and in response to changes in <strong>dietary</strong> intake<br />
[27, 160, 167–169]. There is also some evidence that<br />
absorption of certain nutrients (e.g., calcium) may vary<br />
with ethnicity [170, 171]. Whether the absorption of<br />
vitamins is modified by the nutrient status of the host<br />
is uncertain; limited data are available. Some data <strong>for</strong><br />
vitamins A and D suggest there is little or no evidence<br />
that vitamin A deficiency up-regulates conversion of βcarotene<br />
in humans [172], or that absorption of vitamin<br />
A [90] or vitamin D [173] is influenced by the nutrient<br />
status of the host. In contrast, data <strong>based</strong> on animal<br />
studies have led others to postulate that absorption of<br />
β-carotene and canthaxanthin [23, 174] and bioconversion<br />
of β-carotene to retinol [175] may be dependent<br />
on the vitamin A status of the individual. More studies<br />
are needed to confirm these suggestions.<br />
Other highly significant determinants of nutrient<br />
requirements are chronic and acute infections.<br />
Chronic and acute infections are of marked concern<br />
when endemic and highly prevalent or when acute<br />
infectious illnesses occur frequently, especially when<br />
affected populations are poorly nourished. The latter<br />
is of particular concern because of the adverse synergy<br />
between poor nutrition and infectious illness [176].<br />
These considerations are especially relevant to coun-<br />
TABLE 5. Examples of homeostatic adaptations <strong>for</strong> selected inorganic nutrients in response to increased needs and changes<br />
in <strong>dietary</strong> intakes <strong>based</strong> on results from in vivo human studies<br />
Nutrient<br />
Homeostatic adaptations during pregnancy<br />
and lactation<br />
Calcium Pregnancy: increased absorption<br />
Lactation: increased renal conservation<br />
and bone resorption<br />
Homeostatic adaptations in response to changes in<br />
<strong>dietary</strong> intake<br />
Increase in fractional absorption from the diet when<br />
intake or status is low, and decrease in fractional<br />
absorption when intake or status is high. This adaptive<br />
response is reduced among the elderly<br />
Magnesium No data Increase in fractional absorption from the diet when<br />
intake or status is low, and decrease in fractional<br />
absorption when intake or status is high.<br />
Zinc Pregnancy and lactation:<br />
» increase in zinc absorption but not in<br />
renal conservation<br />
» no release of maternal tissue zinc in pregnancy<br />
Iron Pregnancy: increased absorption, especially<br />
in 3rd trimester<br />
Chromium Pregnancy: unknown<br />
Lactation: do not appear to reduce urinary<br />
chromium excretion<br />
Copper Pregnancy: increased absorption likely<br />
Lactation: no data on copper absorption<br />
available<br />
Decrease in endogenous zinc excretion provides<br />
“fine control” to maintain zinc balance when intake<br />
or status is low; increase or decrease in fractional<br />
absorption from the diet may provide “coarse control”<br />
of body zinc when intake or status is low or high,<br />
respectively; renal conservation when intake is very<br />
low.<br />
Increase in fractional absorption from the diet when<br />
intake or status is low, and decrease in fractional<br />
absorption when intake or status is high.<br />
Possibly a reduction in urinary excretion when intake<br />
or status is low<br />
Increase in fractional absorption from the diet when<br />
intake or status is low, and decrease in fractional<br />
absorption when intake or status is high; reduction in<br />
urinary excretion when intake is very low
S90<br />
tries with developing economies. Such countries generally<br />
have relatively high proportions of infants and<br />
children and other high-risk populations, poor disease<br />
prevention infrastructures, and inadequate availability<br />
and accessibility of health care systems able to provide<br />
prompt and efficacious treatment. These conditions<br />
are not uncommon and exacerbate the adverse synergy<br />
between poor nutrition and infection, thus it is surprising<br />
that data assessing the impact of infectious illness<br />
on energy and macro-, micro-, and trace nutrient needs<br />
remain inadequate [177–182]. Despite the inadequacy<br />
of available data, what is available often is sufficient<br />
to calculate semi-quantitative estimates of the impact<br />
of illness on nutrient needs. Impacts of illness are not<br />
uni<strong>for</strong>m, however. Among the factors that should be<br />
considered in assessments of specific nutrient needs<br />
are the offending agents, illness severity, age of hosts,<br />
stage of illness (e.g., acute or convalescent phase),<br />
hosts’ nutritional status, and other underlying health<br />
conditions. In assessing the impact of infections on<br />
populations, it is essential to know relatively well the<br />
prevalence of conditions of interest.<br />
Infectious illness impacts nutrient needs by one or<br />
a combination of various mechanisms. These include<br />
decreased absorption through direct and indirect<br />
effects on gastrointestinal function, increased losses<br />
through the gastrointestinal tract or other routes (e.g.<br />
renal system), heightened metabolic activity, or the<br />
sequestration of nutrients in the liver and other sites.<br />
These mechanisms have been investigated <strong>for</strong> bacterial,<br />
parasitic, and viral infections [e.g., 183–185]. Nutrient<br />
status also influences tissue repair mechanisms and the<br />
susceptibility to disease [186]. Relationships between<br />
nutritional status and the progression of illness have<br />
been investigated most recently and intensively <strong>for</strong><br />
HIV [187].<br />
In the future, several other factors may also be taken<br />
into account when setting <strong>dietary</strong> requirement estimates.<br />
These may include race or ethnicity, lifestyle<br />
(e.g., smokers, oral contraceptive users), the existence<br />
of chronic disease (e.g., asthma, diabetes), environment<br />
(e.g., lead pollution), family history, and genetic<br />
predisposition to disease [188].<br />
Implications <strong>for</strong> adjusting physiological<br />
requirements to <strong>dietary</strong> requirements<br />
At present, the diet- and host-related factors influencing<br />
the bioavailability of many nutrients are not well<br />
established, limiting the development of algorithms<br />
to predict nutrient bioavailability. Notable exceptions<br />
are the algorithms available <strong>for</strong> iron, zinc, protein,<br />
folate, vitamin A, and carotenoids. These mathematical<br />
models attempt to predict bioavailability, taking into<br />
account the amount and <strong>for</strong>m of the nutrient (where<br />
applicable), the presence of <strong>dietary</strong> enhancers and<br />
inhibitors, and, when necessary, the nutrient status of<br />
the individual. The models then apply certain general<br />
principles to the complex whole-diet matrix. However,<br />
the accuracy of the algorithms is limited by interactions<br />
known to occur between the enhancing and inhibiting<br />
factors in the whole diet, as discussed earlier. For example,<br />
when the absorption modifiers are contained in the<br />
same meal, their effects are probably not additive [189].<br />
Furthermore, because most of the effects of the <strong>dietary</strong><br />
modifiers on micronutrient absorption have been calculated<br />
from the results of single test meals, their effects<br />
may be exaggerated in comparison with the extent of<br />
the enhancement or inhibition measured over several<br />
days [3]. Furthermore, the magnitude of the effect of<br />
the absorption modifiers depends on the background<br />
<strong>dietary</strong> matrix [82]. These findings emphasize that<br />
as new research findings emerge, algorithms must be<br />
modified on an ongoing basis.<br />
Algorithms <strong>for</strong> available iron<br />
R. S. Gibson<br />
The first algorithm <strong>for</strong> estimating available iron intakes<br />
was developed by Monsen et al. [190] and can be used<br />
when intakes of flesh <strong>food</strong>s, vitamin C, and total iron<br />
at each meal are known. In this model, 40% of the total<br />
iron found in meat, poultry, and fish is assumed to be<br />
heme iron. Nonheme iron is calculated as the difference<br />
between total iron and heme iron intakes.<br />
Absorption of heme iron was assumed to be 25% in<br />
the initial model but 23% in a later model [191]. The<br />
absorption of nonheme iron was assumed to be lower<br />
and to vary according to the amounts of meat, poultry,<br />
and fish and of ascorbic acid in each meal, as well as<br />
the level of iron stores of the individual. Total available<br />
iron intakes per day can be derived from the sum of<br />
available iron from each meal and snack. Note that this<br />
model does not take into account the amounts of any<br />
absorption inhibitors in a meal or any possible synergistic<br />
effects of absorption enhancers that are present<br />
together in the same meal.<br />
FAO/WHO [192] has also developed a semiquantitative<br />
classification system <strong>for</strong> estimating iron bioavailability<br />
<strong>based</strong> on measures of iron absorption<br />
from typical meals in Asia, India, Latin America, and<br />
Western countries. In this model, diets are classified<br />
into three broad categories of low (iron absorption<br />
approximately 5%), intermediate (iron absorption<br />
approximately 10%), and high (iron absorption approximately<br />
15%) bioavailability depending on their content<br />
of flesh- versus plant-<strong>based</strong> <strong>food</strong>s together with their<br />
content of ascorbic acid–rich <strong>food</strong>s. The estimates of<br />
absorption are <strong>for</strong> nonanemic persons (i.e., those with<br />
normal hemoglobin levels) with normal iron transport<br />
but no iron stores. In cases of iron-deficiency anemia<br />
(i.e., low hemoglobin levels), each absorption value is<br />
assumed to be increased by 50% [192]. Currently, it<br />
is difficult to clearly distinguish between a low- and
Diet- and host-related factors in nutrient bioavailability<br />
intermediate-bioavailability diet with this classification<br />
system.<br />
FAO/WHO [182] still recommends this classification<br />
system but has proposed the use of two categories<br />
of bioavailability <strong>for</strong> diets in developing countries<br />
(5% and 10%) and another two categories <strong>for</strong> more<br />
Western-type diets (12% and 15%), depending on the<br />
meat content of the diet. As more comprehensive data<br />
become available on the absorption of iron from meals<br />
of differing composition, this classification system<br />
should be refined.<br />
Murphy et al. [193] adapted the algorithms of<br />
Monsen et al. [190] and FAO/WHO [192] to estimate<br />
iron bioavailability in diets from developing countries.<br />
To use this algorithm, quantitative data on the intake<br />
of iron and of two enhancers—ascorbic acid and protein<br />
from meat, fish, and poultry—are required. The<br />
cutoffs applied to these two enhancers are expressed<br />
per 4.18 MJ (1000 kcal), so that the same algorithm can<br />
be used <strong>for</strong> males and females across all age groups. A<br />
tea or coffee factor can also be applied, depending on<br />
the average number of cups of tea or coffee per day, to<br />
account <strong>for</strong> the inhibitory effects of usual tea or coffee<br />
consumption on nonheme iron absorption. The effect<br />
of phytate on iron absorption is not considered.<br />
Murphy’s model [193], like that of Monsen [190],<br />
also assumes that heme iron constitutes 40% of the iron<br />
in meat, poultry, and fish and assumes 25% absorption.<br />
The computer program supplied with the WorldFood<br />
Dietary Assessment System calculates intake of available<br />
iron by using Murphy’s model [193]. This program<br />
is available from http://www.fao.org/in<strong>food</strong>s/.<br />
Several alternative algorithms have been developed<br />
<strong>for</strong> calculating available iron, each of which takes into<br />
account differing numbers of absorption modifiers.<br />
For example, Tseng et al. [194] have refined Murphy’s<br />
model so that nonheme iron absorption can be<br />
adjusted <strong>for</strong> the enhancing effect of meat, poultry, fish,<br />
and vitamin C. Separate adjustments can be made<br />
<strong>for</strong> the inhibitory effects of tea and phytates in the<br />
diet. However, this model does not account <strong>for</strong> the<br />
combined effect of enhancers and inhibitors on iron<br />
absorption and has not had extensive use.<br />
Du et al. [195] compared the use of the algorithm<br />
developed by Tseng et al. [194] with the algorithms of<br />
Monsen et al. [190] and FAO/WHO [192] <strong>for</strong> estimating<br />
iron bioavailability in the diets of Chinese adults,<br />
<strong>based</strong> on 24-h recalls collected over 3 consecutive<br />
days. Hemoglobin as an indicator of iron status was<br />
also measured. None of the algorithms appeared to<br />
be appropriate <strong>for</strong> estimating iron bioavailability in<br />
these Chinese diets. These investigators emphasized<br />
that <strong>for</strong> vegetarian diets it is important to consider the<br />
combined effect of multiple <strong>dietary</strong> factors on iron<br />
bioavailability.<br />
Two additional algorithms are available <strong>for</strong> estimating<br />
<strong>dietary</strong> iron absorption. Reddy et al. [189] studied<br />
S91<br />
iron status (serum ferritin) and iron absorption (via<br />
extrinsic radioiron labeling) from 25 different single<br />
meals eaten by 86 subjects. An algorithm was then<br />
developed, using multiple regression analysis, to<br />
predict iron absorption after adjustment <strong>for</strong> each individual’s<br />
iron status and including <strong>dietary</strong> modifiers as<br />
independent variables. It is of interest that only 16.4%<br />
of the total variance in iron absorption was accounted<br />
<strong>for</strong> by the amount of animal tissue, phytic acid, and<br />
ascorbic acid in the typical Western diets studied, with<br />
the major portion being explained by the animal tissue<br />
and phytic acid contents of the meals. Nonheme iron,<br />
calcium, and polyphenols were not significant predictors<br />
of iron absorption. These results emphasize the<br />
relatively small influence of diet on the amount of iron<br />
absorbed in comparison with the more important but<br />
unknown physiological factors.<br />
Of all the algorithms available to date, the model of<br />
Hallberg and Hulthén [196] is the most detailed, taking<br />
into account the affects of all the known enhancing and<br />
inhibiting factors on nonheme iron absorption, as well<br />
as interactions among the different factors. Application<br />
of this more detailed model is limited at the present<br />
time by the paucity of <strong>food</strong>-composition data <strong>for</strong> the<br />
content of both phytate and iron-binding polyphenols<br />
in <strong>food</strong>s. However, this situation is changing.<br />
Algorithms <strong>for</strong> available zinc<br />
The bioavailability of <strong>dietary</strong> zinc, like that of iron, is<br />
affected by the presence of several absorption enhancers<br />
and inhibitors in the whole diet, as well as the total<br />
zinc content.<br />
Three algorithms have been developed <strong>for</strong> calculating<br />
available zinc. The first algorithm was developed<br />
by WHO [37] and takes into account the impact of<br />
one absorption enhancer (protein from meat, fish, and<br />
poultry) and two absorption inhibitors (the proportion<br />
of phytic acid to zinc, and high levels of calcium). In<br />
this algorithm, diets are classified as having low (15%<br />
absorption), moderate (30% or 35% absorption), or<br />
high (50% or 55% absorption) zinc bioavailability.<br />
Of the two inhibitors considered in this algorithm,<br />
phytate is the major determinant of zinc absorption,<br />
especially <strong>for</strong> diets in developing countries with a low<br />
content of flesh <strong>food</strong>s. Calcium is unlikely to have any<br />
adverse effect because its levels are low in plant-<strong>based</strong><br />
diets. The inhibitory effect of phytate on zinc absorption<br />
follows a dose-dependent response [197], and the<br />
molar ratio of phytate to zinc in the diet can be used<br />
to estimate the proportion of absorbable zinc [198].<br />
Because myo-inositol phosphates with fewer than five<br />
phosphate groups do not inhibit zinc absorption, any<br />
<strong>food</strong> processing or preparation method (e.g., fermentation<br />
or germination) that might hydrolyze phytate must<br />
also be considered; details are given by WHO [37].<br />
This algorithm has been adopted by FAO/WHO [182],
S92<br />
although only the absorption estimates <strong>for</strong> the normative<br />
zinc requirements (i.e., level of intake that maintains<br />
a reserve adaptive capacity) are now included.<br />
The second algorithm <strong>for</strong> available zinc was developed<br />
by Murphy et al. [193] and is <strong>based</strong> on that of<br />
WHO [37]. It again takes into account the content of<br />
animal protein and the content of the same two inhibitory<br />
factors, phytate and calcium, in the whole diet.<br />
For this algorithm, the phytate:zinc molar ratio of the<br />
whole diet is calculated; details are given by Hotz and<br />
Brown [36]. The bioavailability of diets with phytate:<br />
zinc molar ratios of 0 to 5, 5 to 15, 15 to 30, and > 30 is<br />
55%, 35%, 15%, and 10%, respectively. These bioavailability<br />
estimates are then further modified, depending<br />
on the animal protein and calcium content of the diet;<br />
details are given by Murphy et al. [193]. In most plant<strong>based</strong><br />
diets in developing countries, however, intakes<br />
of animal protein and calcium are generally too low<br />
to influence zinc absorption. Even in Latin American<br />
countries where calcium intakes are often above 1 g/day,<br />
phytate intakes are so high that any further reduction<br />
in zinc absorption is assumed to be unlikely.<br />
The International Zinc Nutrition Consultative Group<br />
(IZiNCG) has also developed an algorithm <strong>for</strong> the<br />
bioavailability of zinc <strong>based</strong> on measurements of zinc<br />
absorption in adults using only total diet studies; studies<br />
using a semipurified diet or exogenous sources of<br />
zinc in the <strong>for</strong>m of zinc salts were excluded. Details are<br />
given in Hotz and Brown [36]. A logit regression model<br />
was used to describe the relationship between four<br />
<strong>dietary</strong> factors (zinc, phytate, protein, and calcium) and<br />
the percentage of the zinc intake absorbed. However,<br />
in the final model only zinc and the phytate:zinc molar<br />
ratio were shown to be significant predictors of the percentage<br />
of zinc absorption in adults. Neither calcium<br />
nor protein added significant predictive power.<br />
The bioavailability figures <strong>for</strong> zinc calculated by<br />
IZiNCG are 26% <strong>for</strong> men and 34% <strong>for</strong> women consuming<br />
mixed or refined vegetarian diets with phytate:<br />
zinc molar ratios of 4 to 18, and 18% <strong>for</strong> men and 25%<br />
<strong>for</strong> women consuming unrefined, cereal-<strong>based</strong> diets<br />
with phytate:zinc molar ratios >18. Whether these<br />
bioavailability factors are appropriate <strong>for</strong> children,<br />
pregnant or lactating women, or the elderly has not<br />
been established [36].<br />
Algorithms <strong>for</strong> other nutrients<br />
So far, steps have been taken to quantify the bioavailability<br />
of protein, folate, carotenoids, and vitamin A in<br />
human diets.<br />
Protein intakes can be adjusted <strong>for</strong> both protein<br />
quality and digestibility by using the FAO/WHO/UNU<br />
<strong>guidelines</strong> [199]. Such adjustments are especially necessary<br />
in countries where habitual diets are plant-<strong>based</strong>,<br />
because the safe levels of protein intake were calculated<br />
from studies <strong>based</strong> on animal protein [199]. Further,<br />
R. S. Gibson<br />
large intakes of <strong>dietary</strong> fiber, especially insoluble fiber,<br />
are known to increase fecal nitrogen excretion, resulting<br />
in a reduction in apparent protein digestibility<br />
of approximately 10%. Note that the World Dietary<br />
Assessment program computes utilizable protein by<br />
adjusting intakes to account <strong>for</strong> both digestibility<br />
and amino acid score, using these FAO/WHO/UNU<br />
procedures.<br />
In 1990, FAO/WHO recommended the use of<br />
a protein digestibility–corrected amino acid score<br />
(PDCAAS) [200]. This is <strong>based</strong> on comparison of the<br />
concentration of the first limiting amino acid in the<br />
habitual mixed diet (calculated from <strong>food</strong>-composition<br />
values) with the concentration of that amino acid in a<br />
reference pattern of essential amino acids; details are<br />
given by Schaafsma [201]. Once the amino acid score<br />
has been derived in this way, it is then corrected <strong>for</strong><br />
true fecal digestibility, preferably by weighted summation<br />
of the individual protein sources, as specified by<br />
FAO/WHO/UNU [199].<br />
Folate is a naturally occurring vitamin found in<br />
<strong>food</strong>s. However, the term is also used to embrace<br />
synthetic folic acid found in <strong>for</strong>tified <strong>food</strong>s and supplements.<br />
In recognition of the known differences in bioavailability<br />
between naturally occurring polyglutamate<br />
<strong>for</strong>ms in <strong>food</strong>s and synthetic folic acid found in <strong>for</strong>tified<br />
<strong>food</strong>s and supplements, the Institute of Medicine<br />
[6] has introduced a new term, <strong>dietary</strong> folate equivalent<br />
(DFE), to take into account the differences in the bioavailability<br />
of all sources of ingested folate. The <strong>dietary</strong><br />
folate equivalent content of a <strong>food</strong> is defined as<br />
µg <strong>food</strong> folate + (1.7 × µg synthetic folic acid).<br />
This equation is <strong>based</strong> on the assumption that the bioavailability<br />
of <strong>food</strong> folate is about 50%, whereas that of<br />
folic acid taken with <strong>food</strong> is 85% (i.e., folic acid is 85/50<br />
= 1.7 times more available) [19, 20].<br />
Many countries are now <strong>for</strong>tifying <strong>food</strong>s such as<br />
breads and grains with the synthetic monoglutamate<br />
<strong>for</strong>m, but most current <strong>food</strong>-composition tables do<br />
not distinguish folate found naturally in <strong>food</strong>s from<br />
folic acid added to <strong>food</strong>s. Work is under way in some<br />
countries to provide this in<strong>for</strong>mation [202].<br />
Vitamin A in the diets of most industrialized countries<br />
occurs mainly as pre<strong>for</strong>med vitamin A derived<br />
from animal products. In contrast, in most tropical<br />
countries, the main sources of vitamin A are the provitamin<br />
A carotenoids from dark-green leafy vegetables<br />
and certain yellow- and orange-colored fruits and<br />
vegetables [203]. Provitamin A carotenoids include<br />
β-carotene, α-carotene, and α- and β-cryptoxanthins.<br />
Currently there is debate about the bioefficacy of<br />
ingested provitamin A carotenoids [181, 203, 204]. For<br />
example, <strong>dietary</strong> vitamin A levels may be expressed<br />
in terms of micrograms of retinol equivalents (RE),<br />
calculated using either the FAO/WHO [192] or the<br />
West [203] conversion factors <strong>for</strong> the bioefficacy of
Diet- and host-related factors in nutrient bioavailability<br />
ingested provitamin A carotenoids to that of retinol.<br />
An alternative term developed by the Institute of Medicine<br />
[204] and adopted by the International Vitamin A<br />
Consultative Group [205] is retinol activity equivalent<br />
(RAE). The latter is <strong>based</strong> on different conversion<br />
factors, which are discussed in detail in Institute of<br />
Medicine [204].<br />
FAO/WHO [181] still recommends use of the 1988<br />
FAO/WHO [192] conversion factors to calculate RE<br />
until more definitive data are available. These conversion<br />
factors do not distinguish between synthetic<br />
sources of provitamin A compounds and natural<br />
sources in plants. Increasingly, synthetic sources of retinol<br />
and provitamin A compounds (mainly β-carotene)<br />
are being added to <strong>food</strong>s or used as <strong>dietary</strong> supplements<br />
in both industrialized and developing countries.<br />
For other nutrients, such as calcium and magnesium,<br />
the amount available <strong>for</strong> absorption is generally estimated<br />
from the major <strong>food</strong> sources of these minerals<br />
in the diet.<br />
Alternative methods <strong>for</strong> estimating bioavailability of<br />
iron and zinc from regional or national diets<br />
Application of the algorithms described above requires<br />
detailed <strong>food</strong>-consumption data, preferably at the<br />
national level. Un<strong>for</strong>tunately, such data are often not<br />
available, especially in developing countries. Instead,<br />
alternative approaches are needed, possibly using <strong>food</strong>balance<br />
sheet data. Food-balance sheets, published by<br />
FAO, provide data on the annual supply of 95 individual<br />
<strong>food</strong> commodities and 15 major <strong>food</strong> groups<br />
per capita that are available <strong>for</strong> human consumption in<br />
176 countries. The major <strong>food</strong> groups are cereals, roots<br />
and tubers, sugars and honey, pulses, nuts and oilseeds,<br />
vegetables, fruits, meat and offal, eggs, fish and sea<strong>food</strong>,<br />
milk, oils and fats, spices, stimulants, and alcoholic<br />
beverages; details are given in FAO/WHO [206].<br />
The FAO <strong>food</strong>-balance sheets also provide data on<br />
the daily per capita availability of energy (kilocalories<br />
per day), fat (grams per day), and protein (grams per<br />
day) <strong>for</strong> each commodity and each <strong>food</strong> group, calculated<br />
from regional <strong>food</strong>-composition tables. Hence,<br />
the mean daily per capita availability of the proportion<br />
of energy from each <strong>food</strong> commodity and <strong>food</strong> group<br />
can be calculated. This may provide a useful approach<br />
<strong>for</strong> estimating the bioavailability of selected nutrients<br />
at the national level. For example, to estimate the bioavailability<br />
of iron at the national level, the mean daily<br />
availability per capita of the percentage of energy from<br />
cellular animal protein (meat, fish, poultry) may be<br />
useful, whereas <strong>for</strong> calcium, the percentage of energy<br />
from dairy products is probably more appropriate.<br />
Alternatively, if data on the mean daily per capita availability<br />
of additional nutrients such as iron, zinc, and<br />
calcium become available, then the percentage of iron<br />
or zinc from cellular animal protein, or the percentage<br />
S93<br />
of calcium from dairy products, could be calculated.<br />
Caution must be used, however, in the interpretation<br />
of these data if staple <strong>food</strong>s are <strong>for</strong>tified with iron, zinc,<br />
and/or calcium at the national level.<br />
Calculation of mean daily per capita availability<br />
of phytate:zinc molar ratios from <strong>food</strong>-balance sheet<br />
data could provide a useful assessment of the bioavailability<br />
of zinc at the national level. As an example,<br />
table 6 shows the per capita phytate:zinc molar ratios<br />
and proportion of energy from animal-source <strong>food</strong>s <strong>for</strong><br />
selected countries calculated from FAO <strong>food</strong>-balance<br />
sheet data; further details are given by Hotz and Brown<br />
[36]. Depending on the phytate:zinc molar ratios,<br />
countries could be classified into those with diets of<br />
moderate (phytate:zinc molar ratios of 4 to 18) or low<br />
(phytate:zinc molar ratios > 18) zinc bioavailability by<br />
using the corresponding absorption estimates [36].<br />
At present, national <strong>food</strong>-balance sheet data cannot<br />
be used to estimate the bioefficacy of provitamin A<br />
carotenoids. The <strong>food</strong> commodities itemized in the<br />
vegetable and fruit group are not comprehensive<br />
enough to compile a separate <strong>food</strong> group <strong>for</strong> green leafy<br />
vegetables, orange/yellow vegetables, or orange/yellow<br />
fruits.<br />
Comparison of adjustments <strong>for</strong> diet- and host-related<br />
factors influencing iron and zinc bioavailability<br />
across countries<br />
In view of the uncertainty about the bioavailability of<br />
iron and zinc in diets of differing compositions, it is<br />
not surprising that there are large differences in the<br />
adjustments employed to convert the physiological<br />
requirements <strong>for</strong> iron and zinc to yield <strong>dietary</strong> require-<br />
TABLE 6. Phytate:zinc molar ratios and proportion of energy<br />
from animal-source <strong>food</strong>s <strong>for</strong> selected countries, <strong>based</strong> on<br />
FAO <strong>food</strong>-balance sheet data<br />
Country<br />
Phytate:zinc<br />
molar ratio<br />
Energy from<br />
animal-source<br />
<strong>food</strong>s (%)<br />
Mongolia 3.5 45.3<br />
Egypt 27.5 7.0<br />
<strong>United</strong> Kingdom 8.6 31.6<br />
<strong>United</strong> States 10.6 27.8<br />
Armenia 12.8 16.3<br />
Cambodia 24.0 8.0<br />
Kenya 26.7 12.6<br />
Mexico 27.7 16.9<br />
Bangladesh 27.7 3.1<br />
Guatemala 36.3 8.6<br />
Malawi 37.3 2.7<br />
Source: data compiled from Hotz and Brown [36].
S94<br />
ments, even among countries where omnivorous diets<br />
are habitually consumed. For example, in UK mixed<br />
diets, iron is assumed to have a fixed bioavailability<br />
of 15%, irrespective of age and life-stage group [207],<br />
whereas in the <strong>United</strong> States and Canada, a factor of<br />
18% is used <strong>for</strong> the bioavailability of iron in the mixed<br />
diets of both children and nonpregnant adults, but 25%<br />
is used <strong>for</strong> women in the second and third trimesters<br />
of pregnancy and 10% <strong>for</strong> those consuming vegetarian<br />
diets [204]. Similarly, the <strong>United</strong> Kingdom uses a fixed<br />
factor of 30% <strong>for</strong> zinc, irrespective of age and life-stage<br />
group [207], but the <strong>United</strong> States and Canada apply<br />
a factor of 41% and 48% <strong>for</strong> the bioavailability of zinc<br />
from diets of adult (over 19 years) males and females,<br />
respectively, and 30% <strong>for</strong> preadolescent children [204].<br />
Australia and New Zealand have adopted the US and<br />
Canadian bioavailability adjustments <strong>for</strong> iron <strong>for</strong> children<br />
4 years of age or older, nonpregnant adults, and<br />
vegetarians, but the IZiNCG adjustments <strong>for</strong> zinc [36,<br />
208]. Other expert groups, such as FAO/WHO [181]<br />
and IZiNCG [36], employ several factors to adjust <strong>for</strong><br />
the bioavailability of iron and zinc, depending on the<br />
composition of the habitual diet, as noted earlier.<br />
References<br />
1. Hurrell R. Bioavailability—a time <strong>for</strong> reflection. Int J<br />
Vitam Nutr Res 2002;72:5–6.<br />
2. West CE, Eilander A, van Lieshout M. Consequences of<br />
revised estimates of carotenoid bioefficacy <strong>for</strong> <strong>dietary</strong><br />
control of vitamin A deficiency in developing countries.<br />
J Nutr 2002;132(9 suppl):2920S–6S.<br />
3. Cook JD, Dassenko SA, Lynch SR. Assessment of the<br />
role of nonheme-iron availability in iron balance. Am J<br />
Clin Nutr 1991;54:717–22.<br />
4. Tidehag P, Hallmans G, Wing K, Sjöström R, Ågren G,<br />
Lundin E, Zhang JX. A comparison of iron absorption<br />
from single meals and daily diets using radioFe ( 55 Fe,<br />
59 Fe). Br J Nutr 1996;75:281–9.<br />
5. Powers HJ. Riboflavin (vitamin B-2) and health. Am J<br />
Clin Nutr 2003;77:1352–60.<br />
6. Institute of Medicine. Dietary reference intakes <strong>for</strong><br />
thiamin, riboflavin, niacin, vitamin B 6 , folate, vitamin<br />
B 12 , pantothenic acid, biotin, and choline. Washington,<br />
DC: National Academy Press, 1998.<br />
7. Schaafsma G. Bioavailability of calcium and magnesium.<br />
Eur J Clin Nutr 1997;51(suppl 1):S13–6.<br />
8. Stoecker B. Chromium. In: Bowman BA, Russell RM,<br />
eds. Present knowledge in nutrition. Washington, DC:<br />
International Life Sciences Institute, 2001:366–72.<br />
9. Gregory JF 3rd. Bioavailability of vitamin B 6 . Eur J Clin<br />
Nutr 1997;51:S43–8.<br />
10. Harvey PW, Dexter PB, Darnton-Hill I. The impact of<br />
consuming iron from non-<strong>food</strong> sources on iron status<br />
in developing countries. Public Health Nutr 2000;3:<br />
375–83.<br />
11. Hallberg L. Bioavailability of <strong>dietary</strong> iron in man. Annu<br />
Rev Nutr 1981;1:123–47.<br />
12. Yip R. Iron. In: Bowman BA, Russell RM, eds. Present<br />
Conclusions<br />
R. S. Gibson<br />
Adjustments are needed to translate physiological<br />
requirements into <strong>dietary</strong> requirements <strong>for</strong> certain<br />
nutrients, notably calcium, magnesium, iron, zinc,<br />
protein, folate, and vitamin A. The magnitude of the<br />
adjustments depends on the nutrient and will vary<br />
according to the nature of the habitual diet and a<br />
variety of host-related factors. However, in<strong>for</strong>mation<br />
on some of the host-related factors, especially those<br />
that influence the efficiency of luminal and mucosal<br />
digestion and absorption, is often limited, so that their<br />
effects on nutrient bioavailability are often ignored<br />
when setting <strong>dietary</strong> requirement estimates. At present,<br />
several algorithms have been developed to predict the<br />
bioavailability of iron, zinc, protein, folate, vitamin A,<br />
and carotenoids, but there is still no consensus among<br />
countries about which are the best algorithms to use.<br />
In some countries, fixed bioavailability factors are still<br />
used <strong>for</strong> certain nutrients, even though their efficiency<br />
of absorption may vary with the <strong>dietary</strong> level of the<br />
nutrient or the life-stage group.<br />
knowledge in nutrition. Washington, DC: International<br />
Life Sciences Institute, 2001:311–28.<br />
13. Hurrell RF. Preventing iron deficiency through <strong>food</strong><br />
<strong>for</strong>tification. Nutr Rev 1997;55:210–22.<br />
14. Solomons NW, Jacob RA, Pineda O, Viteri FE. Studies<br />
on the bioavailability of zinc in man. II. Absorption of<br />
zinc from organic and inorganic sources. J Lab Clin Med<br />
1979;94:335–43.<br />
15. Moser-Veillon PB, Mangels AR, Patterson KY, Veillon C.<br />
Utilization of two different chemical <strong>for</strong>ms of selenium<br />
during lactation using stable isotope tracers: An example<br />
of speciation in nutrition. Analyst 1992;117:559–62.<br />
16. Yeum KJ, Russell RM. Carotenoid bioavailability and<br />
bioconversion. Annu Rev Nutr 2002;22:483–504.<br />
17. McNulty H, Pentieva K. Folate bioavailability. Proc Nutr<br />
Soc 2004;63:529–36.<br />
18. Melse-Boonstra A, Verhoef P, West C. Quantifying folate<br />
bioavailability: A critical appraisal of methods. Curr<br />
Opin Clin Nutr Metab Care 2004;7:539–45.<br />
19. Sauberlich HE, Kretsch MJ, Skala JH, Johnson HL,<br />
Taylor PC. Folate requirement and metabolism in nonpregnant<br />
women. Am J Clin Nutr 1987;46:1016–28.<br />
20. Pfeiffer CM, Rogers LM, Bailey LB, Gregory JF 3rd.<br />
Absorption of folate from <strong>for</strong>tified cereal-grain products<br />
and of supplemental folate consumed with or without<br />
<strong>food</strong> determined by using a dual-label stable-isotope<br />
protocol. Am J Clin Nutr 1997;66:1388–97.<br />
21. van den Berg H, van den Gaag M, Hendriks H. Influence<br />
of lifestyle on vitamin bioavailability. Int J Vitamin Nutr<br />
Res 2001; 72:53–9.<br />
22. Gregory JF 3rd. Bioavailability of thiamin. Eur J Clin<br />
Nutr 1997;51(suppl 1):S34–7.<br />
23. Castenmiller JJM, West CE. Bioavailability and biocon-
Diet- and host-related factors in nutrient bioavailability<br />
version of carotenoids. Annu Rev Nutr 1998;18:19–38.<br />
24. Bailey LB, Moyers S, Gregory JF 3rd. Folate. In: Bowman<br />
BA, Russell RM, eds. Present knowledge in nutrition.<br />
Washington, DC: International Life Sciences Institute,<br />
2001:214–29.<br />
25. van het Hof KH, Tijburg LBM, Pietrzik K, Weststrate JA.<br />
Influence of feeding different vegetables on plasma levels<br />
of carotenoids, folate and vitamin C. Effect of disruption<br />
of the vegetable matrix. Br J Nutr 1999;82:203–12.<br />
26. Sandström B. Bioavailability of zinc. Eur J Clin Nutr<br />
1997;51(suppl 1):S17–9.<br />
27. Fairweather-Tait S, Hurrell RF. Bioavailability of minerals<br />
and trace elements. Nutr Res Rev 1996;9:295–324.<br />
28. Manary MJ, Hotz C, Krebs NF, Gibson RS, Westcott<br />
JE, Broadhead RL, Hambidge KM. Zinc homeostasis in<br />
Malawian children consuming a high-phytate, maize<strong>based</strong><br />
diet. Am J Clin Nutr 2002;75:1057–61.<br />
29. Gibson RS. Zinc nutrition in developing countries. Nutr<br />
Res Rev 1994;7:151–73.<br />
30. Egli I, Davidsson L, Zeder C, Walczyk T, Hurrell R.<br />
Dephytinization of a complementary <strong>food</strong> <strong>based</strong> on<br />
wheat and soy increases zinc, but not copper, apparent<br />
absorption in adults. J Nutr 2004;134:1077–80.<br />
31. Morris ER, Ellis R. Bioavailability of <strong>dietary</strong> calcium. In:<br />
Kies C, ed. Nutritional bioavailabilty of calcium. Washington<br />
DC: American Chemical Society, 1985:63–72.<br />
32. Lönnerdal B, Sandberg AS, Sandstrom B, Kunz C. Inhibitory<br />
effects of phytic acid and other inositol phosphates<br />
on zinc and calcium absorption in suckling rats. J Nutr<br />
1989;119:211–4.<br />
33. Sandberg AS, Brune M, Carlsson NG, Hallberg L,<br />
Skoglund E, Rossander-Hulthen L. Inositol phosphates<br />
with different numbers of phosphate groups<br />
influence iron absorption in humans. Am J Clin Nutr<br />
1999;70:240–6.<br />
34. Brune ML, Rossander L, Hallberg L. No intestinal<br />
adaptation to a high-phytate diet. Am J Clin Nutr<br />
1989;49:542–5.<br />
35. Fordyce EJ, Forbes RM, Robbins KR, Erdman JW Jr.<br />
Phytate × calcium/zinc molar ratios: Are they predictive<br />
of zinc bioavailability? J Food Sci 1987;52:440–4.<br />
36. Hotz C, Brown KM, eds. Assessment of the risk of zinc<br />
deficiency in populations and options <strong>for</strong> its control.<br />
Food Nutr Bull 2004;25(suppl):S95–203.<br />
37. World Health Organization. Trace elements in human<br />
nutrition and health. Geneva: WHO, 1996.<br />
38. Hurrell RF. Phytic acid degradation as a means of<br />
improving iron absorption. Int J Vitam Nutr Res<br />
2004;74:445–52.<br />
39. Murray-Kolb LE, Welch R, Theil EC, Beard JL. Women<br />
with low iron stores absorb iron from soybeans. Am J<br />
Clin Nutr 2003;77:180–4.<br />
40. Bravo L. Polyphenols: Chemistry, <strong>dietary</strong> sources,<br />
metabolism, and nutritional significance. Nutr Rev 1998;<br />
56:317–33.<br />
41. Brune M, Rossander L, Hallberg L. Iron absorption and<br />
phenolic compounds: Importance of different phenolic<br />
structures. Eur J Clin Nutr 1989;43:547–57.<br />
42. Kies C, Umoren J. Inhibitors of copper bioutilization:<br />
Fiber, lead, phytate and tannins. Adv Exp Med Biol<br />
1989;258:81–93.<br />
43. Coudray C, Bousset C, Tressol JC, Pepin D, Rayssiguier<br />
Y. Short-term ingestion of chlorogenic or caffeic acids<br />
S95<br />
decreases zinc but not copper absorption in rats, utilization<br />
of stable isotopes and inductively-coupled plasma<br />
mass spectrometry technique. Br J Nutr 1998;80:575–<br />
84.<br />
44. Jansman AJM, Houdijk JGM, Verstegen MWA. Effect<br />
of condensed tannins in faba beans (Vicia faba L.) on<br />
the availability of minerals in pigs. In: Schlemmer U,<br />
ed. Bioavailability ’93: Nutritional, chemical and <strong>food</strong><br />
processing implications of nutrient availability. Karlsruhe,<br />
Germany: Federation of European Chemical<br />
Societies, 1993.<br />
45. Fraile AL, Flynn A. The absorption of manganese from<br />
polyphenol-containing beverages in suckling rats. Int J<br />
Food Sci Nutr 1992;43:163–8.<br />
46. Hurrell RF, Reddy MB, Juillerat M-A, Cook JD. Degradation<br />
of phytic acid in cereal porridges improves<br />
iron absorption by human subjects. Am J Clin Nutr<br />
2003;77:1213–9.<br />
47. Reddy MB, Cook JD. Assessment of <strong>dietary</strong> determinants<br />
of nonheme-iron absorption in humans and rats.<br />
Am J Clin Nutr 1991;54:723–8.<br />
48. Siegenberg D, Baynes RD, Bothwell TH, Marfarlane BJ,<br />
Lamparelli RD, Car NG, MacPhail P, Schmidt U, Tal A,<br />
Mayet F. Ascorbic acid prevents the dose-dependent<br />
inhibitory effects of polyphenols and phytates on nonheme<br />
iron absorption. Am J Clin Nutr 1991;53:537–41.<br />
49. Temme EHM, Van Hoydonck PGA. Tea consumption<br />
and iron status. Eur J Clin Nutr 2002;56:379–86.<br />
50. Fleming DJ, Jacques PF, Dallal GE, Tucker KL, Wilson<br />
PW, Wood RJ. Dietary determinants of iron stores in a<br />
free-living elderly population: The Framingham Heart<br />
Study. Am J Clin Nutr 1998;67:722–33.<br />
51. Merhav HY, Amitai Y, Palti H, Godfrey S. Tea drinking<br />
and microcytic anemia in infants. Am J Clin Nutr<br />
1985;41:1210–3.<br />
52. Dewey KG, Romero-Abal ME, Quan de Serrano J, Bulux<br />
J, Peerson JM, Engle P, Solomons N. Effects of discontinuing<br />
coffee intake on iron status of iron-deficient<br />
Guatemalan toddlers: A randomized intervention study.<br />
Am J Clin Nutr 1997;66:168–76.<br />
53. Bates CJ. Thiamin. In: Bowman BA, Russell RM, eds.<br />
Present knowledge in nutrition. Washington, DC: International<br />
Life Sciences Institute, 2001:184–90.<br />
54. Longstaff MA, McNab JM. The effect of concentration<br />
of tannin-rich bean hulls (Vicia faba L.) on activities of<br />
lipase (EC 3.1.1.3) and alpha-amylase (EC 3.2.1.1) in<br />
digesta and pancreas and on the digestion of lipid and<br />
starch by young chicks. Br J Nutr 1991;66:139–47.<br />
55. Jansman AJ, Enting H, Verstegen MWA, Huisman J.<br />
Effect of condensed tannins in hulls of faba beans (Vicia<br />
faba L.) on the activities of trypsin (EC 2.4.21.4) and<br />
chymotrypsin (EC 2.4.21.1) in digesta collected from<br />
the small intestine of pigs. Br J Nutr 1994;71:627–41.<br />
56. Quesada C, Bartolome B, Nieto O, Gomez Cordoves C,<br />
Hernandez T, Estrella I. Phenolic inhibitors of alphaamylase<br />
and trypsin enzymes by extracts from pears,<br />
lentils, and cocoa. J Food Protect 1996;59:185–92.<br />
57. Bravo L, Manas E, Saura-Calixto F. Dietary nonextractable<br />
condensed tannins as indigestible compounds:<br />
Effects on faecal weight, and protein and fat excretion.<br />
J Sci Food Agric 1993;63:63–8.<br />
58. Gallaher DD, Schneeman BO. Dietary fiber. In: Bowman<br />
BA, Russell RM, eds. Present knowledge in nutrition.
S96<br />
Washington, DC: International Life Sciences Institute,<br />
2001:83–91.<br />
59. Heaney RP, Weaver CM. Effect of psyllium on absorption<br />
of co-ingested calcium. J Am Geriatr Soc 1995;43:<br />
261–3.<br />
60. Rossander L, Sandberg A-S, Sandström B. The influence<br />
of <strong>dietary</strong> fibre on mineral absorption and utilisation. In:<br />
Schweizer TF, Edwards CS, eds. Dietary fibre—a component<br />
of <strong>food</strong>. London: Springer-Verlag, 1992:197–216.<br />
61. Turnlund JR, King JC, Gong B, Keyes WR, Michel MC.<br />
A stable isotope study of copper absorption in young<br />
men: Effect of phytate and α-cellulose. Am J Clin Nutr<br />
1985;42:18–23.<br />
62. Torre M, Rodriguez AR, Saura-Calixto F. Effects of<br />
<strong>dietary</strong> fiber and phytate on mineral availability. CRC<br />
Crit Rev Food Sci Nutr 1991;30:1–22.<br />
63. Kasper H. Effects of <strong>dietary</strong> fiber on vitamin metabolism.<br />
In: Spiller GA, ed. Dietary fiber in human nutrition.<br />
Boca Raton, Fla, USA: CRC Press, 1993:253–60.<br />
64. Gallaher DD, Schneeman BO. Intestinal interaction of<br />
bile acids, phospholipids, <strong>dietary</strong> fibers and cholesyramine.<br />
Am J Physiol 1986;250:G420–6.<br />
65. Batchelor AJ, Compston JE. Reduced plasma half-life of<br />
radio-labelled 25-hydroxyvitamin D 3 in subjects receiving<br />
a high-fibre diet. Br J Nutr 1983;49:213–6.<br />
66. Demigne C, Levrat MA, Younes H, Remesy C. Interactions<br />
between large intestine fermentation and <strong>dietary</strong><br />
calcium. Eur J Clin Nutr 1995;49(suppl 3):S235–8.<br />
67. Savage GP. Oxalates in human <strong>food</strong>s. Proc Nutr Soc New<br />
Zealand 2002;27:4–24.<br />
68. Ocke OL. Oxalic acid in plants and in nutrition. World<br />
Rev Nutr Diet 1969;10:262–303.<br />
69. Heaney RP, Weaver CM. Oxalate: Effect on calcium<br />
absorbability. Am J Clin Nutr 1989;50:830–2.<br />
70. Weaver CM, Proulx WR, Heaney R. Choices <strong>for</strong> achieving<br />
adequate <strong>dietary</strong> calcium with a vegetarian diet. Am<br />
J Clin Nutr 1999;70(3 suppl):543S–8S.<br />
71. Gillooly M, Bothwell TH, Torrance JD, MacPhail AP,<br />
Derman DP, Bezwoda WR, Mills W, Charlton RW,<br />
Mayet F. The effect of organic acids, phytates and<br />
polyphenols on the absorption of iron from vegetables.<br />
Br J Nutr 1983;49:331–42.<br />
72. Kelsay JL, Prather ES, Clark WM, Canary JJ. Mineral<br />
balances of men fed a diet containing fiber in fruits and<br />
vegetables and oxalic acid in spinach <strong>for</strong> six weeks. J<br />
Nutr 1988;118:1197–1204.<br />
73. Teucher B, Olivares M, Cori H. Enhancers of iron<br />
absorption: Ascorbic acid and other organic acids. Int J<br />
Vitam Nutr Res 2004;74:403–19.<br />
74. Offenbacher E. Promotion of chromium absorption by<br />
ascorbic acid. Trace Elem Elect 1994;11:178–81.<br />
75. Mutanen M, Mykkanen HM. Effect of ascorbic acid<br />
supplementation on selenium bioavailability in humans.<br />
Hum Nutr Clin Nutr 1985;39:221–6.<br />
76. Finley EB, Cerklewski FL. Influence of ascorbic acid<br />
supplementation on copper status in young adult men.<br />
Am J Clin Nutr 1983;37:553–6.<br />
77. Mangels AR, Block G, Frey CM, Patterson BH, Taylor<br />
PR, Norkus EP, Levander OA. The bioavailability to<br />
humans of ascorbic acid from oranges, orange juice and<br />
cooked broccoli is similar to that of synthetic ascorbic<br />
acid. J Nutr 1993;123:1054–61.<br />
78. Gibson RS, Yeudall F, Drost N, Mtitimuni B, Cullinan<br />
R. S. Gibson<br />
T. Dietary interventions to prevent zinc deficiency. Am<br />
J Clin Nutr 1998;68(suppl):484S–7S.<br />
79. Sandberg A-S. The effect of <strong>food</strong> processing on phytate<br />
hydrolysis and availability of iron and zinc. Adv Exp<br />
Med Biol 1991;289:499–508.<br />
80. Baynes RD, Macfarlane BJ, Bothwell TH, Siegenberg<br />
D, Bezwoda WR, Schmidt U, Lamparelli RD, Mayet<br />
F, MacPhail AP. The promotive effect of soy sauce on<br />
iron absorption in human subjects. Eur J Clin Nutr<br />
1990;44:419–24.<br />
81. Salovaara S, Sandberg AS, Andlid T. Organic acids<br />
influence iron uptake in the human epithelial cell line<br />
Caco-2. J Agric Food Chem 2002;50:6233–8.<br />
82. Hallberg L, Brune M, Rossander L. Effect of ascorbic<br />
acid on iron absorption from different types of meals.<br />
Studies with ascorbic-acid-rich <strong>food</strong>s and synthetic<br />
ascorbic acid given in different amounts with different<br />
meals. Hum Nutr Appl Nutr 1986;40:97–113.<br />
83. Bjorn-Rasmussen E, Hallberg L. Effect of animal proteins<br />
on the absorption of <strong>food</strong> iron in man. Nutr Metab<br />
1979;23:192–202.<br />
84. Jackson LS, Lee K. The effect of dairy products on iron<br />
availability. Crit Rev Food Sci Nutr 1992;31:259–70.<br />
85. Galan P, Yoon HC, Preziosi P, Viteri F, Valeix P, Fieux<br />
B, Briancon S, Malvy D, Roussel AM, Favier A, Hercberg<br />
S. Determining factors in the iron status of adult<br />
women in the SU.VI.MAX study. SUpplementation en<br />
VItamines et Mineraux AntioXydants. Eur J Clin Nutr<br />
1998;52:383–8.<br />
86. Doyle W, Crawley H, Robert H, Bates CJ. Iron deficiency<br />
in older people: Interactions between <strong>food</strong> and<br />
nutrient intakes with biochemical measures of iron:<br />
Further analysis of the National Diet and Nutrition<br />
Survey of people aged 65 years and older. Eur J Clin Nutr<br />
1999;53:552–9.<br />
87. Lönnerdal B. Dietary factors influencing zinc absorption.<br />
J Nutr 2000;130(5S suppl);1378S–83S.<br />
88. Turnlund JR, Swanson CA, King JC. Copper absorption<br />
and retention in pregnant women fed diets <strong>based</strong> on<br />
animal and plant proteins. J Nutr 1983;113:2346–52.<br />
89. Heaney RP. Dietary protein and phosphorus do not<br />
affect calcium absorption. Am J Clin Nutr 2000;72:<br />
758–61.<br />
90. Biesalski HK. Bioavailability of vitamin A. Eur J Clin<br />
Nutr 1997;51(suppl 1):S71–5.<br />
91. Cook JD, Monsen ER. Food iron absorption in human<br />
subjects. III. Comparison of the effect of animal proteins<br />
on nonheme iron absorption. Am J Clin Nutr<br />
1976;29:859–67.<br />
92. Jayarajan P, Reddy V, Mohanram M. Effect of <strong>dietary</strong><br />
fat on absorption of beta carotene from green leafy<br />
vegetables in children. Indian J Med Res 1980;71:53–6.<br />
93. Gibson RS, Yeudall F, Drost N, Mtitimuni BM, Cullinan<br />
TR. Experiences of a community-<strong>based</strong> <strong>dietary</strong> intervention<br />
to enhance micronutrient adequacy of diets<br />
low in animal source <strong>food</strong>s and high in phytate: A case<br />
study in rural Malawian children. J Nutr 2003;133(11<br />
suppl 2):3992S–9S.<br />
94. Sandström B, Davidsson L, Cederblad A, Lönnerdal B.<br />
Oral iron, <strong>dietary</strong> ligands and zinc absorption. J Nutr<br />
1985;115:411–4.<br />
95. Fischer PW, Giroux A, L’Abbe MR. Effect of zinc supplementation<br />
on copper status in adult man. Am J Clin
Diet- and host-related factors in nutrient bioavailability<br />
Nutr 1984;40:743–6.<br />
96. Yadrick MK, Kenney MA, Winterfeldt EA. Iron, copper,<br />
and zinc status: Response to supplementation with<br />
zinc or zinc and iron in adult females. Am J Clin Nutr<br />
1989;49:145–50.<br />
97. O’Brien KO, Zavaleta N, Caulfield LE, Wen J, Abrams<br />
SA. Prenatal iron supplements impair zinc absorption<br />
in pregnant Peruvian women. J Nutr 2000;130:2251–5.<br />
98. Troost FJ, Brummer RJ, Dainty JR, Hoogewerff JA, Bull<br />
VJ, Saris WH. Iron supplements inhibit zinc but not<br />
copper absorption in vivo in ileostomy subjects. Am J<br />
Clin Nutr 2003;78:1018–23.<br />
99. Dijkhuizen MA, Wieringa FT, West CE, Martuti S,<br />
Muhilal. Effects of iron and zinc supplementation in<br />
Indonesian infants on micronutrient status and growth.<br />
J Nutr 2001;131:2860–5.<br />
100. Lind T, Lönnerdal B, Stenlund H, Ismail D, Seswandhana<br />
R, Ekstrom EC, Persson LA. A community-<strong>based</strong><br />
randomized controlled trial of iron and zinc supplementation<br />
in Indonesian infants: Interactions between iron<br />
and zinc. Am J Clin Nutr 2003;77:883–90.<br />
101. Gunshin H, Mackenzie B, Berger UV, Gunshin Y,<br />
Romero MF, Boron WF, Nussberger S, Gollan JL,<br />
Hediger MA. Cloning and characterization of a mammalian<br />
proton-coupled metal-ion transporter. Nature<br />
1997;388:482–8.<br />
102. Hallberg L, Rossander-Hulten L, Brune M, Gleerup<br />
A. Calcium and iron absorption: Mechanism of action<br />
and nutritional importance. Eur J Clin Nutr 1992;46:<br />
317–27.<br />
103. Gleerup A, Rossander-Hulthen L, Gramatkovski E,<br />
Hallberg L. Iron absorption from the whole diet: Comparison<br />
of the effect of two different distributions of<br />
daily calcium intake. Am J Clin Nutr 1995;61:97–104.<br />
104. Ilich-Ernst JZ, McKenna AA, Badenhop NE, Clairmont<br />
AC, Andon MB, Nahhas RW, Goel P, Matkovic V. Iron<br />
status, menarche, and calcium supplementation in adolescent<br />
girls. Am J Clin Nutr 1998;68:880–7.<br />
105. Minihane AM, Fairweather-Tait SJ. Effect of calcium<br />
supplementation on daily nonheme-iron absorption and<br />
long-term iron status. Am J Clin Nutr 1998;68:96–102.<br />
106. Mølgaard C, Kaestel P, Michaelsen KF. Long-term calcium<br />
supplementation does not affect the iron status of<br />
12–14-y-old girls. Am J Clin Nutr 2005;82:98–102.<br />
107. van de Vijver LP, Kardinaal AF, Charzewska J, Rotily M,<br />
Charles P, Maggiolini M, Ando S, Vaananen K, Wajszczyk<br />
B, Heikkinen J, Deloraine A, Schaafsma G. Calcium<br />
intake is weakly but consistently negatively associated<br />
with iron status in girls and women in six European<br />
countries. J Nutr 1999;129:963–8.<br />
108. Erdman JW, Poneros-Schneier AG. Factors affecting<br />
nutritive value in processed <strong>food</strong>s. In: Shils ME, Olson<br />
JA, Shike M, eds. Nutrition in health and disease. Philadelphia,<br />
Pa, USA: Lea & Febiger, 1994;1569–78.<br />
109. Gaitan E. Goitrogens in <strong>food</strong> and water. Annu Rev Nutr<br />
1990;10:21–39.<br />
110. Hetzel BS. Iodine-deficiency disorders. In: Garrow JS,<br />
James WPT, eds. Human nutrition and dietetics. Vol 62.<br />
Edinburgh, UK: Churchill Livingstone, 1993:534–55.<br />
111. Miller DD. Effects of cooking and <strong>food</strong> processing on<br />
the content of bioavailable iron in <strong>food</strong>s. In: Micronutrient<br />
interactions: Impact on child health and<br />
nutrition. Washington, DC: International Life Sciences<br />
S97<br />
Institute Press, 1998:58–68. Available at: http://hni.<br />
ilsi.org/NR/rdonlyres/8A79C2B5-FE87-4D0E-A165-<br />
66E3CB42BE46/0/o4.pdf. Accessed 28 October 2006.<br />
112. Hurrell RF, Reddy MB, Burri J, Cook JD. Phytate degradation<br />
determines the effect of industrial processing<br />
and home cooking on iron absorption from cereal-<strong>based</strong><br />
<strong>food</strong>s. Br J Nutr 2002;88:117–23.<br />
113. Rock CL, Lovalvo JL, Emenhiser C, Ruffin MT, Flatt SW,<br />
Schwartz SJ. Bioavailability of beta-carotene is lower in<br />
raw than in processed carrots and spinach in women. J<br />
Nutr 1998;128:913–6.<br />
114. van het Hof KH, de Boer BCJ, Tijburg LBM, Lucius<br />
BRHM, Zijp I, West CE, Hautvast JGAJ, Weststrate<br />
JA. Carotenoid bioavailability in humans from tomatoes<br />
processed in different ways determined from the<br />
carotenoid response in the triglyceride-rich lipoprotein<br />
fraction of plasma after a single consumption<br />
and in plasma after four days of consumption. J Nutr<br />
2000;130:1189–96.<br />
115. Williams AW, Ewrdman JW Jr. Food processing: Nutrition,<br />
safety, and quality balances. In: Shils ME, Olson<br />
JA, Shike M, Ross AC, eds. Modern nutrition in health<br />
and disease, 8th ed. Baltimore, Md, USA: Williams &<br />
Wilkins, 1999:1813–21.<br />
116. Watzke HJ. Impact of processing on bioavailability:<br />
Examples of minerals in <strong>food</strong>s. Trend Food Sci Tech<br />
1998;9:320–7.<br />
117. O’Dell BL, de Bowland AR, Koirtyohann SR. Distribution<br />
of phytate and nutritionally important elements<br />
among the morphological components of cereal grains.<br />
J Agric Food Chem 1972;20:718–21.<br />
118. Egli I, Davidsson L, Juillerat M-A, Barclay D, Hurrell<br />
RF. The influence of soaking and germination on the<br />
phytase activity and phytic acid content of grains and<br />
seeds potentially useful <strong>for</strong> complementary feeding. J<br />
Food Sci 2002;67:3484–8.<br />
119. Cheryan M. Phytic acid interactions in <strong>food</strong> systems.<br />
Crit Rev Food Sci Nutr 1980;13:297–335.<br />
120. Egli I, Davidsson L, Juillerat M-A, Barclay D, Hurrell RF.<br />
Phytic acid degradation in complementary <strong>food</strong>s using<br />
phytases naturally occurring in whole grain cereals. J<br />
Food Sci 2003;68:1855–9.<br />
121. Camacho L, Sierra C, Campos R, Guzman E, Marcus<br />
D. Nutritional changes caused by germination of legumes<br />
commonly eaten in Chile. Arch Latinoam Nutr<br />
1992;42:283–90. (In Spanish)<br />
122. Marfo EK, Simpson BK, Idowu JS, Oke OL. Effect<br />
of local <strong>food</strong> processing on phytate levels in cassava,<br />
cocoyam, yam, maize, sorghum, rice, cowpea, and soybean.<br />
J Agric Food Chem 1990;38:1580–5.<br />
123. Svanberg U, Lorri W, Sandberg A-S. Lactic fermentation<br />
of non-tannin and high-tannin cereals: Effects<br />
on in vitro estimation of iron availability and phytate<br />
hydrolysis. J Food Sci 1993;58:408–12.<br />
124. Iqbal TH, Lewis KO, Cooper BT. Phytase activity in the<br />
human and rat small intestine. Gut 1994;35:1233–6.<br />
125. Mendoza C, Viteri FE, Lonnerdal B, Young KA, Raboy<br />
V, Brown KH. Effect of genetically modified, low-phytic<br />
acid maize on absorption of iron from tortillas. Am J<br />
Clin Nutr 1998;68:1123–7.<br />
126. Hambidge KM, Huffer JW, Raboy V, Grunwald GK,<br />
Westcott JL, Sian L, Miller LV, Dorsch JA, Krebs NF. Zinc<br />
absorption from low-phytate hybrids of maize and their
S98<br />
wild-type isohybrids. Am J Clin Nutr 2004;79:1053–9.<br />
127. Hambidge KM, Krebs NF, Westcott JL, Sian L, Miller<br />
LV, Peterson KL, Raboy V. Absorption of calcium from<br />
tortilla meals prepared from low-phtate maize. Am J<br />
Clin Nutr 2005;82:84–7.<br />
128. Nnam NM. Nitrogen and mineral utilization of young<br />
children fed blends of fermented or unfermented corn<br />
(Zea mays L) African yam bean (Spenostylis stenocarpa)<br />
and cowpea (Vigna unguiculata). Ecol Food Nutr<br />
1999;38:21–34.<br />
129. Ezeji C, Ojimelukwe PC. Effect of fermentation on the<br />
nutritional quality and functional properties of infant<br />
<strong>food</strong> <strong>for</strong>mulations prepared from bambarra-groundnut,<br />
fluted-pumpkin and millet seeds. Plant Foods Hum Nutr<br />
1993;44:267–76.<br />
130. de Boland AR, Garner GB, O’Dell BL. Identification<br />
and properties of “phytate” in cereal grains and oilseed<br />
products. J Agric Food Chem 1975;23:1186–9.<br />
131. Chang R, Schwimmer S, Burr HK. Phytate: Removal<br />
from whole dry beans by enzymatic hydrolysis and diffusion.<br />
J Food Sci 1977;42:1098–1101.<br />
132. Igbedioh S, Olugbemi KT, Akpapunam M. Effect of<br />
processing methods on phytic acid level and some<br />
constituents in bambara groundnut (Vigna subterranea)<br />
and pigeon pea (Cajanus cajan). Food Chem<br />
1994;50:147–51.<br />
133. Hotz C, Gibson RS. Assessment of home-<strong>based</strong> processing<br />
methods to reduce phytate content and phytate/zinc<br />
molar ratio of white maize (Zea mays). J Agric Food<br />
Chem 2001;49:692–8.<br />
134. Temple L, Gibson RS, Hotz C. Use of soaking and<br />
enrichment <strong>for</strong> improving the content and bioavailability<br />
of calcium iron, and zinc in complementary<br />
<strong>food</strong>s and diets of rural Malawian weanlings. J Food Sci<br />
2002;67:1926–32.<br />
135. Perlas L, Gibson RS. Use of soaking to enhance the<br />
bioavailability of iron and zinc from rice-<strong>based</strong> complementary<br />
<strong>food</strong>s used in the Philippines. J Sci Food Agric<br />
2002;82:1115–21.<br />
136. Matuschek E, Svanberg U. Enzymatic treatment of<br />
high-tannin sorghum increases the bioaccessibility of<br />
iron. Abstract Th37. 2004 International Nutritional<br />
Anemia Consulting Group (INACG) Symposium. Iron<br />
deficiency in early life: Challenges and progress, Lima,<br />
Peru, 2004.<br />
137. Fitzgerald SL, Gibson RS, Quan de Serrano J, Portocarrero<br />
L, Vasquez A, de Zepeda E, Lopez-Palacios CY,<br />
Thompson LU, Stephen AM, Solomons NW. Trace element<br />
intakes and <strong>dietary</strong> phytate/Zn and Ca × phytate/<br />
Zn millimolar ratios of periurban Guatemalan women<br />
during the third trimester of pregnancy. Am J Clin Nutr<br />
1993;57:195–201.<br />
138. Bender DA, Bender AE. Niacin and tryptophan metabolism:<br />
The biochemical basis of niacin requirements and<br />
recommendations. Nutr Abstr Rev Ser A 1986;56:695–<br />
719.<br />
139. Fidler MC, Davidsson L, Zeder C, Hurrell RF. Erythorbic<br />
acid is a potent enhance of nonheme-iron absorption.<br />
Am J Clin Nutr 2004;79:99–102.<br />
140. Clarkson TW. Environmental contaminants in the <strong>food</strong><br />
chain. Am J Clin Nutr 1995;61(3 suppl):682S–6S.<br />
141. Prasad AS, Halsted JA, Nadimi M. Syndrome of iron<br />
deficiency anemia, hepatosplenomegaly, hypogonadism,<br />
R. S. Gibson<br />
dwarfism and geophagia. Am J Med 1961;31:532–46.<br />
142. Prasad AS. Discovery of human zinc deficiency and<br />
studies in an experimental human model. Am J Clin<br />
Nutr 1991;53:403–12.<br />
143. Hooda PS, Henry CJ, Seyoum TA, Armstrong LD, Fowler<br />
MB. The potential impact of soil ingestion on human<br />
mineral nutrition. Sci Total Environ 2004;333:75–87.<br />
144. Adish AA, Esrey SA, Gyorkos TW, Jean-Batiste J,<br />
Rojhani A. Effect of consumption of <strong>food</strong> cooked in<br />
iron pots on iron status and growth of children: A randomised<br />
trial. Lancet 1999;353:712–6.<br />
145. Carmel R. Prevalence of undiagnosed pernicious anemia<br />
in the elderly. Arch Intern Med 1996;156:1097–1100.<br />
146. King CE, Leibach J, Toskes PP. Clinically significant vitamin<br />
B 12 deficiency secondary to malabsorption of protein-bound<br />
vitamin B 12 . Dig Dis Sci 1979;24:397–402.<br />
147. Tang G, Serfatry-Lacrosniere C, Camilo ME, Russell<br />
RM. Gastric acidity influences the blood response<br />
to a beta-carotene dose in humans. Am J Clin Nutr<br />
1996;64:622–6.<br />
148. Russell RM, Krasinski SD, Samloff IM, Jacob RA, Hartz<br />
SC, Brovender SR. Folic acid malabsorption in atrophic<br />
gastritis. Possible compensation by bacteria folate synthesis.<br />
Gastroenterology 1986;91:1476–82.<br />
149. Skikne BS, Lynch SR, Cook JD. Role of gastric acid in<br />
<strong>food</strong> iron absorption. Gastroenterology 1981;81:1068–71.<br />
150. Sturniolo GC, Montino MC, Rossetto L, Martin A,<br />
D’Inca R, D’Odorico A, Naccarato R. Inhibition of<br />
gastric acid secretion reduces zinc absorption in man. J<br />
Am Coll Nutr 1991;10:372–5.<br />
151. Russell RM. Factors in aging that affect the bioavailability<br />
of nutrients. J Nutr 2001;131(4 suppl):1359S–61S.<br />
152. Sarker SA, Davidsson L, Mahmud H, Walczyk T, Hurrell<br />
RF, Gyr N, Fuchs GJ. Helicobacter pylori infection, iron<br />
absorption, and gastric acid secretion in Bangladeshi<br />
children. Am J Clin Nutr 2004;80:149–53.<br />
153. Russell RM. The aging process as a modifier of metabolism.<br />
Am J Clin Nutr 2000;72(2 suppl):529S–32S.<br />
154. Bjarnson I, MacPherson A, Hollander D. Intestinal<br />
permeability: An overview. Gastroenterology<br />
1995;108:1566–81.<br />
155. Menzies IS, Zuckerman MJ, Nukajam WS, Somasundaram<br />
SG, Murphy B, Jenkins AP, Crane RS, Gregory GG.<br />
Geography of intestinal permeability and absorption.<br />
Gut 1999;44:483–9.<br />
156. Jalal F, Nesheim MC, Agus Z, Sanjur D, Habicht JP.<br />
Serum retinol concentrations in children are affected<br />
by <strong>food</strong> sources of beta-carotene, fat intake, and<br />
anthelmintic drug treatment. Am J Clin Nutr 1998;<br />
68:623–9.<br />
157. Halsted CH. Intestinal absorption of <strong>dietary</strong> folates. In:<br />
Picciano MF, Stokstad ELR, Gregory JF, eds. Folic acid<br />
metabolism in health and disease. New York: Wiley-Liss,<br />
1990:23–45.<br />
158. Brewster DR, Manary MJ, Menzies IS, O’Loughlin EV,<br />
Henry RL. Intestinal permeability in kwashiorkor. Arch<br />
Dis Child 1997;76:236–41.<br />
159. Jackson MJ. The assessment of bioavailability of micronutrients:<br />
Introduction. Eur J Clin Nutr 1997;51(suppl<br />
1):S1–2.<br />
160. Krebs NF. Bioavailability of <strong>dietary</strong> supplements and<br />
impact of physiologic state: Infants, children and adolescents.<br />
J Nutr 2001;131(4 suppl):1351S–4S.
Diet- and host-related factors in nutrient bioavailability<br />
161. Ebeling PR, Sandgren ME, DiMagno EP, Lane AW,<br />
DeLuca HF, Riggs BL. Evidence of an age-related<br />
decrease in intestinal responsiveness to vitamin D: Relationship<br />
between serum 1,25-dihydroxyvitamin D 3 and<br />
intestinal vitamin D receptor concentrations in normal<br />
women. J Clin Endocrinol Metab 1992;75:176–82.<br />
162. Webb AR, Pilbeam C, Hanafin N, Holick MF. An<br />
evaluation of the relative contributions of exposure to<br />
sunlight and of diet to the circulating concentrations of<br />
25-hydroxyvitamin D in an elderly nursing home population<br />
in Boston. Am J Clin Nutr 1990;51:1075–81.<br />
163. Ribaya-Mercado JD, Otradovec CL, Russell RM, Samloff<br />
IM. Atrophic gastritis does not impair vitamin B 6 status<br />
in the elderly. Gastroenterology 1987;93:222.<br />
164. Krasinski SD, Russell RM, Dallal GE. Aging changes<br />
vitamin A absorption characteristics. Gastroenterology<br />
1985;88:1715.<br />
165. Krasinski SD, Cohn JS, Schaefer EJ, Russell RM. Postprandial<br />
plasma retinyl ester response is greater in older<br />
subjects compared with younger subjects. Evidence <strong>for</strong><br />
delayed plasma clearance of intestinal lipoproteins. J<br />
Clin Invest 1990;85:883–92.<br />
166. Sokoll LJ, Russell RM, Sadowski JA, Morrow FD. Establishment<br />
of creatinine clearance reference values <strong>for</strong><br />
older women. Clin Chem 1994;40:2276–81.<br />
167. King JC. Effect of reproduction on the bioavailability<br />
of calcium, zinc, and selenium. J Nutr 2001;131:<br />
1355S–8S.<br />
168. Barrett JF, Whittaker PG, Williams JG, Lind T. Absorption<br />
of non-haem iron from <strong>food</strong> during normal pregnancy.<br />
Br Med J 1994;309:79–82.<br />
169. Bronner F, Abrams SA. Development and regulation<br />
of calcium metabolism in healthy girls. J Nutr<br />
1998;128:1474–80.<br />
170. Kung AW, Luk KD, Chu LW, Chiu PK. Age-related<br />
osteoporosis in Chinese: An evaluation of the response<br />
of intestinal calcium absorption and calcitropic hormones<br />
to <strong>dietary</strong> calcium deprivation. Am J Clin Nutr<br />
1998;68:1291–7.<br />
171. Weaver CM. Calcium requirements: The need to<br />
understand racial differences. Am J Clin Nutr 1998;68:<br />
1153–4.<br />
172. Parker RS. Bioavailability of carotenoids. Eur J Clin Nutr<br />
1997;51(suppl 1):S86–90.<br />
173. Fraser DR. The physiological economy of vitamin D.<br />
Lancet 1983;1:969–72.<br />
174. Thompson SY. Role of carotene and vitamin A in animal<br />
feeding. World Rev Nutr Diet 1975;21:224–80.<br />
175. van Vliet T, van Vlissingen MF, van Schaik F, van den<br />
berg H. Beta-carotene absorption and cleavage in rats<br />
is affected by the vitamin A concentrations of the diet.<br />
J Nutr 1996;126:499–508.<br />
176. Scrimshaw NS, Taylor CE, Gordon JE. Interactions of<br />
nutrition and infection. WHO Technical Report Series,<br />
No. 57. Geneva: WHO, 1968.<br />
177. Costello AM, Osrin D. Micronutrient status during<br />
pregnancy and outcomes <strong>for</strong> newborn infants in developing<br />
countries. J Nutr 2003;133:1757S–64S.<br />
178. Garza C. Effect of infection on energy requirements of<br />
infants and children. Public Hlth Nutr 2005;8:1187–<br />
90.<br />
179. Powanda MC, Beisel WR. Metabolic effects of infection<br />
on protein and energy status. J Nutr 2003;133:322S–7S.<br />
S99<br />
180. Joint World Health Organization/Food and Agriculture<br />
Organization (FAO/UNU) Expert Consultation. Protein<br />
and amino acid requirements in human nutrition. WHO<br />
Technical Report Series, Geneva: WHO.<br />
181. Joint Food and Agriculture Organization/<strong>United</strong><br />
<strong>Nations</strong> University/World Health Organization (FAO/<br />
UNU/WHO) Expert Consultation. Human energy<br />
requirements. Rome: FAO Technical Report Series 1,<br />
2005.<br />
182. Joint Food and Agriculture Organization/World Health<br />
Organization (FAO/WHO) Expert Consultation.<br />
Human vitamin and mineral requirements. Rome: FAO<br />
Technical Report Series, 1998.<br />
183. Jackson NC, Carroll PV, Russell-Jones DL, Sonksen PH,<br />
Treacher DF, Umpleby AM. The metabolic consequences<br />
of critical illness: Acute effects on glutamine and protein<br />
metabolism. Am J Physiol 1999;276:E163–E70.<br />
184. Bagga A, Tripathi P, Jatana V, Hari P, Kapil A, Srivastava<br />
RN, Bahn MK. Bacteriuria and urinary tract infections<br />
in malnourished children. Pediatr Nephrol 2003;18:366–<br />
70.<br />
185. Hesham MS, Edariah AB, Norhayati, M. Intestinal parasitic<br />
infections and micronutrient deficiency: A review.<br />
Med J Malaysia. 2004;59:284–93.<br />
186. Cunningham-Rundles S, McNeely DF, Moon A. Mechanisms<br />
of nutrient modulation of the immune response.<br />
J Allergy Clin Immunol 2005; 1119–28.<br />
187. Bogden JD, Kemp FW, Han S, Li W, Bruening K, Denny<br />
T, Oleske JM, Lloyd J, Baker H, Perez G, Kloser P,<br />
Skumick J, Louria DB. Status of selected nutrients and<br />
progression of human immunodeficiency virus type 1<br />
infection. Am J Clin Nutr 2000;72:809–15.<br />
188. Hoolihan LE. Individualization of nutrition recommendations<br />
and <strong>food</strong> choices. Nutr Today 2003;38:225–31.<br />
189. Reddy MB, Hurrell RF, Cook JD. Estimation of nonheme-iron<br />
bioavailability from meal composition. Am<br />
J Clin Nutr 2000;71:937–43.<br />
190. Monsen ER, Hallberg L, Layrisse M, Hegsted DM, Cook<br />
JD, Mertz W, Finch CA. Estimation of available <strong>dietary</strong><br />
iron. Am J Clin Nutr 1978;31:134–41.<br />
191. Monsen ER, Balintfy JL. Calculating <strong>dietary</strong> iron bioavailability:<br />
Refinement and computerization. J Am Diet<br />
Assoc 1982;80:307–11.<br />
192. Food and Agriculture Organization/World Health<br />
Organization. Requirements of vitamin A, iron, folate<br />
and vitamin B-12. Rome: FAO, 1988.<br />
193. Murphy SP, Beaton GH, Calloway DH. Estimated<br />
mineral intakes of toddlers: Predicted prevalence of<br />
inadequacy in village populations in Egypt, Kenya, and<br />
Mexico. Am J Clin Nutr 1992;56:565–72.<br />
194. Tseng M, Chakraborty H, Robinson DT, Mendez M,<br />
Kohlmeier L. Adjustment of iron intake <strong>for</strong> <strong>dietary</strong><br />
enhancers and inhibitors in population studies: Bioavailable<br />
iron in rural and urban residing Russian women<br />
and children. J Nutr 1997;127:1456–68.<br />
195. Du S, Zhai F, Wang Y, Popkin BM. Current methods <strong>for</strong><br />
estimating <strong>dietary</strong> iron bioavailability do not work in<br />
China. J Nutr 2000;130:193–8.<br />
196. Hallberg L, Hulthén L. Prediction of <strong>dietary</strong> iron<br />
absorption: An algorithm <strong>for</strong> calculating absorption<br />
and bioavailability of <strong>dietary</strong> iron. Am J Clin Nutr<br />
2000;71:1147–60.<br />
197. Navert B, Sandstrom B, Cederblad A. Reduction of the
S100<br />
phytate content of bran by leavening in bread and its effect<br />
on zinc absorption in man. Br J Nutr 1985;53:47–53.<br />
198. Oberleas D, Harland BF. Phytate content of <strong>food</strong>s:<br />
Effect on <strong>dietary</strong> zinc bioavailability. J Am Diet Assoc<br />
1981;79:433–6.<br />
199. Food and Agriculture Organization/World Health<br />
Organization/<strong>United</strong> <strong>Nations</strong> University. Energy and<br />
protein requirements. Report of a joint FAO/WHO/<br />
UNU Expert Consultation. World Health Organ Tech<br />
Rep Ser 1985;724:1–206.<br />
200. Food and Agriculture Organization/World Health<br />
Organization. Protein quality evaluation. FAO Food<br />
Nutr Pap 1991;51:1–66.<br />
201. Schaafsma G. The protein digestibility-corrected amino<br />
acid score. J Nutr 2000;130:1865S–7S.<br />
202. Lewis CJ, Crane NT, Wilson DB, Yetley EA. Estimated<br />
folate intakes: Data updated to reflect <strong>food</strong> <strong>for</strong>tification,<br />
increased bioavailability, and <strong>dietary</strong> supplement use.<br />
Am J Clin Nutr 1999;70:198–207.<br />
203. West CE. Meeting requirements <strong>for</strong> vitamin A. Nutr Rev<br />
2000;58:341–5.<br />
R. S. Gibson<br />
204. Institute of Medicine. Dietary reference intakes <strong>for</strong> vitamin<br />
A, vitamin K, arsenic, boron, chromium, copper,<br />
iodine, iron, manganese, molybdenum, nickel, silicon,<br />
vanadium and zinc. Washington, DC: National Academy<br />
Press, 2001.<br />
205. International Vitamin A Consultative Group. Conversion<br />
factors <strong>for</strong> vitamin A and carotenoids. Washington,<br />
DC: International Life Sciences Institute Press, 2002.<br />
206. Food and Agriculture Organization/World Health<br />
Organization. Food balance sheets: a handbook. Rome:<br />
FAO, 2001.<br />
207. Committee on Medical Aspects of Food Policy. Dietary<br />
reference values <strong>for</strong> <strong>food</strong> energy and nutrients <strong>for</strong> the<br />
<strong>United</strong> Kingdom. Report of the panel on <strong>dietary</strong> reference<br />
values. Report of Health and Social Subjects No.<br />
41. London: Her Majesty’s Stationery Office, 1991.<br />
208. Department of Health and Ageing, Australian Government.<br />
Nutrient reference values <strong>for</strong> Australia and New<br />
Zealand. Executive summary. Canberra. National Health<br />
and Medical Research Council, 2006.
Human nutrition and genetic variation<br />
Patrick J. Stover<br />
Abstract<br />
Human genetic variation is a determinant of nutrient<br />
efficacy and of tolerances and intolerances and has the<br />
potential to influence nutrient intake values (NIVs).<br />
Knowledge derived from the comprehensive identification<br />
of human genetic variation offers the potential to<br />
predict the physiological and pathological consequences<br />
of individual genetic differences and prevent and/or<br />
manage adverse outcomes through diet. Nutrients and<br />
genomes interact reciprocally; genomes confer differences<br />
in nutrient utilization, whereas nutrients effectively<br />
modify genome expression, stability, and viability.<br />
Understanding the interactions that occur among human<br />
genes, including all genetic variants thereof, and environmental<br />
exposures is enabling the development of genotype-specific<br />
nutritional regimens that prevent disease<br />
and promote wellness <strong>for</strong> individuals and populations<br />
throughout the life cycle. Genomic technologies may provide<br />
new criteria <strong>for</strong> establishing NIVs. The impact of a<br />
gene variant on NIVs will be dependent on its penetrance<br />
and prevalence within a population. Recent experiences<br />
indicate that few gene variants are anticipated to be sufficiently<br />
penetrant to affect average requirement (AR)<br />
values to a greater degree than environmental factors. If<br />
highly penetrant gene variants are identified that affect<br />
nutrient requirements, the prevalence of the variant in<br />
that country or region will determine the feasibility and<br />
necessity of deriving more than one AR or upper limit<br />
(UL) <strong>for</strong> affected genetic subgroups.<br />
Key words: Genome, nutrients, nutrition, polymorphism,<br />
requirements, variation<br />
The author is affiliated with Cornell University, Ithaca,<br />
New York, USA.<br />
Please direct queries to the author: Patrick J. Stover, Cornell<br />
University, Division of Nutritional Sciences, 315 Savage<br />
Hall, Ithaca, NY 14853, USA; e-mail: pjs13@cornell.edu.<br />
Introduction<br />
Knowledge derived from the comprehensive identification<br />
of human genetic variation offers the potential<br />
to predict, prevent, and/or manage physiological and<br />
pathological consequences of individual genetic differences.<br />
Genetic variation contributes to human disease<br />
susceptibility, optimal nutritional requirements, <strong>food</strong><br />
tolerance, drug efficacy, inflammatory responses, longevity,<br />
and virtually every human phenotype [1–8].<br />
Nutrients and pharmaceuticals are two exposures that<br />
are proven to be effective in modifying genome function<br />
and stability <strong>for</strong> benefit, but whose utilization and<br />
efficacy are modified by human genetic variation.<br />
Dietary <strong>guidelines</strong>, both <strong>food</strong>- and nutrient-<strong>based</strong>,<br />
are established to assist individuals and populations<br />
achieve adequate <strong>dietary</strong> patterns to maintain health.<br />
Their derivation and goals evolve continuously in<br />
response to new knowledge [9, 10]. When possible,<br />
<strong>guidelines</strong> <strong>for</strong> single nutrients and other <strong>food</strong> components<br />
are scientifically and quantitatively derived,<br />
and these numeric standards are essential to validate<br />
the efficacy of <strong>food</strong>-<strong>based</strong> <strong>guidelines</strong> [10]. Nutrient<br />
requirements vary within all human populations and<br />
can be modified by age, sex, and life stage, among other<br />
factors. There<strong>for</strong>e, numeric standards are often derived<br />
separately <strong>for</strong> population subgroups. It is established<br />
that genetic variation can modify the efficacy, dosage,<br />
and safety of pharmaceutical agents [5] and tolerance<br />
<strong>for</strong> certain <strong>food</strong>s [11]. However, the contribution of<br />
genetics to optimal nutrient requirements within and<br />
among human populations remains to be evaluated<br />
rigorously. This report focuses on advancements in our<br />
understanding of the human genome and the emerging<br />
application of the genome sciences to identify genetic<br />
variation that affects optimal nutrient requirements<br />
and <strong>food</strong> tolerance within and among populations,<br />
understand the role of nutrients and <strong>dietary</strong> components<br />
in modifying genome function <strong>for</strong> benefit and<br />
the intake levels required to do so, understand both<br />
the benefits and the risks of population-<strong>based</strong> nutrition<br />
policies to subgroups, and develop genome-<strong>based</strong><br />
Food and Nutrition Bulletin, vol. 28, no. 1 (supplement) © 2007, The <strong>United</strong> <strong>Nations</strong> University. S101
S102<br />
outcomes <strong>for</strong> assessing nutrient adequacy and risk <strong>for</strong><br />
disease prevention.<br />
Human genetic variation<br />
The primary sequence of the human genome was determined<br />
from 5 to 10 individuals of diverse ancestry and<br />
geographic history. The human genome is composed of<br />
approximately 3.1 billion nucleotide base pairs that are<br />
organized into 24 nuclear chromosomes [12]. There are<br />
an estimated 30,000 genes within the human genome<br />
that encode in<strong>for</strong>mation required <strong>for</strong> the synthesis of<br />
all cellular proteins and functional RNA molecules,<br />
although less than half of human genes have been<br />
assigned known or putative functions. Only about 2%<br />
of the total human DNA primary sequence encodes<br />
genes. Most nuclear DNA is termed noncoding and has<br />
structural or regulatory roles or no known roles. The<br />
biological complexity of the mammalian cell is not limited<br />
by the number of genes encoded by its genome. A<br />
single gene can encode more than one RNA or protein<br />
product through posttranscriptional and posttranslational<br />
processing reactions, including RNA editing,<br />
alternative splicing, and other modifications including<br />
differential phosphorylation or methylation. There<strong>for</strong>e,<br />
human cells contain more than 100,000 proteins with<br />
distinct primary sequences as a result of these processing<br />
and modification reactions [13].<br />
The primary nucleotide sequence of the human<br />
genome varies by approximately 0.2% to 0.4% among<br />
humans [14, 15]. Sequence variations are referred to<br />
as polymorphism and constitute a primary molecular<br />
basis <strong>for</strong> human phenotypic variation. There are<br />
several distinct classes of polymorphism, including<br />
single nucleotide polymorphisms (SNPs), micro- and<br />
macrosatellite repeat sequences, and viral insertions.<br />
SNPs are defined as common nucleotide base pair differences<br />
in the primary sequence of DNA and are the<br />
most common variation in human DNA.<br />
SNPs and haplotypes<br />
There are estimated to be more than 10 million SNPs<br />
in the human genome; over 4.5 million SNPs were<br />
validated as of 2004 [15]. SNPs can be single base pair<br />
insertions, deletions, or substitutions of one base pair<br />
<strong>for</strong> another. Nucleotide substitutions are the most<br />
common polymorphisms, whereas insertion/deletion<br />
mutations occur at 1/10 the frequency [16]. SNPs differ<br />
from DNA mutations in two regards: they are present<br />
in the germ line and there<strong>for</strong>e are heritable, and they<br />
must have a prevalence of at least 1% in humans. The<br />
generation of high-density SNP maps of the human<br />
genome facilitates the identification of human disease<br />
alleles, including low-penetrant alleles that may make<br />
relatively small contributions to the initiation and/or<br />
progression of complex disease [12].<br />
DNA sequence is inherited in “blocks” that average<br />
25,000 base pairs during meiotic recombination [13].<br />
There<strong>for</strong>e, SNPs that are physically close with respect<br />
to DNA primary sequence segregate rarely and are<br />
inherited together [13, 17]. SNPs captured within these<br />
blocks are said to be in linkage disequilibrium, which<br />
is defined as the nonrandom association of alleles<br />
at a nearby locus. Linkage disequilibrium is usually<br />
correlated with physical distance between loci but is<br />
also influenced by distance from the centromere and<br />
recombination frequency, which can vary throughout<br />
the genome. Inherited blocks of genetic variation are<br />
referred to as haplotypes, and the size of the haplotype<br />
blocks decays as the number of meiotic recombination<br />
events increases within a population. Ancestral<br />
populations that maintain a high effective population<br />
size <strong>for</strong> long periods are expected to have smaller haplotype<br />
sizes and there<strong>for</strong>e decreased linkage disequilibrium<br />
because of the increased number of historical<br />
recombination and mutation events, both of which<br />
cause linkage disequilibrium decay [12]. As predicted<br />
from evolutionary theory, African populations display<br />
higher levels of genetic diversity than all other human<br />
populations whose founder groups probably exhibited<br />
less genetic variation than the population from which<br />
they emerged and had less time to respond to their<br />
new environments. African linkage disequilibrium patterns<br />
exhibit a greater number of haplotypes and more<br />
divergent patterns of linkage disequilibrium than non-<br />
African populations [12]. Linkage disequilibrium in the<br />
Nigerian population extends an average distance of 5<br />
kilobases, whereas European linkage disequilibrium<br />
can extend nearly 60 kilobases, a finding consistent<br />
with the increased number of recombination events<br />
that have occurred in ancestral populations [12]. Haplotype<br />
maps of human genetic variation offer advantages<br />
<strong>for</strong> disease associational studies because of their<br />
reduced complexity compared with SNP maps [18], but<br />
their utility may be limited because of the variability<br />
in haplotype diversity across candidate genes [19].<br />
Furthermore, haplotype associations do not identify<br />
disease-causing mutations due to genetic hitchhiking<br />
[12] (polymorphisms that are in linkage disequilibrium<br />
with a mutation that is under selection will change in<br />
frequency along with the site undergoing selection).<br />
Because otherwise rare disease alleles can be enriched<br />
in geographically or culturally isolated populations,<br />
full characterization of SNP diversity and haplotype<br />
structure from ethnically diverse populations is critical<br />
<strong>for</strong> the identification of risk alleles that may be specific<br />
to small but identifiable subpopulations.<br />
Transposable elements<br />
P. J. Stover<br />
Genetic variation can also result from the integration<br />
and/or transposition of viral DNA. Approximately half
Human nutrition and genetic variation<br />
of noncoding human DNA originates from the insertion<br />
of highly mobile and repetitive sequences termed<br />
transposable elements. There are two types of transposable<br />
elements, retrotransposons and DNA transposons<br />
[20–22]. Retrotransposons are classified by size and<br />
include long interspersed nuclear elements (LINEs)<br />
and short interspersed nuclear elements (SINEs).<br />
About 10% of the human genomic sequence consists of<br />
280 base pair Alu SINE elements; there are an estimated<br />
1.4 million in the human genome. Alu elements display<br />
promoter activity, but their transcripts lack an open<br />
reading frame and there<strong>for</strong>e are not translated. Alu<br />
elements are rich in the dinucleotide sequence CpG,<br />
which is also common in promoter regions of mammalian<br />
genes and is recognized by DNA methylases<br />
that convert CpG sequences to me CpG. Methylation of<br />
CpG sequences within Alu elements usually silences<br />
their promoter activity. Transposable elements are<br />
mutagenic; they can integrate within and disrupt a<br />
gene and can also serve as nucleation sites <strong>for</strong> unequal<br />
intrachromosomal and interchromosomal homologous<br />
recombination events that lead to chromosomal aberrations,<br />
including deletion and translocation events.<br />
New Alu insertions have been associated with 0.1% of<br />
human genetic disorders, including Apert syndrome,<br />
cholinesterase deficiency, and breast cancer. Other<br />
inherited disorders, including type 2 insulin-resistant<br />
diabetes and familial hypercholesterolemia, comprise<br />
part of the 0.3% of human genetic disease that results<br />
from Alu-mediated unequal homologous recombination<br />
events [12, 22]. Such events are rare, because<br />
Alu-mediated unequal homologous recombination<br />
events are usually inhibited by CpG methylation of<br />
the insertion.<br />
Human populations are polymorphic <strong>for</strong> viral insertions<br />
[12]. More than 1,200 Alu elements integrated<br />
into the human genome following early human migrations;<br />
a new Alu insertion event occurs every 200 births<br />
[22]. Alu element insertions can alter gene function<br />
and stability around their region of integration and are<br />
thought to be catalysts <strong>for</strong> organismal evolution [22,<br />
23]. Transposition events that occur near or within<br />
a gene can alter its expression or create a new gene.<br />
Alu elements can function as transcriptional silencers<br />
or activators; some Alu elements have retinoic acid<br />
response elements and there<strong>for</strong>e can confer new types<br />
of transcriptional regulation to genes neighboring<br />
the insertion site. Alu insertions near gene promoters<br />
can also confer transcriptional regulation by DNA<br />
methylation to that locus because they contain CpG<br />
sequences. The degree of transcriptional silencing<br />
is modifiable by diet [24]. For example, embryonic<br />
CpG methylation density can vary proportionately<br />
with folate status at defined loci during development<br />
[25, 26]. Maternal folate and other methyl donor supplementation<br />
alters the methylation status of targeted<br />
alleles in the mouse embryo, and these methylation<br />
S103<br />
patterns and subsequent effects on gene expression are<br />
retained throughout adulthood [24]. This type of epigenetic<br />
phenomenon may provide mechanistic insight<br />
into the many observational studies that associate risks<br />
of adult chronic diseases with maternal nutrition and<br />
embryonic nutrient exposures [27].<br />
Nutrition and the origin of human genetic<br />
variation<br />
Organismal evolution is driven in part by complex and<br />
reciprocal interactions among genomes and environmental<br />
exposures that result in adaptive phenotypes.<br />
Modern human genetic variation is, in part, a product<br />
of such historical interactions and is manifest through<br />
the <strong>for</strong>mation and propagation of primary sequence differences<br />
in DNA. Changes in DNA primary sequence<br />
constitute the molecular basis <strong>for</strong> human evolution and<br />
<strong>for</strong> the generation of adaptive genes that alter an organism’s<br />
response to environmental challenges and hence<br />
to its fitness. Genomic polymorphism arises through<br />
the sequential processes of genetic mutation, followed<br />
by expansion of the mutation within a population;<br />
environment influences both of these processes.<br />
Mutation<br />
Mutation is a consequence of the inherent chemical<br />
instability of DNA bases, stochastic error associated<br />
with DNA replication and recombination, and exposure<br />
to chemical radicals generated during oxidative<br />
metabolism as well as by environmental toxins. There<strong>for</strong>e,<br />
a significant portion of mutations are not modifiable,<br />
although DNA repair systems detect and correct<br />
most mutation events. Environmental exposures and<br />
cellular oxidative stress can accelerate DNA mutation<br />
rates by inducing DNA modification reactions<br />
and/or accelerating DNA polymerase error rates. For<br />
example, nutrient deficiencies of iron or B vitamins<br />
impair nucleotide biosynthesis and thereby enhance<br />
polymerase error rates. Folate deficiency inhibits<br />
dTMP synthesis, which increases the incorporation of<br />
dUTP into DNA, resulting in increased rates of single<br />
point mutations as well as increased frequency of DNA<br />
strand breaks [28–32]. Mutation rates are also accelerated<br />
by radiation, cellular oxidative stress, and natural<br />
and synthetic genotoxic xenobiotics that are present in<br />
the <strong>food</strong> supply. Certain aflatoxins, a common class of<br />
natural xenobiotics, increase DNA mutation rates, leading<br />
to the trans<strong>for</strong>mation of somatic cells and localized<br />
cancer epidemics [33]. Furthermore, deficiencies of<br />
<strong>dietary</strong> antioxidants that scavenge chemical radicals,<br />
or excesses of prooxidant nutrients, including iron,<br />
may increase mutation rates [34–36]. However, only<br />
mutations that occur in the germ line contribute to a<br />
species’ heritable genetic variation.
S104<br />
DNA mutation rates and polymorphism frequencies<br />
vary throughout the human genome. These differences<br />
have been attributed to the region-specific<br />
differences in DNA recombination rates (sites of more<br />
frequent recombination may exhibit elevated mutation<br />
rates), the mutagenic potential of specific nucleotide<br />
sequences, and local chromatin structure [12, 37].<br />
For example, the sequence CpG is underrepresented<br />
in the human genome and its frequency has decayed<br />
throughout evolution because of its inherent instability<br />
[38]. Methylation of CpG sequences increases mutation<br />
rates, because methylcytosine ( me C) deaminates<br />
spontaneously to thymidine (T), whereas cytosine (C)<br />
deaminates to uracil (U), which is recognized as <strong>for</strong>eign<br />
to DNA and excised by the DNA repair enzymes [16].<br />
Selection<br />
Mutation of the germ line is necessary but not sufficient<br />
<strong>for</strong> the creation of genetic variation. Germ line mutation<br />
that does not affect or confer function is assumed<br />
to be both phenotypically silent and selectively neutral,<br />
and there<strong>for</strong>e its frequency is exclusively a function<br />
of the DNA mutation rate (estimated to be 2.5 × 10 –8<br />
on average <strong>for</strong> autosomes in regions of the genome<br />
presumed to be nonfunctional, including intronic<br />
and intergenic regions) [12, 16]. Only mutations that<br />
expand and become fixed within a population contribute<br />
to human genetic variation. Mutations that<br />
become fixed within a population contribute to genetic<br />
variation as polymorphisms, and this expansion is the<br />
basis <strong>for</strong> the molecular evolution of genomes. Fixation<br />
is a function of effective population size, population<br />
demographic history, and the effect of the mutation<br />
on an organism’s fitness [12]. Polymorphisms expand<br />
within a population through the processes of genetic<br />
drift and natural selection. Drift is a stochastic process<br />
that results from random assortment of chromosomes<br />
at meiosis, because only a fraction of all possible<br />
zygotes are generated or survive to reproduce [12].<br />
There<strong>for</strong>e, mutations can expand from one generation<br />
to the next through the random sampling of gametes<br />
in the absence of selection. Drift generally has a<br />
greater impact on allele frequencies in small populations<br />
that are expanding rapidly. Drift in static large<br />
populations is not usually as significant because of the<br />
greater dilutional effect of such populations. Genetic<br />
drift can have a greater than expected impact in large<br />
populations when they undergo bottlenecks (massive<br />
reductions in population) or founding events that have<br />
occurred during human migrations, e.g., in population<br />
groups that include the Old Order Amish, Hutterite,<br />
and Ashkenazi Jewish [12]. In these populations, rare<br />
disease alleles can expand rapidly and increase the<br />
incidence of disease, including breast cancer, Tay-<br />
Sachs, Gaucher, Niemann-Pick, and familial hyper-<br />
P. J. Stover<br />
cholesterolemia [12]. It is assumed that the majority of<br />
human genetic variation arose as a result of the neutral<br />
processes of mutation and genetic drift and rarely has<br />
physiological consequences.<br />
The neutral theory of evolution does not account <strong>for</strong><br />
the proportion of amino acid substitutions observed in<br />
mammalian genomes [6, 37, 39, 40]. Although proteincoding<br />
sequences are conserved among mammals in<br />
general, rates of amino acid substitution vary markedly<br />
among proteins compared with rates of synonymous<br />
substitution among genes (changes in the coding<br />
region of genes that do not affect protein sequence)<br />
[37]. Whereas patterns of genetic variation across the<br />
entire human genome are affected by the demographic<br />
histories of populations, variation at particular genetic<br />
loci is influenced by the effects of natural selection,<br />
mutation, and recombination [12]. Mutations that alter<br />
amino acid sequence may influence protein structure<br />
and function, and the resulting physiological consequences<br />
may be beneficial, deleterious, or neutral and<br />
thereby may influence an organism’s fitness in specific<br />
environmental contexts. Likewise, mutations that<br />
affect protein expression level can alter metabolism<br />
and other physiological processes and there<strong>for</strong>e are<br />
also under constraint and subject to positive, balancing,<br />
or negative selection. Natural selection, which<br />
is the differential contribution of genetic variants to<br />
future generations, is the only evolutionary <strong>for</strong>ce that<br />
has adaptive consequences [41]. Darwinian selection<br />
favors the maintenance and expansion of favorable<br />
mutations (by positive or balancing selection) and the<br />
elimination of mutations that are deleterious (referred<br />
to as negative or purifying selection). Positive selection<br />
increases the rates of fixation at defined loci within the<br />
genome, indicating that not all genes are expected to<br />
evolve at the same rate. Adaptive mutations expand<br />
within populations at accelerated rates relative to neutral<br />
mutations and replace a population’s preexisting<br />
variation. The proportion of amino acid substitutions<br />
that result from positive selection is estimated to be<br />
35% to 45% [37].<br />
Comparison of genomic sequence divergence among<br />
mammalian species (to identify ancient selection) and<br />
comparison of the diversity of genomic sequences<br />
among human populations (to identify more recent<br />
selection following human migrations out of Africa)<br />
are complementary approaches that have permitted the<br />
identification of genes that have undergone accelerated<br />
or adaptive evolution (table 1) [6, 42]. Rapidly evolving<br />
genes are inferred to have enabled adaptation and thus<br />
became fixed in populations by positive or balancing<br />
selection. Genes that have been subject to positive<br />
selection exhibit specific genomic signatures, which<br />
include an excess of rare variants within a population<br />
(which can be indicative of a selective sweep), large<br />
allele frequency differences among populations, and
Human nutrition and genetic variation<br />
TABLE 1. Diet-related genes and pathways that display<br />
genomic signatures of adaptive evolution<br />
Gene Species/function Reference<br />
Lysozyme Langur monkey 37, 117, 118<br />
Ribonuclease Langur monkey 37, 118<br />
Cox4 Primates 119<br />
LCT Human lactose metabolism 52<br />
ADH1B Human ethanol metabolism 59<br />
ALDH2 Human ethanol metabolism 61<br />
HFE Human iron homeostasis 55<br />
PPARg Human nuclear receptor 41<br />
PTC Human bitter-taste receptor 72<br />
KEL Human protein metabolism 42<br />
TRPV5 Human calcium transport 42<br />
TRPV6 Human calcium transport 42<br />
ABO Human protein metabolism 42<br />
ACE2 Human protein metabolism 42<br />
CYP1A2 Human arylamine metabolism<br />
120<br />
G6PD Human NADP metabolism 65<br />
Pathway<br />
Amino acid<br />
metabolism<br />
Amino acid<br />
transport<br />
Purine<br />
metabolism<br />
Human, chimpanzee 6<br />
Chimpanzee 6<br />
Chimpanzee 6<br />
a common haplotype that remains intact over long<br />
distances [23, 41–43]. These genomic signatures are<br />
expected to arise from region-specific selective factors<br />
and there<strong>for</strong>e concentrate in specific geographic<br />
regions where the selection occurred [12]. Signatures of<br />
positive selection can be used to predict the geographic<br />
origins of an individual to the degree that different<br />
selective pressures are operative across populations,<br />
but they do not always correspond to specific ethnic<br />
or racial groups because races are not homogeneous<br />
[15, 44].<br />
Understanding the historical selection of gene variants<br />
enables the identification of human disease alleles<br />
that arose from nutritional challenges, including<br />
single-gene as well as low-penetrant complex disease<br />
alleles [12, 42]. The common disease-common variant<br />
hypothesis predicts that disease-susceptibility alleles<br />
will exist at high frequency across all human populations<br />
and there<strong>for</strong>e arose prior to human migrations<br />
out of Africa [45, 46]. However, both single-gene<br />
disorders, including cystic fibrosis and hemochromatosis,<br />
and complex diseases are also associated with<br />
less common and geographically restricted alleles<br />
that arose after migrations out of Africa [15, 23, 42,<br />
47–49]. There<strong>for</strong>e, although 85% to 90% of all human<br />
genetic variation is found within populations, some of<br />
the 10% to 15% of variation among populations arose<br />
S105<br />
from recent selective pressures that contribute to both<br />
simple and complex disease [50, 51]. In fact, many of<br />
the human alleles known to affect metabolism, <strong>food</strong><br />
tolerance, or optimal nutrient intake display signatures<br />
of positive selection (table 1); some examples are<br />
described below.<br />
Lactose and calcium metabolism<br />
The metabolism of lactose requires expression of the<br />
enzyme lactase-phlorizin hydrolase encoded by the<br />
LCT gene. LCT expression declines after weaning in<br />
most mammals, including most humans, resulting in<br />
primary lactose intolerance. The expression of LCT<br />
persists into adulthood <strong>for</strong> some human populations,<br />
including humans of northwest European descent and<br />
nomads of the Afro-Arabian desert region. An SNP<br />
was identified 14 kilobases upstream of the LCT transcriptional<br />
initiation site in a cis-acting transcriptional<br />
element that is enriched in individuals of northern<br />
European descent and displays genomic signatures of<br />
positive selection [11, 52, 53]. Its prevalence correlates<br />
with, but does not account fully <strong>for</strong>, the persistence<br />
of LCT expression and resistance to primary lactose<br />
intolerance throughout adulthood [53]. The benefits<br />
of milk consumption in cattle-herding populations,<br />
both as a source of liquid in arid regions and <strong>for</strong><br />
prevention of rickets and osteomalacia in regions of<br />
low solar irradiation, may have driven the fixation of<br />
this polymorphism [43, 52, 54]. The need <strong>for</strong> efficient<br />
calcium absorption may also have driven alleles <strong>for</strong><br />
TRPV5 and TRPV6 to fixation in the same populations<br />
(table 1) [42].<br />
Iron metabolism<br />
Hereditary hemochromatosis is a recessive iron-storage<br />
disease prevalent in populations of European descent<br />
with an incidence of 1 in 300 persons. A common polymorphism<br />
in the HFE gene (C282Y), which encodes a<br />
protein that regulates iron homeostasis, is associated<br />
with the disease phenotype in 60% to 100% of Europeans<br />
and arose approximately 138 generations ago [23,<br />
55, 56]. The HFE C282Y allele is not present in Asian<br />
and African populations where iron-storage diseases<br />
exist; mutations in other genes are also associated with<br />
the phenotype. The penetrance of the C282Y HFE allele<br />
<strong>for</strong> the iron overload phenotype varies widely among<br />
homozygotes, with some individuals being asymptomatic,<br />
indicating the presence of modifying alleles. The<br />
recent expansion of this polymorphism may have conferred<br />
selective advantages in iron-poor environments<br />
[55, 56] or resistance to microbial infection [57].<br />
Alcohol metabolism<br />
The efficiency of ethanol metabolism varies widely<br />
among human ethnic populations [58]. ADH encodes<br />
the enzyme alcohol dehydrogenase, which oxidizes
S106<br />
ethanol to acetaldehyde; acetaldehyde is subsequently<br />
oxidized to acetic acid by the enzyme aldehyde dehydrogenase<br />
encoded by ALDH2. Seven ADH genes<br />
have been identified and cluster on chromosome 4;<br />
all encoded proteins display distinct catalytic properties<br />
and tissue-specific expression patterns. Two<br />
of the genes encoding class I enzymes (ADH1B and<br />
ADH1C) are expressed in liver, function in systemic<br />
ethanol clearance, and display functional polymorphism.<br />
A variant ADH1B* 47His allele predominates<br />
in Japanese and Chinese populations but is rare in<br />
European and northern African populations [59].<br />
The variant allele encodes an enzyme with elevated<br />
enzyme activity leading to more rapid <strong>for</strong>mation of<br />
acetaldehyde. The ADH1C*349Ile variant is found in<br />
Europeans, whereas the ADH1B*369Arg variant is<br />
mostly restricted to individuals of African descent.<br />
ALDH2 is also highly polymorphic; members of Asian<br />
populations carry a common dominant null allelic<br />
variant (E487K) and when consuming alcohol develop<br />
a characteristic “flush” reaction resulting from acetaldehyde<br />
accumulation [60]. ADH and ALDH alleles<br />
that predominate in east Asian populations display<br />
signatures of positive selection, and the expression of<br />
these variant alleles results in elevated acetaldehyde<br />
concentrations following alcohol consumption, which<br />
may have conferred advantage by protecting against<br />
parasite infection [61].<br />
Energy metabolism<br />
The “thrifty gene” hypothesis was first proposed over 40<br />
years ago to account <strong>for</strong> the epidemic of type 2 diabetes<br />
observed in non-Western cultures that adopt Westernstyle<br />
diets and lifestyles [62, 63]. The hypothesis states<br />
that exposure to frequent famine selected <strong>for</strong> gene<br />
variants that enabled the more efficient conversion of<br />
<strong>food</strong> into energy and fat deposition during periods of<br />
unpredictable and sometimes scant <strong>food</strong> supplies. The<br />
putative adaptations also may have resulted in more<br />
efficient adaptations to fasting conditions (e.g., more<br />
rapid decreases in basal metabolism) and/or physiological<br />
responses that facilitate excessive intakes in<br />
times of plenty. Conclusive genomic data have not yet<br />
supported this hypothesis [63, 64].<br />
Oxidative metabolism<br />
Variations that impact human nutrition and metabolism<br />
may have arisen independently of direct nutritional<br />
challenges. The enzyme glucose-6-phosphate<br />
dehydrogenase is solely responsible <strong>for</strong> the generation<br />
of reduced nicotinamide adenine dinucleotide phosphate<br />
(NADPH) in red blood cells and there<strong>for</strong>e is<br />
required to prevent oxidative damage. Variants with<br />
low activity resulting from amino acid substitutions,<br />
including the G6PD-202A allele, are enriched in sub-<br />
Saharan African populations and arose 2,500 to 6,500<br />
years ago [65]. Presumably, this allelic variant became<br />
P. J. Stover<br />
enriched in populations as a result of balancing selection<br />
because it conferred resistance to malarial disease<br />
in heterozygous females and hemizygous males<br />
[66, 67].<br />
These examples illustrate the role of environmental<br />
exposures, including pathogens and <strong>dietary</strong> components,<br />
as selective <strong>for</strong>ces that facilitated the fixation<br />
of alleles that alter the utilization and metabolism of<br />
<strong>dietary</strong> components. Adaptive alleles may become<br />
recessive disease alleles, or disease alleles even in<br />
heterozygote individuals, when the environmental<br />
conditions change profoundly, such as those brought<br />
about by the advent of civilization and agriculture,<br />
including alterations in the nature and abundance of<br />
the <strong>food</strong> supply [6, 37, 41, 43, 68–72]. Adaptive alleles<br />
may be responsible <strong>for</strong> the generation of metabolic<br />
disease alleles both within and across ethnically diverse<br />
human populations and there<strong>for</strong>e are strong, nonbiased<br />
candidate genes <strong>for</strong> disease association studies; the<br />
interacting and modifying environmental factors can<br />
be inferred from the nutrients and/or metabolites that<br />
are known to interact with the gene product [12].<br />
Functional consequences of human genetic<br />
variation<br />
Polymorphisms that affect nutrient utilization or<br />
metabolism probably arose from historical adaptation<br />
and can be identified now by “blinded” computational<br />
approaches. However, prior to the advent of whole<br />
genome approaches, most functional polymorphisms<br />
were identified as highly penetrant disease alleles<br />
from epidemiologic or clinical studies. Candidate<br />
genes were selected <strong>for</strong> analyses of variation <strong>based</strong> on<br />
knowledge of metabolic pathways and predictions that<br />
their impairment could result in metabolic phenotypes<br />
that either mirror a particular disease state or affect<br />
the concentration of a biomarker associated with the<br />
disease. Genetically modifiable organisms, including<br />
yeast, Drosophila, Caenorhabditis elegans, and mice, are<br />
also excellent resources to identify candidate genes and<br />
serve as models to confirm gene function. Candidate<br />
gene approaches have been successful in identifying<br />
many disease susceptibility alleles (table 2) [73, 74],<br />
but they are limited by incomplete knowledge of gene<br />
function, incomplete knowledge of transcriptional and<br />
metabolic networks that suggest candidate genes <strong>for</strong><br />
analyses, and inconsistent findings among epidemiologic<br />
studies, especially <strong>for</strong> low-penetrant alleles. Once<br />
candidate genes are identified, establishing alleles as<br />
disease-causing is equally challenging. Because many<br />
SNPs are in linkage disequilibrium, it is not always possible<br />
to determine with certainty whether an individual<br />
SNP or allele is functional. Furthermore, SNP penetrance<br />
cannot always be inferred from in vitro studies<br />
of proteins or studies of model organisms. Metabolic
Human nutrition and genetic variation<br />
TABLE 2. Human gene variants that affect the uptake or metabolism of <strong>dietary</strong> components<br />
Food component<br />
Vitamins<br />
Gene Polymorphic allele Reference<br />
Folate MTHFR A222V 1, 121<br />
CBS 844ins68 122<br />
GCPII H475Y 123, 124<br />
Vitamin B12 MTR N919G 121<br />
MTRR I22M 121<br />
Vitamin D<br />
Minerals<br />
VDR Many 125<br />
Iron HFE C282Y 126, 127<br />
Sodium CIC-Kb T481S 128, 129<br />
Lipids APOB Many 130, 131<br />
APOC3 Many 132<br />
APOE Many 83<br />
Alcohol<br />
Carbohydrates<br />
ADH/ALDH2 Many 58, 60<br />
Lactose LCT Promoter 53<br />
Fructose Aldolase B Many 82<br />
Detoxification/<br />
oxidative stress<br />
NAT1/NAT2 Many 133, 134<br />
PON1 Q192R;L55M 135<br />
Mn-SOD Ala(-9)Val 136, 137<br />
networks are robust and maintain flux through redundancy,<br />
degeneracy, and/or compensatory alterations in<br />
epigenetic programming, gene expression, and protein<br />
regulation, among others, which serve to maintain<br />
homeostasis by masking the effects of otherwise deleterious<br />
genetic mutations [27, 75, 76].<br />
Regardless of the methodology used to identify<br />
alleles that alter nutrient metabolism or utilization,<br />
knowledge of the functional consequences of genetic<br />
variation is essential <strong>for</strong> the rational design of nutritional<br />
interventions that seek to modify the penetrance<br />
of the deleterious alleles. Genetic variation that influences<br />
gene expression or changes amino acid sequence<br />
encoded within an mRNA transcript can influence cellular<br />
metabolism and/or other physiological processes.<br />
Metabolic alterations may confer advantage or risk to<br />
the organism in specific environmental contexts, and<br />
basic knowledge of enzyme function and metabolic<br />
flux theory predicts that both the risk and the benefit<br />
are modifiable by nutrients or nutrient intake levels.<br />
The rate of an enzyme-catalyzed reaction or nutrient<br />
transport is a function of the concentrations of enzyme<br />
(E) and substrate (S) and will be reflected by the proportion<br />
of enzyme present as an ES complex, as shown<br />
in equation 1:<br />
E + S E + P (1)<br />
The rate of ES complex <strong>for</strong>mation is dependent<br />
upon productive collisions between the enzyme and<br />
substrate(s), as stated by the law of mass action. There-<br />
S107<br />
<strong>for</strong>e, the rate of an enzyme-catalyzed reaction is usually<br />
directly proportional to the molecular concentrations<br />
of the reacting substances (both E and S) and to the<br />
affinity of E <strong>for</strong> S. The Michaelis-Menten constant<br />
K m refers to the substrate concentration required <strong>for</strong><br />
half-maximal velocity of E and indicates the affinity of<br />
E <strong>for</strong> S. Genetic variation influences the <strong>for</strong>mation of<br />
the ES complex by affecting the cellular concentration<br />
of E (as occurs with expression variants, e.g., LCT)<br />
or by altering K m (as seen with ethanol metabolizing<br />
enzyme variants). The concentration of E is influenced<br />
by alterations in its expression or turnover; the expression<br />
of E can be affected at the level of transcription,<br />
translation, mRNA splicing, mRNA stability, or posttranslational<br />
processing and modification. Specific<br />
nutrients can regulate the expression and processing of<br />
many genes. There<strong>for</strong>e, interventions or therapies can<br />
be designed rationally to affect the concentration of E<br />
<strong>for</strong> health benefit. Genetic variation in protein coding<br />
sequence can alter K m and thereby affect the concentration<br />
of substrate required to drive the <strong>for</strong>mation of<br />
the ES complex and/or result in the accumulation of<br />
metabolic intermediates in cells. There<strong>for</strong>e, alterations<br />
in K m can indicate the minimal level of nutrient intake<br />
that is required to maintain flux through a metabolic<br />
pathway, or potentially alter the safe upper level of<br />
nutrient intake to avoid the accumulation of toxic<br />
intermediates.<br />
The rate of product <strong>for</strong>mation is also a function of<br />
the Michaelis-Menten constant k cat , which refers to the
S108<br />
maximal rate of catalysis and usually represents the<br />
rate of breakdown of the ES complex to product (P) at<br />
infinite substrate concentration (all enzyme is present<br />
as an ES complex). Genetic variation that alters amino<br />
acid coding sequence can influence k cat and thereby<br />
influence rates of nutrient uptake or clearance of<br />
metabolic intermediates and overall net flux through a<br />
metabolic pathway in a substrate-independent manner.<br />
Severe alterations in k cat can indicate <strong>food</strong> or nutrient<br />
intolerances. There<strong>for</strong>e, a detailed understanding of<br />
the functional consequences of allelic variants can be<br />
used to predict nutrient intolerance and may indicate<br />
genotype-specific variation in nutritional requirements,<br />
and can lead to the development of tailored nutritional<br />
interventions and therapies <strong>for</strong> populations and individuals.<br />
Specific examples are discussed below.<br />
One-carbon metabolism<br />
Folate-mediated one-carbon metabolism is required <strong>for</strong><br />
purine, thymidylate, and methionine biosynthesis and<br />
affects genome synthesis, genome stability, and gene<br />
expression [77]. Several polymorphic alleles have been<br />
identified to be associated with metabolic perturbations<br />
that can confer both protection and risk <strong>for</strong> specific<br />
pathologies and developmental anomalies [78]. SNPs in<br />
MTHFR (A222V) and MTHFD1 (R653Q) [79], which<br />
encode folate-dependent enzymes, are associated with<br />
increased risk of neural tube defects; MTHFR (A222V)<br />
is protective against colon cancer in folate-replete<br />
subjects [80]. The MTHFR A222V variant protein has<br />
reduced affinity <strong>for</strong> riboflavin cofactors and is thermolabile,<br />
resulting in reduced cellular MTHFR activity;<br />
its stability is increased when folate is bound [81].<br />
Although the biochemical role of these polymorphisms<br />
in the etiology of neural tube defects and cancer is<br />
unknown, it has been demonstrated that some carriers<br />
of MTHFR variants require higher folate intakes than<br />
others in order to stabilize the MTHFR protein, lower<br />
the concentration of the metabolic intermediate homocysteine,<br />
and decrease women’s risk of bearing children<br />
with developmental anomalies [1]. The MTHFR variant<br />
is prevalent in Caucasian and Asian populations but<br />
is nearly absent in African populations [1]. Fortification<br />
of the <strong>food</strong> supply with folic acid, as practiced in<br />
many countries, targets women of childbearing age <strong>for</strong><br />
prevention of birth defects, with genetically identifiable<br />
subgroups receiving the most benefit.<br />
Fructose metabolism<br />
Hereditary fructose intolerance (HFI) is an autosomal<br />
recessive disorder of fructose metabolism caused by<br />
low fructose-1,6-aldolase activity, which results in<br />
an accumulation of the toxic metabolic intermediate<br />
fructose-1-phosphate. Twenty-five allelic variants of<br />
the human liver isozyme aldolase B have been identi-<br />
fied that impair enzyme activity by altering K m , k cat ,<br />
and/or protein stability [82]. The prevalence of these<br />
variants differs throughout Europe; the L288 delta C<br />
frameshift mutation is restricted to Sicilian subjects.<br />
The accumulation of fructose-1-phosphate inhibits<br />
glycogen breakdown and glucose synthesis, resulting<br />
in severe hypoglycemia following ingestion of fructose.<br />
Prolonged fructose ingestion in infants leads ultimately<br />
to hepatic and/or renal failure and death. Affected individuals<br />
are asymptomatic in the absence of fructose or<br />
sucrose consumption and can avoid the recurrence of<br />
symptoms by remaining on a fructose- and sucrose-free<br />
diet. The incidence of HFI intolerance has increased<br />
since the widespread use of sucrose and fructose<br />
as nutrients and sweeteners, providing an excellent<br />
example whereby an environmental shift resulted in the<br />
apparent conversion of normally nonpenetrant “silent”<br />
aldolase B alleles into HFI disease alleles.<br />
Lipid metabolism<br />
Apolipoprotein E (apoE) is a polymorphic protein that<br />
functions in lipid metabolism and cholesterol transport<br />
[83]. The three common allelic variants, ε2, ε3, and ε4,<br />
encode proteins that differ in their affinity both <strong>for</strong><br />
lipoprotein particles and <strong>for</strong> low-density lipoprotein<br />
receptors. All human populations display apoE polymorphism,<br />
but the relative distribution varies among<br />
populations; the frequency of the ε4 allele declines<br />
from northern to southern Europe. The ε4 allele<br />
increases the risk of late-onset Alzheimer’s disease and<br />
arteriosclerosis with low penetrance. Carriers of the ε2<br />
allele tend to display lower levels of plasma total cholesterol,<br />
whereas carriers of the ε4 allele, which may be<br />
ancestral, display higher cholesterol levels. There<strong>for</strong>e,<br />
serum cholesterol levels are likely to be more responsive<br />
to low-fat and low-cholesterol diets in carriers of<br />
the ε4 allele [84, 85].<br />
Genetic variation and human nutrition<br />
P. J. Stover<br />
Nutrients and the genome interact reciprocally;<br />
genomes confer differences in <strong>food</strong> tolerances and<br />
nutrient requirements, and nutrients can influence<br />
genome expression, stability, and viability [77]. Characterization<br />
of gene variants that modify optimal<br />
nutrient requirements has diagnostic value; it enables<br />
the classification of genetic subgroups <strong>for</strong> which<br />
generalized nutritional requirements may not apply.<br />
Parallel advancements in understanding the interactions<br />
among human genes, including all genetic variants<br />
thereof, and environmental exposures is enabling<br />
the development of genotype-specific nutritional<br />
regimens that prevent disease and promote wellness <strong>for</strong><br />
individuals and populations throughout the life cycle.<br />
Current challenges associated with the incorporation
Human nutrition and genetic variation<br />
of genomic in<strong>for</strong>mation into the nutritional sciences<br />
are described below.<br />
Genetic variation and nutritional requirements<br />
Human genotypes that do not support basic physiological<br />
processes will be selected against in large part<br />
because of fetal loss or the failure to survive to reproduce.<br />
Allelic variants that confer nutrient requirements<br />
that cannot be met by the mother or that result in severe<br />
metabolic disruptions are expected to be embryonic<br />
lethal. Nearly 60% of all human conceptuses are not<br />
viable and do not survive to the 12th week of gestation<br />
[86, 87]. Human alleles associated with developmental<br />
anomalies that encode folate-dependent metabolic<br />
enzymes are not in Hardy-Weinberg equilibrium<br />
(alleles are not inherited at the expected frequency),<br />
consistent with evidence that elevated homocysteine<br />
and the MTHFR A222V polymorphism are risk factors<br />
<strong>for</strong> spontaneous miscarriage and decreased fetal viability<br />
[77, 79, 88–90]. Nutrition, unlike pharmaceuticals,<br />
is an in utero and lifelong exposure that can serve as<br />
a selective pressure to eliminate genomes that are not<br />
compatible with the nutrient environment. There<strong>for</strong>e,<br />
genotype is not anticipated to confer extreme variations<br />
in optimal nutrient requirements among individuals<br />
and populations. Alleles that confer more subtle differences<br />
in nutrient requirements or <strong>food</strong> tolerances are<br />
expected to be enriched in subgroups or populations<br />
and to contribute to disease in certain environmental<br />
contexts (tables 1 and 2).<br />
The concept of generalized nutrient requirements<br />
within and among populations is nullified only when<br />
a level of nutrient intake that represents minimal nutrient<br />
adequacy <strong>for</strong> one genetic subgroup exceeds a safe<br />
intake level <strong>for</strong> another group, assuming that nutrient<br />
deficiency and avoidance of harm or toxicity avoidance<br />
are the primary criteria <strong>for</strong> requirement. For example,<br />
optimal folate intakes may differ among identifiable<br />
genetic subgroups. However, it is not established that<br />
the magnitude of the genetic contribution to variations<br />
in adequate <strong>dietary</strong> folate intake warrants genotypespecific<br />
recommendations, especially considering that<br />
folic acid intakes up to 1 mg/day are not associated<br />
with known toxicities [91]. Iron is another candidate<br />
nutrient <strong>for</strong> which genotype-specific nutrient requirements<br />
have been considered [57, 92–94]. For these<br />
and other cases, the penetrance (contribution of the<br />
individual allele to variation in nutrient requirements)<br />
and the prevalence of these functional gene variants<br />
must be elucidated both within and among human<br />
populations to validate the concept of generalized<br />
nutrient requirements <strong>for</strong> all genotypes. Unlike the<br />
effects of sex and life cycle, no common allelic variant<br />
has been shown to be sufficiently penetrant and<br />
to warrant genotype-specific numeric standards <strong>for</strong><br />
nutrient adequacy or upper levels of intake associated<br />
S109<br />
with harm or toxicity. At this time, genetic variation is<br />
known only to influence nutrient and <strong>food</strong> intolerance.<br />
However, genetic variation has not been characterized<br />
in many geographically and culturally isolated populations<br />
that have existed in nutrient-poor or otherwise<br />
unique nutritional environments <strong>for</strong> many generations,<br />
and there<strong>for</strong>e the presence of adaptive alleles should be<br />
expected in such populations. Recent experiences have<br />
demonstrated the severe adverse health consequences<br />
that result from rapid alterations in <strong>dietary</strong> patterns<br />
among certain populations [95].<br />
Finally, to achieve <strong>dietary</strong> <strong>guidelines</strong> that optimize<br />
health <strong>for</strong> all individuals and populations, the many<br />
functions of individual genes and their regulation<br />
within metabolic and transcriptional networks must<br />
be understood comprehensively. Recently, it was shown<br />
that the LCT gene also encodes the enzyme pyridoxine-<br />
5’-β-D-glucoside as a result of differential processing of<br />
the LCT transcript [96]. Pyridoxine-5’-β-D-glucoside<br />
activity is necessary <strong>for</strong> the bioavailability of pyridoxine-5’-β-D-glucoside,<br />
the major <strong>for</strong>m of vitamin B 6<br />
in plant-derived <strong>food</strong>s [97]. There<strong>for</strong>e, LCT variation<br />
predicts both lactose tolerance and preferred <strong>dietary</strong><br />
sources of vitamin B 6 in adulthood.<br />
Genetic variation and benefits and risks of using<br />
<strong>food</strong> as medicine<br />
Nutrients can be effective agents to modify genome<br />
expression and stability <strong>for</strong> benefit. Designer diets<br />
and nutritional supplements can compensate <strong>for</strong><br />
deleterious alleles, as illustrated by the use of phenylalanine-restricted<br />
diets to avoid severe cognitive deficits<br />
associated with phenylketonuria and the use of folate<br />
supplements and/or <strong>for</strong>tified <strong>food</strong> to prevent the occurrence<br />
and recurrence of neural tube defects. Highdose<br />
vitamin therapy is advocated to rescue impaired<br />
metabolic reactions that result from mutations and<br />
polymorphisms that decrease the affinity of substrates<br />
and cofactors <strong>for</strong> the encoded enzyme [73]. ω-3 fatty<br />
acids and tocopherols are suggested to promote healthy<br />
aging and longevity by modulating the inflammatory<br />
response by altering gene transcription [8]. Other genes<br />
and allelic variants that influence longevity (a trait that<br />
is not likely to be adaptive) are being identified [7], and<br />
their penetrance can be modified by the rational design<br />
of nutrition-<strong>based</strong> interventions and therapies. Repression<br />
of energy metabolism through caloric restriction<br />
or transcriptional regulation of metabolic enzymes<br />
reduces oxidative stress and promotes longevity in<br />
many experimental model systems. Manipulation of<br />
these transcriptional or metabolic networks by diet may<br />
promote healthy aging. However, caution is warranted.<br />
Genes encoding virtually all physiological process are<br />
not adapted to excessive nutrient intake exposures that<br />
exceed what has been achieved in historical and healthful<br />
<strong>food</strong>-<strong>based</strong> diets. There<strong>for</strong>e, new risks and toxicities
S110<br />
should be anticipated in populations or population<br />
subgroups when nutrients are administered at pharmacological<br />
levels, as illustrated by the introduction<br />
of high fructose into the <strong>food</strong> supply. Other genomic<br />
consequences may also result, including permanent<br />
alterations in genome-wide methylation patterns, as<br />
observed in mouse embryos whose mothers received<br />
elevated doses of folic acid and one-carbon donors<br />
during gestation [24]. Methylation patterns that are<br />
established in utero can be metastable and influence<br />
gene expression and potentially mutation rates into<br />
adulthood [24]. The effect of diet on DNA methylation<br />
and genome programming in adult stem cells is<br />
unknown. Although antioxidants can decrease mutation<br />
rates, they also function as prooxidants in vivo<br />
[98] and may be cancer-promoting at elevated intakes<br />
by inhibiting cellular death programs in trans<strong>for</strong>med<br />
cells [99]. In conclusion, elucidation of robust gene-bynutrient<br />
interactions will in<strong>for</strong>m <strong>dietary</strong> approaches<br />
<strong>for</strong> individuals and <strong>for</strong> population-<strong>based</strong> interventions<br />
that prevent and/or manage rare inborn errors<br />
of metabolism as well as complex metabolic disease.<br />
Furthermore, these and other examples indicate that<br />
rigorous hazard identification is essential prior to the<br />
establishment of policies that result in pharmacological<br />
intakes of nutrients and other <strong>food</strong> components.<br />
Genomic criteria <strong>for</strong> setting requirements and<br />
toxicities<br />
Genomic technologies may provide new criteria <strong>for</strong><br />
establishing numeric standards <strong>for</strong> adequate levels of<br />
nutrient intake by targeting the molecular antecedents<br />
of disease. Mutation increases the risks of developmental<br />
anomalies, degenerative diseases, and cancers and<br />
can be quantified in controlled experimental settings,<br />
indicating that the effects of key minerals and vitamins<br />
on DNA mutation rates should be considered when<br />
establishing RDAs (recommended <strong>dietary</strong> allowances)<br />
[30]. Marginal deficiencies in folate, vitamin B 12 ,<br />
niacin, and zinc can influence genome stability, and<br />
antioxidants, including carotenoids, vitamin C, and<br />
vitamin E, may prevent damage resulting from oxidative<br />
stress. Validation of these protective effects on DNA<br />
mutation rates in controlled human trials may indicate<br />
benefits and lead to increased recommended intake<br />
levels, perhaps at levels not normally achievable from a<br />
natural <strong>food</strong>-<strong>based</strong> diet. Similarly, the use of functional<br />
genomic approaches, including expression profiling<br />
and proteomics to quantify gene expression and metabolomics<br />
to quantify metabolic pathway flux, provides a<br />
comprehensive set of quantitative and physiologically<br />
relevant “biomarkers” to model and assess nutrient efficacy<br />
in the context of optimal network function [100].<br />
Other genomic outcomes are emerging as criteria <strong>for</strong><br />
hazard identification and may influence the establishment<br />
of tolerable upper levels of nutrient intake during<br />
P. J. Stover<br />
pregnancy. Studies of animal models are revealing that<br />
nutrients can rescue deleterious genetic mutations,<br />
leading to the concept that “good diet hides genetic<br />
mutations” [101]. Individual nutrients can rescue<br />
severe genetic lesions in mice when administered in<br />
supraphysiologic levels during critical developmental<br />
windows. Maternal retinoic acid administration<br />
between 7.5 and 9.5 days postconception rescued deafness<br />
and inner ear development in Hoxa1 -/- mice [102],<br />
and folic acid can rescue skeletal defects associated with<br />
deletion of a Hox gene, as well as neural tube defects in<br />
mice that have no evidence of disrupted folate metabolism<br />
[101]. This rescue phenomenon is not established<br />
in humans, but animal studies indicate that nutrients<br />
can modify the viability of genomes, including genomes<br />
that confer atypical nutrient requirements on the surviving<br />
fetus [103].<br />
There is increasing evidence that maternal nutrition<br />
can induce epigenetic changes in the fetal genome<br />
that may program increased risks of metabolic disease<br />
and nutrient requirements throughout the lifespan<br />
of the offspring. The effects of fetal glucocorticoid<br />
exposure on adult chronic disease risk provide some<br />
of the strongest evidence <strong>for</strong> the fetal origins of disease<br />
hypothesis [104–107]. Fetal glucocorticoid levels are<br />
maintained at low concentrations relative to maternal<br />
concentrations primarily through the action of<br />
placental 11β-hydroxysteroid dehydrogenase type 2<br />
(11β-HSD2), which catalyzes the oxidative inactivation<br />
of cortisol and corticosterone [108]. Elevated fetal glucocorticoid<br />
exposures during late gestation, which can<br />
result from 11β-HSD2 inhibitors, rare mutations in the<br />
human 11β-HSD2 gene, or large existing variation in<br />
placental 11β-HSD2 activity among humans, can have<br />
lifelong consequences <strong>for</strong> the fetus, including low birthweight,<br />
elevated plasma glucocorticoid, hypertension,<br />
hyperglycemia, insulin resistance, hyperinsulinemia,<br />
and anxiety [107]. Low maternal <strong>dietary</strong> protein intake<br />
during gestation causes a specific loss of placental 11β-<br />
HSD2 expression and similar outcomes resulting from<br />
elevated fetal glucocorticoid exposure [109]. Similarly,<br />
obstetric glucocorticoid therapy to accelerate lung<br />
development prior to anticipated preterm deliveries<br />
also increases the risk of reduced fetal birthweight and<br />
long-term susceptibility to hypertension, hyperglycemia,<br />
cardiovascular disease, and increased hypothalamic-pituitary-adrenal<br />
axis activity. These disorders<br />
persist not only into adulthood, but also into the next<br />
generation [110]. Lifelong consequences associated<br />
with fetal glucocorticoid exposure may result from<br />
premature glucocorticoid receptor-mediated chromatin<br />
remodeling in the hippocampus [107]. Prenatal<br />
glucocorticoid exposure decreases fetal glucocorticoid<br />
receptor expression which remains reduced through<br />
adulthood. Maternal undernutrition can elicit the same<br />
effect, presumably by decreasing placental 11β-HSD2<br />
levels. Maternal GC exposure also affects glucose and
Human nutrition and genetic variation<br />
insulin homeostasis [111] by programming hepatic<br />
PEPCK levels through changes in PEPCK gene methylation<br />
with effects that persist into adulthood [112,<br />
113]. The modification of glucocorticoid-mediated<br />
fetal programming by maternal folate status has not<br />
been investigated, nor have the effects of fetal programming<br />
on adult nutritional requirements.<br />
Conclusions: effects of human genetic<br />
variation on NIVs<br />
Human genetic variation is a determinant of nutrient<br />
efficacy and of tolerances and intolerances and has the<br />
potential to influence nutrient intake values (NIVs).<br />
Historically, the nature and abundance of the <strong>food</strong><br />
supply has been one of several environmental selective<br />
pressures that governed the evolution of humans<br />
by facilitating the expansion of polymorphisms within<br />
human populations. Genetic variants that enable survival<br />
in challenging nutrient environments become<br />
enriched in populations through the process of natural<br />
selection. This process has been shown to create variation<br />
in the utilization of lactose, iron, and alcohol and<br />
the associated <strong>food</strong> intolerances. Genetic determinants<br />
of nutrient tolerances display genomic signatures of<br />
positive selection, indicating that these variants offered<br />
survival advantage in specific geographic regions.<br />
Recent history has also revealed that rapid and severe<br />
alterations in the <strong>food</strong> supply can unmask previously<br />
silent genetic variation and create new or more prevalent<br />
<strong>food</strong> intolerances, as occurred with the infusion of<br />
large quantities of fructose in the <strong>food</strong> supply [82, 114,<br />
115]. To date, no gene variant has been demonstrated<br />
to affect nutritional requirements sufficiently to warrant<br />
genotype-specific recommendations, although the<br />
affect of the MTHFR A222V variants on folate require-<br />
References<br />
1. Bailey LB. Folate, methyl-related nutrients, alcohol, and<br />
the MTHFR 677→T polymorphism affect cancer risk:<br />
Intake recommendations. J Nutr 2003;133(11 suppl<br />
1):3748S–53S.<br />
2. Bailey LB, Gregory JF 3rd. Polymorphisms of methylenetetrahydrofolate<br />
reductase and other enzymes:<br />
Metabolic significance, risks and impact on folate<br />
requirement. J Nutr 1999;129:919–22.<br />
3. Tishkoff SA, Williams SM. Genetic analysis of African<br />
populations: Human evolution and complex disease. Nat<br />
Rev Genet 2002;3:611–21.<br />
4. McCarthy JJ, Hilfiker R. The use of single-nucleotide<br />
polymorphism maps in pharmacogenomics. Nat Biotechnol<br />
2000;18:505–8.<br />
5. Weinshilboum R. Inheritance and drug response. N Engl<br />
J Med 2003;348:529–37.<br />
6. Clark AG, Glanowski S, Nielsen R, Thomas PD, Kejari-<br />
S111<br />
ments has been considered. However, because many<br />
human populations have existed <strong>for</strong> many generations<br />
in unique, isolated, and challenging nutrient environments,<br />
relatively rare gene variants that influence NIVs<br />
may be highly prevalent in historically isolated, stable<br />
human populations. All human genetic variation is<br />
expected to be identified in the near future. Linking<br />
specific gene variants to known nutrient sensitivity in<br />
ethnic or geographic human populations, such as salt<br />
sensitivity in African Americans, may enable population-specific<br />
recommendations <strong>for</strong> genetic subgroups<br />
[116]. Because polymorphisms can confer both health<br />
benefits and risks, depending on the outcome of interest,<br />
and these outcomes may respond differentially to<br />
nutrient intake levels, it may important to consider<br />
the effects of genetic-specific recommendations on all<br />
known health outcomes.<br />
The impact of a gene variant on nutritional requirements<br />
will be dependent on its prevalence and penetrance.<br />
Penetrance, which is the probability that a<br />
gene variant will express a phenotype from a given<br />
genotype at a given time, usually varies inversely with<br />
prevalence. Recent experiences indicate that few gene<br />
variants are anticipated to be sufficiently penetrant to<br />
affect variation of an average requirement (AR) to a<br />
greater degree than environmental factors. Once highly<br />
penetrant gene variants are identified, the prevalence of<br />
the variant in that country or region will determine the<br />
feasibility and necessity of deriving more than one AR<br />
or upper limit (UL) <strong>for</strong> genetic subgroups. For example,<br />
it is unlikely that gene–gene interactions will be a major<br />
consideration in the determination of NIVs because<br />
of the very low prevalence associated with highly<br />
penetrant gene–gene interactions. Likewise, because<br />
chronic diseases are polygenic complex traits, a single<br />
SNP is unlikely to have an impact on NIVs that target<br />
long-term chronic disease prevention.<br />
wal A, Todd MA, Tanenbaum DM, Civello D, Lu F,<br />
Murphy B, Ferriera S, Wang G, Zheng X, White TJ,<br />
Sninsky JJ, Adams MD, Cargill M. Inferring nonneutral<br />
evolution from human-chimp-mouse orthologous gene<br />
trios. Science 2003;302:1960–3.<br />
7. Vijg J, Suh Y. Genetics of longevity and aging. Annu Rev<br />
Med 2005;56:193–212.<br />
8. Kornman KS, Martha PM, Duff GW. Genetic variations<br />
and inflammation: A practical nutrigenomics opportunity.<br />
Nutrition 2004;20:44–9.<br />
9. Schneeman BO, Mendelson R. Dietary <strong>guidelines</strong>:<br />
Past experience and new approaches. J Am Diet Assoc<br />
2002;102:1498–500.<br />
10. Schneeman BO. Evolution of <strong>dietary</strong> <strong>guidelines</strong>. J Am<br />
Diet Assoc 2003;103(12 suppl 2):S5–9.<br />
11. Enattah NS, Sahi T, Savilahti E, Terwilliger JD, Peltonen<br />
L, Jarvela I. Identification of a variant associated with
S112<br />
adult-type hypolactasia. Nat Genet 2002;30:233–7.<br />
12. Tishkoff SA, Verrelli BC. Patterns of human genetic<br />
diversity: implications <strong>for</strong> human evolutionary history<br />
and disease. Annu Rev Genomics Hum Genet<br />
2003;4:293–340.<br />
13. Guttmacher AE, Collins FS. Genomic medicine—A<br />
primer. N Engl J Med 2002;347:1512–20.<br />
14. Venter JC, Adams MD, Myers EW, et al. The sequence<br />
of the human genome. Science 2001;291:1304–51.<br />
15. Tishkoff SA, Kidd KK. Implications of biogeography of<br />
human populations <strong>for</strong> ‘race’ and medicine. Nat Genet<br />
2004;36(11 suppl):S21–7.<br />
16. Nachman MW, Crowell SL. Estimate of the mutation rate<br />
per nucleotide in humans. Genetics 2000;156:297–304.<br />
17. Wall JD, Pritchard JK. Haplotype blocks and linkage<br />
disequilibrium in the human genome. Nat Rev Genet<br />
2003;4:587–97.<br />
18. Gabriel SB, Schaffner SF, Nguyen H, Moore JM, Roy<br />
J, Blumenstiel B, Higgins J, DeFelice M, Lochner A,<br />
Faggart M, Liu-Cordero SN, Rotimi C, Adeyemo A,<br />
Cooper R, Ward R, Lander ES, Daly MJ, Altshuler D.<br />
The structure of haplotype blocks in the human genome.<br />
Science 2002;296:2225–9.<br />
19. Craw<strong>for</strong>d DC, Nickerson DA. Definition and clinical<br />
importance of haplotypes. Annu Rev Med 2005;56:<br />
303–20.<br />
20. Van Blerkom LM. Role of viruses in human evolution.<br />
Am J Phys Anthropol 2003;suppl 37:14–46.<br />
21. Brookfield JF. Mobile DNAs: The poacher turned gamekeeper.<br />
Curr Biol 2003;13:R846–7.<br />
22. Batzer MA, Deininger PL. Alu repeats and human<br />
genomic diversity. Nat Rev Genet 2002;3:370–9.<br />
23. Bamshad M, Wooding SP. Signatures of natural selection<br />
in the human genome. Nat Rev Genet 2003;4:99–111.<br />
24. Waterland RA, Jirtle RL. Transposable elements: Targets<br />
<strong>for</strong> early nutritional effects on epigenetic gene regulation.<br />
Mol Cell Biol 2003;23:5293–300.<br />
25. Friso S, Choi SW. Gene-nutrient interactions and DNA<br />
methylation. J Nutr 2002;132(8 suppl):2382S–7S.<br />
26. Friso S, Choi SW, Dolnikowski GG, Selhub J. A method<br />
to assess genomic DNA methylation using high-per<strong>for</strong>mance<br />
liquid chromatography/electrospray ionization<br />
mass spectrometry. Anal Chem 2002;74:4526–31.<br />
27. Waterland RA, Garza C. Potential mechanisms of metabolic<br />
imprinting that lead to chronic disease. Am J Clin<br />
Nutr 1999;69:179–97.<br />
28. Blount BC, Mack MM, Wehr CM, MacGregor JT, Hiatt<br />
RA, Wang G, Wickramasinghe SN, Everson RB, Ames<br />
BN. Folate deficiency causes uracil misincorporation<br />
into human DNA and chromosome breakage: Implications<br />
<strong>for</strong> cancer and neuronal damage. Proc Natl Acad<br />
Sci USA 1997;94:3290–5.<br />
29. Fenech M. Micronutrients and genomic stability: A new<br />
paradigm <strong>for</strong> recommended <strong>dietary</strong> allowances (RDAs).<br />
Food Chem Toxicol 2002;40:1113–7.<br />
30. Fenech M. Genome health nutrigenomics: Nutrition and<br />
the science of optimal genome maintenance. Asia Pac J<br />
Clin Nutr 2004;13(suppl):S15.<br />
31. Fenech M. Chromosomal biomarkers of genomic<br />
instability relevant to cancer. Drug Discov Today<br />
2002;7:1128–37.<br />
32. Fenech M. Recommended <strong>dietary</strong> allowances (RDAs)<br />
<strong>for</strong> genomic stability. Mutat Res 2001;480–481:51–4.<br />
P. J. Stover<br />
33. Mishra HN, Das C. A review on biological control and<br />
metabolism of aflatoxin. Crit Rev Food Sci Nutr 2003;<br />
43:245–64.<br />
34. Ames BN. DNA damage from micronutrient deficiencies<br />
is likely to be a major cause of cancer. Mutat Res<br />
2001;475:7–20.<br />
35. Goswami T, Rolfs A, Hediger MA. Iron transport:<br />
Emerging roles in health and disease. Biochem Cell Biol<br />
2002;80:679–89.<br />
36. Hediger MA, Rolfs A, Goswami T. Iron transport and<br />
hemochromatosis. J Investig Med 2002;50:239S–46S.<br />
37. Wolfe KH, Li WH. Molecular evolution meets the<br />
genomics revolution. Nat Genet 2003;33 suppl:255–65.<br />
38. Cooper DN, Krawczak M. Cytosine methylation and the<br />
fate of CpG dinucleotides in vertebrate genomes. Hum<br />
Genet 1989;83:181–8.<br />
39. Kimura M. Evolutionary rate at the molecular level.<br />
Nature 1968;217:624–6.<br />
40. King JL, Jukes TH. Non-Darwinian evolution. Science<br />
1969;164:788–98.<br />
41. Akey JM, Zhang G, Zhang K, Jin L, Shriver MD. Interrogating<br />
a high-density SNP map <strong>for</strong> signatures of natural<br />
selection. Genome Res 2002;12:1805–14.<br />
42. Akey JM, Eberle MA, Rieder MJ, Carlson CS, Shriver<br />
MD, Nickerson DA, Kruglyak L. Population history and<br />
natural selection shape patterns of genetic variation in<br />
132 genes. PLoS Biol 2004;2:e286.<br />
43. Wooding S. Natural selection: Sign, sign, everywhere a<br />
sign. Curr Biol 2004;14:R700–1.<br />
44. Collins FS. What we do and don’t know about ‘race’,<br />
‘ethnicity’, genetics and health at the dawn of the genome<br />
era. Nat Genet 2004;36(11 suppl):S13–5.<br />
45. Chakravarti A. To a future of genetic medicine. Nature<br />
2001;409:822–3.<br />
46. Reich DE, Lander ES. On the allelic spectrum of human<br />
disease. Trends Genet 2001;17:502–10.<br />
47. Pritchard JK. Are rare variants responsible <strong>for</strong> susceptibility<br />
to complex diseases? Am J Hum Genet<br />
2001;69:124–37.<br />
48. Pritchard JK, Cox NJ. The allelic architecture of human<br />
disease genes: Common disease-common variant…or<br />
not? Hum Mol Genet 2002;11:2417–23.<br />
49. Jorde LB, Watkins WS, Bamshad MJ. Population genomics:<br />
A bridge from evolutionary history to genetic medicine.<br />
Hum Mol Genet 2001;10:2199–207.<br />
50. Jorde LB, Watkins WS, Bamshad MJ, Dixon ME, Ricker<br />
CE, Seielstad MT, Batzer MA. The distribution of<br />
human genetic diversity: A comparison of mitochondrial,<br />
autosomal, and Y-chromosome data. Am J Hum<br />
Genet 2000;66:979–88.<br />
51. Jorde LB, Wooding SP. Genetic variation, classification<br />
and ‘race’. Nat Genet 2004;36(11 suppl):S28–33.<br />
52. Bersaglieri T, Sabeti PC, Patterson N, Vanderploeg<br />
T, Schaffner SF, Drake JA, Rhodes M, Reich DE, Hirschhorn<br />
JN. Genetic signatures of strong recent positive<br />
selection at the lactase gene. Am J Hum Genet 2004;<br />
74:1111–20.<br />
53. Poulter M, Hollox E, Harvey CB, Mulcare C, Peuhkuri<br />
K, Kajander K, Sarner M, Korpela R, Swallow DM. The<br />
causal element <strong>for</strong> the lactase persistence/non-persistence<br />
polymorphism is located in a 1 Mb region of<br />
linkage disequilibrium in Europeans. Ann Hum Genet<br />
2003;67(pt 4):298–311.
Human nutrition and genetic variation<br />
54. Wooding S. PopHist: Inferring population history<br />
from the spectrum of allele frequencies. Bioin<strong>for</strong>matics<br />
2003;19:539–40.<br />
55. Toomajian C, Ajioka RS, Jorde LB, Kushner JP, Kreitman<br />
M. A method <strong>for</strong> detecting recent selection in<br />
the human genome from allele age estimates. Genetics<br />
2003;165:287–97.<br />
56. Toomajian C, Kreitman M. Sequence variation and<br />
haplotype structure at the human HFE locus. Genetics<br />
2002;161:1609–23.<br />
57. Beutler E. Iron absorption in carriers of the C282Y<br />
hemochromatosis mutation. Am J Clin Nutr 2004;80:<br />
799–800.<br />
58. Bosron WF, Li TK. Genetic polymorphism of human<br />
liver alcohol and aldehyde dehydrogenases, and their<br />
relationship to alcohol metabolism and alcoholism.<br />
Hepatology 1986;6:502–10.<br />
59. Osier MV, Pakstis AJ, Soodyall H, Comas D, Goldman<br />
D, Odunsi A, Okonofua F, Parnas J, Schulz LO, Bertranpetit<br />
J, Bonne-Tamir B, Lu RB, Kidd JR, Kidd KK.<br />
A global perspective on genetic variation at the ADH<br />
genes reveals unusual patterns of linkage disequilibrium<br />
and diversity. Am J Hum Genet 2002;71:84–99.<br />
60. Loew M, Boeing H, Sturmer T, Brenner H. Relation<br />
among alcohol dehydrogenase 2 polymorphism, alcohol<br />
consumption, and levels of gamma-glutamyltransferase.<br />
Alcohol 2003;29:131–5.<br />
61. Oota H, Pakstis AJ, Bonne-Tamir B, Goldman D,<br />
Grigorenko E, Kajuna SL, Karoma NJ, Kungulilo S,<br />
Lu RB, Odunsi K, Okonofua F, Zhukova OV, Kidd JR,<br />
Kidd KK. The evolution and population genetics of the<br />
ALDH2 locus: Random genetic drift, selection, and low<br />
levels of recombination. Ann Hum Genet 2004;68(pt 2):<br />
93–109.<br />
62. Neel JV. Diabetes mellitus: A “thrifty” genotype rendered<br />
detrimental by “progress”? Am J Hum Genet<br />
1962;14:353–62.<br />
63. Diamond J. The double puzzle of diabetes. Nature<br />
2003;423:599–602.<br />
64. Rockman MV, Wray GA. Abundant raw material <strong>for</strong><br />
cis-regulatory evolution in humans. Mol Biol Evol<br />
2002;19:1991–2004.<br />
65. Verrelli BC, McDonald JH, Argyropoulos G, Destro-<br />
Bisol G, Froment A, Drousiotou A, Lefranc G, Helal AN,<br />
Loiselet J, Tishkoff SA. Evidence <strong>for</strong> balancing selection<br />
from nucleotide sequence analyses of human G6PD. Am<br />
J Hum Genet 2002;71:1112–28.<br />
66. Watkins WS, Rogers AR, Ostler CT, Wooding S, Bamshad<br />
MJ, Brassington AM, Carroll ML, Nguyen SV,<br />
Walker JA, Prasad BV, Reddy PG, Das PK, Batzer MA,<br />
Jorde LB. Genetic variation among world populations:<br />
Inferences from 100 Alu insertion polymorphisms.<br />
Genome Res 2003;13:1607–18.<br />
67. Tishkoff SA, Varkonyi R, Cahinhinan N, Abbes S,<br />
Argyropoulos G, Destro-Bisol G, Drousiotou A, Dangerfield<br />
B, Lefranc G, Loiselet J, Piro A, Stoneking M,<br />
Tagarelli A, Tagarelli G, Touma EH, Williams SM, Clark<br />
AG. Haplotype diversity and linkage disequilibrium<br />
at human G6PD: Recent origin of alleles that confer<br />
malarial resistance. Science 2001;293:455–62.<br />
68. Baier LJ, Permana PA, Yang X, Pratley RE, Hanson RL,<br />
Shen GQ, Mott D, Knowler WC, Cox NJ, Horikawa Y,<br />
Oda N, Bell GI, Bogardus C. A calpain-10 gene poly-<br />
S113<br />
morphism is associated with reduced muscle mRNA<br />
levels and insulin resistance. J Clin Invest 2000;106:<br />
R69–73.<br />
69. Inoue I, Nakajima T, Williams CS, Quackenbush J, Puryear<br />
R, Powers M, Cheng T, Ludwig EH, Sharma AM,<br />
Hata A, Jeunemaitre X, Lalouel JM. A nucleotide substitution<br />
in the promoter of human angiotensinogen is<br />
associated with essential hypertension and affects basal<br />
transcription in vitro. J Clin Invest 1997;99:1786–97.<br />
70. Wray GA, Hahn MW, Abouheif E, Balhoff JP, Pizer<br />
M, Rockman MV, Romano LA. The evolution of transcriptional<br />
regulation in eukaryotes. Mol Biol Evol<br />
2003;20:1377–419.<br />
71. Wright AF, Carothers AD, Pirastu M. Population choice<br />
in mapping genes <strong>for</strong> complex diseases. Nat Genet<br />
1999;23:397–404.<br />
72. Wooding S, Kim UK, Bamshad MJ, Larsen J, Jorde LB,<br />
Drayna D. Natural selection and molecular evolution<br />
in PTC, a bitter-taste receptor gene. Am J Hum Genet<br />
2004;74:637–46.<br />
73. Ames BN, Elson-Schwab I, Silver EA. High-dose vitamin<br />
therapy stimulates variant enzymes with decreased<br />
coenzyme binding affinity (increased K(m)): Relevance<br />
to genetic disease and polymorphisms. Am J Clin Nutr<br />
2002;75:616–58.<br />
74. Young VR. 2001 W.O. Atwater Memorial Lecture and<br />
the 2001 ASNS President’s Lecture: Human nutrient<br />
requirements: The challenge of the post-genome era. J<br />
Nutr 2002;132:621–9.<br />
75. Siegal ML, Bergman A. Waddington’s canalization revisited:<br />
Developmental stability and evolution. Proc Natl<br />
Acad Sci USA 2002;99:10528–32.<br />
76. Greenspan RJ. The flexible genome. Nat Rev Genet<br />
2001;2:383–7.<br />
77. Stover PJ. Nutritional genomics. Physiol Genomics<br />
2004;16:161–5.<br />
78. Stover PJ. Physiology of folate and vitamin B 12 in health<br />
and disease. Nutr Rev 2004;62(6 pt 2):S3–12; discussion<br />
S13.<br />
79. Brody LC, Conley M, Cox C, Kirke PN, McKeever MP,<br />
Mills JL, Molloy AM, O’Leary VB, Parle-McDermott<br />
A, Scott JM, Swanson DA. A polymorphism, R653Q,<br />
in the trifunctional enzyme methylenetetrahydrofolate<br />
dehydrogenase/methenyltetrahydrofolate cyclohydrolase/<strong>for</strong>myltetrahydrofolate<br />
synthetase is a maternal<br />
genetic risk factor <strong>for</strong> neural tube defects: Report of<br />
the Birth Defects Research Group. Am J Hum Genet<br />
2002;71:1207–15.<br />
80. Ma J, Stampfer MJ, Giovannucci E, Artigas C, Hunter DJ,<br />
Fuchs C, Willett WC, Selhub J, Hennekens CH, Rozen<br />
R. Methylenetetrahydrofolate reductase polymorphism,<br />
<strong>dietary</strong> interactions, and risk of colorectal cancer.<br />
Cancer Res 1997;57:1098–102.<br />
81. Guenther BD, Sheppard CA, Tran P, Rozen R, Matthews<br />
RG, Ludwig ML. The structure and properties of<br />
methylenetetrahydrofolate reductase from Escherichia<br />
coli suggest how folate ameliorates human hyperhomocysteinemia.<br />
Nat Struct Biol 1999;6:359–65.<br />
82. Esposito G, Vitagliano L, Santamaria R, Viola A, Zagari<br />
A, Salvatore F. Structural and functional analysis of aldolase<br />
B mutants related to hereditary fructose intolerance.<br />
FEBS Lett 2002;531:152–6.<br />
83. Fullerton SM, Clark AG, Weiss KM, Nickerson DA,
S114<br />
Taylor SL, Stengard JH, Salomaa V, Vartiainen E, Perola<br />
M, Boerwinkle E, Sing CF. Apolipoprotein E variation at<br />
the sequence haplotype level: Implications <strong>for</strong> the origin<br />
and maintenance of a major human polymorphism. Am<br />
J Hum Genet 2000;67:881–900.<br />
84. Ordovas JM, Corella D. Nutritional genomics. Annu Rev<br />
Genomics Hum Genet 2004;5:71–118.<br />
85. Ordovas JM. The quest <strong>for</strong> cardiovascular health in the<br />
genomic era: Nutrigenetics and plasma lipoproteins.<br />
Proc Nutr Soc 2004;63:145–52.<br />
86. Edmonds DK, Lindsay KS, Miller JF, Williamson E,<br />
Wood PJ. Early embryonic mortality in women. Fertil<br />
Steril 1982;38:447–53.<br />
87. Edwards RG. Recent scientific and medical advances<br />
in assisted human conception. Int J Dev Biol 1997;41:<br />
255–62.<br />
88. Nelen WL, Blom HJ, Steegers EA, den Heijer M, Eskes<br />
TK. Hyperhomocysteinemia and recurrent early<br />
pregnancy loss: A meta-analysis. Fertil Steril 2000;74:<br />
1196–9.<br />
89. Nelen WL, Blom HJ, Steegers EA, den Heijer M, Thomas<br />
CM, Eskes TK. Homocysteine and folate levels as risk<br />
factors <strong>for</strong> recurrent early pregnancy loss. Obstet Gynecol<br />
2000;95:519–24.<br />
90. Nelen WL, Blom HJ, Thomas CM, Steegers EA, Boers<br />
GH, Eskes TK. Methylenetetrahydrofolate reductase<br />
polymorphism affects the change in homocysteine and<br />
folate concentrations resulting from low dose folic acid<br />
supplementation in women with unexplained recurrent<br />
miscarriages. J Nutr 1998;128:1336–41.<br />
91. Shelnutt KP, Kauwell GP, Gregory JF 3rd, Maneval DR,<br />
Quinlivan EP, Theriaque DW, Henderson GN, Bailey<br />
LB. Methylenetetrahydrofolate reductase 677C→T<br />
polymorphism affects DNA methylation in response<br />
to controlled folate intake in young women. J Nutr<br />
Biochem 2004;15:554–60.<br />
92. Hunt JR, Zeng H. Iron absorption by heterozygous<br />
carriers of the HFE C282Y mutation associated with<br />
hemochromatosis. Am J Clin Nutr 2004;80:924–31.<br />
93. Swanson CA. Iron intake and regulation: Implications<br />
<strong>for</strong> iron deficiency and iron overload. Alcohol<br />
2003;30:99–102.<br />
94. Moirand R, Guyader D, Mendler MH, Jouanolle AM,<br />
Le Gall JY, David V, Brissot P, Deugnier Y. HFE <strong>based</strong><br />
re-evaluation of heterozygous hemochromatosis. Am J<br />
Med Genet 2002;111:356–61.<br />
95. Baier LJ, Hanson RL. Genetic studies of the etiology of<br />
type 2 diabetes in Pima Indians: Hunting <strong>for</strong> pieces to a<br />
complicated puzzle. Diabetes 2004;53:1181–6.<br />
96. Tseung CW, McMahon LG, Vazquez J, Pohl J, Gregory JF<br />
3rd. Partial amino acid sequence and mRNA analysis of<br />
cytosolic pyridoxine-beta-D-glucoside hydrolase from<br />
porcine intestinal mucosa: Proposed derivation from<br />
the lactase-phlorizin hydrolase gene. Biochem J 2004;<br />
380(pt 1):211–8.<br />
97. Mackey AD, McMahon RJ, Townsend JH, Gregory<br />
JF 3rd. Uptake, hydrolysis, and metabolism of pyridoxine-5’-beta-D-glucoside<br />
in Caco-2 cells. J Nutr<br />
2004;134:842–6.<br />
98. Seifried HE, Anderson DE, Sorkin BC, Costello RB. Free<br />
radicals: The pros and cons of antioxidants. Executive<br />
summary report. J Nutr 2004;134:3143S–63S.<br />
99. Zeisel SH. Antioxidants suppress apoptosis. J Nutr<br />
P. J. Stover<br />
2004;134:3179S–80S.<br />
100. Csete M, Doyle J. Bow ties, metabolism and disease.<br />
Trends Biotechnol 2004;22:446–50.<br />
101. Pennisi E. Evolution of developmental diversity. Evodevo<br />
devotees eye ocular origins and more. Science<br />
2002;296:1010–1.<br />
102. Pasqualetti M, Neun R, Davenne M, Rijli FM. Retinoic<br />
acid rescues inner ear defects in Hoxa1 deficient mice.<br />
Nat Genet 2001;29:34–9.<br />
103. Finnell RH, Spiegelstein O, Wlodarczyk B, Triplett A,<br />
Pogribny IP, Melnyk S, James JS. DNA methylation in<br />
Folbp1 knockout mice supplemented with folic acid<br />
during gestation. J Nutr 2002;132(8 suppl):2457S–61S.<br />
104. Seckl JR, Meaney MJ. Glucocorticoid programming.<br />
Ann NY Acad Sci 2004;1032:63–84.<br />
105. Seckl JR, Walker BR. Minireview: 11beta-hydroxysteroid<br />
dehydrogenase type 1—a tissue-specific amplifier of glucocorticoid<br />
action. Endocrinology 2001;142:1371–6.<br />
106. McMillen IC, Robinson JS. Developmental origins of<br />
the metabolic syndrome: Prediction, plasticity, and<br />
programming. Physiol Rev 2005;85:571–633.<br />
107. Seckl JR. Prenatal glucocorticoids and long-term programming.<br />
Eur J Endocrinol 2004;151(suppl 3):U49–62.<br />
108. White PC, Mune T, Agarwal AK. 11 beta-Hydroxysteroid<br />
dehydrogenase and the syndrome of apparent<br />
mineralocorticoid excess. Endocr Rev 1997;18:135–56.<br />
109. Bertram C, Trowern AR, Copin N, Jackson AA,<br />
Whorwood CB. The maternal diet during pregnancy<br />
programs altered expression of the glucocorticoid<br />
receptor and type 2 11beta-hydroxysteroid dehydrogenase:<br />
Potential molecular mechanisms underlying the<br />
programming of hypertension in utero. Endocrinology<br />
2001;142:2841–53.<br />
110. Drake AJ, Walker BR, Seckl JR. Intergenerational consequences<br />
of fetal programming by in utero exposure to<br />
glucocorticoids in rats. Am J Physiol Regul Integr Comp<br />
Physiol 2005;288:R34–8.<br />
111. Gat<strong>for</strong>d KL, Wintour EM, De Blasio MJ, Owens JA,<br />
Dodic M. Differential timing <strong>for</strong> programming of glucose<br />
homoeostasis, sensitivity to insulin and blood pressure<br />
by in utero exposure to dexamethasone in sheep.<br />
Clin Sci (Lond) 2000;98:553–60.<br />
112. Valera A, Pujol A, Pelegrin M, Bosch F. Transgenic mice<br />
overexpressing phosphoenolpyruvate carboxykinase<br />
develop non-insulin-dependent diabetes mellitus. Proc<br />
Natl Acad Sci USA 1994;91:9151–4.<br />
113. Rosella G, Zajac JD, Kaczmarczyk SJ, Andrikopoulos<br />
S, Proietto J. Impaired suppression of gluconeogenesis<br />
induced by overexpression of a noninsulin-responsive<br />
phosphoenolpyruvate carboxykinase gene. Mol Endocrinol<br />
1993;7:1456–62.<br />
114. Asipu A, Hayward BE, O’Reilly J, Bonthron DT. Properties<br />
of normal and mutant recombinant human ketohexokinases<br />
and implications <strong>for</strong> the pathogenesis of<br />
essential fructosuria. Diabetes 2003;52:2426–32.<br />
115. Cox TM. The genetic consequences of our sweet tooth.<br />
Nat Rev Genet 2002;3:481–7.<br />
116. Aviv A, Hollenberg NK, Weder AB. Sodium glomerulopathy:<br />
Tubuloglomerular feedback and renal injury in<br />
African Americans. Kidney Int 2004;65:361–8.<br />
117. Messier W, Stewart CB. Episodic adaptive evolution of<br />
primate lysozymes. Nature 1997;385:151–4.<br />
118. Zhang J, Zhang YP, Rosenberg HF. Adaptive evolution
Human nutrition and genetic variation<br />
of a duplicated pancreatic ribonuclease gene in a leafeating<br />
monkey. Nat Genet 2002;30:411–5.<br />
119. Wu W, Goodman M, Lomax MI, Grossman LI. Molecular<br />
evolution of cytochrome C oxidase subunit IV: Evidence<br />
<strong>for</strong> positive selection in simian primates. J Mol<br />
Evol 1997;44:477–91.<br />
120. Wooding SP, Watkins WS, Bamshad MJ, Dunn DM,<br />
Weiss RB, Jorde LB. DNA sequence variation in a 3.7-kb<br />
noncoding sequence 5’ of the CYP1A2 gene: Implications<br />
<strong>for</strong> human population history and natural selection.<br />
Am J Hum Genet 2002;71:528–42.<br />
121. Jacques PF, Bostom AG, Williams RR, Ellison RC,<br />
Eckfeldt JH, Rosenberg IH, Selhub J, Rozen R. Relation<br />
between folate status, a common mutation in methylenetetrahydrofolate<br />
reductase, and plasma homocysteine<br />
concentrations. Circulation 1996;93:7–9.<br />
122. Tsai MY, Yang F, Bignell M, Aras O, Hanson NQ. Relation<br />
between plasma homocysteine concentration, the<br />
844ins68 variant of the cystathionine beta-synthase<br />
gene, and pyridoxal-5’-phosphate concentration. Mol<br />
Genet Metab 1999;67:352–6.<br />
123. Afman LA, Trijbels FJ, Blom HJ. The H475Y polymorphism<br />
in the glutamate carboxypeptidase II gene<br />
increases plasma folate without affecting the risk <strong>for</strong><br />
neural tube defects in humans. J Nutr 2003;133:75–7.<br />
124. Devlin AM, Ling EH, Peerson JM, Fernando S, Clarke R,<br />
Smith AD, Halsted CH. Glutamate carboxypeptidase II:<br />
A polymorphism associated with lower levels of serum<br />
folate and hyperhomocysteinemia. Hum Mol Genet<br />
2000;9:2837–44.<br />
125. Uitterlinden AG, Fang Y, Bergink AP, van Meurs JB, van<br />
Leeuwen HP, Pols HA. The role of vitamin D receptor<br />
gene polymorphisms in bone biology. Mol Cell Endocrinol<br />
2002;197:15–21.<br />
126. Griffiths W, Cox T. Haemochromatosis: Novel gene<br />
discovery and the molecular pathophysiology of iron<br />
metabolism. Hum Mol Genet 2000;9:2377–82.<br />
127. Zhao R, Russell RG, Wang Y, Liu L, Gao F, Kneitz<br />
B, Edelmann W, Goldman ID. Rescue of embryonic<br />
lethality in reduced folate carrier-deficient mice by<br />
maternal folic acid supplementation reveals early neonatal<br />
failure of hematopoietic organs. J Biol Chem 2001;<br />
S115<br />
276:10224–8.<br />
128. Geller DS. A genetic predisposition to hypertension?<br />
Hypertension 2004;44:27–8.<br />
129. Jeck N, Waldegger S, Lampert A, Boehmer C, Waldegger<br />
P, Lang PA, Wissinger B, Friedrich B, Risler T, Moehle R,<br />
Lang UE, Zill P, Bondy B, Schaeffeler E, Asante-Poku S,<br />
Seyberth H, Schwab M, Lang F. Activating mutation of<br />
the renal epithelial chloride channel ClC-Kb predisposing<br />
to hypertension. Hypertension 2004;43:1175–81.<br />
130. Bentzen J, Jorgensen T, Fenger M. The effect of six polymorphisms<br />
in the apolipoprotein B gene on parameters<br />
of lipid metabolism in a Danish population. Clin Genet<br />
2002;61:126–34.<br />
131. Hubacek JA, Pistulkova H, Skodova Z, Berg K, Poledne<br />
R. Association between apolipoprotein B promotor<br />
haplotypes and cholesterol status. Ann Clin Biochem<br />
2001;38(pt 4):399–400.<br />
132. Brown S, Ordovas JM, Campos H. Interaction between<br />
the APOC3 gene promoter polymorphisms, saturated<br />
fat intake and plasma lipoproteins. Atherosclerosis<br />
2003;170:307–13.<br />
133. Hein DW. Molecular genetics and function of NAT1<br />
and NAT2: Role in aromatic amine metabolism and<br />
carcinogenesis. Mutat Res 2002;506–507:65–77.<br />
134. Hein DW, Doll MA, Fretland AJ, Leff MA, Webb SJ,<br />
Xiao GH, Devanaboyina US, Nangju NA, Feng Y.<br />
Molecular genetics and epidemiology of the NAT1 and<br />
NAT2 acetylation polymorphisms. Cancer Epidemiol<br />
Biomarkers Prev 2000;9:29–42.<br />
135. Ferre N, Camps J, Fernandez-Ballart J, Arija V, Murphy<br />
MM, Ceruelo S, Biarnes E, Vilella E, Tous M, Joven J.<br />
Regulation of serum paraoxonase activity by genetic,<br />
nutritional, and lifestyle factors in the general population.<br />
Clin Chem 2003;49:1491–7.<br />
136. Chistyakov DA, Savost’anov KV, Zotova EV, Nosikov<br />
VV. Polymorphisms in the Mn-SOD and EC-SOD genes<br />
and their relationship to diabetic neuropathy in type 1<br />
diabetes mellitus. BMC Med Genet 2001;2:4.<br />
137. Van Landeghem GF, Tabatabaie P, Kucinskas V, Saha<br />
N, Beckman G. Ethnic variation in the mitochondrial<br />
targeting sequence polymorphism of MnSOD. Hum<br />
Hered 1999;49:190–3.
Application of nutrient intake values (NIVs)<br />
Hester H. Vorster, Suzanne P. Murphy, Lindsay H. Allen, and Janet C. King<br />
Abstract<br />
The process of applying nutrient intake values (NIVs)<br />
<strong>for</strong> <strong>dietary</strong> assessment, planning, and implementing<br />
programs is discussed in this paper. In addition to assessing,<br />
monitoring, and evaluating nutritional situations,<br />
applications include planning <strong>food</strong> policies, strategies,<br />
and programs <strong>for</strong> promotion of optimal nutrition and<br />
preventing and treating malnutrition (both over- and<br />
undernutrition). Other applications include nutrition<br />
education, <strong>food</strong> and nutrient legislation, marketing and<br />
labeling, research, product development, <strong>food</strong> procurement<br />
and trade (import and export), <strong>food</strong> aid, and<br />
therapeutic (clinical) nutrition. Specific examples of<br />
how NIVs are used to develop <strong>food</strong> labels, <strong>for</strong>tification<br />
policies, and <strong>food</strong>-<strong>based</strong> <strong>dietary</strong> <strong>guidelines</strong> are described.<br />
Applications in both developed and developing countries<br />
are also described. In summary, NIVs are the scientific<br />
backbone of all aspects of nutrition policy in countries<br />
and regions worldwide.<br />
Key words: Diet assessment, diet planning, <strong>dietary</strong><br />
<strong>guidelines</strong>, <strong>food</strong> <strong>for</strong>tification, <strong>food</strong> labeling, nutrient<br />
recommendations<br />
Hester H. Vorster is affiliated with North-West University<br />
(Potchefstroom Campus), Potchefstroom, South Africa;<br />
Suzanne P. Murphy is affiliated with the University of Hawaii,<br />
Honolulu, Hawaii, USA; Lindsay H. Allen is affiliated with the<br />
US Department of Agriculture, Agricultural Research Service,<br />
Western Human Nutrition Research Center, University of<br />
Cali<strong>for</strong>nia, Davis, Cali<strong>for</strong>nia, USA; Janet C. King is affiliated<br />
with Children’s Hospital Oakland Research Institute and the<br />
University of Cali<strong>for</strong>nia at Berkeley and Davis, Oakland,<br />
Cali<strong>for</strong>nia, USA.<br />
Please direct queries to the corresponding author: Hester<br />
H. Vorster, Faculty of Health Sciences, NWU (Potchefstroom<br />
Campus), Potchefstroom 2520, South Africa; e-mail: Este.<br />
Vorster@nwu.ac.za.<br />
S116<br />
Introduction<br />
As mentioned elsewhere in this supplement to the<br />
Food and Nutrition Bulletin [1–3], harmonization of<br />
the process and methods to establish nutrient intake<br />
values (NIVs) provides a common basis <strong>for</strong> the uses<br />
and applications of these values across countries and<br />
regions of the world. In the paper by Murphy et al. [3],<br />
methods <strong>for</strong> using NIVs to assess nutritional status,<br />
policy planning, and development of strategies and<br />
programs contributing to optimal nutritional health<br />
of individuals, groups, and populations are described.<br />
The main objectives of this paper are to highlight some<br />
of the applications of NIVs, to show how the new proposed<br />
terminology and methods of derivation improve<br />
the ability to develop realistic, achievable nutrient goals<br />
in developed and developing countries, and to provide<br />
specific examples of how the NIVs can be used to establish<br />
<strong>food</strong> labels, make decisions about <strong>for</strong>tification, and<br />
derive <strong>food</strong>-<strong>based</strong> <strong>dietary</strong> <strong>guidelines</strong>.<br />
The terms used to describe the components of a set<br />
of NIVs are as follows. The framework used to derive<br />
these values is described in the paper by King et al. [2].<br />
Nutrient intake values (NIVs) is the umbrella term<br />
<strong>for</strong> a set of specific nutrient standards. At least three<br />
different values should be derived: an average nutrient<br />
requirement (ANR), an individual nutrient intake level<br />
(INL x ), and an upper nutrient level (UNL). Detailed<br />
definitions of these terms follow. The US/Canadian<br />
set of nutrient standards is called the <strong>dietary</strong> reference<br />
intakes (DRIs); in Britain they are called <strong>dietary</strong> reference<br />
values (DRVs).<br />
The average, or mean, nutrient requirement (ANR)<br />
is estimated from a statistical distribution of requirements<br />
<strong>for</strong> a specific criterion (e.g., to prevent a deficiency<br />
or maintain body stores) <strong>for</strong> specific life-stage<br />
(age) and gender (sex) groups. In the US/Canadian<br />
and UK recommendations, this value is called the<br />
estimated average requirement (EAR), while the European<br />
Communities use the term average requirement<br />
intake (ARI).<br />
The individual nutrient intake level (INL x ) is the<br />
Food and Nutrition Bulletin, vol. 28, no. 1 (supplement) © 2007, The <strong>United</strong> <strong>Nations</strong> University.
Application of nutrient intake values<br />
recommended intake <strong>for</strong> all healthy individuals in a<br />
specific subpopulation. If set at 2 SD above the ANR,<br />
the INL x would be INL 98. It could be set lower if <strong>food</strong><br />
policies or <strong>food</strong> supplies in a country or region do not<br />
permit achieving an intake at the 98th percentile <strong>for</strong><br />
all healthy individuals. Other terms used to describe<br />
this value include the recommended <strong>dietary</strong> allowance<br />
(RDA) by the <strong>United</strong> States and Canada, the reference<br />
nutrient intake (RNI) by the <strong>United</strong> Kingdom, and the<br />
population reference intake (PRI) by the European<br />
Communities.<br />
The upper nutrient level (UNL) is the highest level<br />
of intake that is likely to pose no risk of adverse health<br />
effects <strong>for</strong> almost all individuals in a specific life-stage<br />
and sex group. The USA/Canada developed a comparable<br />
term, which was called the upper tolerable nutrient<br />
intake level (UL).<br />
General framework<br />
NIVs are used in many different ways to promote<br />
optimal nutrition and to prevent and treat under- and<br />
�<br />
�����������<br />
������<br />
��������<br />
�<br />
����������<br />
������������<br />
����������<br />
����������<br />
�<br />
����<br />
���<br />
����<br />
���<br />
�<br />
����������������������<br />
�������������� �� ������<br />
��� ��������<br />
S117<br />
overnutrition. Figure 1 illustrates the “pathway” of<br />
applications, showing how planning of nutritional<br />
policies, strategies, programs, regulatory frameworks,<br />
legislation, etc. should be <strong>based</strong> on the results of assessment<br />
and surveillance of nutritional status. Policies<br />
and planning, usually done by the government, lead<br />
to nutritional actions, interventions, or programs. The<br />
outcomes of these interventions should be evaluated<br />
and monitored on a regular basis to influence adjustments<br />
in planning if necessary. NIVs are used <strong>for</strong> all<br />
these steps in the assessment, planning, and evaluation<br />
process <strong>for</strong> both groups and individuals.<br />
Specific applications of NIVs<br />
A brief overview of the many different applications<br />
[4] of NIVs affecting nearly all aspects of <strong>food</strong> and<br />
nutrition policy and practice is described below. Specific<br />
descriptions of how the NIVs are used to derive<br />
<strong>food</strong> labels, make decisions about <strong>food</strong> <strong>for</strong>tification,<br />
and develop <strong>food</strong>-<strong>based</strong> <strong>dietary</strong> <strong>guidelines</strong> are also<br />
provided.<br />
�<br />
�������� ���������<br />
��������<br />
����������<br />
��������<br />
���������� ����������<br />
�������<br />
������������ ������<br />
���������<br />
FIG. 1. A framework <strong>for</strong> a pathway of application of nutrient intake values (NIVs)
S118<br />
Assessment, surveillance, or monitoring<br />
of nutritional situations<br />
Nutritional monitoring programs generally involve<br />
an assessment of nutritional risks, identification of<br />
the gaps or excesses in nutrient intakes of individuals<br />
or groups, planning of appropriate interventions, and<br />
monitoring of the results. NIVs are used to identify<br />
nutrient inadequacies or excesses of various population<br />
groups or individuals; they can also be used to<br />
estimate the percentage of the population at risk <strong>for</strong><br />
inadequate or excessive intakes and to determine the<br />
impact of nutrition programs on the prevalence of low<br />
or excessive intakes over time in the target populations<br />
and/or subgroups. For example, NIVs were used to<br />
evaluate the prevalence of low nutrient intakes among<br />
the participants in the Special Supplemental Nutrition<br />
Program <strong>for</strong> Women, Infants, and Children (WIC) in<br />
the <strong>United</strong> States [5]. The NIVs can also be used to<br />
evaluate the adequacy of a country’s or region’s <strong>food</strong><br />
supply to meet the nutritional needs of the population<br />
and to examine trends in nutrient consumption<br />
over time.<br />
Nutrition policy, regulatory frameworks, legislation,<br />
strategy, and program planning<br />
Although <strong>food</strong> and nutrition policy often is a national<br />
responsibility, many countries depend on international<br />
organizations <strong>for</strong> guidance in <strong>for</strong>mulating policies.<br />
These organizations include the World Bank and<br />
several <strong>United</strong> <strong>Nations</strong> organizations and agencies<br />
such as the World Health Organization (WHO), the<br />
Food and Agriculture Organization (FAO), the <strong>United</strong><br />
<strong>Nations</strong> International Children’s Fund (UNICEF), the<br />
<strong>United</strong> <strong>Nations</strong> Educational, Scientific, and Cultural<br />
Organization (UNESCO), the <strong>United</strong> <strong>Nations</strong> University<br />
(UNU), the <strong>United</strong> <strong>Nations</strong> Development Program<br />
(UNDP), the <strong>United</strong> <strong>Nations</strong> World Food Programme<br />
(WFP), and others. All of these organizations use NIVs<br />
to plan, develop, and define policies that support <strong>food</strong><br />
and nutrition security and safety at all levels, including<br />
individuals, households, communities, vulnerable<br />
groups within communities, and whole populations.<br />
For example, the program <strong>for</strong> feeding refugees developed<br />
by the FAO is <strong>based</strong> on NIVs.<br />
Food and nutrition interventions<br />
NIVs are used to plan and design interventions such<br />
as <strong>food</strong> <strong>for</strong>tification and supplementation programs,<br />
school nutrition programs, changes in the <strong>food</strong> supply,<br />
and other interventions to improve the nutritional<br />
status of individuals and groups. NIVs are also frequently<br />
used to evaluate the eligibility <strong>for</strong> specific<br />
programs and to monitor the outcomes of interventions.<br />
Specific uses of NIVs include planning meals,<br />
<strong>food</strong> purchases, and budgeting decisions <strong>for</strong> intervention<br />
programs. NIVs can be used to determine if the<br />
goals of the interventions are reached by comparing<br />
postintervention intakes of individuals and groups<br />
with values collected at baseline; failure to reach goals<br />
provides a basis <strong>for</strong> modifying the intervention program.<br />
Use of the ANR <strong>for</strong> assessing the impact of a<br />
program in specific individuals will provide quantitative<br />
data on the number of individuals with improved<br />
nutrient intakes. Be<strong>for</strong>e having an ANR <strong>for</strong> estimating<br />
prevalence of adequacy, program planners could only<br />
make qualitative statements about the effectiveness of<br />
the intervention.<br />
Food and nutrition education<br />
NIVs are used per se or translated into <strong>food</strong>-<strong>based</strong><br />
<strong>dietary</strong> <strong>guidelines</strong> to educate individual consumers,<br />
health personnel, or groups of people on how to select<br />
optimal diets to meet nutritional requirements, how<br />
to interpret nutrition labels on <strong>food</strong> products, and<br />
how to evaluate nutrition advertising in the media.<br />
Thus, NIVs should provide the basis <strong>for</strong> all <strong>food</strong> and<br />
nutrition education programs in a country or region.<br />
For example, the first step in deriving any nutrition<br />
education program should be an assessment of nutrient<br />
shortfalls and excesses among the target population.<br />
Most countries and regions develop <strong>food</strong>-<strong>based</strong> <strong>dietary</strong><br />
<strong>guidelines</strong> (pyramids, plates, etc.) to assist individuals<br />
in making good <strong>food</strong> choices. A detailed description<br />
of how to translate NIVs into <strong>food</strong>-<strong>based</strong> <strong>guidelines</strong><br />
follows in the next section. The goal should be to provide<br />
guidance <strong>for</strong> how populations can meet the INLx<br />
without exceeding the UNL.<br />
Nutrition research<br />
NIVs are used to design research studies <strong>for</strong> determining<br />
nutrient functions, the relationships between<br />
nutrient intakes and health or disease, nutrient–nutrient<br />
interactions, nutrient–gene interactions, and other<br />
nutrient issues. For example, NIVs are used to assess<br />
the association between the intake of nutrients and/or<br />
other <strong>dietary</strong> components and the risk of cardiovascular<br />
disease, cancer, diabetes, and other long-term<br />
disorders in clinical and epidemiologic studies. Data<br />
from large-scale population studies have been used<br />
to set standards of intake <strong>for</strong> the percentage of energy<br />
from carbohydrate, protein, and fat to reduce the risk<br />
of chronic disease.<br />
Product development<br />
H. H. Vorster et al.<br />
Using specific, quantitative in<strong>for</strong>mation on the effect<br />
of specific nutrients or <strong>food</strong> components on health<br />
outcomes, NIVs may be used to design and develop<br />
new technologies and new <strong>food</strong> products with health
Application of nutrient intake values<br />
benefits. These <strong>food</strong>s may be called “functional <strong>food</strong>s”<br />
[6]. Studies of functional <strong>food</strong>s are an active area of<br />
research to identify the active component(s) in specific<br />
<strong>food</strong>s associated with health outcomes and the<br />
dose–response relationship with this component(s).<br />
An ANR and a UNL are needed <strong>for</strong> these components<br />
to derive a safe or acceptable range of intake and to<br />
evaluate the safety of the new product.<br />
Therapeutic (clinical) nutrition/dietetics<br />
Although NIVs are derived <strong>for</strong> healthy people, these<br />
values are frequently used as the basis <strong>for</strong> planning<br />
therapeutic diets <strong>for</strong> patients suffering from various<br />
diseases, since no other standard is available. Adjustments<br />
in the values are made whenever possible, using<br />
in<strong>for</strong>mation about the disease process and nutrient<br />
metabolism. For example, certain adjustments may be<br />
made in the diets of individuals suffering from infections<br />
in order to enhance their immune function [7].<br />
Diet manuals of hospitals and professional medical<br />
organizations and societies often provide the criteria<br />
used to modify the intake of specific nutrients in menus<br />
<strong>for</strong> patients.<br />
Food procurement <strong>for</strong> institutions and groups<br />
Institutions such as schools, hostels, nursing homes,<br />
the military, prison services, etc., use NIVs <strong>for</strong> planning<br />
menus and procuring <strong>food</strong>s. The INL x should be<br />
used as the basis <strong>for</strong> menu planning. However, since<br />
individuals and groups fed in institutions vary widely<br />
in age, lifestyle habits (e.g., smoking), physical activity,<br />
and nutritional and health status, the menu planners<br />
will need to select the standard most appropriate <strong>for</strong><br />
the group as a whole. Ideally, nutrient intakes should<br />
be carefully monitored to ensure that practically all of<br />
the individuals have intakes above the EAR and very<br />
few exceed the UNL.<br />
Food import, export, and subsidies<br />
Governments, agencies, and businesses (industry) use<br />
NIVs to motivate and <strong>for</strong>mulate policies and actions<br />
regarding <strong>food</strong> import, export, and subsidies. The<br />
paper by Ramaswamy and Viswanathan [8] in this issue<br />
outlines the importance of using a set of standards with<br />
a common basis in international trade.<br />
Specific uses of NIVs <strong>for</strong> <strong>food</strong> labeling,<br />
<strong>food</strong> <strong>for</strong>tification, and derivation of <strong>food</strong><strong>based</strong><br />
<strong>dietary</strong> <strong>guidelines</strong><br />
Food labels<br />
Dietary reference standards are used to label and<br />
S119<br />
market products by comparing the nutrient composition<br />
of the product (usually per 100 g or serving size)<br />
with recommended intakes.<br />
In most instances the INL 98 (RDAs, RNIs, or PRIs)<br />
are used to compare the contribution of the particular<br />
product with a reference standard, often expressed as<br />
a percentage. For example, in the <strong>United</strong> States the reference<br />
standard <strong>for</strong> vitamin C is 60 mg/day, so a glass<br />
of orange juice that provides about 95 mg of vitamin<br />
C would be labeled as having 160% of this standard.<br />
However, a recent committee of the Institute of Medicine<br />
recommended that the EAR (ANR), rather than<br />
the RDA, be used as the nutrient standard, because<br />
this standard is the best estimate of a consumer’s actual<br />
requirement [9]. Others have argued that the RDA<br />
should continue to be the basis of the standard <strong>for</strong><br />
<strong>food</strong> and <strong>dietary</strong> supplement labels, because this higher<br />
standard should be adequate <strong>for</strong> almost all healthy<br />
individuals and is more consistent with the educational<br />
objectives of the <strong>food</strong> label [10].<br />
Food labels also serve as a basis <strong>for</strong> nutrient content<br />
claims and in some products <strong>for</strong> health claims. For<br />
nutrient content claims on the <strong>food</strong> label, such as a<br />
claim that the <strong>food</strong> is a good source of a particular<br />
nutrient, many countries legislate the minimum percentage<br />
of the INL 98 (RDA or other standard) that a<br />
portion or serving usually consumed should provide.<br />
Likewise, <strong>for</strong> a health claim, <strong>for</strong> example one with<br />
regard to lowering neural tube defects, the <strong>food</strong> or<br />
product must be a good source of folate.<br />
The <strong>food</strong> industry often uses <strong>food</strong> labels to promote<br />
the nutritional benefits of products. The challenge is<br />
to harmonize the specific nutrient reference standard<br />
to be used, the <strong>guidelines</strong> <strong>for</strong> classifying a product as a<br />
good source of the nutrient, and the circumstances that<br />
will allow a health claim. With increasing international<br />
trade, developing comparable practices in different<br />
countries in a way that will be understood by most<br />
consumers will become more urgent.<br />
Food <strong>for</strong>tification<br />
Food <strong>for</strong>tification is a very cost-effective intervention<br />
to address micronutrient deficiencies. Types of<br />
<strong>for</strong>tification include mass (mandatory) <strong>for</strong>tification of<br />
staples, market-driven (voluntary), as in the addition<br />
of micronutrients to ready-to-eat cereals, or targeted<br />
to special groups in the population such as complementary<br />
<strong>food</strong>s <strong>for</strong> young children. The use of NIVs is<br />
necessary to assess the prevalence of inadequate intakes<br />
of specific nutrients and to calculate appropriate levels<br />
of <strong>for</strong>tification. Specifically, using <strong>food</strong> intake data<br />
from a relatively small number of individuals from<br />
each population group of concern, the prevalence of<br />
intakes below the ANR is calculated. Then the effect<br />
of adding different levels of <strong>for</strong>tificant nutrients to one<br />
or more staple <strong>food</strong>s can be simulated, with the opti-
S120<br />
mal level of <strong>for</strong>tification being that which minimizes<br />
the prevalence of intakes below the ANR and above<br />
the UNL. An example of this approach is provided by<br />
WHO/FAO in its Guidelines on Food Fortification with<br />
Micronutrients [11].<br />
Food-<strong>based</strong> <strong>dietary</strong> <strong>guidelines</strong><br />
Food-<strong>based</strong> <strong>dietary</strong> <strong>guidelines</strong> translate scientific<br />
in<strong>for</strong>mation on nutrient requirements and <strong>dietary</strong><br />
characteristics that promote good health into recommendations<br />
and advice <strong>for</strong> the general public. Thus,<br />
<strong>food</strong>-<strong>based</strong> <strong>guidelines</strong> are the backbone of nutrition<br />
education ef<strong>for</strong>ts throughout the country, and they also<br />
reflect the nutrition policy of a country.<br />
The NIVs <strong>for</strong> a country that include the three<br />
components (ANR, INL x , and UNL) can be used to<br />
develop <strong>food</strong>-<strong>based</strong> <strong>dietary</strong> <strong>guidelines</strong> and patterns<br />
to assist the general public in selecting a diet that<br />
meets their nutrient needs. Often <strong>food</strong>-<strong>based</strong> <strong>dietary</strong><br />
<strong>guidelines</strong> emphasize the importance of consuming a<br />
variety of nutrient-dense <strong>food</strong>s and beverages within<br />
and among the basic <strong>food</strong> groups used in the country,<br />
i.e., fruits; vegetables; grains; meat, fish, poultry, beans,<br />
and nuts; and fats and oils. Specific <strong>food</strong> patterns<br />
quantify the amounts needed from each <strong>food</strong> group<br />
<strong>for</strong> individuals in various age and sex groups. A <strong>food</strong><br />
pattern can be developed using the following five-step<br />
process. This process was developed by the US Department<br />
of Agriculture and used to develop the new My<br />
Pyramid, which shows Americans how to meet their<br />
RDAs [12].<br />
1. Establish nutrition goals <strong>for</strong> the <strong>food</strong> pattern. The<br />
nutrient goals should be the INL x values <strong>for</strong> vitamins,<br />
minerals, electrolytes, and macronutrients,<br />
as developed by the country or region.<br />
2. Establish energy levels. Modifications of the <strong>food</strong><br />
pattern can be developed <strong>for</strong> energy levels that<br />
cover the needs of all members of the population<br />
above 2 years of age. For example, 12 different <strong>food</strong><br />
patterns could be developed with energy values<br />
ranging from 1,000 to 3,200 kcal/day in 200-kcal<br />
increments.<br />
3. Assign nutrient goals to each specific energy level.<br />
The nutritional values assigned to each energy<br />
level are the INL x values <strong>for</strong> age and sex groups<br />
that most closely match that specific energy level.<br />
For example, the 1,800 kcal/day level might be the<br />
highest INL x value recommended <strong>for</strong> women aged<br />
31 to 50 years, men and women aged 9 to 13 years,<br />
and women aged 14 to 18 years.<br />
4. Assign a nutrient value <strong>for</strong> each <strong>food</strong> group and<br />
subgroup. The nutrient values <strong>for</strong> <strong>food</strong> groups and<br />
subgroups used in My Pyramid were developed in<br />
the following way [12]. The nutrient values assigned<br />
to each <strong>food</strong> group (i.e., fruits, milk, meat and<br />
beans, whole grains, enriched grains, dark-green<br />
leafy vegetables, orange vegetables, legumes, starchy<br />
vegetables, and other vegetables) were the weighted<br />
average nutritional value of <strong>food</strong>s consumed by<br />
Americans within that group <strong>based</strong> on the results<br />
of the nationwide <strong>food</strong>-consumption surveys (the<br />
USDA Continuing Survey of Food Intakes by Individuals,<br />
1994-96). For example, broccoli constitutes<br />
53% of the dark-green leafy vegetables consumed,<br />
spinach 20%, and other vegetables the remaining<br />
27%. There<strong>for</strong>e, the nutritional value of dark-green<br />
vegetables was 0.53 <strong>for</strong> broccoli, 0.20 <strong>for</strong> spinach,<br />
and 0.27 <strong>for</strong> other <strong>food</strong>s. The <strong>for</strong>m of milk and meat<br />
with the lowest fat content was used exclusively.<br />
Thus, fat-free milk was the single <strong>food</strong> item used<br />
<strong>for</strong> the dairy group.<br />
5. Determine the daily intake amounts <strong>for</strong> each <strong>food</strong><br />
group or subgroup. The amounts of each <strong>food</strong> group<br />
or subgroup were increased or decreased in an<br />
iterative manner until the pattern <strong>for</strong> each energy<br />
level meet its nutritional goal (i.e., INL x ) or came<br />
within a reasonable range.<br />
Use of NIVs in developing countries<br />
H. H. Vorster et al.<br />
NIVs may be particularly useful to policy makers in<br />
developing countries <strong>for</strong> reducing the prevalence of<br />
nutrient inadequacies and preventing excessive intakes<br />
of other <strong>food</strong> components. The nutrition transition<br />
currently occurring in many developing countries<br />
[13] provides evidence that both underconsumption<br />
and overconsumption are present within the same<br />
population. An advantage of the NIVs, described in the<br />
paper by King et al. [1] in this issue, is that individual<br />
countries can determine their own specific nutrient<br />
goals within the context of the entire harmonization<br />
process. For example, if animal source <strong>food</strong>s are scarce<br />
in a developing country, policy makers may decide to<br />
set the INL x <strong>for</strong> zinc and iron at 1 SD above the average<br />
nutrient level (INL 67 ) instead of 2 SD (INL 98 ).<br />
The general applications of nutrient standards <strong>for</strong><br />
populations living in developing countries (i.e., <strong>dietary</strong><br />
assessments, developing targeted intervention programs<br />
such as <strong>food</strong> aid programs, and evaluating or monitoring<br />
these programs) parallel similar applications in<br />
developed countries, although the scale and scope of<br />
the programs may differ. Many uses of the NIVs in<br />
feeding and intervention programs require making<br />
adjustments in the measurements of nutrient intake to<br />
account <strong>for</strong> day-to-day variation. These adjustments<br />
are usually made by using 2 or more days of estimated<br />
intakes from the target population. Although diets in<br />
developing countries may appear to be monotonous,<br />
it cannot be assumed that it is unnecessary to make<br />
adjustments <strong>for</strong> day-to-day variation; the <strong>food</strong> supply<br />
is often less predictable than in wealthier populations.<br />
Thus, a similar adjustment protocol should be followed<br />
in all populations [4].
Application of nutrient intake values<br />
The high prevalence of micronutrient deficiencies<br />
or the widespread prevalence of disease, such<br />
as HIV/AIDS, will probably have an impact on the<br />
actual amounts of the NIVs established in some of<br />
the developing countries. For example, countries<br />
with a high prevalence of HIV/AIDS may want to set<br />
different standards <strong>for</strong> nutrients known to influence<br />
immune function. Also, typical <strong>food</strong>s consumed in<br />
these countries may be high in phytate, which reduces<br />
the bioavailability of minerals <strong>for</strong> absorption. Ideally,<br />
NIVs should be derived from studies of the nutrient<br />
requirements in representative individuals consuming<br />
typical diets from the population in each country. If<br />
experimental data on nutrient requirements are not<br />
available from the country’s population, extrapolations<br />
can be made from published data of similar populations<br />
in other countries or regions.<br />
Thus, the basic uses of NIVs are similar in developed<br />
and developing countries, but the specific application<br />
may require unique decisions about goals and policies<br />
as well as specific adjustments in the actual quantities<br />
of nutrients recommended <strong>based</strong> on the <strong>food</strong> supply<br />
and general health of the population.<br />
Potential users of NIVs<br />
There is a wide variety of potential users of NIVs,<br />
including international organizations such as UN<br />
agencies; nongovernmental organizations (NGOs);<br />
governments (from local to district to national level);<br />
researchers from the disciplines of nutrition, <strong>food</strong>s,<br />
medicine, biochemistry, policy, etc.; health professionals,<br />
including doctors, dieticians, nutritionists,<br />
nurses, etc.; the <strong>food</strong> industry; institutions (hostels,<br />
homes, schools, the military, prisons, etc.); and caterers<br />
and restaurateurs, as well as the public (individual<br />
consumers and small community groups). The UN<br />
agencies and organizations, NGOs, and governments<br />
use the nutrient-<strong>based</strong> <strong>dietary</strong> standards to identify<br />
nutrient requirements of populations to <strong>for</strong>mulate<br />
<strong>food</strong> and nutrition policy <strong>for</strong> <strong>food</strong> aid, supplements,<br />
rationing, <strong>for</strong>tification, education, legislation, export<br />
and import of <strong>food</strong>s, and subsidies <strong>for</strong> certain <strong>food</strong>s<br />
References<br />
1. King JC, Garza C. Executive summary. Food Nutr Bull<br />
2007;28(suppl):S3–12.<br />
2. King JC, Vorster HH, Tome DG. Nutrient intake<br />
values (NIVs): A recommended terminology and<br />
framework <strong>for</strong> the derivation of values. Food Nutr Bull<br />
2007;28(suppl):S16–26.<br />
3. Murphy SP, Vorster HH. Methods <strong>for</strong> using nutrient<br />
intake values (NIVs) to assess or plan nutrient intakes.<br />
Food Nutr Bull 2007;28(suppl):S51–60.<br />
4. Institute of Medicine. Dietary reference intakes. Applica-<br />
S121<br />
or <strong>for</strong> producers of <strong>food</strong>s [14]. The <strong>food</strong> industry uses<br />
these standards to develop new <strong>food</strong> products that will<br />
respond to consumers’ needs <strong>for</strong> healthy choices and<br />
to market <strong>food</strong>s by using nutrient labeling. Health professionals<br />
and researchers may use the nutrient-<strong>based</strong><br />
reference standards to assess the nutritional adequacy<br />
of diets, plan appropriate corrective interventions, and<br />
evaluate these interventions [14]. Institutions, caterers,<br />
and restaurateurs use the reference standards to assess<br />
<strong>food</strong> requirements, make procurement decisions, and<br />
plan menus. Consumers use the standards to interpret<br />
the nutrition in<strong>for</strong>mation provided by the media and<br />
on <strong>food</strong> labels.<br />
It is the responsibility of nutrition scientists involved<br />
in establishing NIVs to in<strong>for</strong>m and educate the users<br />
about the appropriate interpretation of the NIVs and<br />
the appropriate use of the three different values (ANR,<br />
INL x, and UNL). It is also the responsibility of those<br />
doing nutrition interventions, such as <strong>food</strong> <strong>for</strong>tification,<br />
to use the NIVs because these interventions have<br />
a direct effect on public health.<br />
Conclusions<br />
Expanding the NIVs to include an average nutrient<br />
requirement (ANR), an individual nutrient level<br />
(INL x ), and an upper nutrient level (UNL) expands<br />
the potential uses of these standards. The three components<br />
of a set of NIVs are derived from a distribution<br />
of requirements <strong>for</strong> a nutrient <strong>for</strong> a specific function.<br />
The standards can be used <strong>for</strong> a broad range of functions—from<br />
the assessment, surveillance, monitoring,<br />
and evaluation of nutritional situations, to in<strong>for</strong>ming<br />
the <strong>for</strong>mulation of policy and strategies, to planning<br />
and designing a large variety of appropriate interventions,<br />
and to evaluating the outcomes of these interventions<br />
in individuals and groups. A number of potential<br />
users, ranging from international organizations, NGOs,<br />
governments, industry, health professionals, to institutions<br />
and individual consumers, have been identified.<br />
All of these users should be targeted in educational<br />
ef<strong>for</strong>ts to promote the correct use of the NIVs.<br />
tions in <strong>dietary</strong> assessment. Washington, DC: National<br />
Academy Press, 2000.<br />
5. Institute of Medicine. WIC <strong>food</strong> packages: time <strong>for</strong> a<br />
change. Washington DC: National Academies Press,<br />
2006.<br />
6. Vorster HH, Hautvast J. Introduction to human nutrition:<br />
a global perspective on <strong>food</strong> and nutrition. In: Gibney MJ,<br />
Vorster HH, Kok FJ, eds. Introduction to human nutrition.<br />
Ox<strong>for</strong>d, UK: Blackwell Science, 2002:1–11.<br />
7. Yaqoob P, Calder PC. The immune and inflammatory
S122<br />
systems. In: Gibney MJ, MacDonald IA, Roche HJ, eds.<br />
Nutrition and metabolism. Ox<strong>for</strong>d, UK: Blackwell Science,<br />
2003:284–306.<br />
8. Ramaswamy S, Viswanathan B. Trade, development, and<br />
regulatory issues in <strong>food</strong>. Food Nutr Bull 2007;28(suppl):<br />
S123–40.<br />
9. Institute of Medicine. Dietary reference intakes. Guiding<br />
principles of nutrition labeling and <strong>for</strong>tification.<br />
Washington DC: National Academies Press, 2003.<br />
10. Murphy SP, Barr SI. Recommended <strong>dietary</strong> allowances<br />
should be used to set daily values <strong>for</strong> nutrition labeling.<br />
Am J Clin Nutr 2006;83:1223S–7S.<br />
H. H. Vorster et al.<br />
11. World Health Organization. Guidelines on <strong>food</strong> <strong>for</strong>tification<br />
with micronutrients <strong>for</strong> the control of micronutrient<br />
malnutrition. Geneva: WHO, 2006.<br />
12. Dietary Guidelines Advisory Committee. Report of the<br />
Dietary Guidelines Advisory Committee on the Dietary<br />
Guidelines <strong>for</strong> Americans, 2005. Springfield, Va, USA:<br />
National Technical In<strong>for</strong>mation Service, 2005.<br />
13. Popkin BM. The nutrition transition in low-income<br />
countries: an emerging crisis. Nutr Rev 1994;52:285–98.<br />
14. Younger KM. Dietary reference standards. In: Gibney MJ,<br />
Vorster HH, Kok FJ, eds. Introduction to human nutrition.<br />
Ox<strong>for</strong>d, UK: Blackwell Science, 2002:116–24.
Trade, development, and regulatory issues in <strong>food</strong><br />
Sunder Ramaswamy and Brinda Viswanathan<br />
Abstract<br />
Trade in <strong>food</strong> and animal products has increased several-fold<br />
in the past decade, and simultaneously regulations<br />
governing the movement of such products across<br />
national boundaries have also increased. The present<br />
study reviews harmonization in <strong>food</strong> trade regulation by<br />
focusing on nutritional aspects to understand its role in<br />
enhancing world trade on the one hand and consumer<br />
interest and welfare on the other. Harmonization to a<br />
large extent brings in more regulation from the developed<br />
world acting through their governments, consumer<br />
organizations, and multinational companies; it does not<br />
seem to address, in general, the concerns of the large segments<br />
of the poor population <strong>for</strong> whom agriculture and<br />
<strong>food</strong> trade are the main sources of livelihood. There is a<br />
lack of quantifiable estimates of the loss in well-being of<br />
the disadvantaged. However, there is substantial research<br />
focused on the potential harm to developed nations as<br />
a result of nonadherence to the rules. Clearly, lack of<br />
adequate infrastructure, resource constraints, and weak<br />
institutions not only result in poor <strong>food</strong> safety regulation<br />
within developing countries but also remain barriers to<br />
realizing the greater potential benefits from increased<br />
trade. Harmonization of standards would have some<br />
losers and some winners, but to make it more inclusive,<br />
scientific knowledge alone may not be adequate; social<br />
and cultural aspects also need to be considered, since<br />
<strong>food</strong> systems differ among regions, with varying preferences,<br />
local resource availability, and levels of economic<br />
development. Improvement in governance in many<br />
countries not only would ensure better participation in<br />
international rule-making and the negotiation process<br />
<strong>for</strong> fairer trade but also would result in effective domestic<br />
legislation to ensure safer health <strong>for</strong> citizens, resulting in<br />
higher overall well-being.<br />
Sunder Ramaswamy is affiliated with Middlebury College,<br />
Middlebury, Vermont, USA; Brinda Viswanathan is affiliated<br />
with the Madras School of Economics, Chennai, India.<br />
Please direct queries to the corresponding author: Sunder<br />
Ramaswamy, Department of Economics, Middlebury College,<br />
Middlebury, VT 05753, USA; e-mail: sunder.ramaswamy@<br />
middlebury.edu.<br />
Key words: Food safety, SPS and TBT agreements,<br />
trade in <strong>food</strong><br />
Introduction<br />
At the dawn of this century, the value of international<br />
trade in <strong>food</strong> exceeded US$400 billion per annum (with<br />
the estimated total value of international trade being<br />
US$6.5 trillion) and accounted <strong>for</strong> on the order of 500<br />
million tons of <strong>food</strong> products, and on average the trade<br />
has continued to grow significantly since then [1]. The<br />
dominant share belongs to the developed countries in<br />
terms of both exports and imports. The trade share of<br />
developing countries has increased over the years, but<br />
developing countries remain mainly exporters of primary<br />
products and importers of processed <strong>food</strong>. The<br />
present trade scenario is complicated by several factors:<br />
the presence of World Trade Organization (WTO) rules<br />
since its inception in 1995 on the one hand, and innovations<br />
such as genetically modified <strong>food</strong>s and <strong>food</strong><br />
<strong>for</strong>tification, with lowered immunity of the populations<br />
in developed countries on the other. The complication<br />
in the trading rules arises from the varying standards<br />
set by importing nations. Most often the differences<br />
between trade and regulatory standards arise from the<br />
lack of concrete scientific evidence on the potential<br />
health impacts, and there<strong>for</strong>e the justification of such<br />
standards is questioned. Thus, smooth facilitation of<br />
trade calls <strong>for</strong> a harmonization of <strong>food</strong> safety standards<br />
that are transparent and easy to comply with.<br />
International <strong>food</strong> safety standards have prevailed <strong>for</strong><br />
a very long time and so has trade in <strong>food</strong>; but why the<br />
need <strong>for</strong> harmonization now? The world population<br />
will reach 8 billion by 2020, with about 96% of growth<br />
concentrated in the developing world. Overall increases<br />
in population and, in particular, increases in urban<br />
population pose great challenges to the <strong>food</strong> systems<br />
of the world, from production to distribution to consumption.<br />
With greater emphasis on trade as an engine<br />
of growth and poverty reduction, developing countries<br />
around the globe are choosing (or in some cases, are<br />
<strong>for</strong>ced) to liberalize their trade regimes. Trade in <strong>food</strong><br />
Food and Nutrition Bulletin, vol. 28, no. 1 (supplement) © 2007, The <strong>United</strong> <strong>Nations</strong> University. S123
S124<br />
can also have a positive impact on nutritional options<br />
in both developed and developing countries, since it<br />
tends to lower the price of <strong>food</strong> in general and often<br />
makes a greater variety of <strong>food</strong>s available throughout<br />
the year. Scientific developments have also allowed <strong>for</strong> a<br />
better understanding of the nutritional qualities of diets<br />
and their health implications. This has led consumers<br />
to become more discriminating in <strong>food</strong> matters and to<br />
demand protection from <strong>food</strong> of inferior quality and<br />
unsafe <strong>food</strong>. Consumers, at least in the wealthier segments<br />
of society, routinely expect that <strong>food</strong>, regardless<br />
of whether it is domestic or imported, will meet certain<br />
quality, nutritional, and safety requirements.<br />
Due to this higher awareness and concern to protect<br />
human, animal, and plant health among the developed<br />
countries, the safety standards set by them quite often<br />
overrule the existing international standards. Thus,<br />
quite often lowered tariff barriers seem to be replaced<br />
by non-tariff barriers <strong>based</strong> on protective safety considerations,<br />
some of which could actually be protectionist<br />
measures to shield domestic producers from imports.*<br />
Since trade directly impacts the economic situation<br />
of both the exporting and the importing countries,<br />
these standards set by the trading partner impact the<br />
financial status of individual nations, particularly the<br />
developing nations. Higher exports bring in <strong>for</strong>eign<br />
currency <strong>for</strong> the developing nations, generating more<br />
resources, whereas imports bring cheaper products to<br />
consumers but may also affect domestic producers in<br />
both developing and developed nations.<br />
Given this scenario, questions naturally arise about<br />
the justification <strong>for</strong> these rules, which quite often are<br />
reflected in the trade disputes registered under the<br />
WTO framework between developed and developed,<br />
developed and developing, and developing and developing<br />
trading partners. Mutual settlement of differences<br />
and recognition of two different standards (set<br />
to have the same outcome) as equivalent were the predominant<br />
ways in which cooperation in trade has been<br />
taking place. But increasingly these are being replaced<br />
by standards that are integrated or harmonized across<br />
all nations of the world. Not only do the standards that<br />
are set <strong>for</strong> <strong>food</strong> safety have to be adequately backed by<br />
scientific evidence, but implementation of those standards<br />
may have to be cost effective. The present study is<br />
a review of the economic issues concerning the process<br />
of harmonization in <strong>food</strong> safety standards across<br />
the world, focusing more on nutritional aspects under<br />
a more liberalized trade regime. Governments, aid<br />
agencies, and companies routinely use nutrient-<strong>based</strong><br />
<strong>dietary</strong> standards to <strong>for</strong>mulate and monitor policies<br />
pertaining to exports and imports of <strong>food</strong> and <strong>food</strong><br />
* Food originating from countries (developing and newly<br />
industrialized) in Asia did face significant regulatory barriers<br />
in the mid-1990s, making it difficult <strong>for</strong> them to get easy<br />
access to US markets [2].<br />
S. Ramaswamy and B. Viswanathan<br />
products. In this regard, a more harmonized approach<br />
to nutrient intake values (NIVs) and other reference<br />
standards should benefit trade and development.<br />
This article first discusses the need <strong>for</strong> <strong>food</strong> safety<br />
regulation from an economic perspective and presents<br />
a review of <strong>food</strong> safety regulation be<strong>for</strong>e and after the<br />
<strong>for</strong>ming of the WTO. It then looks at the role played by<br />
the Codex Alimentarius Commission in the harmonization<br />
process. The next sections discuss issues arising<br />
from harmonization with regard to <strong>food</strong> <strong>for</strong>tification,<br />
genetically modified <strong>food</strong>s, nutrition labeling, and<br />
hazard analysis and critical control point (HACCP). A<br />
further section looks at the pros and cons of the process<br />
of harmonization by looking at the efficiency and<br />
equity aspects of this process from both a developed<br />
and a developing country perspective. A final section<br />
presents the conclusions of the review.<br />
Economic rationale <strong>for</strong> <strong>food</strong> safety regulation<br />
Having crossed over the threshold of subsistence<br />
consumption, a large number of people in several<br />
developing nations are demanding more variety and<br />
better quality of <strong>food</strong> products. This has increased the<br />
flow of trade in <strong>food</strong> products across countries over the<br />
past decade. However, in this scenario, as compared<br />
with the developing nations, the developed nations<br />
have put into place many regulations—arising mainly<br />
from consumers’ concerns <strong>for</strong> safer public health—to<br />
ensure safe <strong>food</strong> standards, particularly in the case of<br />
imports. Although there may be a similar concern (or<br />
desire) among the developing nations in this regard,<br />
constraints on resources often result in their not being<br />
able to assess as well as implement these standards. A<br />
complex system of market, legal, fiscal, and regulatory<br />
measures thus governs the incentives of firms to supply<br />
<strong>food</strong> products that meet, if not exceed, the safety and<br />
quality attributes sought after by consumers.<br />
Unlike quality, which is often determined by taste,<br />
nutrition, appearance, and organoleptic characteristics,<br />
in<strong>for</strong>mation on <strong>food</strong> safety is often imperfect, so that<br />
safety characteristics may not have a favorable impact<br />
on marketing [3, 4]. The <strong>food</strong> safety issue typically has<br />
three elements: risk communication, which involves<br />
consumers and their perceptions of risks; risk management,<br />
which involves products, firms, and governments**;<br />
and risk assessments, which involve science<br />
[5]. As Antle [3] indicates, even though the producer<br />
may have in<strong>for</strong>mation on the type of pesticide used in<br />
** The amount of in<strong>for</strong>mation that consumers have about<br />
the safety of an imported <strong>food</strong> item depends upon risk communication;<br />
the provision of that safety by exporting firms<br />
depends upon risk management in exporting countries; and<br />
the regulatory import barriers imposed by importing country<br />
governments depend upon scientific risk assessments either<br />
undertaken by them or <strong>based</strong> on internationally acceptable<br />
standards.
Trade, development, and regulatory issues<br />
producing a crop, the residue in the final output may<br />
be unknown to the producer and the consumer may<br />
be unaware of the harm that this may cause. Similarly,<br />
a meat producer may have less control over possible<br />
contaminants during the processing stage and hence<br />
their public health implications.<br />
Even though there is an increasingly high emphasis<br />
on <strong>food</strong> hygiene in both developed and developing<br />
countries, <strong>food</strong> safety standards do not automatically<br />
become internalized into the production process due to<br />
lack of in<strong>for</strong>mation on where the problem is and how<br />
to tackle it. There<strong>for</strong>e, interventions by regulators in<br />
terms of product standards and risk assessment methods<br />
throughout the chain of production have emerged<br />
in recent times.* Often there is a potential <strong>for</strong> differences<br />
to exist between trade and regulatory standards<br />
by virtue of an externality caused by trade partners.<br />
Hypothetically, if the <strong>United</strong> Kingdom exports beef<br />
to the <strong>United</strong> States, the <strong>United</strong> States may have fears<br />
about the safety of the British beef and may ask <strong>for</strong><br />
higher standards of safety, including destruction of beef<br />
that does not meet such standards. This then may result<br />
in the British beef industry destroying its animal stock<br />
<strong>for</strong> the public health of US consumers, thus raising the<br />
price of beef in the <strong>United</strong> Kingdom. Such a separation<br />
of costs from the beneficiaries creates divergent incentives<br />
to comply or to harmonize in the first place.**<br />
Be<strong>for</strong>e the multilateral trading system as envisaged<br />
by the WTO came into practice, the various regulations<br />
across countries were sorted out by either coordination<br />
or mutual recognition. The increasing impact of<br />
the WTO in all aspects of trade is paving the way <strong>for</strong><br />
more stringent <strong>for</strong>ms of regulation to be implemented<br />
by all countries exporting <strong>food</strong> commodities, either<br />
processed or raw. Consumers in importing countries<br />
felt that since <strong>food</strong> safety standards are not the same<br />
across various countries, and they have to deal with<br />
many countries in a multilateral trading regime, a<br />
harmonized framework of regulations alone would<br />
ensure uni<strong>for</strong>m safety standards. Further, producers<br />
from developed countries felt that having different<br />
standards <strong>for</strong> products increased their cost of production<br />
and that hence a single unified regulation would<br />
be better. To tackle such impediments to trade, international<br />
uni<strong>for</strong>m or similar standards across regions have<br />
emerged over the years. However, there are different<br />
ways in which the regulatory rapprochement facilitates<br />
cooperation in this regulated regime [8]:<br />
* To take care of the market failure, statutory regulation of<br />
either process or per<strong>for</strong>mance standards alone need not be<br />
the only option, since markets do have the capacity to signal<br />
quality through indirect policy mechanisms such as liability<br />
laws and building of (private) quality reputation by advertising<br />
or certification [6, 7].<br />
** The authors wish to thank an anonymous reviewer <strong>for</strong><br />
this observation.<br />
S125<br />
» Coordination: minimize differences by making use<br />
of voluntary international codes of practice;<br />
» Equivalence or mutual recognition: accepting different<br />
<strong>for</strong>ms of achieving <strong>food</strong> safety as it prevails in<br />
different countries;<br />
» Harmonization: standardization of <strong>food</strong> safety regulations<br />
through international standards.<br />
The first and second options seem to have been<br />
the dominant mechanism <strong>for</strong> bilateral, regional, or<br />
preferential trade. Conceptually, <strong>food</strong> safety standards<br />
are difficult to internalize both because of asymmetric<br />
in<strong>for</strong>mation problems and because of coordination<br />
failures. The lack of in<strong>for</strong>mation is clear, but there is<br />
also a lack of private incentive to gather or analyze<br />
in<strong>for</strong>mation, because this imposes costs on industry<br />
and because it is costly to adopt controls. The separation<br />
of costs from the beneficiaries—a point made<br />
earlier—creates divergent incentives.*** The present<br />
study looks into some of the recent issues dealing with<br />
the last of these rapprochements to facilitate trade with<br />
the least trade distortions.****<br />
Trade and <strong>food</strong> safety regulations: From the past to<br />
the present<br />
The majority of <strong>food</strong> regulations are social welfare–<br />
enhancing measures that may place legitimate restrictions<br />
on trade. Nevertheless, <strong>food</strong> regulations are<br />
routinely appearing at the center of trade disputes.<br />
One difficulty is that the incidence of risks or available<br />
market in<strong>for</strong>mation varies across countries. Thus the<br />
benefits of a regulation may exceed its costs in one<br />
country but not elsewhere. Another difficulty is that<br />
regulations may rest on comparisons of non-market<br />
benefits with market costs and thus are more susceptible<br />
to challenge by trading partners. But above all, the<br />
most significant problem <strong>for</strong> the global <strong>food</strong> system is<br />
that the stringency of regulations and the provision of<br />
farm support and protection policies tend to increase<br />
among the high-income countries, complicating the<br />
political economy of how <strong>food</strong> trade ought to be regulated<br />
[9].<br />
A Food Control Act at the national level to a large<br />
extent can take care of the problem of regulations and<br />
safety standards in <strong>food</strong> export and import. However,<br />
there are those who find it difficult to implement such<br />
*** The question then becomes whether an industry will<br />
adopt costly controls to make <strong>food</strong> safer <strong>for</strong> a <strong>for</strong>eign population<br />
or even the local population if it only raises its prices as<br />
compared with rival noncompliers.<br />
**** The impact of a <strong>food</strong> regulation on trade thus stems from<br />
the direct cost of compliance incurred by domestic suppliers,<br />
the indirect impacts of the regulation in question on domestic<br />
supply and demand, and its impacts on related <strong>for</strong>eign excess<br />
supplies. The incidence of this cost will ultimately depend on<br />
market structure, the combination of elasticities of supply and<br />
demand, and the scope of the regulation.
S126<br />
acts, due either to a lack of expertise or to the presence<br />
of rent-seeking behavior that seems to bypass rules<br />
and regulations. More importantly, exporting countries<br />
sometimes have to deal with losses or wastage,<br />
since the goods may have to be destroyed when the<br />
standards are not met. Consequently, <strong>for</strong> the purpose<br />
of importing, countries set up independent regulatory<br />
measures with differing requirements, leading to a<br />
myriad of standards.<br />
Thus, to put in place a set of common <strong>food</strong> standards<br />
that would ensure that healthier products were traded<br />
around the globe, the Food and Agriculture Organization/World<br />
Health Organization (FAO/WHO) in 1963<br />
established the Codex Alimentarius Commission.*<br />
The Codex Alimentarius prescribes <strong>food</strong> standards,<br />
codes of practice, and recommendations that national<br />
governments are expected to take into account when<br />
<strong>for</strong>mulating their <strong>food</strong> laws and practices. This would<br />
ensure safe <strong>food</strong> not only <strong>for</strong> export but also <strong>for</strong> domestic<br />
consumers. However, the Codex Alimentarius Commission<br />
has no legal authority to impose its codes on<br />
any country. The Codex standards deal not only with<br />
processed <strong>food</strong> but also with raw <strong>food</strong> (primary agricultural<br />
products) in prescribing standards <strong>for</strong> storing<br />
and packaging as well as pesticide residues in <strong>food</strong>.<br />
The General Agreement on Tariffs and Trade<br />
(GATT), introduced in 1947, on the one hand had<br />
provisions <strong>for</strong> individual countries to have their own<br />
laws to protect animal, plant, and human health, while<br />
on the other hand it also made it clear that countries<br />
should not restrict trade or discriminate against countries<br />
that had similar standards under the guise of<br />
protecting consumers [10]. An increasing number of<br />
instruments are available to governments <strong>for</strong> implementing<br />
<strong>food</strong> regulations: quantitative restrictions<br />
(such as temporal restrictions including quarantine<br />
periods and export prohibitions), technical specifications<br />
(product and process standards), and in<strong>for</strong>mational<br />
requirements (mandatory disclosure and<br />
controls on voluntary claims). However, by the time<br />
the Uruguay Round of agreements began in 1986 (the<br />
Punta del Este agreements), many of the country-level<br />
<strong>food</strong> safety measures seemed to have turned into trade<br />
barriers, some intentional and others unintentional.<br />
Thus, toward the conclusion of this round in 1994 (the<br />
Marrakesh agreement), the earlier GATT agreement<br />
was modified to make it more effective. Countries were<br />
still allowed to set their own standards while keeping in<br />
mind the Codex Alimentarius Commission standards,<br />
and they had to justify them with scientific backing in<br />
case they were perceived to be too restrictive or dis-<br />
* The purpose of the Codex Alimentarius (“<strong>food</strong> law”<br />
or “<strong>food</strong> code” in Latin) was to ensure that traded <strong>food</strong><br />
commodities were not harmful to the consumer [10]. The<br />
application of risk analysis consisting of risk assessment, risk<br />
management, and risk communication to <strong>food</strong> safety has been<br />
the subject of consultations carried out by FAO and WHO.<br />
criminatory vis-à-vis trade.**<br />
WTO and <strong>food</strong> safety<br />
S. Ramaswamy and B. Viswanathan<br />
Since the setting up of the WTO in 1995, three agreements<br />
have been made concerning trade in <strong>food</strong>. The<br />
first is the Agreement on Agriculture, whose aim was<br />
to increase free trade by improving market access<br />
and export competition in agricultural commodities.<br />
This was to be achieved through tariff reduction <strong>for</strong><br />
imported goods and reduction in domestic support<br />
and export subsidies. These economic instruments,<br />
however, did not seem to facilitate smooth trade,<br />
mainly due to a lack of complete in<strong>for</strong>mation on the<br />
quality of products. Other issues emerged in terms of<br />
countries setting their own safety and quality norms.<br />
There<strong>for</strong>e, two other non-tariff agreements emerged:<br />
the Sanitary (human and animal health protection)<br />
and Phytosanitary (plant health protection) agreement<br />
(SPS) and the Technical Barriers to Trade (TBT) agreement<br />
(non-health concerns addressing <strong>food</strong> quality,<br />
nutrition etc.).<br />
The SPS agreement was negotiated on the premises<br />
that domestic sanitary and phytosanitary standards<br />
<strong>based</strong> on international norms could reduce trade conflicts<br />
and lower transaction costs and that requiring<br />
scientific justification <strong>for</strong> norms would make it more<br />
difficult <strong>for</strong> countries to shelter domestic industries<br />
behind restrictive health and safety regulations. The<br />
SPS measures deal with the risks caused by toxins,<br />
additives, disease-causing organisms and contaminants<br />
in <strong>food</strong> products, and so <strong>for</strong>th to human, animal, and<br />
plant life. Some of the measures include inspection<br />
of <strong>food</strong> products <strong>for</strong> microbial contaminants, setting<br />
limits on pesticide residues in agricultural products,<br />
mandating fumigation, and declaring areas free from<br />
pests or disease. The spirit of the WTO is echoed well<br />
in the SPS agreement, according to which countries are<br />
expected to follow international standards to the extent<br />
possible but are also allowed to set their own regulations,<br />
provided they are necessary <strong>for</strong> the protection<br />
of health and are backed by scientific evidence and are<br />
nondiscriminatory.<br />
The TBT measures cover not only <strong>food</strong> items but also<br />
a wide range of commodities and include “technical<br />
regulations, standards and con<strong>for</strong>mity assessment procedures<br />
as applicable to process, product or production<br />
methods.” Most measures related to human disease<br />
control are under the TBT Agreement, as are <strong>food</strong><br />
labeling requirements dealing with nutrition claims,<br />
** The GATT also had another provision to minimize<br />
restrictive trade practices through the agreement on technical<br />
barriers to trade (TBT) established in Tokyo in 1970. The<br />
negotiation was mainly to ensure that countries did not use<br />
technical regulations citing national security or fraudulent<br />
practices to restrict trade and covered a wide range of <strong>food</strong><br />
and non<strong>food</strong> products.
Trade, development, and regulatory issues<br />
quality, and packaging regulations.<br />
The three major differences between the SPS and<br />
TBT measures are that the <strong>for</strong>mer concerns only health<br />
protection while the latter deals with aspects such as<br />
improving product standards <strong>for</strong> quality, providing<br />
more in<strong>for</strong>mation to the consumer to avoid deception<br />
about product content, and national security as<br />
well as health concerns; the SPS is bound by scientific<br />
standards when a measure is being adopted, whereas<br />
it may not be possible <strong>for</strong> all TBT measures to have a<br />
technical or scientific justification; and the SPS relates<br />
to <strong>food</strong> safety but the TBT is applied to a wide range of<br />
non<strong>food</strong> products as well. Although there are overlapping<br />
aspects, the distinctions are often quite clear. For<br />
instance, <strong>food</strong> labeling dealing with health warnings,<br />
use, and dosage are SPS measures, whereas the label’s<br />
position, lettering, composition, nutrient content, and<br />
quality are TBT measures [11]. Consequently, settlement<br />
of a dispute if one should arise would depend on<br />
under which measure it was registered. Interestingly,<br />
though, whereas TBT measures give more scope <strong>for</strong><br />
discriminatory trade practices, given that in many<br />
instances scientific and technical regulations are not<br />
very binding (so that proving a case against them is<br />
difficult), there have been no disputes against a TBT<br />
measure <strong>for</strong> <strong>food</strong> safety as yet, whereas a few have been<br />
registered, and some resolved, against SPS. Unlike the<br />
Codex Alimentarius, the TBT and SPS agreements are<br />
legally binding on the country, but only <strong>for</strong> the internationally<br />
traded segment of the commodity, such as<br />
fresh fruits and vegetables, and need not ensure that<br />
the same standard be followed at the national level <strong>for</strong><br />
domestic consumers [12]. There<strong>for</strong>e one may observe<br />
that in a developing country the products may be sold<br />
in the domestic market, with export quality products,<br />
which are mainly accessible to the richer sections of the<br />
population, having higher standards, whereas a lower<br />
standard would be applicable <strong>for</strong> the larger domestic<br />
market. However, in some Latin American countries,<br />
the lack of public safety standards or poor implementation<br />
has resulted in private safety standards “seeping”<br />
into the supermarkets. This issue will be discussed in<br />
a later section.<br />
At the time of its writing (March 2006), the Doha<br />
round of the WTO has been hailed as the “development”<br />
round <strong>for</strong> its marked emphasis on economic<br />
development issues. Given the Agreement on Agriculture<br />
and the importance of agriculture to developing<br />
countries in general, the issue of <strong>food</strong> safety poses some<br />
vexing concerns. Developing countries signal frustration<br />
with the increasingly stringent standards faced<br />
by their exports, the new obligations to justify their<br />
regulatory mechanisms, or both. On the other hand,<br />
many developed countries question the adequacy of<br />
the WTO rules in light of new disease outbreaks, new<br />
production technologies, and new demands from concerned<br />
consumers about <strong>food</strong> safety [9].<br />
S127<br />
Harmonization and the Codex Alimentarius<br />
Commission<br />
The SPS agreement recognizes in particular three<br />
international standard-setting bodies: the Codex Alimentarius<br />
Commission, which establishes <strong>food</strong> safety<br />
measures, standards, <strong>guidelines</strong>, and recommendations;<br />
the Office Internationale des Epizooties, which<br />
addresses animal health measures; and the Secretariat<br />
of the International Plant Protection Convention, which<br />
sets norms <strong>for</strong> plant health measures. Since the focus of<br />
this review is mainly on human protection concerning<br />
nutrition, most of the subsequent discussion will be<br />
<strong>based</strong> on the Codex standards and their linkage to the<br />
SPS/TBT agreements. The SPS agreement in particular<br />
sets out the following principles to guide trade in <strong>food</strong>:<br />
harmonization (Article 3)—member countries are<br />
urged to adopt international standards, and a country<br />
that adopts the standards of the Codex is in compliance<br />
with WTO standards; science-<strong>based</strong> risk management<br />
(Articles 2 and 5)—in addition to SPS measures deriving<br />
sanction from scientific principles, measures ought<br />
to be chosen so as to minimize distortions to trade and<br />
to be no more restrictive than necessary to achieve a<br />
country’s appropriate level of protection; equivalence<br />
(Article 4)—a WTO member has to accept the SPS<br />
measures of another country as equivalent to its own if<br />
it is objectively demonstrated that there is equivalence<br />
in levels of protection; and regionalization (Article<br />
6)—a country is required to allow imports from subnational<br />
regions from abroad that are free of pests and<br />
disease. Although the member countries of the WTO<br />
(through the SPS and TBT agreements) in principle<br />
agree to the Codex standards and <strong>guidelines</strong>, there<br />
is no legal binding to implement them domestically.<br />
However, two situations may arise:<br />
» If a particular domestic measure falls below the<br />
Codex standards and the country is exporting at the<br />
lower <strong>food</strong> safety or quality level, then the agreement<br />
becomes binding on the exporting country to<br />
implement it. This consequently has a bearing on the<br />
domestic <strong>food</strong> law as well. Many studies suggest that<br />
this last aspect is particularly useful <strong>for</strong> developing<br />
nations not only to increase their trade but also to<br />
improve standards within the country [13]. There<br />
may of course be resource constraints on implementing<br />
these and the country may need to seek help.<br />
» If the domestic measure is more trade restrictive<br />
on account of more stringent rules than those prescribed<br />
by the Codex Alimentarius Commission, it<br />
must be justified by proper scientific assessments and<br />
risk analysis.<br />
Under these two situations, there is now a challenge<br />
<strong>for</strong> the Codex Alimentarius Commission. In the case<br />
of countries (usually developing countries) with <strong>food</strong><br />
safety standards lower than Codex standards, the challenge<br />
is to raise resources to improve upon the existing
S128<br />
situation. This would not only enable the developing<br />
nations to participate regularly in the Codex meetings<br />
to discuss their problems and give suggestions, but also<br />
help them improve their risk assessment and scientific<br />
capacities. In situations where the standards are higher<br />
than those prescribed by the Codex, the commission<br />
has to play an active role in helping the resolution of<br />
disputes either through bilateral discussions or through<br />
the WTO dispute settlement mechanism. Apart from<br />
these two issues, the increased pace of globalization<br />
would also bring in various problems related to<br />
property rights and spreading the knowledge about<br />
healthy practices and adverse impacts as soon as they<br />
are brought to light by scientific experts. For instance,<br />
an issue recently taken up by the Codex Alimentarius<br />
Commission was to set upper limits <strong>for</strong> proteins and<br />
vitamins beyond which they become toxic <strong>for</strong> human<br />
consumption; this problem arises from the increased<br />
number of products introduced into the market that<br />
are <strong>for</strong>tified [14].<br />
Current issues<br />
There are a number of issues of interest when it comes<br />
to the future of trade in <strong>food</strong> products, which can be<br />
grouped as follows [9]: process attributes—genetically<br />
modified <strong>food</strong>, <strong>food</strong> <strong>for</strong>tification, and organic <strong>food</strong>s;<br />
product attributes—nutritional labeling <strong>for</strong> example—<br />
and process controls—Hazard Analysis and Critical<br />
Control Point (HACCP). Be<strong>for</strong>e we turn our attention<br />
to a discussion of these pressing issues, it is important<br />
to remind ourselves that since the times of Adam Smith<br />
and David Ricardo, international trade has been largely<br />
assumed to be a global exchange of goods with inherent<br />
characteristics that can be revealed in final <strong>for</strong>m<br />
regardless of whether an inspection is done preborder<br />
or postborder. Now with regard to some of these critical<br />
issues facing us, when the process itself defines the<br />
product (as might be the case with genetically modified<br />
<strong>food</strong>s or <strong>for</strong>tification of <strong>food</strong>), countries may have to<br />
rethink acceptable conventions of trade policy.<br />
Process attributes: Harmonization in trade<br />
Food <strong>for</strong>tification<br />
Food <strong>for</strong>tification is the addition of one or more essential<br />
nutrients to a <strong>food</strong> <strong>for</strong> the purpose of preventing<br />
or correcting a deficiency of those nutrients in target<br />
populations. It is one approach to achieving the objective<br />
of eliminating or substantially reducing important<br />
micronutrient deficiencies. A <strong>for</strong>tification regime<br />
should be designed so that the prevalence of intakes of<br />
a targeted nutrient below an average nutrient requirement<br />
(ANR) or above the upper nutrient level (UNL)<br />
is low. Such a design ensures that very few individuals<br />
within the population would have either inadequate or<br />
excessive intake of a target nutrient. Examples include<br />
the addition of iodine to <strong>food</strong>-grade salt, calcium to<br />
fruit juices (to provide this micronutrient to people<br />
who do not consume diary products), and iron to<br />
breakfast cereals. Fortification is also done to restore<br />
minerals lost during packaging or storing (e.g., addition<br />
of B vitamins to wheat flour after processing) and to<br />
provide <strong>for</strong> substitute <strong>food</strong>s to have the same nutrition<br />
level as the ordinary <strong>food</strong> (e.g., addition of vitamins A<br />
and D to margarine to produce the same level of the<br />
vitamins as in butter).<br />
Availability of alternative <strong>dietary</strong> or supplementation<br />
sources and concern about upper limits being violated<br />
resulting in toxicity are reasons put <strong>for</strong>th to prohibit<br />
<strong>for</strong>tification in the <strong>food</strong> safety laws of many countries.<br />
In such cases, increased access to and availability of<br />
the <strong>dietary</strong> supplement and awareness programs could<br />
tend to eliminate the deficiency. However, the fact that<br />
this has not happened in a sustained and cost-effective<br />
manner makes <strong>for</strong>tification an important mechanism<br />
to address micronutrient deficiencies in particular.<br />
Given the impact of <strong>for</strong>tification on public health,<br />
countries sometimes prescribe mandatory <strong>for</strong>tification.<br />
Countries then resort to a ban on the import of<br />
non-<strong>for</strong>tified commodities or products, which may<br />
be considered as a non-tariff trade barrier under the<br />
WTO regime. In such instances the concerned state<br />
is expected to notify the WTO so that settlement of a<br />
dispute if one arises can be taken up more effectively. A<br />
dispute may arise if the importing country has mandatory<br />
<strong>for</strong>tification laws or the non-<strong>for</strong>tified imports are<br />
cheaper and get market access in the liberalized trade<br />
regime; or if the exporting country has mandatory<br />
<strong>for</strong>tification regulation while the importing country<br />
may already have reached the upper limits due to its<br />
consumption pattern. Alternatively, countries insist on<br />
a harmonized mandatory <strong>for</strong>tification if the problem<br />
persists in many parts of the world.<br />
Many of the concerns are usually raised by developed<br />
country consumers, whereas concerns in developing<br />
countries, though similar, involve certain other issues<br />
as well. The two different sets of issues in harmonization<br />
are discussed below.<br />
Fortification and developed countries<br />
S. Ramaswamy and B. Viswanathan<br />
The standards (and hence harmonization) of <strong>food</strong><br />
<strong>for</strong>tification have to deal with the following issues,<br />
which have arisen mainly from developed country<br />
experiences:<br />
» The upper and lower levels of vitamins and minerals<br />
that can be added be<strong>for</strong>e excess amounts lead to<br />
toxicity;<br />
» The nature of <strong>for</strong>tification: i.e., do <strong>for</strong>tificants have<br />
to be mainly vitamins and minerals, and if so what<br />
are the permissible <strong>for</strong>tificants?<br />
» The list of <strong>food</strong> items that can be <strong>for</strong>tified: <strong>for</strong>tifica-
Trade, development, and regulatory issues<br />
tion of “unhealthy” <strong>food</strong>s (alcohol or <strong>food</strong>s high in<br />
salt, sugar, or fat) may cause other health problems.<br />
In late 2003, the European Commission proposed<br />
common regulations <strong>for</strong> <strong>for</strong>tification among European<br />
Union countries, which were finally passed in the<br />
European Parliament in mid-2005 [15]. The important<br />
points to note are a positive list of vitamins and minerals<br />
that may be added to <strong>food</strong>; a recommendation to<br />
define daily intakes of specific substances, leading to<br />
<strong>for</strong>tified <strong>food</strong>s being labeled as such; a ban on <strong>for</strong>tification<br />
of beverages containing more than 1.2% alcohol;<br />
and a list of <strong>for</strong>bidden substances. However, separate<br />
European Union legislation has also been <strong>for</strong>malized<br />
<strong>for</strong> specialized categories such as <strong>food</strong>s <strong>for</strong> infants and<br />
young children, <strong>food</strong>s to promote weight loss, and <strong>food</strong><br />
supplements, such as vitamin pills. This recent setting<br />
of standards by the European Union <strong>for</strong> the addition of<br />
vitamins and minerals has caused many other nations<br />
within and outside Europe to realign their domestic<br />
<strong>food</strong> <strong>for</strong>tification standards to facilitate trade.<br />
Two-tailed risk in nutrient consumption is perhaps<br />
the most contentious issue <strong>for</strong> <strong>for</strong>tification. It is well<br />
known that calorie intake within a certain range is<br />
healthy and necessary; intakes below a certain level<br />
cause chronic energy deficiency, and intakes above a<br />
certain value lead to overweight and obesity. Similarly,<br />
scientists have recorded that low and high doses of<br />
vitamins and minerals affect health status, causing<br />
various kinds of impairments and in some cases death.<br />
Hence safe limits are prescribed <strong>for</strong> most vitamins<br />
and minerals by most countries across the developed<br />
world, with <strong>guidelines</strong> from WHO as well as their own<br />
country-specific research.<br />
For instance, Norway and Iceland had a regulation<br />
that no <strong>for</strong>tification should be allowed <strong>for</strong> baby <strong>food</strong>s,<br />
whereas several other European Union countries<br />
allowed small amounts of vitamin A and D. This non<br />
harmonization within the European Union prior to<br />
2002 <strong>for</strong>ced the manufacturers to make two separate<br />
products, increasing the cost of production. However,<br />
successive negotiations and pressure from the European<br />
Union led to the acceptance of the European<br />
Union norm by these two countries, although it was<br />
shown that these supplements in large amounts could<br />
be poisonous.<br />
In 2004 Denmark banned the entry of 18 cereals and<br />
cereal bars manufactured by Kellogg because the company<br />
wished to add iron, calcium, vitamin B 6 , and folic<br />
acid in amounts higher than permissible safety levels.<br />
Although the same products were being consumed by<br />
other nations in the European Union, Denmark, which<br />
has no recommended daily allowances <strong>for</strong> vitamins, has<br />
longstanding policies that reflect the cultural belief that<br />
addition of too many vitamins and supplements can do<br />
more harm than good. In 2001, the European Union<br />
ordered Denmark to accept enriched <strong>food</strong> products,<br />
and since then Denmark has been allowing enriched<br />
S129<br />
<strong>food</strong>s but with levels lower than those proposed by<br />
Kellogg. Consequently, around the same time Denmark<br />
allowed <strong>for</strong>tified drinks, although <strong>for</strong>tificants were not<br />
needed by the population, the products were deemed<br />
safe by Denmark’s <strong>food</strong> administration. Kellogg had<br />
also applied <strong>for</strong> permission to enrich the relevant<br />
products with other nutrients that would not carry<br />
any health risk, and these have been approved by the<br />
Danish Veterinary and Food Administration.<br />
According to the Danish Veterinary and Food<br />
Administration, this was not a discriminatory policy,<br />
since its decision to ban certain Kellogg products was<br />
<strong>based</strong> on a scientific risk assessment produced by the<br />
Danish Institute <strong>for</strong> Food and Veterinary Research. The<br />
Danish maximum levels are <strong>based</strong> on the upper safe<br />
limits <strong>for</strong> the intake of vitamins and minerals determined<br />
by the European Commission’s Scientific Committee<br />
on Food. If the maximum levels are exceeded,<br />
the total intake from enriched <strong>food</strong>, nonenriched <strong>food</strong>,<br />
and <strong>dietary</strong> supplements can reach a level that exceeds<br />
the upper safe limits, and may consequently represent<br />
a potential health risk. The Danish Institute <strong>for</strong> Food<br />
and Veterinary Research bases its calculations on largescale<br />
surveys of the diet of Danes and their intake of<br />
<strong>dietary</strong> supplements. These surveys show that around<br />
half of the adult population and 70% of children aged<br />
4 to 10 years regularly consume <strong>dietary</strong> supplements,<br />
typically a multivitamin mineral tablet. For a multinational<br />
corporation like Kellogg, this could well be<br />
a small percentage of their business and might not be<br />
a matter of immediate concern, but there may be a<br />
concern about the possibility of this ban spreading to<br />
other nations.<br />
These two instances of harmonization (in Norway)<br />
and nonharmonization (in Denmark) have not been<br />
raised within the WTO <strong>for</strong> discussion, perhaps because<br />
they were considered intra-European Union matters,<br />
but they do raise the following welfare- and traderelated<br />
issues:<br />
» If the <strong>dietary</strong> habits of the population tend toward<br />
higher doses of calories or vitamins and minerals,<br />
this needs to be addressed through a national educational<br />
campaign. In particular, when the impact of<br />
the excessive usage is undiscovered as yet, a similar<br />
educational campaign on the possibilities of danger<br />
could be initiated.<br />
» The European Union (EU) in 2005 passed a resolution<br />
on harmonized rules <strong>for</strong> the addition of<br />
vitamins and minerals in <strong>food</strong> across the EU, but<br />
interestingly enough, Denmark continued to have its<br />
own <strong>for</strong>tification policy while Norway and Iceland<br />
were pressured to follow the rule.<br />
» In a globalized world, if the banned product was<br />
being manufactured in a developing country site, this<br />
might well hamper the local employment due to loss<br />
in production.<br />
» There is a trade-off between an individual country’s
S130<br />
choice to take precautions against overdoses of nutrients<br />
by not permitting excessive <strong>for</strong>tification and<br />
this being considered as a non-tariff barrier in the<br />
absence of scientific evidence on the health impact.<br />
» Are firms using <strong>for</strong>tification as a marketing strategy<br />
when there could be cheaper and easier ways of<br />
enhancing micronutrient consumption, particularly<br />
among developing countries?<br />
» How do private firms raise or bring to WTO notice<br />
such nontariff barriers as the dispute settling mechanism<br />
set up at the country level?*<br />
There has been a four- or fivefold growth in the processed<br />
<strong>food</strong> industry in the past decade in both developed<br />
and developing countries, with the businesses<br />
usually privately owned and multinational in character.<br />
Consequently, a <strong>for</strong>tification regulation would affect<br />
the business of an individual (multinational corporation)<br />
firm <strong>for</strong> which <strong>for</strong>tification is the main marketing<br />
strategy to increase or sustain consumption.<br />
Mandatory <strong>for</strong>tification and trade<br />
Some countries introduce mandatory <strong>for</strong>tification if<br />
there are public health concerns, and in that case non<strong>for</strong>tified<br />
products would not be traded in the country.<br />
As members of the WTO, the countries are obligated to<br />
notify the WTO about mandatory <strong>for</strong>tification in case<br />
they are in violation of the existing WTO rules.<br />
Even in developed countries, iodine deficiency and<br />
folic acid deficiency are noted among a large segment of<br />
the population, and despite awareness campaigns to the<br />
target groups there have not been significant changes in<br />
the consumption patterns of the people. One issue that<br />
emerges out of this is mandatory <strong>for</strong>tification with folic<br />
acid and iodine and its impact on trade.<br />
Mandatory folic acid or folate <strong>for</strong>tification is a recent<br />
<strong>food</strong> policy issue in many developed countries such as<br />
Australia, New Zealand, Canada, the <strong>United</strong> States, and<br />
the <strong>United</strong> Kingdom, mainly to address the problem of<br />
neural tube defects. Mandatory folic acid <strong>for</strong>tification<br />
programs in the <strong>United</strong> States and Canada aim to lower<br />
the rate of neural tube defects by providing additional<br />
synthetic folic acid. The two countries introduced this<br />
policy at the same time and set a similar deadline of<br />
mid-1998 mainly to ensure freer movement of these<br />
products across the borders. The impact of this was<br />
that though the program had significant impact on<br />
folate stores and resulted in a 50% reduction in the risk<br />
of open neural tube defects, there was some concern<br />
regarding vitamin B 12 deficiency masking, since folic<br />
acid consumption increased among younger and older<br />
women during this period [16]. Thus, there is a suggestion<br />
to include this vitamin in the <strong>for</strong>tified program to<br />
* The private firm can raise the issue through their home<br />
country provided there are such laws within the country,<br />
and hence this issue is also an important aspect of harmonization.<br />
S. Ramaswamy and B. Viswanathan<br />
reduce harm among the elderly women.<br />
A study in Germany found a 50% to 70% increase<br />
in folate consumption due to increased intake of folic<br />
acid-<strong>for</strong>tified <strong>food</strong> between 1990 and 2001 [17]. The<br />
study concluded that since the intakes were higher<br />
among younger children than older children and adolescents,<br />
mandatory folic acid <strong>for</strong>tification (of basic<br />
<strong>food</strong>s like flour) may not be necessary, given this trend<br />
in <strong>food</strong>-consumption habits. The study found about 1%<br />
of the sample exceeding the upper levels, although no<br />
cautionary note has been sounded about the increased<br />
availability of folic acid-<strong>for</strong>tified <strong>food</strong> from cheaper<br />
imports from other countries that have mandatory <strong>for</strong>tification.<br />
Similarly, another study in the <strong>United</strong> States<br />
indirectly assessed the impact of universal folic acid<br />
enrichment of cereal-grain <strong>food</strong>s introduced by the<br />
US Food and Drug Administration in 1998 [18]. The<br />
study indicated that the increase in median intake was<br />
twice that predicted and hence that further monitoring<br />
and possible reconsideration of folic acid <strong>for</strong>tification<br />
was warranted. In comparison with this, a more recent<br />
study <strong>based</strong> on 10-year data (1988–98) from 10 European<br />
countries (in some countries only select regions<br />
were surveyed) suggests that since the issuance of the<br />
folic acid recommendations in 1992 there has not been<br />
a significant decline in neural tube defects, and hence<br />
that there is a need <strong>for</strong> “a reasonable strategy to quickly<br />
integrate <strong>food</strong> <strong>for</strong>tification with fuller implementation<br />
of recommendations on supplements” [19].<br />
This contradicting evidence about the need <strong>for</strong><br />
mandatory <strong>for</strong>tification is clearly <strong>based</strong> on behavioral<br />
patterns after science has indicated a way out of<br />
micronutrient deficiency in the <strong>for</strong>m of <strong>for</strong>tification.<br />
The implementation of <strong>for</strong>tification would largely<br />
depend on consumer preferences and risk perception<br />
and assessment, all of which may be evaluated using a<br />
scientific approach but are not <strong>based</strong> only on science.<br />
An adverse impact on nutritional intakes leading to<br />
a poor nutritional profile in the developed countries<br />
is blamed on the popularity of convenience <strong>food</strong>s and<br />
the decrease in time available to shop and prepare <strong>food</strong><br />
with varied nutrition. Although the issues are similar<br />
among the richer segments of the population in urban<br />
areas of developing countries, micronutrient deficiency<br />
is still a cause of high morbidity and mortality among<br />
women and children in these countries. Countries<br />
such as India, China, and Brazil are faced with the<br />
double burden of infectious and chronic diseases, thus<br />
nutritional challenges in a liberalized trade regime are<br />
even more pronounced. The next section looks at the<br />
challenges faced by developing countries in linking<br />
<strong>for</strong>tification and the WTO re<strong>for</strong>ms.<br />
Fortification and developing countries<br />
The challenges of <strong>for</strong>tification take on an entirely different<br />
character in a developing country. First, there are
Trade, development, and regulatory issues<br />
multiple micronutrient deficiencies, and absorption or<br />
supplementation of one deficiency would require sufficient<br />
complementary or basic macronutrients such<br />
as fats or carbohydrates, without which it may not be<br />
very effective. At the same time, multiple <strong>for</strong>tification<br />
interactions between certain minerals and vitamins<br />
may sometimes enhance and sometimes decrease the<br />
absorption of the required amounts of the micronutrients<br />
by the body. This poses a problem when it comes<br />
to implementation of schemes.<br />
Second, with the emphasis on micronutrient deficiency<br />
on the rise, many smaller countries with insufficient<br />
production and processing infrastructure may<br />
have to depend on imports of <strong>for</strong>tified <strong>food</strong>. The cost<br />
of such products may be higher, making then unaf<strong>for</strong>dable<br />
to a section of the vulnerable population.<br />
However, it is important to note recent initiatives, such<br />
as the WHO’s new Global Alliance <strong>for</strong> Improved Nutrition<br />
(GAIN) that brings the benefits of <strong>food</strong>s <strong>for</strong>tified<br />
with vitamins and minerals <strong>for</strong> the poor in developing<br />
countries to end micronutrient deficiency and help save<br />
millions of lives.<br />
Third, gradations in micronutrient deficiencies<br />
among sections of the population are observed, and<br />
hence different levels of dosages may be required to<br />
improve undernourishment. Consequently, the health<br />
impact will be more effective if the <strong>for</strong>tified products<br />
are targeted to the population suffering from deficiencies<br />
rather than to the entire population, since universal<br />
<strong>for</strong>tification might lead to toxicity among those who<br />
have access to a more balanced diet.<br />
Iodized salt is an example of a <strong>food</strong> that undergoes<br />
mandatory <strong>for</strong>tification in many countries to prevent<br />
iodine-deficiency disorders.* No other <strong>dietary</strong> source<br />
of iodine is available; supplementation may be an<br />
alternative but it has not been found to be cost effective<br />
and accessible to a large population in a sustained<br />
manner. More importantly, international standards<br />
on <strong>food</strong> <strong>for</strong>tification are available only <strong>for</strong> <strong>food</strong>-grade<br />
salt, and as a result various <strong>for</strong>tification standards are<br />
observed <strong>for</strong> different <strong>food</strong> items across the world.<br />
Thus, there is a need <strong>for</strong> harmonized standards to<br />
facilitate least restrictive trade practices and safeguard<br />
health concerns.<br />
What if a country has a mandatory <strong>for</strong>tification<br />
law <strong>for</strong> salt but due to the WTO restrictions may be<br />
<strong>for</strong>ced to import cheaper non-iodized salt? Or what if<br />
countries do not produce salt locally and hence have to<br />
depend on imports? In such cases, if the import of noniodized<br />
salt is prohibited, then the country should be in<br />
a position to defend itself if its policy is misconstrued<br />
as a non-tariff barrier under the WTO regime. Many of<br />
the countries in transition in Europe seem to be facing<br />
* The <strong>United</strong> States had such a policy in the 1950s and<br />
successfully eliminated iodine-deficiency disorders from the<br />
population.<br />
S131<br />
such a dilemma; Georgia recently banned imports of<br />
non-<strong>for</strong>tified salt [20]. Although the countries that<br />
produce salt locally have the option of iodizing and<br />
then distributing it, they may also face the situation of<br />
lower prices <strong>for</strong> non-iodized salt from domestic and/or<br />
imported sources. For instance, India had a ban on<br />
the sale of non-iodized salt that was removed in 2002<br />
under pressure by the salt manufacturers’ association<br />
(as some media reports indicated), since packaging<br />
costs were higher <strong>for</strong> iodized salt, thereby reducing the<br />
profit margin. It was then found that within a year of<br />
removal of the ban, cases of iodine-deficiency disorders<br />
increased substantially, and the ban was reimposed in<br />
2004 [21].<br />
Because the effects of deficient intakes of folic acid<br />
have been known only recently, even in developed<br />
countries, assessment of the magnitude of neural tube<br />
defects does not seem to have been carried out. Hence,<br />
<strong>for</strong>tification issues do not seem to have been considered<br />
at present, although the extent of the problem could be<br />
more severe due to higher fertility rates in these countries.<br />
How this will affect the harmonization process is<br />
still unclear, although the issues may remain broadly<br />
the same, as in the case of iodine.<br />
There<strong>for</strong>e, in comparison with developed countries,<br />
not only are public health problems more widespread<br />
and severe in developing countries, but lack of awareness,<br />
institutions, and adequate resources to ensure<br />
that products with safe standards are available only to<br />
the consumers are equally challenging issues to deal<br />
with. The process of harmonization in trade standards<br />
with increased globalization will have impacts on these<br />
aspects as well and hence have far-reaching impacts on<br />
efficiency as well as equity.<br />
The TBT is more applicable to <strong>food</strong> <strong>for</strong>tification<br />
issues in trade than the SPS. As discussed above, there<br />
are possibilities that international trade regulations may<br />
affect country-level nutrition legislation, but to date<br />
no instance of a dispute has been registered under the<br />
TBT. The reason may be that the importing nation has<br />
a clear public health reason to restrict trade to protect<br />
health, so certain trade policies may not be perceived<br />
as protectionist. Perhaps consumption of such <strong>for</strong>tified<br />
products is still from domestic production or countries<br />
are still giving more importance to public health issues,<br />
with limited research on the upper safe limits.<br />
Genetically modified organisms, trade, and<br />
harmonization<br />
There are three interrelated concerns when it comes to<br />
the issue of genetically modified <strong>food</strong>: approval of varieties<br />
<strong>for</strong> use by domestic producers, approval of varieties<br />
<strong>for</strong> sale on the domestic market, and labeling and<br />
traceability of genetically modified <strong>food</strong> and products<br />
made from genetically modified ingredients [9]. Lower
S132<br />
than adequate intake of micronutrients causes various<br />
types of health problems, including high mortality,<br />
and is a major concern among the developing regions<br />
where it is referred to as the problem of “silent hunger”<br />
or “hidden hunger.” In many developing countries,<br />
processed <strong>food</strong>s are not consumed in large amounts,<br />
and hence bio<strong>for</strong>tification either through breeding<br />
or transgenic processes is also being considered as an<br />
option.*<br />
Bio<strong>for</strong>tification is the process of breeding <strong>food</strong> crops<br />
that are rich in bioavailable micronutrients. These crops<br />
<strong>for</strong>tify themselves: they load high levels of minerals<br />
and vitamins in their seeds and roots, which are then<br />
harvested and eaten [22]. This <strong>for</strong>m of bio<strong>for</strong>tification<br />
through breeding is possible only if there are several<br />
thousand varieties of the crop with varying levels of<br />
micronutrients, so that the best available source is then<br />
crossbred with the local variety and the resultant crop<br />
is enriched. For instance, zinc and iron contents vary<br />
across certain crops, whereas vitamin A in rice shows a<br />
constant pattern. In the latter case, transgenic technology<br />
is used to add or remove certain genes in order to<br />
achieve certain desired properties [23].<br />
Genetically modified crops have been shown to<br />
be not only cost effective but also resistant to some<br />
of the problems associated with soil degradation or<br />
recurrent drought in these regions or regular attack<br />
by pests. This in some sense is considered as a second<br />
Green Revolution, which could not only raise production<br />
and productivity but also take care of nutritional<br />
deficiency problems by addressing both quantity<br />
(increased production and hence higher consumption)<br />
and quality (enrichment with micronutrients)<br />
[24]. The major issue concerning bio<strong>for</strong>tification or<br />
its nonadoption lies in its transgenic nature, which has<br />
already resulted in major debates around the world.<br />
The main concern with genetically modified <strong>food</strong> is<br />
the issue of allergens <strong>for</strong> human consumption and the<br />
associated environmental damage. More importantly,<br />
the effects of genetically modified <strong>food</strong>s and crops on<br />
human health have not been completely analyzed, and<br />
their rejection is <strong>based</strong> on the precautionary approach<br />
in some developed countries in the European Union<br />
and in Japan. Whereas more than 10 <strong>food</strong> and feed<br />
crops with transgenic events have been approved <strong>for</strong><br />
cultivation in developed countries, the developing<br />
countries are using a very cautious approach [25]. For<br />
instance, very few developing countries have allowed<br />
a transgenic event in maize, whereas Mexico, Uruguay,<br />
Argentina, and South Africa have done so <strong>for</strong> soybeans.<br />
China, Indonesia, and India have transgenic cotton,<br />
which is, however, a non<strong>food</strong> crop. The precautionary<br />
* As is well known, commercial <strong>for</strong>tification (loading of<br />
semiprocessed <strong>food</strong> with <strong>for</strong>tificants), <strong>for</strong> instance with iron,<br />
provides higher doses than bio<strong>for</strong>tification, and iron supplementation<br />
provides even higher doses.<br />
approach to using a product seems to arise mainly <strong>for</strong><br />
trade reasons and, in some instances, a concern <strong>for</strong><br />
public health of the domestic population as well.<br />
The European Union has taken the toughest stance<br />
on genetically modified <strong>food</strong>s, in that labeling and<br />
traceability are important and any possibility of contamination<br />
would also lead to the rejection of the<br />
product. For developing countries, however, not only is<br />
labeling costly but so is the cost of physical segregation<br />
of genetically modified and non-genetically modified<br />
crops. These issues, coupled with weak scientific and<br />
administrative capacities to conduct case-by-case<br />
biosafety screening, as insisted by the developed<br />
countries, have dissuaded the countries from adopting<br />
such technologies. In 2002, the Codex Alimentarius<br />
Commission reached agreement on a final draft of<br />
“Principles <strong>for</strong> the risk analysis of <strong>food</strong>s derived from<br />
biotechnology.” The principles provide a framework<br />
<strong>for</strong> evaluating the safety and nutritional aspects of<br />
genetically modified <strong>food</strong>s and define the need <strong>for</strong> a<br />
premarket safety assessment of all such <strong>food</strong>s on a caseby-case<br />
basis. Postmarket monitoring would be one of<br />
the management options described in the principles.<br />
Guidance related to analytic methods and other tools<br />
to be used in risk management are also provided. The<br />
task <strong>for</strong>ce also reached an important agreement concerning<br />
the tracing of genetically modified products<br />
<strong>for</strong> the purpose of facilitating withdrawal from the<br />
market when a risk to human health has been identified.<br />
The agreement is likely to mark a breakthrough in<br />
international negotiations concerning the use of tracing<br />
systems in relation to <strong>food</strong> in international trade.<br />
The world market <strong>for</strong> <strong>food</strong> products, especially <strong>for</strong><br />
soybeans, corn (maize), and cotton, has been increasingly<br />
polarized, with some countries either insisting on<br />
non-genetically modified products or suggesting strict<br />
inspection norms.<br />
Organic <strong>food</strong>s<br />
S. Ramaswamy and B. Viswanathan<br />
Organic <strong>food</strong>s remain one of the fastest-growing segments<br />
in the <strong>food</strong> sector. The potential <strong>for</strong> profits is<br />
considerable and has attracted large entrepreneurs to<br />
coexist with small producers. Growth rates of 15% to<br />
20% in Japan, the European Union, and the <strong>United</strong><br />
States are <strong>for</strong>ecast [9]. Governments typically have<br />
used process regulations while defining product characteristics<br />
of organic <strong>food</strong>s, such as “no pesticide use.”<br />
It is only recently that countries in the European Union<br />
and the <strong>United</strong> States have started to regulate this<br />
sector, and regulation has been imperfect. Ultimately,<br />
to sustain any linkage between consumption of organic<br />
<strong>food</strong>s and health, such <strong>food</strong>s would have be tested on<br />
the same grounds as conventional <strong>food</strong>s, which would<br />
have implications <strong>for</strong> how much organic <strong>food</strong>s will be<br />
traded across national boundaries in years to come.
Trade, development, and regulatory issues<br />
Product attributes: Harmonization and trade<br />
Nutrition labeling<br />
Labeling is a classic case within in<strong>for</strong>mation economics<br />
of the problems that firms confront in a marketplace:<br />
what product in<strong>for</strong>mation to convey, and how to make<br />
that in<strong>for</strong>mation credible. With the rise in diet-related<br />
disease patterns around the world and the increase in<br />
consumption of processed and packaged <strong>food</strong>, nutrition<br />
labeling is increasingly demanded. Nutrition labeling is<br />
supposed to assist consumers in making an in<strong>for</strong>med<br />
decision about the content of the product. It is now<br />
customary <strong>for</strong> the governments in several developed<br />
countries such as Canada and the <strong>United</strong> States and<br />
also in newly industrialized countries such as Malaysia<br />
to have mandatory labeling norms. For the manufacturers,<br />
on the one hand, this makes them aware of the<br />
nutritional content of their product, thereby giving<br />
them an edge in selling the products, and on the other<br />
hand it instills an element of social responsibility to<br />
produce and promote healthy <strong>food</strong> among consumers.<br />
Of course, possibilities of misleading the consumers<br />
<strong>based</strong> on health claims are also likely to arise if this is<br />
to be used as a strategy to increase sales. Consequently,<br />
regulation of labeling <strong>for</strong>mat (what to label, how to<br />
label, and where to label) is considered important.<br />
Several countries follow the Codex labeling pattern,<br />
whereas others have their own regional versions and<br />
hence tend to vary from one country to another. With<br />
the rise in trade in processed <strong>food</strong>, a common approach<br />
to labeling is becoming important, leading to calls <strong>for</strong><br />
harmonization.<br />
Recently, the issue of harmonization in labeling of<br />
trans fatty acids (TFA)* in <strong>food</strong> products emerged as<br />
a point of contention in trade between Canada and<br />
the <strong>United</strong> States [26, 27]. The differences in labeling<br />
<strong>for</strong>mat include the following: trans fat is to be<br />
declared separately, with a minimum daily value <strong>for</strong><br />
both saturated and unsaturated fats in the Canadian<br />
proposal, whereas the US <strong>for</strong>mat requires that trans<br />
fat be declared separately from saturated fats, but only<br />
the saturated fat is accompanied by a minimum daily<br />
value; the minimum threshold of trans fat declaration<br />
is lower in Canada (0.2 g) than in the <strong>United</strong> States<br />
(0.5 g or more); and Canada requires that the label be<br />
printed in English and French. Consequently, there is a<br />
request <strong>for</strong> mutual recognition rather than harmoniza-<br />
* TFAs are polyunsaturated fats that are harmful to health,<br />
particularly those from partial hydrogenation of vegetable<br />
oils. Addition of TFA increases the shelf-life of a product with<br />
a stable flavor but also increases the cholesterol level, causing<br />
a higher risk of coronary artery disease. Consequently, some<br />
countries in the European Union, the <strong>United</strong> States, and<br />
Canada have imposed regulations on the permitted use of<br />
such oils and hence have mandatory labeling requirements<br />
whose <strong>for</strong>mat varies among the countries. In Australia and<br />
New Zealand voluntary labeling is practiced.<br />
S133<br />
tion by the US manufacturers, who seem to have a less<br />
stringent labeling <strong>for</strong>mat. The welfare impacts of the<br />
nutrition labeling have been a significant increase in<br />
sales of products marked “no trans fat” and increased<br />
research on and availability of oils with lower or no<br />
trans fat content (partly driven by the nutrition labeling<br />
deadline set by NAFTA <strong>for</strong> January 2006).<br />
Similar issues could emerge in trade between two<br />
groups of nations, as the countries vary in terms of<br />
what they deem necessary to be cited on the label about<br />
nutrient content and how it is explained. For instance,<br />
Food Standards Australia New Zealand (ANZFA), the<br />
joint <strong>food</strong> code <strong>for</strong> Australia and New Zealand, has<br />
mandatory nutrition labeling, whereas the European<br />
Union considers mandatory labeling only <strong>for</strong> <strong>food</strong> with<br />
nutritional or health claims. It expects the in<strong>for</strong>mation<br />
to be given both per 100 g and per 100 mL and in<br />
terms of an average serving, whereas the latter is not an<br />
essential requirement in the European Union [28, 29]<br />
Similarly, countries in the Southeast Asia region have<br />
varying standards, and attempts have been made to<br />
bring the countries together <strong>for</strong> a harmonized nutrition<br />
labeling due to increased demand by the consumers as<br />
well as their regional trading partners [30].<br />
Although it is widely accepted that nutritional claims<br />
cannot be the only approach to change <strong>dietary</strong> habits,<br />
they could have significant impacts on some consumers,<br />
and there<strong>for</strong>e restricting trade on the basis of a<br />
different labeling <strong>for</strong>mat does not seem to be justified<br />
[31]. Thus, <strong>guidelines</strong> such as those of the Codex Alimentarius<br />
Commission may be necessary to increase<br />
harmony in the labeling <strong>for</strong>mat. Within the Codex<br />
Alimentarius Commission, the Codex Committee on<br />
Food Labeling gives <strong>guidelines</strong> <strong>for</strong> label texts that have<br />
four subcategories dealing with prepackaged <strong>food</strong>,<br />
nutritional claims, and nutritional labeling (see Van<br />
den Wijngaart [31] <strong>for</strong> a brief explanation of these<br />
<strong>guidelines</strong>). The important feature of these <strong>guidelines</strong><br />
seems to be that they allow <strong>for</strong> flexibility in national<br />
policy <strong>for</strong>mulation so that local needs are taken care<br />
of. This and the emerging scientific evidence on nutrient<br />
content result in variation in labeling <strong>for</strong>mats and<br />
regulations around the world, which has an impact on<br />
harmony. Greater consistency or harmonization can<br />
only be achieved by discussions among trading partners<br />
and discussions in the Codex meetings, leading to<br />
fewer barriers to international trade with benefits to the<br />
consumers and producers.<br />
Process controls: HACCP<br />
and harmonization<br />
The monitoring and en<strong>for</strong>cement of per<strong>for</strong>mance<br />
standards <strong>for</strong> microbial pathogens is costly. There is a<br />
WHO/FAO protocol that is recognized and <strong>for</strong>ms the<br />
basis <strong>for</strong> the protocol used in the <strong>United</strong> States and
S134<br />
other countries [32, 33]. Several developed nations<br />
such as the <strong>United</strong> States, Canada, and the European<br />
Union countries imposed mandatory Hazard Analysis<br />
and Critical Control Point (HACCP, pronounced<br />
hassip) regulations in the early to mid-1990s.* This<br />
finally led the Codex Alimentarius Commission in<br />
1993 to recommend the use of this approach, since it<br />
is a preventive mechanism to identify and hence avoid<br />
health risks while the production process is operating,<br />
and it transfers the regulation process, which used to be<br />
in the <strong>for</strong>m of end product sampling and testing, away<br />
from the government to the private producer. HACCP<br />
involves seven principles:<br />
» Analyze hazards. Potential hazards associated with<br />
a <strong>food</strong> and measures to control those hazards are<br />
identified. The hazard could be biological, such as a<br />
microbe; chemical, such as a toxin; or physical, such<br />
as ground glass or metal fragments.<br />
» Identify critical control points. These are points in the<br />
production of a <strong>food</strong>—from its raw state through<br />
processing and shipping to consumption by the<br />
consumer—at which the potential hazard can be<br />
controlled or eliminated. Examples are cooking,<br />
cooling, packaging, and metal detection.<br />
» Establish preventive measures with critical limits <strong>for</strong><br />
each control point. For a cooked <strong>food</strong>, <strong>for</strong> example,<br />
this might include setting the minimum cooking<br />
temperature and time required to ensure the elimination<br />
of any harmful microbes.<br />
» Establish procedures to monitor the critical control<br />
points. Such procedures might include determining<br />
how and by whom cooking time and temperature<br />
should be monitored.<br />
» Establish corrective actions to be taken when monitoring<br />
shows that a critical limit has not been met—<strong>for</strong><br />
example, reprocessing or disposing of <strong>food</strong> if the<br />
minimum cooking temperature is not met.<br />
» Establish procedures to verify that the system is working<br />
properly—<strong>for</strong> example, testing time- and temperature-recording<br />
devices to verify that a cooking<br />
unit is working properly.<br />
» Establish effective record-keeping to document the<br />
HACCP system. This would include records of<br />
hazards and their control methods, monitoring<br />
of safety requirements, and actions taken to correct<br />
potential problems. Each of these principles<br />
must be backed by sound scientific knowledge: <strong>for</strong><br />
example, published microbiological studies on time<br />
and temperature factors <strong>for</strong> controlling <strong>food</strong>-borne<br />
pathogens.<br />
HACCP offers a number of advantages. Most importantly,<br />
HACCP focuses on identifying and preventing<br />
hazards from contaminating <strong>food</strong>; it is <strong>based</strong> on sound<br />
* Hazard Analysis Critical Control Point (HACCP) is a preventive<br />
regulatory procedure to identify points in the production<br />
process that are most critical to monitor and control.<br />
S. Ramaswamy and B. Viswanathan<br />
science; it permits more efficient and effective government<br />
oversight, primarily because the record-keeping<br />
allows investigators to see how well a firm is complying<br />
with <strong>food</strong> safety laws over a period rather than how<br />
well it is doing on any given day; it places responsibility<br />
<strong>for</strong> ensuring <strong>food</strong> safety appropriately on the <strong>food</strong><br />
manufacturer or distributor; and it helps <strong>food</strong> companies<br />
compete more effectively in the world market and<br />
reduces barriers to international trade. However, as<br />
Josling et al. [9] note, the push <strong>for</strong> HAACP to achieve<br />
content attributes is ultimately a “process standard” that<br />
is typically more difficult to implement internationally<br />
than a “product standard.”** The aspect of varying<br />
approaches to HACCP leads to the issue of mutual<br />
recognition or equivalence of HACCP procedures but<br />
may eventually end in harmonization.<br />
When the US Food and Drug Administration established<br />
mandatory HACCP regulation in the mid-1990s,<br />
neither efficiency nor distributional effects were considered.***<br />
The impact of this rule on the productivity of<br />
the meat and poultry industry and the variable costs of<br />
production were not taken into consideration, nor were<br />
the administrative costs of regulation [3]. Hence, the<br />
cost of this regulation exceeded the benefits, which was<br />
the reverse of what that the government had claimed.<br />
In several countries, including developed ones such<br />
as Australia, larger firms are in a position to set up<br />
HACCP systems in their production process, whereas<br />
the smaller and medium-sized firms are unable to do<br />
this. There is considerable debate about the impact of<br />
HAACP on plant costs and market structure [34].<br />
Ollinger and Mueller [34] in their analysis, however,<br />
found no appreciable relation between plant size and<br />
ability to absorb sanitation and process control costs.<br />
They also found that implementing pathogen reduction/HACCP<br />
programs in meat and poultry plants<br />
would account <strong>for</strong> about 1.1% of their total costs,<br />
adding about 1.2 cents to the cost of a pound of beef,<br />
0.7 cents to the cost of a pound of pork, and 0.4 cents<br />
to the cost of a pound of poultry. The benefits were<br />
estimated to range from $1.9 to $171.8 billion annually.<br />
This translates into a benefit value (in terms of<br />
health cost savings) that is at least twice the cost to the<br />
industry.<br />
Many smaller nations, <strong>for</strong> example, Turkey in its<br />
trade with the Netherlands in sea<strong>food</strong>, meat, and poultry,<br />
require that all firms participate in the HACCP procedure,<br />
which would involve huge costs [35]. Further,<br />
** Process standards involve complex verification and<br />
en<strong>for</strong>cement procedures by regulatory institutions in two<br />
or more countries. Judgments about the capabilities of the<br />
testing and certifying institutions in the exporting countries<br />
figure prominently in these regulatory decisions [9].<br />
*** In particular, the HACCP regulation in the meat industry<br />
was set to reduce pathogen levels in order to improve <strong>food</strong><br />
hygiene, as was expected by domestic consumers, and also to<br />
raise the trade competitiveness of the product.
Trade, development, and regulatory issues<br />
trade in such products as sea<strong>food</strong> involving a developing<br />
country exporter and a developed country importer<br />
may be costly <strong>for</strong> the <strong>for</strong>mer due to higher marginal<br />
costs of implementing HACCP arising from lower sanitary<br />
standards and lack of technical expertise [36].<br />
The US ban on importation of frozen fish from<br />
Thailand in the 1990s due to salmonella contamination<br />
led to revamping of the Thai industry, with HACCP<br />
standards being imposed universally <strong>for</strong> products sold<br />
in the market [37]. During this trans<strong>for</strong>mation process,<br />
the producers, assisted by producer cooperation,<br />
established producer organizations or more in<strong>for</strong>mal<br />
cooperative working arrangements. Governments and<br />
private institutions also had to deal with varying standards<br />
set by different countries. Bangaldesh’s shrimp<br />
industry introduced HACCP certification with support<br />
from multilateral agencies and government assistance<br />
[38]. This was in response to a European Union ban in<br />
mid-1997 on processing plants with poor hygienic conditions.<br />
Subsequent to all this investment, and because<br />
of the perceived potential of huge export earnings,<br />
there was an overexploitation of natural shrimp farming;<br />
this resulted in declining production from natural<br />
reserves, and the fish-processing plants consequently<br />
began diversifying manufacturing, with some resultant<br />
laxity in <strong>food</strong>-safety standards, all of which presents a<br />
challenge to exporters.<br />
When developing nations trade with any other nation<br />
(e.g., Turkey with the European Union, Colombia’s free<br />
trade agreement with countries in the Andean Community<br />
Region, or Thailand with the <strong>United</strong> States) in<br />
poultry or sea<strong>food</strong> products, and the developed-country<br />
importing partner has mandatory HACCP rules<br />
where the developing countries do not, the exporting<br />
country is faced with the following issues. The larger<br />
firms within these countries are in a position to acquire<br />
resources and also put into place HACCP systems,<br />
whereas the smaller businesses, many of which would<br />
be in the in<strong>for</strong>mal sector, are not in a position to take<br />
advantage of the international trading options. This<br />
may result in these businesses either being shut down<br />
or continuing to produce <strong>for</strong> domestic consumption<br />
when the population already faces large threats from<br />
<strong>food</strong>-borne diseases. Even the management of the<br />
larger firms may not find it worthwhile to invest in<br />
safety when there is less demand <strong>for</strong> such products,<br />
thereby losing out on trade or being taken over by<br />
multinational corporations [9, 39]<br />
Efficiency and equity considerations in <strong>food</strong><br />
safety regulations<br />
The use of pesticides to improve productivity through<br />
control of pests and improvement in storage and transport<br />
is very high in developing countries. There are<br />
also associated health risks due to on-farm ingestion,<br />
S135<br />
contamination of water and air by pesticide discharge,<br />
and consumption of <strong>food</strong> with higher doses of pesticide<br />
residue. By 2001 all the countries within the European<br />
Union had adopted a newer and stricter standard,<br />
whereas most of the other importing countries used the<br />
Codex Alimentarius Commission standard set in 1989<br />
and revised in 1995. This harmonized regime within<br />
the European Union together with nonharmonizaton<br />
within the world market seems to have caused, <strong>for</strong><br />
example, huge losses to many Latin American, Asian,<br />
and African countries in banana exports due to regulations<br />
against importation of residues of chlorpyrifos<br />
pesticide. Further, Wilson and Otsuki [40] showed<br />
through simulated models that the most stringent of<br />
these standards—0.05 ppm by the European Union as<br />
opposed to 2 ppm by the Codex Alimentarius Commission—would<br />
cause a decline in the value of exports of<br />
about 50%, thus significantly affecting the trade flows<br />
<strong>for</strong> the exporting countries.<br />
Among the three major health risks mentioned<br />
above, pesticide residue seems to have the lowest risk,<br />
and the risks are still uncertain due to limited scientific<br />
evidence. Alar (daminozide) residue, which caused<br />
alarm in the early 1990s, carried a negligible lifetime<br />
cancer risk of 1 in 1 million, whereas aflatoxin pesticide<br />
residue is likely to carry a risk of 1.4 deaths per billion<br />
per year in the European Union [41, 42]. There<strong>for</strong>e, a<br />
regulation not adequately backed by scientific evidence<br />
or public health concern would amount to a non-trade<br />
barrier <strong>for</strong> an agricultural commodity. Crop producers<br />
in developing countries that overuse pesticides<br />
are at risk of health problems from direct exposure to<br />
pesticides. On the other hand, there is a resulting loss<br />
of income from declining exports and reduced productivity<br />
if the pesticides are used less. Either course<br />
of action is a disadvantage <strong>for</strong> developing country<br />
farmers and a greater hardship <strong>for</strong> them.The current<br />
stringent measures to restrict pesticide use, however,<br />
would have significant health impacts <strong>for</strong> everybody,<br />
but they need to be imposed provided there are alternative<br />
ways of improving productivity to replace excess<br />
pesticide use.<br />
First, the increase in efficiency due to better quality<br />
and safety standards brings in higher costs of compliance<br />
and increased cost of the product, thereby undermining<br />
the equity considerations, as poorer households<br />
would have to pay a higher price per unit. Second, in<br />
developing nations, where the increased cost could not<br />
be borne by the domestic consumers, the producers<br />
would have to make two products of different quality,<br />
which would add to their cost. In both of these<br />
instances, the government might have to subsidize to<br />
reduce the burden on the consumer in the <strong>for</strong>mer case<br />
or the producer in the latter case. Third, subsidies to the<br />
producers to reduce the cost are not permitted under<br />
the WTO rules, since they are considered discriminatory.<br />
Given this scenario, inspection levels <strong>for</strong> <strong>food</strong>
S136<br />
safety would have to be strengthened in order to avoid<br />
rejection of export shipments owing to contamination<br />
of the higher-quality product with the lower-quality<br />
product, which would increase the cost of regulation<br />
to the government. Fourth, importing countries may<br />
choose to adopt different standards, which are usually<br />
higher than those specified by international agencies.<br />
The continuous changes in standards and the monitoring<br />
of standards would further increase the price<br />
of the product, since the cost of production would be<br />
a nonlinearly increasing function of higher standards<br />
and their effective monitoring. Fifth, if one of the<br />
main intentions of promoting trade liberalization is<br />
to enhance growth and reduce poverty among the less<br />
developed and developing countries, then the higher<br />
standards imposed on <strong>food</strong> safety would increasingly<br />
channel the resources from export earnings toward<br />
ensuring <strong>food</strong> safety <strong>for</strong> the world market, neglecting<br />
several other investments (such as health, education,<br />
and sanitation) that might have more widespread and<br />
long-term benefits <strong>for</strong> the low-income country.<br />
Arguments emerging from developing countries in<br />
favor of harmonizing with international <strong>food</strong> safety<br />
standards do not seem to indicate a loss in equity<br />
considerations, <strong>for</strong> the following reasons [43]. Food<br />
safety standards in developing countries are very low,<br />
and trying to align with international standards would<br />
surely bring large health benefits to the domestic<br />
consumers. Low <strong>food</strong> hygiene standards account <strong>for</strong><br />
a huge number of deaths in developing countries: up<br />
to 70% of diarrhea cases among children under 5 may<br />
be due to <strong>food</strong>-borne contaminants, and several other<br />
pathogenic and parasitic infections are carried by <strong>food</strong><br />
[44]. Better in<strong>for</strong>mation flow with the possibility of<br />
<strong>for</strong>eign technical collaboration and advice would bring<br />
improvements in technical expertise of the producers<br />
and an upgrading of their skills. One of the conditions<br />
of the WTO is that (developed) exporting countries<br />
should assist exporting countries in setting standards<br />
so that the higher standards do not appear a barrier to<br />
trade. An example is the development of supermarkets<br />
in Central America during the phase of increased<br />
exports of fresh fruits and vegetables to developed<br />
countries. Berdegue et al. [45] note that the supermarkets<br />
have begun to raise quality and safety standards,<br />
and domestic sales from supermarkets are growing<br />
faster than exports from this region. This has happened<br />
because of improvements in procurement standards<br />
and imposition of higher standards on the suppliers,<br />
as well as increasing emphasis on safety aspects along<br />
with cosmetic and flavor concerns. However, the effects<br />
of these changes have reached only the middle- and<br />
upper-income segments of the population and are<br />
more marked in those countries where the government<br />
takes a stronger hand in en<strong>for</strong>cing safety standards.<br />
Similarly, the trade in fresh vegetables between sub-<br />
Saharan Africa and the <strong>United</strong> Kingdom has grown<br />
rapidly with improvements in quality and safety, but<br />
this has resulted from the rules imposed by a few large<br />
retailers in the <strong>United</strong> Kingdom and has marginalized<br />
the smaller exporters [46]. As Busch and Bain [47]<br />
highlight, with the global trans<strong>for</strong>mation of agri<strong>food</strong><br />
systems in the post-WTO phase, private standards are<br />
on the rise with the growing influence of private <strong>food</strong><br />
retailers who are more global and oligopolistic.<br />
It is clear that improvements in governance will<br />
ensure better participation in international rulemaking,<br />
and since good governance has a strong public<br />
health component, will improve overall well-being. But<br />
<strong>for</strong> the developing world in particular, the problems<br />
stem not just from weak governance and lack of concrete<br />
scientific evidence to justify harmonization (given<br />
all other developmental pressures). We also should be<br />
aware that in many countries, the diverse local ethnic<br />
groups may or may not share the same commitment<br />
to national or international institutions or to (Western)<br />
scientific methods. Moreover, in the presence of<br />
rampant illiteracy, social taboos and discriminatory<br />
attitudes that often prevent women in general and<br />
ethnic minorities in particular from participating fully<br />
in national governance or even in markets all serve to<br />
exacerbate the a<strong>for</strong>ementioned issues.<br />
Conclusions<br />
S. Ramaswamy and B. Viswanathan<br />
This article has reviewed the process of harmonization<br />
concerning nutritional issues in <strong>food</strong> trade regulation<br />
around the globe to try and understand who the winners<br />
and losers are and whether harmonization is an<br />
effective mechanism to promote the goal of safer and<br />
nutritious <strong>food</strong> with regular access at the lowest price.<br />
With the <strong>for</strong>mation of the WTO and the ongoing<br />
process of globalization, there has been an increase<br />
in global trade in <strong>food</strong> and animal products. The<br />
increased exchange of goods around the globe to<br />
benefit from a lowered tariff regime, however, seems<br />
to have also brought in nontariff barriers to trade in<br />
the <strong>for</strong>m of safety and quality standards. Most of the<br />
regulations expectedly emanate from the developed<br />
nations (in particular the European Union), who have<br />
been net importers of <strong>food</strong> in recent times and where<br />
consumer concern about <strong>food</strong> safety has been rather<br />
high. This concern, however, has to be balanced by<br />
concern <strong>for</strong> those in the developing nations <strong>for</strong> whom<br />
earnings from international trade are an opportunity<br />
<strong>for</strong> faster growth in the short run and possibly poverty<br />
reduction in the long run. There<strong>for</strong>e, lack of access to<br />
developed-country markets <strong>for</strong> <strong>food</strong> and agricultural<br />
products because of stricter regulations, which is a<br />
competitive advantage, is a cause <strong>for</strong> concern.<br />
As has been discussed above, regulations of <strong>food</strong><br />
safety and quality have existed since the early 1960s,<br />
with the setting up of the Codex Alimentarius Com-
Trade, development, and regulatory issues<br />
mission jointly by FAO and WHO. Despite <strong>guidelines</strong><br />
given by these world bodies, countries have evolved<br />
their own regulations according to their level of development.<br />
This has resulted in different standards and<br />
regulatory practices, some of which follow the Codex<br />
and others of which have either lower or higher standards<br />
than the Codex. However, many of these rules are<br />
being revised more frequently than has been the case<br />
in the past. In general, it is always costly <strong>for</strong> an exporting<br />
country to trade when there are several types of<br />
regulations followed by different importing nations,<br />
especially when some of these regulations seem to be<br />
discriminatory in nature in the absence of sufficient<br />
scientific knowledge on how to assess the losses from<br />
nonadherence.<br />
In order to ensure smooth trade, a harmonized<br />
framework that allows <strong>for</strong> uni<strong>for</strong>m codes and norms<br />
while pooling scientific knowledge has to be pursued<br />
by both the WTO and the Codex Alimentarius Commission.<br />
Under the WTO there are two agreements,<br />
the SPS and the TBT, which address the regulations<br />
<strong>for</strong> <strong>food</strong> safety; the SPS deals with human, animal, and<br />
plant health-related concerns, whereas the TBT deals<br />
with non-health-related quality issues. The SPS mainly<br />
draws its rules from the Codex, whereas under the TBT<br />
technical aspects have evolved through bilateral and<br />
multilateral discussions.<br />
Among several <strong>food</strong> safety concerns, <strong>food</strong> <strong>for</strong>tification,<br />
the loading of additional micronutrients, directly<br />
concerns nutrition, and the problem clearly differs<br />
between developed and developing countries. The<br />
<strong>for</strong>mer are increasingly concerned about higher doses<br />
than are required, whereas the latter are still grappling<br />
with public health problems due to far lower intakes<br />
of micronutrients. Under a situation of universal <strong>for</strong>tification,<br />
mandatory <strong>for</strong>tification may be justified in<br />
some situations, whereas not all countries may impose<br />
it. Consequently, the same set of rules <strong>for</strong> levels of <strong>for</strong>tificants<br />
is not possible, and harmonization could lead<br />
to disputes. It should also be noted that the harmful<br />
effects of a dosage level are not always clearly known,<br />
while only consumer concerns seem to determine the<br />
standard. This aspect is more apparent in the trade in<br />
genetically modified <strong>food</strong>s, where the European Union<br />
in particular has requested labeling and traceability. In<br />
recent times the European Union has approved some<br />
genetically modified <strong>food</strong>s but overall has imposed<br />
strict regulations, while countries like the <strong>United</strong> States<br />
contend that in the absence of clear evidence on adverse<br />
impacts, there should not be any restrictions on the<br />
movement of such goods. Countries like Zambia that<br />
suffer from high levels of malnutrition have strongly<br />
opposed genetically modified imports, mainly because<br />
of fear of contamination of other crops, some of whose<br />
products are exported to the European Union. At the<br />
same time, several neighboring countries of Zambia<br />
have approved the entry of genetically modified crops,<br />
S137<br />
either through imports or in the <strong>for</strong>m of <strong>food</strong> aid.<br />
The issue of nutrition labeling attempts to address<br />
public health concerns such as obesity while knowing<br />
very well that labeling may have limited impact. This is<br />
an issue that concerns the affluent, who have a higher<br />
consumption of processed <strong>food</strong> along with a sedentary<br />
lifestyle. Naturally, when a majority of the population is<br />
still on subsistence consumption and illiterate, labeling<br />
is a nonissue. More importantly, the empirical evidence<br />
<strong>for</strong> the success of labeling in general in educating and<br />
modifying consumer behavior is mixed and in the case<br />
of nutrition labeling is limited. More interesting is the<br />
issue of labeling of genetically modified <strong>food</strong>, which<br />
seems to be the core concern <strong>for</strong> trade, even though<br />
the adverse impact of genetically modified <strong>food</strong> is also<br />
not well known. There<strong>for</strong>e, rather than harmonization,<br />
equivalence is a preferred option <strong>for</strong> labeling and<br />
is considered efficient by some countries. Similarly,<br />
HACCP is another regulation <strong>for</strong> which harmonization<br />
is important in the sense of having a system in place<br />
<strong>for</strong> the <strong>food</strong>-processing industry. However, confusion<br />
prevails as to whether the process itself needs some<br />
standardization and whether there should be checks on<br />
pathogen levels at the entry point even when HACCP<br />
is followed by the exporting country.<br />
If free trade is the goal, then there must obviously<br />
be few to no regulations; but if consumer health and<br />
protection are the goals, then variations in <strong>food</strong> and<br />
hygiene standards and immunity levels of the population<br />
surely require country-specific regulations. Clearly<br />
the challenge <strong>for</strong> a harmonized framework under a<br />
liberalized trade regime, particularly <strong>for</strong> <strong>food</strong>, lies in<br />
the fact that the regulations sometimes cannot be <strong>based</strong><br />
on scientific evidence alone, since they are also influenced<br />
by varying tastes and cultures and differences<br />
in the level of economic development that ought to be<br />
considered in a comprehensive manner.<br />
In conclusion, there is a lot to be gained in terms of<br />
a benefit-cost ratio by participating in international<br />
<strong>food</strong> trade with harmonized regulations; however,<br />
more sustained and solid research is needed. Given the<br />
limited evidence, <strong>based</strong> mainly on developed country<br />
research, it is clear that the impact varies with the context<br />
or the nature of the commodity traded. Quantifiable<br />
estimates of developing country impacts are very<br />
few, and the emphasis <strong>for</strong> further research needs to be<br />
on this. Nevertheless, it would be worthwhile to follow<br />
equivalence wherever the trade is still at the regional<br />
level to allow some flexibility <strong>for</strong> an individual nation’s<br />
choices and pursue <strong>for</strong>eign aid, technology transfer,<br />
and management advice whenever the economically<br />
disadvantaged nation is lagging in standards. At the<br />
same time, it would be necessary to educate the heads<br />
of government and the population in developing countries<br />
on the existing scientific practices and evidence<br />
on health hazards and the need <strong>for</strong> effective nutrient<strong>based</strong><br />
<strong>dietary</strong> standards. <strong>Implementing</strong> stricter rules
S138<br />
within their own nations not only would improve their<br />
access to world trade but also would result in reduction<br />
in <strong>food</strong>-borne diseases and related mortality. The<br />
increased awareness would not only enable them to<br />
effectively (and increasingly) participate in the Codex<br />
meetings to raise issues of concern on local <strong>food</strong> consumption<br />
patterns and health (during the <strong>for</strong>mulation<br />
of international rules on <strong>food</strong> safety standards) but also<br />
use the dispute settlement mechanism of the WTO by<br />
being able to distinguish between a regulatory standard<br />
and a nontrade barrier. There is lot to be done in<br />
References<br />
1. Food and Agriculture Organization. Report on the<br />
independent evaluation of the Codex Alimentarius<br />
and FAO-WHO work on <strong>food</strong> standards. Rome: FAO,<br />
2002.<br />
2. Caswell JA, Wang J. Quantifying regulatory barriers to<br />
Asian-US <strong>food</strong> trade. J Agrib 2001; 19:121–8.<br />
3. Antle JM. Benefits and costs of <strong>food</strong> safety regulation.<br />
Food Policy 1999;24 (6):605–23.<br />
4. Unnevehr L, Jensen HH. The economic implications of<br />
using HACCP as a <strong>food</strong> safety regulatory standard. Food<br />
Policy 1999; 24:625–35.<br />
5. MacLaren D. Trade barriers and <strong>food</strong> safety standards.<br />
Working paper presented at a conference sponsored<br />
by the Australian Centre <strong>for</strong> International Agricultural<br />
Research, Bangkok, Thailand, October 1, 2002. Available<br />
at: http://rspas.anu.edu.au/economics/publish/papers/<br />
aciar/aciar_2002_mclaren.pdf. Accessed 5 November<br />
2006.<br />
6. Antle JM. Efficient <strong>food</strong> safety regulation in the <strong>food</strong><br />
manufacturing sector. Am J Agri Econ 1996;78:1242–7.<br />
7. Caswell JA, Mojduszka EM. Using in<strong>for</strong>mational labeling<br />
to influence the market <strong>for</strong> quality in <strong>food</strong> products.<br />
Am J Agri Econ 1996;78:1248–53.<br />
8. Henson S, Caswell J. Food safety regulation: An overview<br />
of contemporary issues. Food Policy 1999;24:589–604.<br />
9. Josling T, Roberts D, Orden D. Food regulation and<br />
trade. Washington, DC: Institute of International Economics,<br />
2004.<br />
10. Orriss GD. Food <strong>for</strong>tification, safety and regulation.<br />
Food Nutr Bull 1998;19:109–15.<br />
11. World Trade Organization. Sanitary and Phytosanitary<br />
(SPS) Training Module: Chapter 1. Introduction to<br />
the SPS Agreement. Available at: http://www.wto.org/<br />
english/tratop_e/sps_e/sps_agreement_cbt_e/c1s5p1_<br />
e.htm. Accessed 27 November 2006.<br />
12. USDA Database of Notifications to the Sanitary and<br />
Phytosanitary Committee and Technical Barriers to<br />
Trade Committee of the World Trade Organization,<br />
Foreign Agricultural Services, Division of Food Safety<br />
and Technical Services. Washington D.C: USDA, 2002.<br />
13. Athukorala P-C, Jayasuriya S. Food safety issues, trade<br />
and WTO rules: A developing country perspective.<br />
World Econ 2003;26:1395–416.<br />
14 Joint FAO/WHO Food Standards Programme, Codex<br />
Alimentarius Commission, Twenty-eighth Session, FAO<br />
Headquarters, Rome, 4–9 July 2005. Available at: http://<br />
this area, but clearly steps are being taken in the right<br />
direction.<br />
Acknowledgments<br />
S. Ramaswamy and B. Viswanathan<br />
Dr. Ramaswamy would like to thank two anonymous<br />
reviewers and the participants in the meeting on<br />
“Nutrient-Based Dietary Standards” <strong>for</strong> valuable comments<br />
on an earlier draft.<br />
www.fao.org/UNFAO/Bodies/Codex/28/index_en.htm.<br />
Accessed 5 November 2006.<br />
15. European Parliament. Fortification—addition of vitamins<br />
and minerals to <strong>food</strong>: EP debates Commission<br />
proposal. EP Daily Notebook, 26 May 2005. Food Law<br />
News—EU—2005. Available at: http://www.<strong>food</strong>law.rdg.<br />
ac.uk/news/eu-05053.htm. Accessed 5 November 2006.<br />
16. Ray JG. Folic acid <strong>food</strong> <strong>for</strong>tification in Canada. Nutr Rev<br />
2004;62:S35–9.<br />
17. Sichert-Hellert W, Kersting M. Fortifying <strong>food</strong> with folic<br />
acid improves folate intake in German infants, children,<br />
and adolescents. J Nutr 2004;134:2685–90.<br />
18. Quinlivan E, Gregory JF 3rd. Effect of <strong>food</strong> <strong>for</strong>tification<br />
on folic acid intake in the <strong>United</strong> States. Am J Clin Nutr,<br />
2003;77:221–5.<br />
19. Botto LD, Lisi A, Robert-Gnansia E, Erickson JD, Vollset<br />
SE, Mastroiacovo P, Botting B, Cocchi G, de Vigan<br />
C, de Walle H, Feijoo M, Irgens LM, McDonnell B,<br />
Merlob P, Ritvanen A, Scarano G, Siffel C, Metneki J,<br />
Stoll C, Smithells R, Goujard J. International retrospective<br />
cohort study of neural tube defects in relation to<br />
folic acid recommendations: Are the recommendations<br />
working? BMJ 2005;330:571.<br />
20. Robertson A. Priorities <strong>for</strong> eliminating IDD in CCEE<br />
(central and eastern Europe) and NIS (newly independent<br />
states of <strong>for</strong>mer USSR). Regional conference on<br />
elimination of IDD in central and eastern Europe, the<br />
Commonwealth of Independent States and the Baltic<br />
States, Munich, September 1997 http://www.euro.<br />
who.int/Document/Nut/IDDPRIO1.pdf. Accessed 26<br />
November 2006.<br />
21. Pandey CS, Kumar A, Moorthy D, Anand K, Sankar R,<br />
Karmarkar MG. Sustainable elimination of iodine deficiency<br />
disorders in India. All India Institute of Medical<br />
Sciences, New Delhi, Mimeo. 2005.<br />
22. HarvestPlus. Bio<strong>for</strong>tification frequently asked questions.<br />
Available at: http://www.harvestplus.org/biofaqs.html.<br />
Accessed 27 November 2006.<br />
23. Stein AJ, Meenakshi JV, Qaim M, Nestel P, Sachdev HPS,<br />
Bhutta ZA. Analyzing the health benefits of bio<strong>for</strong>tified<br />
staple crops by means of the disability-adjusted life<br />
years approach: A handbook focusing on iron, zinc and<br />
vitamin A. Technical Monographs Series 4. Washington,<br />
DC: HarvestPlus, 2005. www.harvestplus.org/pubs.html.<br />
Accessed 26 November 2006.<br />
24. World Health Organization: Department of Food Safety,
Trade, development, and regulatory issues<br />
Zoonoses and Foodborne Diseases. Modern <strong>food</strong><br />
biotechnology, human health and development: An<br />
evidence <strong>based</strong> study. Geneva: WHO, 2005.<br />
25. Cohen JI, Quemada H, Frederick R. Food safety and GM<br />
crops: Implications <strong>for</strong> developing-country research.<br />
In: Unnevehr LJ, ed. Food safety in <strong>food</strong> security and<br />
<strong>food</strong> trade. 2020 vision <strong>for</strong> <strong>food</strong>, agriculture, and the<br />
environment. Focus 10, brief 16 of 17, September 2003.<br />
Washington, DC: International Food Policy Research<br />
Institute, 2003. Available at: http://www.ifpri.org/2020/<br />
focus/focus10.asp. Accessed 4 November 2006.<br />
26. US Department of Agriculture Foreign Agricultural<br />
Service. Global Agriculture In<strong>for</strong>mation Network.<br />
Canada <strong>food</strong> and agriculture import regulations and<br />
standards: Canada introduces mandatory nutrition<br />
labeling 2003. GAIN Report No. CA3001, 3 January<br />
2003. Available at: http://www.miatco.org/us_<strong>food</strong>/<br />
links_info/145785021.pdf. Accessed 4 November 2006.<br />
Accessed 4 November 2006.<br />
27. US Food and Drug Administration. Docket No. 94P-<br />
0036. Food labeling health claims. Procter & Gamble.<br />
2001. Available at: http://www.fda.gov/ohrms/dockets/<br />
dailys/01/Jan01/012201/emc0498.pdf. Accessed 27<br />
November 2006.<br />
28. Curran MA. Nutrition labelling: Perspectives of a binational<br />
agency <strong>for</strong> Australia and New Zealand. Asia<br />
Pac J Clin Nutr, 2002;11:S72–6.<br />
29. Hurt E. Nutrition labelling: European Union and <strong>United</strong><br />
Kingdom perspectives. Asia Pac J Clin Nutr, 2002;11:<br />
S77–9.<br />
30. Tee ES, Tamin S, Ilyas R, Ramos A, Tan WL, Lai DK,<br />
Kongchuntuk H. Current status of nutrition labelling<br />
and claims in the South-East Asian region: Are we in<br />
harmony? Asia Pac J Clin Nutr, 2002;11:S80–6.<br />
31. Van den Wijngaart AW. Nutrition labelling: Purpose,<br />
scientific issues and challenges. Asia Pac J Clin Nutr,<br />
2002;11:S68–71.<br />
32. Food and Agriculture Organization/World Health<br />
Organization. Principles and <strong>guidelines</strong> <strong>for</strong> incorporating<br />
microbiological risk assessment in the development<br />
of <strong>food</strong> safety standards, <strong>guidelines</strong> and related texts, a<br />
joint FAO/WHO consultation report, Kiel, Germany,<br />
18–22 March 2002. Available at: http://www.who.int/<br />
<strong>food</strong>safety/publications/micro/march2002/en/index.<br />
html. Accessed 4 November 2006.<br />
33. Food and Agriculture Organization/World Health<br />
Organization. A model <strong>for</strong> establishing upper levels<br />
of intake <strong>for</strong> nutrients and related substances. Report<br />
of a joint FAO/WHO technical workshop on nutrient<br />
risk assessment, Geneva, Switzerland, 2–6 May 2005.<br />
Available at: http://www.who.int/ipcs/highlights/nutrientproject_may18/en/index.html.<br />
Accessed 4 November<br />
2006.<br />
34. Ollinger M, Mueller V. Managing <strong>for</strong> safer <strong>food</strong>: The<br />
economics of sanitation and process controls in meat<br />
and poultry plants. Agricultural Economic Report No.<br />
817. US Department of Agriculture, Economic Research<br />
Service, 2003. Available at: http://www.ers.usda.gov/<br />
publications/aer817/. Accessed 4 November 2006.<br />
35. FAO/WHO Global Forum of Food Safety Regulators,<br />
Marrakesh, Morocco, 28–30 January 2002. Food<br />
inspection system in Turkey and a short look to new<br />
developments. Available at: http://www.fao.org/docrep/<br />
S139<br />
meeting/004/x6920e.htm. Accessed 26 November<br />
2006.<br />
36. Cham Prasidh HE. Food trade and implementation of<br />
the SPS and TBT agreements: Challenges <strong>for</strong> developing<br />
countries in meeting the obligations of the SPS and TBT<br />
agreements and the Codex Alimentarius. Conference<br />
on international <strong>food</strong> trade beyond 2000: science-<strong>based</strong><br />
decisions, harmonization, equivalence and mutual recognition,<br />
Melbourne, Australia, 11–15 October 1999.<br />
ALICOM 99/6. Available at: http://www.fao.org/docrep/<br />
meeting/X2666E.htm. Accessed 4 November 2006.<br />
37. Buzby JC, ed. International trade and <strong>food</strong> safety:<br />
Economic theory and case studies. Washington, DC:<br />
US Department of Agriculture. Agricultural Economic<br />
Report No. 828, 2003. Available at: http://www.ers.<br />
usda.gov/publications/aer828/aer828.pdf. Accessed 27<br />
November 2006.<br />
38. Cato JC, Subasinge S. Case study: The shrimp export<br />
industry in Bangladesh. In: Unnevehr LJ, ed. Food safety<br />
in <strong>food</strong> security and <strong>food</strong> trade. 2020 vision <strong>for</strong> <strong>food</strong>,<br />
agriculture, and the environment. Focus 10, brief 9 of 17,<br />
September 2003. Washington, DC: International Food<br />
Policy Research Institute, 2003. Available at: http://www.<br />
ifpri.org/2020/focus/focus10.asp. Accessed 26 November<br />
2006.<br />
39. Gómez MI, Sierra DN, Rodriguez D. Case study: The<br />
poultry industry in Colombia. In: Unnevehr LJ, ed. Food<br />
safety in <strong>food</strong> security and <strong>food</strong> trade. 2020 vision <strong>for</strong><br />
<strong>food</strong>, agriculture, and the environment. Focus 10, brief<br />
14 of 17, September 2003. Washington, DC: International<br />
Food Policy Research Institute, 2003. Available at:<br />
http://www.ifpri.org/2020/focus/focus10.asp. Accessed<br />
4 November 2006.<br />
40. Wilson JS, Otsuki T. To spray or not to spray: Pesticides,<br />
banana exports and <strong>food</strong> safety. Food Policy 2004;29<br />
(2):131–46.<br />
41 Macfarlane R. Integrating the consumer interest in <strong>food</strong><br />
safety: The role of science and other factors. Food Policy<br />
2002;27:65–80.<br />
42. Otsuki T, Wilson JS, Sewadeh M. A race to the top? A<br />
case study of <strong>food</strong> safety standards and African Exports.<br />
Policy Research Working Paper No. 2563. Washington,<br />
DC: World Bank, 2001.<br />
43. Athukorala P-C, Gulati A, Jayasuriya S, Mehta R,<br />
Nidhiprabha B. International <strong>food</strong> safety regulation<br />
and processed <strong>food</strong> exports from developing countries:<br />
The policy context, and the purpose and scope of the<br />
research project. Presented at a conference sponsored<br />
by the Australian Centre <strong>for</strong> International Agricultural<br />
Research, Thammasat University, 1 October 2002,<br />
Bangkok, Thailand. http://rspas.anu.edu.au/economics/<br />
publish/papers/aciar/aciar_2002_athukorala_et_al.pdf.<br />
Accessed 26 November 2006.<br />
44. Käferstein F. Food safety as a public health issue <strong>for</strong><br />
developing countries. In: Unnevehr LJ, ed. Food safety<br />
in <strong>food</strong> security and <strong>food</strong> trade. 2020 vision <strong>for</strong> <strong>food</strong>,<br />
agriculture, and the environment. Focus 10, brief 2 of<br />
17, September 2003. Washington, DC: International<br />
Food Policy Research Institute, 2003. Available at:<br />
http://www.ifpri.org/2020/focus/focus10.asp. Accessed<br />
4 November 2006.<br />
45. Berdegué JA, Balsevich F, Flores L, Reardon T. Central<br />
American supermarkets’ private standards of quality
S140<br />
and safety in procurement of fresh fruits and vegetables.<br />
Food Policy 2004 (30):254: 269.<br />
46. Dolan C, Humphrey J. Governance and trade in fresh<br />
vegetables: The impact of UK supermarkets on the Afri-<br />
S. Ramaswamy and B. Viswanathan<br />
can horticulture industry. J Dev Stud 2000;37:147–76.<br />
47. Busch L, Bain C. New! Improved? The trans<strong>for</strong>mation<br />
of the global agri<strong>food</strong> system. Rural Sociology 2004;<br />
69:321–46.
Beyond recommendations: <strong>Implementing</strong> <strong>food</strong>-<strong>based</strong> <strong>dietary</strong><br />
<strong>guidelines</strong> <strong>for</strong> healthier populations<br />
Suttilak Smitasiri and Ricardo Uauy<br />
Abstract<br />
To reduce the increased burden of diet-related disease<br />
and promote human potential through <strong>food</strong> and nutrition<br />
globally, harmonization of ef<strong>for</strong>ts is urgently needed.<br />
This article examines the concept of <strong>food</strong>-<strong>based</strong> <strong>dietary</strong><br />
<strong>guidelines</strong> (FBDGs) and discusses the possibilities and<br />
challenges of harmonizing the process of developing and<br />
implementing <strong>dietary</strong> <strong>guidelines</strong>. The authors argue<br />
that while the development of FBDGs has contributed to<br />
the understanding of the role of nutrients and <strong>food</strong>s in<br />
achieving optimal health, the impact of these <strong>guidelines</strong><br />
on human health has been limited.<br />
Science or evidence must be used in FBDG development;<br />
nevertheless, there are limitations in current<br />
nutrition science. FBDGs should address the health consequences<br />
of <strong>dietary</strong> insufficiency, excess, or imbalance<br />
with a broader perspective, considering the totality of the<br />
effects of a given <strong>dietary</strong> pattern, rather than focusing<br />
on single nutrients alone. Moreover, the <strong>food</strong> selection<br />
guideline should be seen as complementary to a strategic,<br />
comprehensive, and culturally appropriate <strong>dietary</strong> and<br />
health promoting intervention, and not only as a tool <strong>for</strong><br />
providing nutrition policy and in<strong>for</strong>mation.<br />
Technically, a single unified global set of FBDGs may<br />
be desirable and even achievable. This concept, however,<br />
presents novel challenges on how to address cultural<br />
diversity and the complex social, economic, and political<br />
interactions between humans and the <strong>food</strong> supply, not<br />
to mention the complexity of its communication and<br />
Suttilak Smitasiri is affiliated with the Institute of Nutrition,<br />
Mahidol University (INMU), Nakorn Phathom, Thailand;<br />
Ricardo Uauy is affiliated with the Instituto de Nutrición<br />
y Technología de los Alimentos (INTA), University of Chile,<br />
Santiago, Chile, and the Nutrition and Public Health Intervention<br />
Research Unit, London School of Hygiene and Tropical<br />
Medicine, London.<br />
Please direct queries to the corresponding author: Suttilak<br />
Smitasiri, Division of Communication and Behavioral<br />
Science, Institute of Nutrition, Mahidol University (INMU),<br />
Phuthamonthon 4 Road, Salaya, Nakorn Phathom 73170,<br />
Thailand; e-mail: nussm@mahidol.ac.th.<br />
implementation. There<strong>for</strong>e, global harmonized ef<strong>for</strong>ts in<br />
support of strategic <strong>dietary</strong> interventions, together with<br />
strong global scientific support and facilitation <strong>for</strong> the<br />
development and communication of FBDGs at national<br />
or regional levels, are proposed to implement FBDGs <strong>for</strong><br />
healthier populations.<br />
Key words: Food-<strong>based</strong> <strong>dietary</strong> <strong>guidelines</strong>, nutrient<strong>based</strong><br />
<strong>dietary</strong> <strong>guidelines</strong>, <strong>food</strong> selection guides, unified<br />
<strong>food</strong> <strong>guidelines</strong><br />
Introduction<br />
The establishment of <strong>food</strong>- or nutrient-<strong>based</strong> <strong>dietary</strong><br />
<strong>guidelines</strong> (FBDGs or NBDGs) is a complex issue; this<br />
complexity will most likely continue to increase in the<br />
future as knowledge of the science base and the need to<br />
consider context in the application of FBDGs/NBDGs<br />
increase. International agencies and national authorities<br />
around the world are faced with the need to in<strong>for</strong>m<br />
and educate all constituencies involved in this process.<br />
Food and nutrition policy makers, planners, and<br />
common citizens need to be able to manage and make<br />
<strong>food</strong> choices at the national, community and individual<br />
levels. Several countries, beginning with those in the<br />
industrialized world, have developed FBDGs as one<br />
of many tools <strong>for</strong> this purpose. FBDGs are generally<br />
developed with the expectation that they will help to<br />
improve the effectiveness of nutrition education ef<strong>for</strong>ts,<br />
directed both to the general public and at the national<br />
level [1].<br />
The US Government has developed and tendered<br />
official <strong>dietary</strong> advice <strong>for</strong> the public since 1894. The<br />
first US <strong>food</strong> guides were promoted in 1916 as conceptual<br />
frameworks <strong>for</strong> selecting the kinds and amounts<br />
of a variety of <strong>food</strong>s, which together provided a nutritionally<br />
satisfactory diet [2, 3]. Over the years, the US<br />
<strong>food</strong> guides have changed as nutrition knowledge has<br />
advanced and new discoveries relating diet and health<br />
have been made. The guides primarily focused on the<br />
Food and Nutrition Bulletin, vol. 28, no. 1 (supplement) © 2007, The <strong>United</strong> <strong>Nations</strong> University. S141
S142<br />
needs of individuals; they were supposed to ensure that<br />
people were getting enough nutrients from their diet.<br />
This focus has progressively been reoriented by the<br />
need to obtain a diet sufficient in energy and specific<br />
nutrients and avoiding deficiency as well as excess.<br />
In 1992, despite successful promotion of <strong>food</strong> guides,<br />
the US government wanted the public to place greater<br />
emphasis on following FBDGs and thus developed the<br />
Food Guide Pyramid as a graphic representation of the<br />
<strong>dietary</strong> <strong>guidelines</strong> [4]. As a result, several countries in<br />
both developed and developing regions of the world<br />
followed the approach taken by the US Department of<br />
Agriculture in establishing <strong>dietary</strong> <strong>guidelines</strong> as well as<br />
in adopting or applying the Food Guide Pyramid [5].<br />
The greater recognition of how <strong>dietary</strong> changes affect<br />
patterns of disease and the evidence that a nutrition<br />
transition was occurring led the Food and Agriculture<br />
Organization/World Health Organization (FAO/WHO)<br />
to address the need to establish a common approach in<br />
the “Preparation and use of <strong>food</strong>-<strong>based</strong> <strong>dietary</strong> <strong>guidelines</strong>.”<br />
The corresponding report of the joint Expert<br />
Consultation was published in 1996 [6]. The objective of<br />
establishing FBDGs was both to ensure the prevention<br />
of nutrition-related communicable diseases (NRCDs)<br />
and to prevent nutritional deficiencies through proper<br />
nutrition education and <strong>food</strong>-<strong>based</strong> interventions if<br />
necessary. This publication has been of key importance<br />
<strong>for</strong> international agencies, especially FAO and WHO,<br />
as well as <strong>for</strong> countries in the promotion of national<br />
FBDGs. FBDGs have served to take nutrient-<strong>based</strong><br />
recommendations one step closer to practice, particularly<br />
in developing countries. They have also served to<br />
define nutrition education goals as part of the national<br />
plans of actions <strong>for</strong> improved nutrition [1]. Recently,<br />
some fundamental questions regarding the concept and<br />
effectiveness of FBDGs have been raised. For instance,<br />
evidence indicates that inappropriate diets and lack of<br />
physical activity are responsible <strong>for</strong> approximately 30%<br />
of preventable morbidity and mortality in the <strong>United</strong><br />
States. Given the fact that FBDGs have been developed<br />
and implemented in the country <strong>for</strong> more than 100<br />
years, the success of the <strong>food</strong> guides in contributing<br />
to better health and nutrition of this population is<br />
thus open to question [7]. Other critical issues raised<br />
include the process utilized in deriving FBDGs and<br />
the process used in developing a scientific consensus,<br />
insufficient participation of important stakeholders<br />
in the developmental process, lack of transparency in<br />
both their development and implementation as well as<br />
a greater concern about scientific adequacy in examining<br />
the relationship between diet and disease. Further,<br />
some suggest that the real criticism of the FBDGs is<br />
the fact that governments have not yet given adequate<br />
attention to promoting them [2, 7–9].<br />
This article aims to examine the concept of FBDGs<br />
and explore the possibility of harmonizing the process<br />
of developing <strong>dietary</strong> <strong>guidelines</strong>. We will also suggest<br />
S. Smitasiri and R. Uauy<br />
ways and means to enhance effectiveness of future<br />
FBDGs by addressing critical aspects of both development<br />
and implementation. The specific objectives<br />
are to<br />
» Provide a brief background on the evolution of<br />
FBDGs in various countries;<br />
» Establish the necessary science-<strong>based</strong> foundation <strong>for</strong><br />
the development of FBDGs;<br />
» Specify the necessary processes in the development<br />
and the key elements <strong>for</strong> success in the implementation<br />
of FBDGs within countries and regions;<br />
» Discuss weaknesses and strengths in the communication<br />
and implementation strategies <strong>for</strong> FBDGs;<br />
» Recommend ways and means to enhance effectiveness<br />
of the FBDGs in the future;<br />
» Analyze whether harmonized approaches in establishing<br />
global FBDGs are desirable, possible, and<br />
achievable.<br />
The foundations of FBDG development:<br />
Common sense and science<br />
Food selection guides have been proven useful in the<br />
past, especially during difficult times when it was necessary<br />
to manage national <strong>food</strong> supplies and <strong>food</strong> and<br />
nutrition security carefully. During World War I, <strong>for</strong><br />
example, the <strong>food</strong> guides and related campaigns served<br />
to define targets <strong>for</strong> <strong>food</strong> production and distribution<br />
in an ef<strong>for</strong>t to balance the requirements of feeding US<br />
troops and populations. They were also helpful in the<br />
control and management of <strong>food</strong> security problems<br />
and undernutrition during the Great Depression. The<br />
US Government used the <strong>food</strong> guides to issue monthly<br />
ration stamps to citizens and assigned point values <strong>for</strong><br />
each <strong>food</strong> item in order to ensure national <strong>food</strong> security<br />
during World War II [2]. As societal dynamics became<br />
more complex during times of peace, <strong>food</strong> selection<br />
guides and other <strong>food</strong> and nutrition policies became<br />
closely linked in the country [8].<br />
Thus, it can be said that <strong>food</strong> selection guides<br />
were originally created with the common sense and<br />
good will of individuals in a society ready to follow<br />
<strong>guidelines</strong> to avoid hunger and starvation among its<br />
citizens. These guides become especially important<br />
in convincing the public to sacrifice a more abundant<br />
<strong>food</strong> supply in order to support more urgent priorities,<br />
i.e., feeding the troops to win a war. During wartime,<br />
mass psychology as a <strong>for</strong>ce shaping human behavior<br />
operates quite differently than in periods of peace<br />
and prosperity. Human beings tend to comply more<br />
willingly with authoritative directives when they feel<br />
threatened by external agents. Individuals are ready to<br />
give up their individual freedoms temporarily in support<br />
of the overall well-being of society. This has been<br />
a fundamental justification <strong>for</strong> ef<strong>for</strong>ts to support the<br />
necessity of <strong>food</strong> guides, to enhance their credibility,
Dietary <strong>guidelines</strong> and nutrient intake values<br />
and to secure compliance with <strong>food</strong> guides. Moreover,<br />
previous experiences indicate that the <strong>guidelines</strong> are<br />
especially effective when the <strong>food</strong> supply is plentiful<br />
and decisions on <strong>food</strong> choices no longer belong to the<br />
government but depend on individual choice. Over the<br />
past decades, a science-<strong>based</strong> approach evaluating the<br />
available evidence on diet and health has been adopted<br />
to strengthen the validity of FBDG development [10].<br />
A greater interest in establishing a solid science<br />
base <strong>for</strong> <strong>food</strong> and nutrition recommendations among<br />
nutritionists and policy makers has led to significant<br />
advances in our knowledge of how <strong>food</strong>, diets, and<br />
nutrition affect health throughout the course of life.<br />
However, due to the reductionistic nature of present<br />
nutrition, <strong>food</strong>, and medical sciences, establishing<br />
FBDGs serves to better understand the role of nutrients<br />
and diet in health but is thus far clearly insufficient to<br />
take the knowledge of how diets affect human health<br />
and well-being into action. Problems due to lack or<br />
excess of specific nutrients remain, and preventive<br />
measures such as <strong>food</strong> <strong>for</strong>tification or nutrient supplementation<br />
programs have been established in both<br />
developed and developing countries. These approaches<br />
are, nevertheless, insufficient to tap on the knowledge<br />
required to modify <strong>food</strong> intake and physical activityrelated<br />
behaviors responsible <strong>for</strong> the present epidemic<br />
of obesity and related chronic diseases. Addressing<br />
the need <strong>for</strong> individual and social behavioral development<br />
has major implications in defining policies and<br />
programs to prevent and control the present epidemic<br />
of nutrition-related diseases.<br />
Expert groups or committees developing science<strong>based</strong><br />
FBDGs commonly face the problem of overwhelmingly<br />
fragmented massive scientific in<strong>for</strong>mation.<br />
The process needed to translate this in<strong>for</strong>mation<br />
into knowledge that allows the categorization of the<br />
strength of the evidence in support of relationship<br />
between <strong>dietary</strong> constituents and disease is a key step<br />
in the development of nutrient intake goals and the<br />
corresponding <strong>food</strong>-<strong>based</strong> recommendations <strong>for</strong> optimal<br />
health at all stages of life. Additionally a necessary<br />
technical consensus concerning the role of multiple<br />
other factors that condition the relevant nutritional<br />
problems must be reached. This is commonly difficult,<br />
since the role of the factors determining the supply of<br />
and access to safe and nutritious <strong>food</strong>s, as well as the<br />
social, economic, and cultural determinants of <strong>food</strong><br />
choices, are ignored or not clearly identifiable from the<br />
published literature. In most cases, fulfillment of these<br />
conditions is difficult to achieve. Experiences often<br />
indicate that the guides are not <strong>based</strong> on science alone.<br />
In practice, they are usually restricted by the limitations<br />
in available scientific knowledge and judgments of<br />
selected experts that may have strong biases or are not<br />
fully independent of selected interest groups; there is<br />
also commonly a strong open or covert pressure from<br />
various stakeholders which often succeed in defining<br />
S143<br />
the final <strong>for</strong>m taken by FBDGs. For the development<br />
of the US 2005 Dietary Guidelines, an evidence-<strong>based</strong><br />
approach was used <strong>for</strong> the first time to develop the<br />
key messages [11]. Despite the limitations, technical<br />
consensus opinion of expert groups is an essential<br />
step in establishing <strong>food</strong>- and nutrient-<strong>based</strong> <strong>dietary</strong><br />
<strong>guidelines</strong> and recommendations [12].<br />
Many countries have followed the methods outlined<br />
in this section as a way to define goals <strong>for</strong> recommended<br />
nutrient intakes and <strong>food</strong>s that supply them;<br />
thus guiding the selection of <strong>food</strong>s <strong>for</strong> optimal health<br />
in a given population. In fact, as will be presented later,<br />
there are many commonalities in the key <strong>food</strong>-<strong>based</strong><br />
<strong>dietary</strong> <strong>guidelines</strong> around the world. The basic premise<br />
is that the guides should promote overall health and<br />
prevent physical and/or mental disability at all stages<br />
of the life course. Consequently, the main target group<br />
<strong>for</strong> FBDGs is people in good health. The guides, in<br />
principle, should be <strong>based</strong> on up-to-date research,<br />
focus on the total diet, be useful to the target audience,<br />
and meet nutritional goals <strong>based</strong> on people’s usual<br />
<strong>food</strong> and <strong>dietary</strong> patterns. Moreover, the guides should<br />
allow maximum flexibility and practicality. Last but not<br />
least, the development of the <strong>food</strong> guides should be<br />
evolutionary, promoting gradual progress and avoiding<br />
radical revisions. These considerations are <strong>based</strong> on the<br />
analysis of a study of the evolution of <strong>food</strong> guides and<br />
on a needs assessment of the US professional community<br />
conducted in the early 1980s [4].<br />
Despite these sound philosophic goals, it is indeed<br />
perplexing to realize that most US citizens are currently<br />
facing the consequences of nutrition-related chronic<br />
diseases. Perhaps the successful application of FBDGs<br />
in countries such as the <strong>United</strong> States has become<br />
extremely complex, and the capacity <strong>for</strong> science-<strong>based</strong><br />
FBDGs to affect <strong>food</strong> choices in that context is limited.<br />
They are no longer relevant, unlike the case during<br />
difficult times in the past when <strong>food</strong> guides proved<br />
to maximize health benefits given a restricted <strong>food</strong><br />
supply. We suggest that at present there are basic contradictions<br />
between the goals of optimizing nutrition<br />
and public health and the prevailing market <strong>for</strong>ces that<br />
shape the supply and demand <strong>for</strong> <strong>food</strong>s, thus imposing<br />
limitations on the effective implementation of FBDGs.<br />
Or perhaps FBDG promotion has been ineffective<br />
in achieving sustained changes in nutrition-related<br />
behavior necessary to affect health conditions. Since no<br />
systematic evaluation of these alternative explanations<br />
<strong>for</strong> the limitations of FBDG has been attempted, there<br />
is no conclusive answer to this question. Moreover, diet<br />
is important but is only one among many interactive<br />
factors in the complex causation of nutrition-related<br />
chronic disease.<br />
In some European countries, comprehensive and<br />
tailor-made strategic nutrition policies and interventions<br />
have been important in achieving successful<br />
large-scale <strong>dietary</strong> change with the corresponding
S144<br />
health benefits in curbing the epidemic of chronic<br />
disease. A wide range of social measures have been<br />
used: legal regulatory frameworks, economic incentives<br />
<strong>for</strong> healthy consumption and disincentives <strong>for</strong><br />
unhealthy choices, organizational structures at the<br />
governmental level that establish national policies and<br />
programs to achieve the desired goals, and educational<br />
ef<strong>for</strong>ts at all levels of <strong>for</strong>mal and non<strong>for</strong>mal systems.<br />
The <strong>food</strong> selection guides used in these countries serve<br />
to support or complement the overall <strong>dietary</strong> and nutrition<br />
interventions [13]. However, experiences thus far<br />
in developing countries generally indicate inadequate<br />
resources <strong>for</strong> both the development and the implementation<br />
of the <strong>food</strong> guides.<br />
There<strong>for</strong>e, it is indeed timely to consider revisiting<br />
the concept of FBDGs and their application in this<br />
rapidly changing world. Be<strong>for</strong>e they actually adopt<br />
the concept of FBDGs, countries and communities<br />
should perhaps examine themselves to determine the<br />
contextual elements within countries or communities<br />
that will enable or restrict the successful development<br />
and implementation of FBDGs. For instance, in the<br />
<strong>United</strong> States the <strong>dietary</strong> <strong>guidelines</strong>, by law, <strong>for</strong>m the<br />
cornerstone of US federal nutrition policy and provide<br />
the basis <strong>for</strong> all federal nutrition education activities<br />
[14]. In Canada, <strong>dietary</strong> guidance has been an important<br />
element in the country’s comprehensive health<br />
promotion ef<strong>for</strong>ts. These contexts are enabling factors<br />
<strong>for</strong> the development and implementation of FBDGs in<br />
these two countries. However, these positive factors<br />
are counteracted by the strong influence of marketing<br />
and advertising in shaping <strong>food</strong> choices of individuals<br />
and communities. The resources supporting the<br />
marketing of unhealthy diets are between 100- and<br />
1,000-fold greater than the funds available to promote<br />
consumption patterns <strong>based</strong> on FBDGs. These are<br />
important common-sense considerations and serve as<br />
the foundation that will define the effectiveness of the<br />
ef<strong>for</strong>ts. It is essential that these be addressed be<strong>for</strong>e<br />
embarking on scientific exercises necessary <strong>for</strong> the<br />
development of FBDGs.<br />
The process of defining FBDGs: From<br />
nutrients to <strong>food</strong>s and diets<br />
The approaches used to define nutritional adequacy of<br />
diets and <strong>dietary</strong> recommendations have changed over<br />
time in accordance with the scientific understanding<br />
of the biochemical and physiological basis of human<br />
nutritional requirements in health and disease. The<br />
science of modern nutrition provides in most cases a<br />
solid underpinning <strong>for</strong> nutrient-<strong>based</strong> <strong>dietary</strong> recommendations<br />
but has limited in<strong>for</strong>mation on the longterm<br />
effect of <strong>dietary</strong> patterns on health. There are<br />
obvious limitations to the reductionist nutrient-<strong>based</strong><br />
approach; people consume <strong>food</strong>s and not nutrients,<br />
and moreover they consume <strong>food</strong>s in combinations<br />
that change over time and are affected by season and<br />
climate in addition to social and economic factors. The<br />
effect of specific <strong>food</strong>s and <strong>dietary</strong> patterns on health<br />
goes beyond the biochemistry and metabolism of the<br />
essential nutrients a <strong>food</strong> contains. For example, the<br />
availability and utilization of specific micronutrients<br />
is dependent on multiple interactions among nutrients<br />
themselves and between nutrients and the <strong>food</strong> matrix<br />
that contains them. Unless these are considered we will<br />
not assess the true nutritional value of <strong>food</strong>s. In addition,<br />
factors unrelated to diet commonly play a key role<br />
in the effect of diet on health; <strong>for</strong> example, parasitic<br />
infections rather than low iron intake may be the cause<br />
of anemia in many parts of the world. Similarly, if we<br />
ignore or undervalue the key role of physical activity<br />
in achieving energy balance, <strong>dietary</strong> recommendations<br />
per se will be of no use in preventing obesity and its<br />
consequences [5–7]. Moreover, people eat meals, and<br />
knowledge of meals and meal patterns is also critical<br />
in deriving the <strong>guidelines</strong> (see fig. 1).<br />
Methods currently used in establishing<br />
nutrient-<strong>based</strong> recommendations<br />
The clinical approach is <strong>based</strong> on the need to correct<br />
or prevent nutrient-specific diseases associated with<br />
intake deficiency. This method is highly specific but<br />
not very sensitive; <strong>for</strong> ethical reasons, clinical outcomes<br />
are clearly inappropriate to establish nutrient<br />
dose–response relationships.<br />
Biochemical, physiological, or functional approaches<br />
<strong>based</strong> on indicators of nutritional sufficiency can serve<br />
to define the limits of insufficient and excess intake of<br />
specific nutrients. This approach requires that we have<br />
������� �������� ����������� �����<br />
���� ����������� ���<br />
��������������� ����<br />
����� ����<br />
���� ������<br />
������������ ��<br />
���������� ������<br />
���������� �������� ����� ���� � �<br />
�������� ������ ���������������� �������<br />
���������� ������� ����������<br />
S. Smitasiri and R. Uauy<br />
�������� �����������<br />
�������� ������ �����<br />
��� ����� �����<br />
���� ������<br />
��� ������<br />
FIG. 1. Proposed process <strong>for</strong> defining <strong>food</strong>-<strong>based</strong> <strong>dietary</strong><br />
<strong>guidelines</strong> <strong>for</strong> healthier populations
Dietary <strong>guidelines</strong> and nutrient intake values<br />
a defined set of biomarkers that are sensitive to changes<br />
in nutritional state and specific in terms of identifying<br />
subclinical deficiency conditions. The use of balance<br />
data to define requirements should be avoided whenever<br />
possible, since in most cases, observed balance<br />
<strong>based</strong> on input–output measurements is greatly influenced<br />
by level of intake. Subjects adapt to high intakes<br />
by increasing output; conversely, they lower output<br />
when intake is low. Biomarkers that can be used to<br />
define requirements include measures of blood levels,<br />
nutrient stores, nutrient turnover, and critical tissue<br />
or organ pools.<br />
The habitual consumption levels of “healthy” populations<br />
serve as a basis to establish a range of adequate<br />
intakes in the absence of quantitative estimates of<br />
requirements. This criterion has important limitations<br />
but remains the first approximation to establishing<br />
requirements when no other data are available.<br />
The concept of “optimal nutrient intake” has been<br />
proposed over the past decades. The notion of an optimal<br />
nutrient intake is <strong>based</strong> on the quest <strong>for</strong> improved<br />
functionality in terms of muscle strength, immune<br />
function, or intellectual ability. This approach is <strong>based</strong><br />
on the possibility that diet or specific nutrients may<br />
improve or enhance a given function, ameliorate the<br />
age-related decline in function, or decrease the burden<br />
of illness associated with loss of function. However,<br />
the concept of optimal intake is usually unsupported<br />
by appropriate population-<strong>based</strong> controlled studies of<br />
sufficient duration. The concept of optimal diet implies<br />
that we are looking beyond immediate benefits; the aim<br />
is to attain long-term benefits in both the duration and<br />
the quality of life [5].<br />
Values of recommended nutrient intakes (RNIs)<br />
<strong>based</strong> on different approaches may differ, so a key issue<br />
<strong>for</strong> harmonization is defining the preferred method to<br />
establish the nutrient-<strong>based</strong> recommendation. This<br />
in turn will be used to establish individual nutrient<br />
intake goals, which correspond to the desired target<br />
intakes that will contribute to achieving better health<br />
and nutrition <strong>for</strong> individuals living within an ecological<br />
setting. Their purpose is to promote overall health<br />
and/or control specific nutritional diseases induced<br />
by excess or deficit, and to reduce health risks, considering<br />
the multifactorial nature of disease. For some<br />
nutrients, the goal will be to consume at least a given<br />
amount, in other cases it may be to consume less than<br />
a certain amount, whereas in other cases it will be to<br />
consume within a given range with an upper and lower<br />
boundary. The nutrient intake goals should represent<br />
the intakes of individuals within a population. Thus,<br />
if we limit the intake of fat to less than 10% of energy<br />
from saturated fat, it means that individuals may obtain<br />
from 0% to 10% of their energy from saturated fat. If,<br />
on the other hand, we say that between 10% and 20% of<br />
total energy should be obtained from protein, it means<br />
that individuals should consume at least 10% and not<br />
S145<br />
more than 20% of energy from protein. In some cases<br />
the figure is given as a single number: <strong>for</strong> example,<br />
obtain at least 2.5% of total energy from essential fatty<br />
acids means that individuals should derive 2.5% or<br />
more of their total energy from these nutrients. When<br />
the chemical characterization of the <strong>food</strong> component<br />
responsible <strong>for</strong> the health benefit is not fully established,<br />
or the analytic methods differ significantly, the<br />
goal may be set in terms of type of <strong>food</strong>s, rather than<br />
an amount of nutrient: <strong>for</strong> example, in the case of fiber<br />
the recommendation is to “consume at least 400 g of<br />
fruits and vegetables a day.” There may be occasions<br />
when there is more than one distribution curve of<br />
individual nutrient intakes within a given apparently<br />
homogeneous population; it is even possible that one<br />
subgroup may have an intake that is considered too low<br />
whereas another subgroup may have an intake that is<br />
close to excess. The goal in this case is to increase in<br />
the intake <strong>for</strong> some, whereas there is a need to reduce<br />
the intake in another group. Establishing an optimal<br />
range in this case may mean increasing the intake <strong>for</strong><br />
some individuals while decreasing the intake in others<br />
[5–7, 15, 16].<br />
FBDGs can be developed once the relevant nutrient<br />
intake goals <strong>for</strong> long-term health and the actual distribution<br />
of nutrient intakes are known. These should<br />
take into account the customary <strong>dietary</strong> intake patterns<br />
of individuals and the distribution of nutrient intakes<br />
within the population group(s), what <strong>food</strong>s are available,<br />
and the factors that determine the consumption<br />
of <strong>food</strong>s. FBDGs indicate what aspects of the <strong>dietary</strong><br />
intake pattern should be modified, considering the<br />
ecological setting, the socioeconomic and cultural factors,<br />
and the biological and physical environment that<br />
affect the health, nutrition, and <strong>food</strong> supply of a given<br />
population or community.<br />
Recent international and national expert committees<br />
have established nutrient-<strong>based</strong> recommendations <strong>for</strong><br />
virtually every known essential human nutrient. The<br />
quantitative definitions of nutrient needs and their<br />
expression as recommended nutrient intakes (RNIs)<br />
have been important instruments <strong>for</strong> <strong>food</strong> and nutrition<br />
policy in many countries, serving to focus the<br />
attention of international agencies on nutritional deficiencies<br />
or excesses with health consequences. RNIs<br />
are customarily defined as the intakes of energy and<br />
specific nutrients necessary to satisfy the requirements<br />
of a group of healthy individuals. This nutrient-<strong>based</strong><br />
approach has served well to advance science but has<br />
not always fostered the establishment of nutritional and<br />
<strong>dietary</strong> priorities consistent with broad public health<br />
interests at national and international levels. In fact,<br />
judged post facto, nutrient-<strong>based</strong> recommendations<br />
may have misguided some ef<strong>for</strong>ts to solve key nutritional<br />
problems. For instance, the emphasis on both<br />
the quantity and the quality of protein derived from<br />
studies of single <strong>food</strong> sources that evaluated the effect
S146<br />
of protein on growth rates of young animals placed a<br />
premium on the development of animal <strong>food</strong>s (meat,<br />
eggs, and cow’s milk) and failed to include the concept<br />
of amino acid complementarities of cereal–legume<br />
mixes. In fact, when human infant and adult studies<br />
were conducted several decades later, the nutritional<br />
value of mixed diets from around the world was similar<br />
to that of animal proteins, except <strong>for</strong> a small increase<br />
in nitrogen lost in the stool when mixed vegetable<br />
protein sources were consumed. Thus, the protein gap<br />
was closed not by global initiatives to produce animal<br />
<strong>food</strong>s, but by a change in the experimental model used<br />
to assess human protein needs.<br />
The change in the approach used to evaluate the<br />
energy needs of children serves as another illustrative<br />
example of the implications of the approaches used<br />
to assess nutritional needs. Recently the method has<br />
changed from one <strong>based</strong> on assessing intakes observed<br />
in industrialized countries to one <strong>based</strong> on measuring<br />
energy expenditure and evaluating energy stores necessary<br />
to maintain health. This change is of importance<br />
in addressing the global epidemic of obesity. The<br />
recent FAO/WHO/UNU 2004 report [15] established<br />
that energy needs of children have been systematically<br />
overestimated by 10% to 25%. Present data using<br />
energy expenditure estimation from doubly labeled<br />
water studies in infants under 1 year of age reveal that<br />
<strong>for</strong> this group the overestimation has been close to 20%;<br />
moreover, the estimates <strong>for</strong> breastfed infants are about<br />
7% below those <strong>for</strong> <strong>for</strong>mula-fed infants. These changes<br />
may appear to be of small magnitude, but if old recommendations<br />
are systematically used in the feeding of<br />
infants and children today, they can effectively serve<br />
to promote obesity in the early years of life. We are just<br />
now realizing that definitions of normality cannot be<br />
<strong>based</strong> solely on observations of intakes of apparently<br />
healthy populations but rather need to be <strong>based</strong> on<br />
favorable nutrition and health outcomes across the life<br />
span. We as nutritional scientists have a responsibility<br />
to critically examine not only the data but also the<br />
experimental designs used to obtain them. The context<br />
in which the experiment is done commonly defines the<br />
answer that is obtained; studies to assess nutritional<br />
needs and establish recommendations are by no means<br />
an exception.<br />
In contrast to nutrient-<strong>based</strong> recommendations,<br />
FBDGs as instruments of policy are more closely linked<br />
to the diet–health relationships of relevance to the particular<br />
country or region of interest. Several key aspects<br />
should be considered in moving from nutrient intake<br />
recommendations to <strong>food</strong>-<strong>based</strong> <strong>dietary</strong> <strong>guidelines</strong>.<br />
We will provide a brief roadmap <strong>for</strong> this process; more<br />
detailed in<strong>for</strong>mation can be obtained from the recently<br />
released US Department of Agriculture Dietary Guidelines<br />
Advisory Committee Report (www.health.gov/<br />
<strong>dietary</strong><strong>guidelines</strong>/dga2005/report) [16]. The first step<br />
in this process is defining the magnitude of the deficit<br />
S. Smitasiri and R. Uauy<br />
or excess <strong>based</strong> on the estimates of nutritional needs<br />
<strong>for</strong> long-term health and the distribution of intakes.<br />
This serves to assess what nutrients are most likely to<br />
be consumed in low enough or in excessive amounts<br />
to constitute a potential health risk. The likelihood of<br />
nutritional deficiency is <strong>based</strong> on the probability that<br />
subjects or group of subjects within a population consume<br />
below the estimated average requirement (EAR),<br />
or in the case of excess, that they consume above the<br />
defined tolerable upper intake level (UL) of the specific<br />
nutrient over time. In order to adequately calculate this<br />
probability, we need to know the nutrient intake <strong>for</strong> at<br />
least 2 days but preferably <strong>for</strong> several days. In general, if<br />
the measured usual intake is above the EAR and below<br />
the UL, the risk of deficit or excess will be low. If, on<br />
the other hand, we find a significant proportion of the<br />
population consuming below the EAR or above the UL<br />
we need to consider establishing <strong>guidelines</strong> to correct<br />
this situation and prevent the adverse consequences of<br />
nutrient excess or deficiency [5, 6].<br />
In developing FBDGs, we need to assess the change<br />
in <strong>dietary</strong> patterns required to achieve the recommended<br />
nutrient intakes. This will require that we have<br />
appropriate in<strong>for</strong>mation on the chemical composition<br />
of the <strong>food</strong>s available to the population of interest and<br />
the amount of these <strong>food</strong>s commonly consumed. In<br />
some cases we need to increase or reduce the intake<br />
<strong>for</strong> virtually all of the population: <strong>for</strong> example, to<br />
reduce excess sodium intake typically resulting from<br />
consumption of salt added to <strong>food</strong>s during preservation<br />
or in cooking. In this case we may need to modify <strong>food</strong>processing<br />
practices to prevent the health consequences<br />
of excess sodium consumption. On the other hand,<br />
<strong>for</strong> example, we will find that most of the population<br />
consumes insufficient folate. Thus the guideline in this<br />
case leads us to establish the need to have folate-<strong>for</strong>tified<br />
<strong>food</strong>s available to the general population, since it<br />
is quite difficult to meet the folate requirement with<br />
<strong>food</strong>s alone. In order to judge the adequacy of a <strong>dietary</strong><br />
pattern, we need to assess not only the adequacy of the<br />
<strong>food</strong>s in providing sufficient but not excessive specific<br />
nutrients, but also the overall nutrient-to-energy<br />
density of the diet. Thus, if in order to meet the nutritional<br />
needs of a group the diet needs to be consumed<br />
at a level of energy that may prove excessive, given<br />
the activity pattern of the population, we may need<br />
to revisit our <strong>dietary</strong> guideline. In this case, we may<br />
need to increase the recommended consumption of<br />
nutrient-dense <strong>food</strong>s or possibly avoid energy-dense<br />
<strong>food</strong>s that may provide low intakes of specific nutrients<br />
needed <strong>for</strong> health. Following this reasoning, dark-green<br />
vegetables and legumes provide specific nutrients and<br />
fiber at relatively low levels of energy [16].<br />
Special <strong>dietary</strong> patterns may be needed to cover<br />
the requirements of population subgroups such as the<br />
elderly, who will maintain or increase their needs <strong>for</strong><br />
specific nutrients but in most cases will require less
Dietary <strong>guidelines</strong> and nutrient intake values<br />
energy because of their lower activity level. Similarly,<br />
women of childbearing age have an additional need<br />
<strong>for</strong> iron and thus require extra iron and ascorbic acid<br />
at the time of the meal in order to enhance absorption<br />
of ionic iron in the <strong>food</strong>s consumed. Meeting vitamin<br />
D and B 12 needs of the elderly also requires special<br />
considerations, since because of age-related changes<br />
in skin vitamin D metabolism and in gastric acidity,<br />
they are unlikely to obtain these nutrients in sufficient<br />
amounts unless they receive them as supplements or<br />
in <strong>for</strong>tified <strong>food</strong>s. In summary, FBDGs need to address<br />
the health consequences of <strong>dietary</strong> insufficiency, excess,<br />
or imbalance with a broader perspective, considering<br />
the totality of the effects of a given <strong>dietary</strong> pattern, and<br />
not focusing on single nutrients alone [5, 16].<br />
The complexity of FBDG communication<br />
and implementation<br />
As already discussed, the complexity of FBDG development<br />
should not be underestimated. A carefully<br />
designed process should result in <strong>guidelines</strong> that are<br />
credible within the context of national nutrition public<br />
policies, and ultimately the technical consensus should<br />
gain support of the various stakeholders. Nevertheless,<br />
these are just part of the necessary process to take<br />
FBDGs beyond the letter of the recommendations and<br />
have them contribute to shaping <strong>food</strong>-consumption<br />
patterns. Another important component is translating<br />
a credible policy into effective action. This involves<br />
integrating scientific knowledge into a process in which<br />
contextual knowledge of local conditions, societal<br />
values, and economic and political interests plays a<br />
major role [17].<br />
Un<strong>for</strong>tunately, the knowledge and critical analysis<br />
of successes and failures in taking FBDGs into action<br />
are not yet well documented in the literature. Of the<br />
countries that have developed FBDGs, Canada is<br />
one of the few that discusses the importance of communication<br />
and implementation of their <strong>food</strong> guides.<br />
Health Canada, in the process of updating the 1990<br />
<strong>dietary</strong> guidance, appointed two advisory committees:<br />
a scientific review committee and a communication<br />
and implementation committee. The second committee’s<br />
mandate was to translate the nutrition recommendations<br />
into <strong>dietary</strong> advice <strong>for</strong> the public and to<br />
recommend implementation strategies to facilitate<br />
comprehensive use and integration of the <strong>dietary</strong><br />
<strong>guidelines</strong> into the policies, programs, and messages.<br />
This second committee designed an inclusive, intersectoral,<br />
and multidisciplinary process in fulfilling<br />
its mandate. Consultations with stakeholders were<br />
designed not only to gather input on strategies <strong>for</strong><br />
implementation, but also to maximize consensus on<br />
one common set of <strong>dietary</strong> <strong>guidelines</strong> to be used by all<br />
when communicating with the public [18].<br />
S147<br />
It is now well recognized that there is no direct road<br />
between knowledge and action. It is also acknowledged<br />
that bombarding the public with multiple and<br />
often conflicting nutritional messages does not lead<br />
to better nutrition and health [19]. Food and nutrition<br />
issues are complex by nature; as a consequence, they<br />
will require solutions that recognize these complexities<br />
in addressing implementation strategies. Based<br />
on experiences from nutrition education and health<br />
promotion fields thus far, it can be said that awareness<br />
or even a high level of comprehension of FBDG messages<br />
among the public does not necessarily result in<br />
overall improvement of nutrition and health [20]. A<br />
strategic nutrition policy and comprehensive as well<br />
as sustained culturally appropriate <strong>dietary</strong> intervention<br />
are needed to achieve significant improvement in nutrition<br />
and health in a given context [21]. FBDGs thus can<br />
be an important complement in the process of overall<br />
diet and health promotion interventions. Nonetheless,<br />
they cannot and will not bring about <strong>dietary</strong> changes<br />
in a population by themselves. Some considerations in<br />
developing future FBDG communication and implementation<br />
are discussed below.<br />
One of the recently proposed strategies <strong>for</strong> improving<br />
the FBDG development process in the <strong>United</strong><br />
States is to consider developing messages that will lead<br />
to behavior change among the public [22]. Contrary<br />
to this proposal, knowledge of communication clearly<br />
indicates that messages alone, regardless of how well<br />
they are developed, will not lead to behavior change.<br />
Behavior development needs good facilitating processes<br />
that can influence both personal and environmental<br />
factors necessary to modify the intended behavior(s)<br />
[23]. It usually requires a strategic and comprehensive<br />
intervention to address and support the expected<br />
change. In normal situations, communication is often<br />
only an important complement in the development and<br />
implementation process, and message design is only<br />
one essential element in a communication process. A<br />
realistic expectation is needed of what FBDGs as a concept<br />
can actually contribute in a given society. Based on<br />
this review, we propose that countries or communities<br />
should first consider the development and implementation<br />
of a strategic and comprehensive culturally<br />
appropriate <strong>dietary</strong> and nutrition intervention.<br />
Within this framework, FBDGs should be designed as<br />
a complement in the development and implementation<br />
process if <strong>dietary</strong> behavioral change is the ultimate aim.<br />
Norway is noted <strong>for</strong> this successful approach. With a<br />
strategic and comprehensive intervention, Norwegians<br />
significantly changed their diet-related behaviors and<br />
were able to lower prevalence of heart disease and<br />
other nutrition-related chronic conditions. This was<br />
in fact achieved in slightly over a decade [13, 21]. In<br />
Canada, as an important part of overall health promotion<br />
ef<strong>for</strong>ts, the communication and implementation<br />
advisory committee also positioned FBDGs only as
S148<br />
an element in changing conditions to support healthy<br />
eating, which went far beyond the provision of in<strong>for</strong>mation<br />
[18].<br />
By nature, FBDGs are a generic nutrition education<br />
tool. Strategic implementation accompanying<br />
the <strong>guidelines</strong> is definitely necessary in order to bring<br />
about significant changes in a specified period of time.<br />
Along this line of thinking, the objectives <strong>for</strong> FBDG<br />
communication and implementation should be clearly<br />
stated, measurable, and realistic in order to justify the<br />
usefulness of this concept in a given society. If behavior<br />
development is expected, it is critical in the communication<br />
and implementation process to pinpoint<br />
“which consumer(s) and what action(s).” Moreover,<br />
a consumer-centered approach will be needed, since<br />
consumers themselves are key actors in the change<br />
process, with perhaps an exception during wartime and<br />
other extremely insecure situations. The bottom line is<br />
that people, in general, will not routinely follow expert<br />
advice on <strong>food</strong> selection just to improve health [19, 24].<br />
In developing FBDG communication and implementation,<br />
there<strong>for</strong>e, a few important assumptions<br />
should be considered. First, most consumers will be<br />
either only mildly interested or not at all interested<br />
in FBDGs. Second, it will be important to set up or to<br />
utilize environmental support systems in transferring<br />
in<strong>for</strong>mation into appropriate action. And last, careful<br />
consideration needs to be given to delineating specific<br />
target consumers in terms of their demographic and<br />
psychological attributes, their lifestyles, values, and<br />
belief systems, as well as their media habits. In most<br />
complex societies today, a “one size fits all” communication<br />
and implementation approach will probably<br />
be ineffective.<br />
To <strong>for</strong>mulate meaningful FBDG messages, consumer<br />
factors must be considered as well. For instance, issues<br />
such as the public’s attitudes about ideas related to<br />
FBDGs, other ideas that the public associates with the<br />
idea of FBDGs, specific needs that the public expects<br />
FBDGs to fulfill, and specific questions in the public’s<br />
mind regarding FBDGs should, at least, be well understood<br />
by those involved in developing FBDG messages.<br />
There<strong>for</strong>e, consumer research is as critical as scientific<br />
reviews if FBDGs are to be more relevant to the public.<br />
Development of the US Food Guide Pyramid was a<br />
good example of how consumer research helped select<br />
a graphic representation of the <strong>dietary</strong> <strong>guidelines</strong>,<br />
which has become popular in the country as well<br />
as many other countries around the world [4, 5]. In<br />
addition, it should be noted that the development of a<br />
graphic representation is a creative process that should<br />
be <strong>based</strong> on a good understanding of consumer factors.<br />
Unlike science, there is no one correct <strong>for</strong>mula <strong>for</strong> this.<br />
To make it work, the visual tool must be meaningful in<br />
the mind of the public, not the experts. For example,<br />
some suggest that a choice of a familiar graphic might<br />
convey the message better <strong>for</strong> poor illiterate target<br />
S. Smitasiri and R. Uauy<br />
groups [25]. Only a systematic assessment among the<br />
target population can indicate the level of effectiveness<br />
of a selected visual tool and enable its modification<br />
according to consumer perception.<br />
Also from a communication point of view, FBDGs<br />
as a concept to promote national nutrition policy and<br />
at the same time to serve as a <strong>food</strong> selection guide <strong>for</strong><br />
an individual are challenging exercises. To be effective,<br />
very comprehensive and sustained communication<br />
activities will be necessary. Without commitments from<br />
stakeholders on strategic outcomes of these exercises,<br />
it is very likely that a society will only bombard the<br />
public with more nutrition messages while an increased<br />
prevalence of diet-related diseases is observed.<br />
Communicating and implementing FBDGs to promote<br />
the overall health of a population is usually multifaceted<br />
in nature due to the complexity of <strong>food</strong> and<br />
nutrition at both the individual and the community<br />
levels. It is there<strong>for</strong>e proposed, especially <strong>for</strong> developing<br />
countries, that FBDGs should be considered only as a<br />
complement to a strategic and comprehensive <strong>dietary</strong><br />
intervention or health-promoting intervention, which<br />
has a clear vision of success <strong>for</strong> a specified period of<br />
time. If this is not a case, FBDGs will only be seen<br />
as providing nutrition policy and in<strong>for</strong>mation that is<br />
unlikely to result in overall improvement of nutrition<br />
and health in a population.<br />
Harmonized approaches in establishing<br />
global FBDGs: possibilities and limitations<br />
Reviews of experiences related to FBDGs around the<br />
world indicate that significant numbers of <strong>guidelines</strong><br />
tend to be similar in their purposes, development,<br />
and uses. For instance, a number of <strong>guidelines</strong> in both<br />
developed and developing countries recommend a<br />
variety of grains daily (16 <strong>guidelines</strong>); a variety of<br />
fruits and vegetables (19 <strong>guidelines</strong>); a diet low in saturated<br />
fat and cholesterol and with a moderate content<br />
of total fat (23 <strong>guidelines</strong>); moderate intake of free<br />
sugars (16 <strong>guidelines</strong>); limited salt intake (22 <strong>guidelines</strong>);<br />
moderate consumption of alcohol (<strong>for</strong> those<br />
who drink alcohol) (16 <strong>guidelines</strong>); and maintaining<br />
healthy weight or per<strong>for</strong>ming physical activity each<br />
day (30 <strong>guidelines</strong>). According to this trend, unified<br />
<strong>guidelines</strong> should be achievable and possible, with<br />
some exceptions such as calcium and vitamin D [5].<br />
One important criterion <strong>for</strong> good FBDGs is the use<br />
of science or evidence in their development. To do this,<br />
however, it is necessary to have available databases<br />
and research to back up the development, which is not<br />
normally feasible <strong>for</strong> developing countries and even<br />
some developed countries. Collaboration with countries<br />
that have more capacities and available resources<br />
in developing and continually updating an appropriate<br />
evidence base could be invaluable in preventing dupli-
Dietary <strong>guidelines</strong> and nutrient intake values<br />
cation of ef<strong>for</strong>t and allowing each country more time<br />
and resources to address country-specific issues [26].<br />
For this reason, harmonized approaches are desirable.<br />
In sum, a global harmonized ef<strong>for</strong>t <strong>for</strong> scientific reviews<br />
<strong>for</strong> <strong>food</strong> selection guides should be encouraged.<br />
Nevertheless, it is proposed that a single global<br />
<strong>food</strong> guide as <strong>dietary</strong> advice <strong>for</strong> the public should be<br />
discouraged, especially if it may be construed as an<br />
“authoritative nutrition education tool”—i.e., let the<br />
global Pyramid guide your <strong>food</strong> choices. A complex<br />
problem is only rarely solved with a simple solution.<br />
Based on experiences thus far, significant <strong>dietary</strong><br />
changes <strong>for</strong> better health at a large-scale level can be<br />
achieved, but a strategic and comprehensive intervention<br />
is necessary. FBDGs can be a good complement<br />
in this process, it is believed, if they are designed as an<br />
advisory nutrition education tool together with a process<br />
that encourages all involved, especially related professionals<br />
[27], to take the necessary action to improve<br />
diet and nutrition within the overall strategy selected.<br />
While harmonized approaches might be desirable at<br />
the scientific review level, a process that would make<br />
it possible <strong>for</strong> the global community to come up with a<br />
consensus on unified <strong>food</strong> guides is unimaginable, not<br />
to mention a process necessary <strong>for</strong> communicating and<br />
implementing them to the global public.<br />
Based on cumulative knowledge of how diet-related<br />
diseases can possibly contribute to socio-psychoeconomic<br />
costs of the global community, countries,<br />
communities, families, and individuals, a global ef<strong>for</strong>t<br />
on nutrition and <strong>dietary</strong> change is urgently required.<br />
In the conceptual representation in figure 2, what is<br />
needed is a global facilitation process that empowers<br />
countries and communities to plan and implement<br />
culturally appropriate diet-related interventions. Scientific<br />
knowledge of nutrition and diet leading to recommendations<br />
should be evaluated in the context of the<br />
��������� ���<br />
��������� ��� �����<br />
�����������<br />
������<br />
����������<br />
�������<br />
�������� ��� ������<br />
�� ������������<br />
�������<br />
���������<br />
������� �����<br />
��� ������<br />
���������<br />
S149<br />
implementation. Moreover, trans<strong>for</strong>ming relevant diet<br />
and nutrition knowledge into good recommendations<br />
should involve not only the biological, medical, and<br />
environmental sciences, but also the social, economic,<br />
and political sciences. Most importantly, recommendations<br />
will turn into action only when stakeholders at the<br />
implementation level actively participate in the change<br />
process. Achieving public confidence requires partnerships<br />
among scientists, policymakers, community leaders,<br />
and consumers in both the development and the<br />
implementation process [28]. Thus, in terms of giving<br />
<strong>dietary</strong> advice to the public, diversified approaches<br />
should be considered rather than unified approaches.<br />
Diversity in communication and implementation with<br />
a shared purpose is proposed; <strong>for</strong> example, our global<br />
common purpose is to promote <strong>food</strong> <strong>for</strong> better health<br />
while each country or region is encouraged to use a<br />
contextual appropriate approach to offer <strong>dietary</strong> advice<br />
to a specific population. We suggest, <strong>for</strong> example, that<br />
the main message with global coverage be “<strong>food</strong> <strong>for</strong><br />
better health”; <strong>based</strong> on this theme, specific contextually<br />
appropriate <strong>guidelines</strong> can be developed <strong>for</strong> specific<br />
country or regional settings. In summary, success<br />
in achieving <strong>dietary</strong> change will occur not because<br />
countries or communities have good or even the best<br />
FBDGs, but rather when key stakeholders in countries<br />
or communities take sustained action to improve diets<br />
and nutrition. To take effective action, knowledge<strong>based</strong><br />
<strong>food</strong> selection guides together with participatory<br />
development and implementation as well as culturally<br />
appropriate strategic communication are essential.<br />
Conclusions<br />
The development of FBDGs has stimulated a greater<br />
understanding of the role of nutrients and <strong>food</strong>s in<br />
��������� ������������� ���<br />
������ ������������ �������������<br />
��������� ���� ��� ���������<br />
������ ������� �������������<br />
�������������� ���������<br />
���������� �����������<br />
������� ������������<br />
��������� �� ������� ������<br />
�����<br />
���������� ������<br />
���������<br />
FIG. 2. Proposed framework <strong>for</strong> global harmonized ef<strong>for</strong>ts to promote <strong>food</strong>-<strong>based</strong> <strong>dietary</strong> <strong>guidelines</strong>
S150<br />
achieving optimal health. However, this valuable<br />
knowledge has not yet been translated into a significant<br />
improvement of human health and well-being. Harmonization<br />
of ef<strong>for</strong>ts is needed now to link knowledge and<br />
action and to reduce the burden of diet-related disease<br />
in both industrialized and developing countries. The<br />
<strong>food</strong> and nutrition community should be ready to<br />
move beyond offering recommendations and participate<br />
actively in the implementation of the knowledge<br />
gained. The possibility of defining one set of <strong>dietary</strong><br />
<strong>guidelines</strong> is indeed attractive, considering the need <strong>for</strong><br />
uni<strong>for</strong>mity in the global village and the potential economic<br />
benefits to producers and perhaps to consumers<br />
of having a common regulatory framework.<br />
Are unified <strong>guidelines</strong> desirable? Cultural and/or<br />
ethnic differences may determine the selection of<br />
population-specific <strong>food</strong>s to meet human nutritional<br />
needs. Yet these differences do not necessarily imply<br />
different <strong>dietary</strong> <strong>guidelines</strong> or different regulatory<br />
frameworks. The optimal diet need not be different<br />
from one population to the next. It is obviously unnecessary<br />
to have different nutrition labels of sodium and<br />
fat quality <strong>for</strong> different countries. The only justification<br />
<strong>for</strong> national- or ethnic-<strong>based</strong> <strong>dietary</strong> <strong>guidelines</strong> would<br />
be if there was a solid genetic basis <strong>for</strong> nutritional<br />
individuality. Present knowledge of the biological basis<br />
of nutritional needs, in most cases, does not support<br />
genetic or ethnic specific nutritional recommendations,<br />
especially if we restrict genetic differences to those of<br />
public health relevance.<br />
Are unified <strong>guidelines</strong> achievable? The answer to<br />
this is that <strong>for</strong> some nutrients, universal <strong>guidelines</strong><br />
are certainly possible. Dietary <strong>guidelines</strong> can certainly<br />
be harmonized following a unified methodologic<br />
References<br />
1. World Health Organization. Regional Office of the<br />
Western Pacific. Development of <strong>food</strong>-<strong>based</strong> <strong>dietary</strong><br />
<strong>guidelines</strong> <strong>for</strong> the Western Pacific Region: The shift<br />
from nutrients and <strong>food</strong> groups to <strong>food</strong> availability,<br />
traditional cuisine and modern <strong>food</strong>s in relation to<br />
emerging chronic non-communicable diseases. Manila:<br />
World Health Organization, 1999.<br />
2. Gif<strong>for</strong>d KD. Dietary fats, eating guides, and public<br />
policy: History, critique, and recommendations. Am J<br />
Med 2002;113(suppl 9B):89S–106S.<br />
3. Welsh S, Davis C, Shaw A. A brief history of <strong>food</strong><br />
guides in the <strong>United</strong> States. Nutr Today 1992;November/December:6–11.<br />
4. Welsh S, Davis C, Shaw A. Development of the <strong>food</strong><br />
guide pyramid. Nutr Today 1992;November/December:12–23.<br />
5. Uauy R, Hertrampf E, Dangour AD. Nutrient and <strong>food</strong><strong>based</strong><br />
<strong>dietary</strong> <strong>guidelines</strong>: International considerations. In:<br />
Shils ME, Shike M, Ross AC, Caballero B, Cousing RJ, eds.<br />
Modern nutrition in health and disease, 10th edition. New<br />
York: Lippincott Williams and Wilkins, 2005:1701–16.<br />
S. Smitasiri and R. Uauy<br />
approach to define them. However, there must be room<br />
to accommodate environmental variables that define<br />
nutritional and metabolic characteristics as well as<br />
the specific epidemiologic situation of a given society.<br />
Universal <strong>guidelines</strong> may be desirable, but they also<br />
present new problems and novel challenges. There is<br />
a clear need to ensure that <strong>guidelines</strong> respond to the<br />
ethnic specific, cultural, and social determinants of<br />
<strong>food</strong> choices.<br />
Global <strong>guidelines</strong> will fail unless they provide the<br />
necessary options <strong>for</strong> individuals and societies to select<br />
the <strong>food</strong>s they prefer and combine them in the way that<br />
best suits their taste and other sensory preferences. A<br />
single unified global set of FBDGs will fail to address<br />
cultural diversity and the complex social, economic,<br />
and political interactions between humans and their<br />
<strong>food</strong> supply.<br />
Globalization should promote diversity while sharing<br />
the common purpose (harmonization) of securing the<br />
right to <strong>food</strong> and providing a better future <strong>for</strong> humankind,<br />
especially the most vulnerable. Presently, there is<br />
a real need, in all countries and regions, to reduce the<br />
increased burden of diet-related disease and promote<br />
quality diets and better nutrition to realize the potential<br />
<strong>for</strong> human development. This requires determined<br />
global harmonized ef<strong>for</strong>ts, both in terms of sustained<br />
commitments and reasonable investments in support<br />
of key strategic <strong>dietary</strong> and health promoting interventions.<br />
The development and creative implementation<br />
of FBDGs, nationally or regionally, with a strong<br />
global scientific support and facilitation will definitely<br />
leverage the much-needed effectiveness of nutritional<br />
development around the world.<br />
6. World Health Organization. Preparation and use of<br />
<strong>food</strong>-<strong>based</strong> <strong>dietary</strong> guides: report of a joint FAO/WHO<br />
Expert Consultation, Nicosia, Cyprus. WHO/NUT/96.6.<br />
Geneva: World Health Organization, 1996.<br />
7. Garza C, Pelletier DL. Dietary <strong>guidelines</strong>: Past, present,<br />
and future. In: Kennedy E, Deckelbaum R (eds). The<br />
Nation’s Nutrition. Washington, DC: ILSI Press (in<br />
press).<br />
8. Nestle M. Food politics: How the <strong>food</strong> industry influences<br />
nutrition and health. Berkeley: University of<br />
Cali<strong>for</strong>nia Press, 2002.<br />
9. Willett WC. Eat, drink, and be healthy. New York: Simon<br />
& Schuster, 2001.<br />
10. Hunt P, Raynert M, Gatenby S. A national <strong>food</strong> guide<br />
<strong>for</strong> the UK? Background and development. J Hum Nutr<br />
Diet 1995;8:315–22.<br />
11. Nicklas TA, Weaver C, Britten P, Stitzel KF. The 2005<br />
Dietary Guidelines Advisory Committee: Developing a<br />
key message. J Am Diet Assoc 2005;105:1418–24.<br />
12. Cooper MJ, Zlotkin SH. An evidence-<strong>based</strong> approach<br />
to the development of national <strong>dietary</strong> <strong>guidelines</strong>. J Am
Dietary <strong>guidelines</strong> and nutrient intake values<br />
Diet Assoc 2003;103:S28–33.<br />
13. Roos G, Lean M, Anderson A. Dietary interventions in<br />
Finland, Norway and Sweden: Nutrition policies and<br />
strategies. J Hum Nutr Diet 2002;15:99–110.<br />
14. McMurry KY. Setting <strong>dietary</strong> <strong>guidelines</strong>: the US process.<br />
J Am Diet Assoc 2003;103(12 suppl 2):S10–6.<br />
15. Food and Agriculture Organization/World Health<br />
Organization/<strong>United</strong> <strong>Nations</strong> University. Human energy<br />
requirements: Report of a joint FAO/WHO/UNU<br />
Expert Consultation. Food Nutr Bull 2005;26:166.<br />
16. Nutrition and Your Health. 2005 Dietary Guidelines<br />
Advisory Committee Report. Available at: http//:www.<br />
health.gov/<strong>dietary</strong><strong>guidelines</strong>/dga2005/report. Accessed<br />
5 November 2006.<br />
17. Habicht JP, Pelletier DL, Garza C. The integration of scientific<br />
knowledge <strong>for</strong> effective action. In: Garza C, Haas<br />
JD, Habicht JP, Pelletier DL, eds. Beyond nutritional<br />
recommendations: <strong>Implementing</strong> science <strong>for</strong> healthier<br />
populations. New York: Division of Nutritional Sciences,<br />
Cornell University, 1996.<br />
18. Bush M, Kirkpatrick S. Setting <strong>dietary</strong> guidance: The<br />
Canadian experience. J Am Diet Assoc 2003;103(121<br />
suppl 2):S22–7.<br />
19. Smitasiri S. Nutri-Action analysis. Nakorn Phathom,<br />
Thailand: Institute of Nutrition, Mahidol University, 1994.<br />
20. Guthrie JF, Smallwood DM. Evaluating the effects of<br />
the Dietary Guidelines <strong>for</strong> Americans on consumer<br />
behavior and health: Methodological challenges. J Am<br />
S151<br />
Diet Assoc 2003;103(12 suppl 2):S42–9.<br />
21. James WPT, Smitasiri S, Ul Haq M, Tagwiyeri J, Norum<br />
K, Uauy R, Swaminathan MS. Ending malnutrition by<br />
2020—An agenda <strong>for</strong> change in the millennium. Food<br />
Nutr Bull 2000;21(suppl):1S–76S.<br />
22. Schneeman BO, Mendelson R. Dietary <strong>guidelines</strong>: Past<br />
experiences and new approaches. J Am Diet Assoc<br />
2002;102:1498–500.<br />
23. Bandura A. Social foundations of thought and action:<br />
A social cognitive theory. Englewood Cliffs, NJ, USA:<br />
Prentice-Hall, 1986.<br />
24. Nayga RM Jr, Capps O Jr. US consumers’ perceptions of<br />
the importance of following the US <strong>dietary</strong> <strong>guidelines</strong>.<br />
Food Policy 1999;24:553–64.<br />
25. Kaufer-Horwitz M, Valdes-Ramos R, Willett WC,<br />
Anderson A, Solomons NW. A comparative analysis of<br />
the scientific basis and visual appeal of seven <strong>dietary</strong><br />
guideline graphics. Nutr Res 2005;25:335–47.<br />
26. Baghurst KI. Dietary <strong>guidelines</strong>: The development<br />
process in Australia and New Zealand. J Am Diet Assoc<br />
2003;103(12 suppl 2):S17–21.<br />
27. Kris-Etherton PM, Weber JA. Dietary <strong>guidelines</strong> 2005—<br />
Contributions of registered dietitians to the evolution<br />
and dissemination of the <strong>guidelines</strong>. J Am Diet Assoc<br />
2005;105:1362–4.<br />
28. Underwood BA. Scientific research: Essential, but is<br />
it enough to combat world <strong>food</strong> insecurities? J Nutr<br />
2003;133(5 suppl 1):1434S–7S.
International harmonization of approaches <strong>for</strong><br />
developing nutrient-<strong>based</strong> <strong>dietary</strong> standards:<br />
Reviewers<br />
The guest editors would like to thank the following<br />
distinguished scholars <strong>for</strong> their willingness to review<br />
the manuscripts in this supplement and <strong>for</strong> their valuable<br />
time spent working on this project.<br />
Lindsay Allen, University of Cali<strong>for</strong>nia, Davis, Cali<strong>for</strong>nia,<br />
USA<br />
G. Harvey Anderson, University of Toronto, Ontario,<br />
Canada<br />
Nils-Georg Asp, Professor of Applied Nutrition, Lund<br />
University, Lund, Sweden<br />
Susan Barr, University of British Columbia, Vancouver,<br />
Canada<br />
Bob Cousins, Boston Family Professor of Nutrition<br />
and Director, Center <strong>for</strong> Nutritional Sciences, Food<br />
Science and Human Nutrition Department, University<br />
of Florida, Gainesville, Florida, USA<br />
Lena Davidsson, International Atomic Energy Agency<br />
(IAEA), Vienna<br />
Johanna Dwyer, Friedman School of Nutrition Science<br />
and Policy and School of Medicine, Tufts University,<br />
Boston, Massachusetts, USA<br />
John Erdman, University of Illinois, Urbana-<br />
Champaign, Illinois, USA<br />
Sue Fairweather-Tait, Institute of Food Research, Norwich<br />
Research Park, Colney, Norwich, UK<br />
Michael Gibney, Trinity College, Dublin, Ireland<br />
S152<br />
Erik Jequeir, Nestlé Foundation, Lausanne, Switzerland<br />
Martijn B. Katan, Wageningen Centre <strong>for</strong> Food<br />
Sciences and Wageningen University, Wageningen,<br />
Netherlands<br />
Eileen Kennedy, Friedman School of Nutrition Science<br />
and Policy, Tufts University, Boston, Massachusetts,<br />
USA<br />
Joanne Lupton, Texas A&M University, College Station,<br />
Texas, USA<br />
San<strong>for</strong>d A. Miller, Virginia Polytechnic Institute,<br />
Alexandria, Virginia, USA<br />
Ann Prentice, Medical Research Council, Human<br />
Nutrition Research, Cambridge, UK<br />
Juan Rivera, National Institute of Public Health,<br />
Mexico City, Mexico<br />
Irwin H. Rosenberg, Friedman School of Nutrition<br />
Science and Policy and Human Nutrition Research<br />
Center on Aging, Tufts University, Boston, Massachusetts,<br />
USA<br />
Prakash Shetty, Kasturba Medical College, Karnataka,<br />
India<br />
Roger Sunde, University of Wisconsin, Madison,<br />
Wisconsin, USA<br />
Beth Yetley, National Institutes of Health, Bethesda,<br />
Maryland, USA<br />
Food and Nutrition Bulletin, vol. 28, no. 1 (supplement) © 2007, The <strong>United</strong> <strong>Nations</strong> University.
International Dietary Harmonization Meeting*<br />
participants<br />
Peter J. Aggett, MD, Lancashire Postgraduate School<br />
of Medicine and Health, University of Central Lancashire,<br />
UK<br />
Lindsay Allen, PhD, USDA Western Human Nutrition<br />
Research Center, University of Cali<strong>for</strong>nia, Davis, USA<br />
Stephanie A. Atkinson, PhD, Department of Pediatrics,<br />
McMaster University, Canada<br />
Bruno de Benoist, Msc, MD, Department of Nutrition<br />
<strong>for</strong> Health and Development, World Health Organization,<br />
Switzerland<br />
Cutberto Garza, MD, PhD, Office of the Provost,<br />
Boston College, USA<br />
Rosalind S. Gibson, PhD, Professor, Department of<br />
Human Nutrition, University of Otago, New Zealand<br />
Ian Darnton-Hill, MD, Nutrition Section, UNICEF,<br />
USA<br />
Janet King, PhD, University of Cali<strong>for</strong>nia at Berkeley<br />
and Davis Children’s Hospital Oakland Research<br />
Institute, USA<br />
Berthold Koletzko, MD, PhD, Division of Metabolic<br />
Diseases and Nutritional Medicine, Ludwig-Maximilians-University<br />
of Munich, Germany<br />
Suzanne Murphy, PhD, Cancer Research Center of<br />
Hawaii, University of Hawaii, USA<br />
*The International Dietary Harmonization Meeting took<br />
place in Florence, Italy, at the UNICEF Innocenti Centre, 14<br />
to 17 December 2005.<br />
Chizuru Nishida, PhD, Department of Nutrition <strong>for</strong><br />
Health and Development, World Health Organization,<br />
Switzerland<br />
Pirjo Pietinen, PhD, National Public Health Institute,<br />
Helsinki, Finland<br />
Sunder Ramaswamy, PhD, Middlebury College, USA<br />
Prakash Shetty, MD, PhD, Institute of Human Nutrition,<br />
University of Southampton Medical School, UK<br />
Patrick Stover, PhD, Division of Nutritional Sciences,<br />
Cornell University, USA<br />
Christine Taylor, PhD, Food and Drug Administration,<br />
USA<br />
Daniel Tome, PhD, Institut National Agronomique<br />
Paris-Grignon, France<br />
Kraisid Tontisirin, MD, PhD, Food and Nutrition<br />
Division, Food and Agriculture Organization of the<br />
<strong>United</strong> <strong>Nations</strong>, Italy<br />
Ricardo Uauy, MD, PhD, INTA University of Chile,<br />
Chile; London School of Hygiene and Tropical Medicine,<br />
UK<br />
Este Vorster, DSc, Potchefstroom University, South<br />
Africa<br />
Allison A. Yates, PhD, RD, Beltsville Human Nutrition<br />
Center, USDA/ARS, USA<br />
Food and Nutrition Bulletin, vol. 28, no. 1 (supplement) © 2007, The <strong>United</strong> <strong>Nations</strong> University. S153