Implementing food-based dietary guidelines for - United Nations ...
Implementing food-based dietary guidelines for - United Nations ...
Implementing food-based dietary guidelines for - United Nations ...

You also want an ePaper? Increase the reach of your titles
YUMPU automatically turns print PDFs into web optimized ePapers that Google loves.
S44<br />
���������<br />
�����������<br />
������������<br />
������<br />
������������<br />
���������� ������ �� ��������<br />
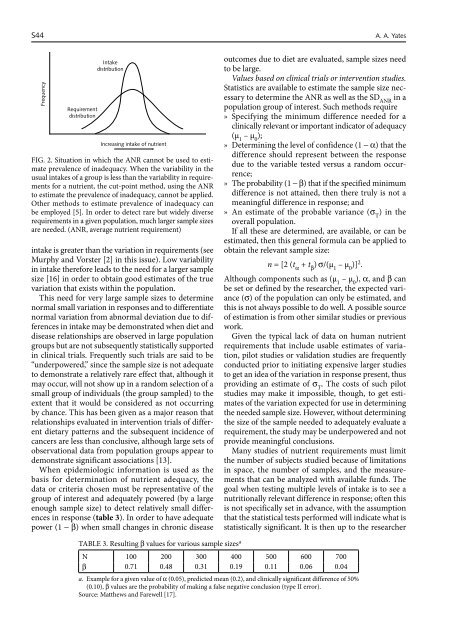
FIG. 2. Situation in which the ANR cannot be used to estimate<br />
prevalence of inadequacy. When the variability in the<br />
usual intakes of a group is less than the variability in requirements<br />
<strong>for</strong> a nutrient, the cut-point method, using the ANR<br />
to estimate the prevalence of inadequacy, cannot be applied.<br />
Other methods to estimate prevalence of inadequacy can<br />
be employed [5]. In order to detect rare but widely diverse<br />
requirements in a given population, much larger sample sizes<br />
are needed. (ANR, average nutrient requirement)<br />
intake is greater than the variation in requirements (see<br />
Murphy and Vorster [2] in this issue). Low variability<br />
in intake there<strong>for</strong>e leads to the need <strong>for</strong> a larger sample<br />
size [16] in order to obtain good estimates of the true<br />
variation that exists within the population.<br />
This need <strong>for</strong> very large sample sizes to determine<br />
normal small variation in responses and to differentiate<br />
normal variation from abnormal deviation due to differences<br />
in intake may be demonstrated when diet and<br />
disease relationships are observed in large population<br />
groups but are not subsequently statistically supported<br />
in clinical trials. Frequently such trials are said to be<br />
“underpowered,” since the sample size is not adequate<br />
to demonstrate a relatively rare effect that, although it<br />
may occur, will not show up in a random selection of a<br />
small group of individuals (the group sampled) to the<br />
extent that it would be considered as not occurring<br />
by chance. This has been given as a major reason that<br />
relationships evaluated in intervention trials of different<br />
<strong>dietary</strong> patterns and the subsequent incidence of<br />
cancers are less than conclusive, although large sets of<br />
observational data from population groups appear to<br />
demonstrate significant associations [13].<br />
When epidemiologic in<strong>for</strong>mation is used as the<br />
basis <strong>for</strong> determination of nutrient adequacy, the<br />
data or criteria chosen must be representative of the<br />
group of interest and adequately powered (by a large<br />
enough sample size) to detect relatively small differences<br />
in response (table 3). In order to have adequate<br />
power (1 − β) when small changes in chronic disease<br />
outcomes due to diet are evaluated, sample sizes need<br />
to be large.<br />
Values <strong>based</strong> on clinical trials or intervention studies.<br />
Statistics are available to estimate the sample size necessary<br />
to determine the ANR as well as the SD ANR in a<br />
population group of interest. Such methods require<br />
» Specifying the minimum difference needed <strong>for</strong> a<br />
clinically relevant or important indicator of adequacy<br />
(µ 1 – µ 0 );<br />
» Determining the level of confidence (1 − α) that the<br />
difference should represent between the response<br />
due to the variable tested versus a random occurrence;<br />
» The probability (1 − β) that if the specified minimum<br />
difference is not attained, then there truly is not a<br />
meaningful difference in response; and<br />
» An estimate of the probable variance (σ T ) in the<br />
overall population.<br />
If all these are determined, are available, or can be<br />
estimated, then this general <strong>for</strong>mula can be applied to<br />
obtain the relevant sample size:<br />
n = [2 (t α + t β ) σ/(µ 1 – µ 0 )] 2 .<br />
Although components such as (µ 1 – µ 0 ), α, and β can<br />
be set or defined by the researcher, the expected variance<br />
(σ) of the population can only be estimated, and<br />
this is not always possible to do well. A possible source<br />
of estimation is from other similar studies or previous<br />
work.<br />
Given the typical lack of data on human nutrient<br />
requirements that include usable estimates of variation,<br />
pilot studies or validation studies are frequently<br />
conducted prior to initiating expensive larger studies<br />
to get an idea of the variation in response present, thus<br />
providing an estimate of σ T . The costs of such pilot<br />
studies may make it impossible, though, to get estimates<br />
of the variation expected <strong>for</strong> use in determining<br />
the needed sample size. However, without determining<br />
the size of the sample needed to adequately evaluate a<br />
requirement, the study may be underpowered and not<br />
provide meaningful conclusions.<br />
Many studies of nutrient requirements must limit<br />
the number of subjects studied because of limitations<br />
in space, the number of samples, and the measurements<br />
that can be analyzed with available funds. The<br />
goal when testing multiple levels of intake is to see a<br />
nutritionally relevant difference in response; often this<br />
is not specifically set in advance, with the assumption<br />
that the statistical tests per<strong>for</strong>med will indicate what is<br />
statistically significant. It is then up to the researcher<br />
TABLE 3. Resulting β values <strong>for</strong> various sample sizesa N 100 200 300 400 500 600 700<br />
β 0.71 0.48 0.31 0.19 0.11 0.06 0.04<br />
a. Example <strong>for</strong> a given value of α (0.05), predicted mean (0.2), and clinically significant difference of 50%<br />
(0.10), β values are the probability of making a false negative conclusion (type II error).<br />
Source: Matthews and Farewell [17].<br />
A. A. Yates