Evaluation of hastelloy N alloys after nine years exposure to both a ...
Evaluation of hastelloy N alloys after nine years exposure to both a ...
Evaluation of hastelloy N alloys after nine years exposure to both a ...

Create successful ePaper yourself
Turn your PDF publications into a flip-book with our unique Google optimized e-Paper software.
20<br />
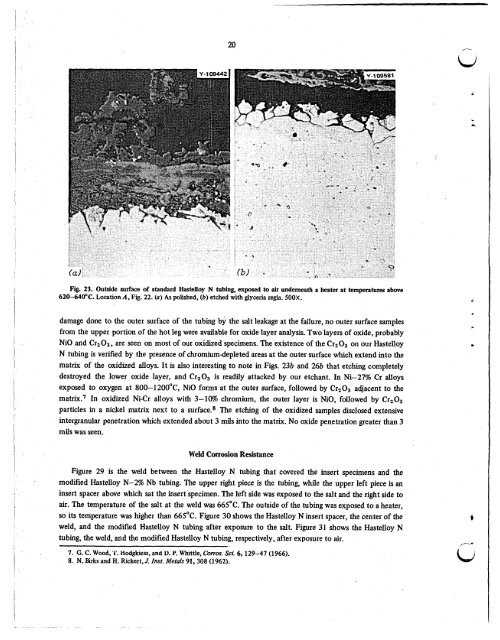
Fig. 23. Outside surface <strong>of</strong> standard Hastelloy N tubing, exposed <strong>to</strong> air underneath a heater at temperatures above<br />
620-640°C. Location A, Fig. 22. (a) As polished, (b) etched with glyceria regia. SOOX.<br />
damage done <strong>to</strong> the outer surface <strong>of</strong> the tubing by the salt leakage at the failure, no outer surface samples<br />
from the upper portion <strong>of</strong> the hot leg were available for oxide layer analysis. Two layers <strong>of</strong> oxide, probably<br />
NiO and Cr203, are seen on most <strong>of</strong> our oxidized specimens. The existence <strong>of</strong> the Cr203 on our Hastelloy<br />
N tubing is verified by the presence <strong>of</strong> chromium-depleted areas at the outer surface which extend in<strong>to</strong> the<br />
matrix <strong>of</strong> the oxidized <strong>alloys</strong>. It is also interesting <strong>to</strong> note in Figs. 23b and 26b that etching completely<br />
destroyed the lower oxide layer, and Cr2O3 is readily attacked by our etchant. In Ni-27% Cr <strong>alloys</strong><br />
exposed <strong>to</strong> oxygen at 800-1200°C, NiO forms at the outer surface, followed by Cr203 adjacent <strong>to</strong> the<br />
matrix.7 In oxidized Ni-Cr <strong>alloys</strong> with 3-10% chromium, the outer layer is NiO, followed by Cr203<br />
particles in a nickel matrix next <strong>to</strong> a surface.8 The etching <strong>of</strong> the oxidized samples disclosed extensive<br />
intergranular penetration which extended about 3 mils in<strong>to</strong> the matrix. No oxide penetration greater than 3<br />
mils was seen.<br />
Weld Corrosion Resistance<br />
Figure 29 is the weld between the Hastelloy N tubing that covered the insert specimens and the<br />
modified Hastelloy N-2% Nb tubing. The upper right piece is the tubing, while the upper left piece is an<br />
insert spacer above which sat the insert specimen. The left side was exposed <strong>to</strong> the salt and the right side <strong>to</strong><br />
air. The temperature <strong>of</strong> the salt at the weld was 665°C. The outside <strong>of</strong> the tubing was exposed <strong>to</strong> a heater,<br />
so its temperature was higher than 665°C. Figure 30 shows the Hastelloy N insert spacer, the center <strong>of</strong> the<br />
weld, and the modified Hastelloy N tubing <strong>after</strong> <strong>exposure</strong> <strong>to</strong> the salt. Figure 31 shows the Hastelloy N<br />
tubing, the weld, and the modified Hastelloy N tubing, respectively, <strong>after</strong> <strong>exposure</strong> <strong>to</strong> air.<br />
~ ~~<br />
7. G. C. Wood, I.. Hodgkiess, and D. Y. Whittle, Corros. Sci. 6,129-47 (1966).<br />
8. N. &ks and H. Rickert,J. Znst. Meruls 91,308 (1962).<br />
r
![Review of Molten Salt Reactor Physics Calculations [Disc 2]](https://img.yumpu.com/21979492/1/190x247/review-of-molten-salt-reactor-physics-calculations-disc-2.jpg?quality=85)