The Dynamical Transition of Protein Hydration Water - E13 - TUM
The Dynamical Transition of Protein Hydration Water - E13 - TUM
The Dynamical Transition of Protein Hydration Water - E13 - TUM

You also want an ePaper? Increase the reach of your titles
YUMPU automatically turns print PDFs into web optimized ePapers that Google loves.
<strong>The</strong> <strong>Dynamical</strong> <strong>Transition</strong> <strong>of</strong> <strong>Protein</strong> <strong>Hydration</strong> <strong>Water</strong><br />
W. Doster, S. Busch and A. Gaspar<br />
Physics Department E 13 and ZWE FRM II, Technische Universität München, 85747 Garching, Germany ∗<br />
M. S. Appavou, and J. Wuttke<br />
Institut für Festkörperforschung, Forschungszentrum Jülich GmbH,<br />
Jülich Center for Neutron Science At FRM II, Lichtenbergstr. 1, 85747 Garching, Germany<br />
(Dated: July 22, 2009)<br />
<strong>The</strong>rmodynamic anomalies and computer simulations <strong>of</strong> bulk water suggest a hidden critical<br />
point in the deeply super-cooled regime, which is not accessible to experiment [1]. To suppress<br />
crystallization, thin layers <strong>of</strong> water adsorbed to biomolecular surfaces were investigated with dynamic<br />
neutron scattering and simulation [2, 3]. Enhanced molecular displacements <strong>of</strong> lysozyme hydration<br />
water and a cross-over in the temperature dependence <strong>of</strong> the structural relaxation time at 220 K<br />
were assigned to a liquid-liquid phase transition in support <strong>of</strong> the critical scenario. We present<br />
more detailed neutron scattering experiments <strong>of</strong> water adsorbed to perdeuterated phycocyanin,<br />
suggesting instead a widening <strong>of</strong> the relaxation time spectrum. It is shown that the protein surface<br />
acts as a patch-breaker, suppressing critical fluctuations and the density maximum. This suggest a<br />
conventional glass-transition at 170 K rather than a critical scenario.<br />
PACS numbers: 61.20Ja,61.20Gy<br />
<strong>The</strong> ’protein dynamical transition’ was introduced 20<br />
years ago to denote an abrupt onset <strong>of</strong> structural displacements<br />
observed at 240 K with hydrated myoglobin<br />
and lysozyme [4]. <strong>The</strong> onset reflects a generic lowtemperature<br />
property <strong>of</strong> hydrated proteins, which is absent<br />
in dehydrated systems. <strong>The</strong> dynamical transition<br />
was thus interpreted as the water-coupled freezing-in <strong>of</strong><br />
structural relaxation. <strong>Protein</strong> hydration water, about 0.4<br />
g /g protein, can be super-cooled until the glass transition<br />
interferes at TG ≈ 170 K. <strong>The</strong> respective arrest <strong>of</strong><br />
translational degrees <strong>of</strong> freedom induces discontinuities<br />
in the specific heat and the thermal expansion coefficient<br />
<strong>of</strong> hydration water [5–9]. <strong>The</strong> dynamic onset was deduced<br />
originally from an anomalous loss in elastic intensity,<br />
observed with energy-resolved neutron scattering experiments.<br />
<strong>The</strong> spectral analysis showed, that the loss in<br />
elastic intensity is compensated by enhanced quasi-elastic<br />
scattering, where the respective protein-water relaxation<br />
time crosses the instrumental time window [4, 10]. <strong>The</strong><br />
onset temperature thus varies with the probe frequency<br />
and, more generally, the viscosity <strong>of</strong> the solvent near the<br />
protein surface [4, 11–13]: A viscous liquid appears solid<br />
on a scale shorter than the structural relaxation time.<br />
<strong>The</strong> onset at Ton = 240 K is located 60 degrees above<br />
the calorimetric glass temperature, since neutron scattering<br />
probes the structural relaxation at 100 ps, while<br />
the calorimetric glass temperature refers to a time-scale<br />
<strong>of</strong> 100 s.<br />
Recently, a structural transition, which would not display<br />
a time-scale effect, was proposed as an alternative<br />
explanation: High resolution neutron scattering ex-<br />
∗ Electronic address: wdoster@ph.tum.de<br />
APS/123-QED<br />
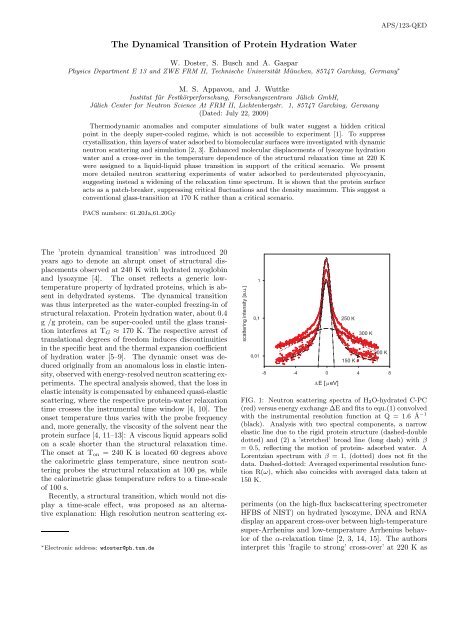
FIG. 1: Neutron scattering spectra <strong>of</strong> H2O-hydrated C-PC<br />
(red) versus energy exchange ∆E and fits to equ.(1) convolved<br />
with the instrumental resolution function at Q = 1.6 ˚A −1<br />
(black). Analysis with two spectral components, a narrow<br />
elastic line due to the rigid protein structure (dashed-double<br />
dotted) and (2) a ’stretched’ broad line (long dash) with β<br />
= 0.5, reflecting the motion <strong>of</strong> protein- adsorbed water. A<br />
Lorentzian spectrum with β = 1, (dotted) does not fit the<br />
data. Dashed-dotted: Averaged experimental resolution function<br />
R(ω), which also coincides with averaged data taken at<br />
150 K.<br />
periments (on the high-flux backscattering spectrometer<br />
HFBS <strong>of</strong> NIST) on hydrated lysozyme, DNA and RNA<br />
display an apparent cross-over between high-temperature<br />
super-Arrhenius and low-temperature Arrhenius behavior<br />
<strong>of</strong> the α-relaxation time [2, 3, 14, 15]. <strong>The</strong> authors<br />
interpret this ’fragile to strong’ cross-over’ at 220 K as
the transition from the high density to the low density<br />
phase <strong>of</strong> supercooled water [1, 3]. In this view,<br />
a qualitative change in the dynamics occurs, when the<br />
so-called Widom line is crossed, which extrapolates the<br />
phase boundary beyond the conjectured critical point<br />
[16, 17]. QENS measurements performed with the same<br />
HFBS spectrometer reveal a similar cross-over with confined<br />
water in various non-biological environments, such<br />
as carbon-nanotubes and rutile [18]. <strong>The</strong>se new results<br />
also admit a ’dynamical’ interpretation: Tfst = 220 K<br />
is located between TG and Ton: Due to the high energy<br />
resolution <strong>of</strong> HFBS, the onset <strong>of</strong> quasielastic scattering is<br />
observed on a time scale, which is intermediate between<br />
calorimetry and previous neutron scattering experiments.<br />
To address the question <strong>of</strong> ’structural’ versus ’dynamical’<br />
transition, we measured the motion <strong>of</strong> protein hydration<br />
water with enhanced sensitivity, employing an improved<br />
neutron scattering set-up with a per-deuterated<br />
protein sample, C-phycocyanin (C-PC). In this protein<br />
99% <strong>of</strong> the non-exchangeable hydrogens were replaced<br />
by D [19]. This emphazises the contribution <strong>of</strong> H2O to<br />
the scattering function with respect to the protein, since<br />
the proton has a ten times larger total cross-section compared<br />
to the deuteron [20]. <strong>The</strong> per-deuterated protein<br />
contributes essentially an elastic component to the spectrum,<br />
from which the relevant quasi-elastic part <strong>of</strong> H2O<br />
can be easily separated. <strong>The</strong> degree <strong>of</strong> hydration with<br />
H2O was adjusted to 0.3 g/g, the same hydration was<br />
used in the experiments performed with lysozyme [2]. C-<br />
PC is a blue copper protein and water-soluble, which acts<br />
as an antenna to collect light in bacteria. It consists <strong>of</strong> six<br />
protein chains, each containing a chromophore, which are<br />
organized as a ring structure surrounding a solvent channel<br />
in the center [21]. <strong>Water</strong> on C-PC was investigated<br />
with neutron back-scattering before, yielding an oscillating<br />
spectral width depending on the wave-vector [22, 23].<br />
Quasi-elastic neutron scattering data were collected with<br />
the new high-flux, high-resolution back-scattering spectrometer<br />
SPHERES at FRM II in Munich [24]. <strong>The</strong><br />
standard setup with 0.65 µeV (FWHM) resolution is<br />
slightly better than HFBS (0.85 µeV). <strong>The</strong> spectrometer<br />
was equipped with a temperature-controlled cryostat<br />
and spectra between 150 and 320 K were measured typically<br />
for 12 h each.<br />
Fig. 1 displays selected spectra <strong>of</strong> H2O-hydrated C-<br />
PC in the relevant temperature range. <strong>The</strong> log-intensity<br />
scale emphasizes the wings <strong>of</strong> the spectra in contrast<br />
to previous work [2]. A two-component analysis <strong>of</strong> the<br />
data was performed: (1) a narrow elastic spectrum assuming<br />
the shape <strong>of</strong> the instrumental resolution function<br />
R(ω), which is present also in the absence <strong>of</strong> water. It<br />
reflects the mainly coherent scattering from the rigid protein<br />
structure [20], (2) a broader quasi-elastic component,<br />
which is assigned to motions <strong>of</strong> adsorbed H2O molecules.<br />
No further component (background) was assumed. As<br />
fig. 1 illustrates, a Lorentzian line-shape (dotted) does<br />
not account for the broad line at this wave-vector. A<br />
stretched exponential relaxation defined by the stretch-<br />
FIG. 2: Average relaxation rates at large Q, derived from the<br />
fits <strong>of</strong> the spectra in fig. 1 with equ. 1 at 300 K (full red circles)<br />
and at 270 K (open circles). Full circles (blue): stretching<br />
exponents β. Dashed line: rate <strong>of</strong> continuous translational<br />
diffusion with ˙ τ −1¸ = Q 2 Dhyd<br />
ing exponent β ≤1 had to be introduced. Transformation<br />
to the frequency domain and convolution with the resolution<br />
function R(ω) yields:<br />
SQ(ω) = AprotR (ω)+Ahyd·R(ω)∗FT exp(−t/τ) β (1)<br />
<strong>The</strong> fits were constrained by fixing the protein- and water<br />
spectral fractions, Aprot and Ahyd. <strong>The</strong> average relaxation<br />
time 〈τ〉 <strong>of</strong> a Kohlrausch function is given by:<br />
〈τ〉 = τ ·Γ (β)/β. Excellent fits <strong>of</strong> the spectra with equ. 1<br />
were achieved for the entire temperature and Q-range, as<br />
illustrated in fig. 1 on a log-intensity scale.<br />
<strong>The</strong> correlation time τ and the stretching parameter<br />
β were adjusted. Both parameters depend on the wavevector:<br />
Below Q = 1 ˚A −1 , a Lorentzian line-shape, β = 1,<br />
is compatible with data. <strong>The</strong> resulting spectral width increases<br />
with Q as shown in fig. 2. <strong>The</strong> observed Q 2<br />
dependence <strong>of</strong> the width is the signature <strong>of</strong> translational<br />
diffusion and excludes any interpretation in terms <strong>of</strong> localized<br />
motion (β-process) <strong>of</strong> protein residues or water<br />
molecules. From 1/〈τ〉 = Q 2 Dhyd one estimates an effective<br />
diffusion coefficient <strong>of</strong> Dhyd ≈ 0.2 Dbulk, consistent<br />
with previous results [25]. Above Q = 1 ˚A −1 , the relaxation<br />
rate tends to a Q-independent plateau. In this Q<br />
regime, one records motions on a spatial scale comparable<br />
to the intermolecular distance. <strong>The</strong> cage <strong>of</strong> nearest<br />
neighbours forces the molecules to perform discrete<br />
displacements. <strong>The</strong> respective displacement distribution<br />
thus deviates from a Gaussian random process [12]. <strong>The</strong><br />
inter-cage motion restores the spatial symmetry and can<br />
thus be interpreted as the main structural process, the<br />
2
FIG. 3: Arrhenius plot <strong>of</strong> 〈τ〉 <strong>of</strong> H2O adsorbed to C-PC with<br />
β = 0.5 (full red circles) and β = 0.35 (open circles). Full<br />
red line: VFT-fit with equ.(2), parameters: τ0 = 1 (±0.5)<br />
ps, A = 790 (±50) K and T0 = 145 (±10) K. Filled triangles:<br />
H2O <strong>of</strong> hydrated myoglobin [12] and hydrated lysozyme<br />
(black squares) [2], open square: water-coupled protein relaxation<br />
<strong>of</strong> myoglobin [12, 27].<br />
α-relaxation [26]. In this regime a Lorentzian fails to account<br />
for the wings <strong>of</strong> the spectra (fig. 1). <strong>The</strong> constraint<br />
<strong>of</strong> constant relative amplitudes (equ. 1) allows to confine<br />
the stretching parameter to a narrow range <strong>of</strong> β = 0.5 ±<br />
0.05.<br />
At lower temperatures (270 K) the same scenario persists<br />
though with lower rates. <strong>The</strong> reported oscillatory<br />
behavior <strong>of</strong> the line-width [22] is not reproduced. It results<br />
in our view from neglecting the elastic component,<br />
which varies with Q [20]. In the following, we focus on<br />
the initial step <strong>of</strong> diffusion, the α-process, by averaging<br />
the weakly Q-dependent spectra above 1.4 ˚A −1 . <strong>The</strong><br />
Arrhenius plot <strong>of</strong> the average relaxation time in fig. 3<br />
displays the expected super-Arrhenius behaviour, as observed<br />
previously with hydrated lyoszyme [2] and myoglobin<br />
[12]. <strong>The</strong> data were adjusted to a Vogel-Fulcher-<br />
Tamman (VFT) law, shown in fig. 3:<br />
A/(T −T0)<br />
〈τ〉 = τ0e<br />
(2)<br />
<strong>The</strong> extrapolated glass temperature TG(τ = 100 s) ≈<br />
170 K, coincides with previous estimates, as shown in fig.<br />
4. <strong>The</strong> VFT fit becomes less satisfactory below 220 K.<br />
<strong>The</strong> respective ’fragile to strong’ cross-over is however<br />
less pronounced than with lysozyme [2]. An alternative<br />
explanation involves the widening <strong>of</strong> the relaxation<br />
FIG. 4: Apparent elastic fraction fapp <strong>of</strong> H2O-C-PC neutron<br />
scattering spectra at Q = 1.6 ˚A −1 (open circles) and the prediction<br />
based on the dynamic analysis <strong>of</strong> equ. 3 at 0.65 µeV<br />
resolution (full line, red). Dashed-dotted line (blue): normalized<br />
elastic intensity (HFBS, NIST) <strong>of</strong> water on hydrated<br />
lysozyme by Chen et al. [2]. Dashed line: prediction <strong>of</strong> fapp at<br />
7 µeV resolution, full circles: hydrated lysozme (IN13, ILL).<br />
Full triangles: Spectroscopic thermal expansion coefficient, α,<br />
<strong>of</strong> water in hydrated lysozyme powder, open triangles: Densitometric<br />
thermal expansion coefficient <strong>of</strong> hydration water<br />
(lysozyme in solution), dashed line: expansion coefficient <strong>of</strong><br />
bulk water [9, 30].<br />
time spectrum: By adjusting the stretching parameter<br />
β from 0.5 above to 0.35 below 220 K, one can recover<br />
the VFT-behavior (fig. 3). It is known from dielectric<br />
and NMR experiments that a slow β-relaxation decouples<br />
from the main α-relaxation in this temperature range<br />
[28, 29], which may increase the apparent width <strong>of</strong> the<br />
distribution.<br />
Simulations, supporting the critical scenario, interpret<br />
the anharmonic onset in the displacements at Tfst by an<br />
abrupt loosening <strong>of</strong> the water structure [3]. <strong>The</strong> analogous<br />
explanation was given by Chen et al. [2] for the<br />
step-like decrease <strong>of</strong> the elastic intensity observed with<br />
hydrated lysozyme (dashed-dotted line in fig. 4) . With<br />
C-PC water a similar transition is found at about the<br />
same temperature. Since the elastic intensity responds<br />
to structural as well as to dynamic changes, we introduce<br />
the apparent elastic fraction, defined as the relative area<br />
covered by the elastic spectral component. According to<br />
equ. 1 it can be written as [27]:<br />
<br />
dωR(ω, ∆ω)L(ω, 〈τ〉) (3)<br />
fapp = Aprot + Ahyd<br />
<strong>The</strong> second term, where the spectrum is approximated by<br />
a Lorentzian, exhibits a step-like decrease, when the average<br />
relaxation time 〈τ〉 becomes comparable to 1/∆ω,<br />
the instrumental resolution. <strong>The</strong> calculated fapp with ∆ω<br />
3
= 0.65 µeV explains the observed elastic fraction <strong>of</strong> the<br />
C-PC water spectrum rather well (fig. 4). Also shown is<br />
the prediction for ∆ω = 7 µeV and the respective measurements<br />
<strong>of</strong> lysozyme-adsorbed water performed at the<br />
same resolution with the back-scattering spectrometer<br />
IN13 (ILL). <strong>The</strong> shift in the onset temperatures from<br />
220 K to 240 K with decreasing spectral resolution is a<br />
typical feature expected <strong>of</strong> a dynamical transition. In<br />
previous work with hydrated myoglobin and lysozyme<br />
using IN13, the same onset Ton ≈ 240 K was derived<br />
[4, 12]. <strong>The</strong>se findings point to a dynamical rather than<br />
to a structural transition.<br />
To date, mainly neutron scattering experiments performed<br />
with HFBS provide support for a ’fragile to<br />
strong’ cross-over in protein hydration water. In contrast,<br />
dielectric and NMR relaxation experiments did not<br />
show a cusp in the temperature dependence <strong>of</strong> the respective<br />
structural relaxation time [28, 29, 31]. This<br />
discrepancy could indicate that the anomalous density<br />
fluctuations, present in bulk water, are suppressed in adsorbed<br />
water by interactions with the protein surface.<br />
This raises the question, whether hydration water ex-<br />
[1] P. Poole, F. Sciortino, U. Essmann, and H. Stanley, Nature<br />
360, 324 (1992).<br />
[2] S.-H. Chen, L. Liu, E. Fratini, P. Baglioni, A. Faraone,<br />
and A. Mamontov, Proc. Natl. Acad. Sci. USA 103,<br />
9012 (2006).<br />
[3] P. Kumar, Z. Yan, L. Xu, M. Mazza, S. Buldyrev,<br />
S. Chen, and H. E. Stanley, Phys. Rev. Lett. 97, 177802<br />
(2006).<br />
[4] W. Doster, S. Cusack, and W. Petry, Nature 337, 754<br />
(1989).<br />
[5] W. Doster, T. Bachleitner, M. Hiebl, E. Luescher, and<br />
A. Dunau, Biophys. J. 50, 213 (1986).<br />
[6] Y. Miyazaki, T. Matsuo, and H. Suga, Chem. Phys.<br />
Lett. 213, 303 (1993).<br />
[7] G. Sartor, E. Mayer, and G. Johari, Biophys. J. 66, 249<br />
(1994).<br />
[8] Y. Miyazaki, T. Matsuo, and H. Suga, J. Phys. Chem.<br />
B 104, 8044 (2000).<br />
[9] F. Demmel, W. Doster, W. Petry, and A. Schulte, Europ.<br />
Biophys. J. 26, 327 (1997).<br />
[10] W. Doster, S. Cusack, and W. Petry, Phys. Rev. Lett.<br />
65, 1080 (1990).<br />
[11] H. Lichtenegger, W. Doster, T. Kleinert, B. Sepiol, and<br />
G. Vogl, Biophys. J. 76, 414 (1999).<br />
[12] W. Doster and M. Settles, Biochim. Biophys. Act. 1749,<br />
173 (2005).<br />
[13] W. Doster, Eur. Biophys. J. 37, 591 (2008).<br />
[14] S.-H. Chen, L. Liu, and Y. Zhang, J. Chem.. Phys. 125,<br />
171103 (2006).<br />
[15] M. Lagi, X. Chu, Ch.Kim, F. Mallamace, P. Baglioni,<br />
and S. Chen, J. Phys. Chem. B 112, 1571 (2008).<br />
[16] L. Xu, P. Kumar, S. Buldyrev, S. Chen, P. Poole,<br />
F. Sciortino, and H. Stanley, Proc. Natl. Acad. Sci.<br />
hibits a density maximum required for critical behavior.<br />
<strong>The</strong> answer is provided by measurements <strong>of</strong> the<br />
thermal expansion coefficient <strong>of</strong> water near the surface<br />
<strong>of</strong> lysozyme: With densitometry, employing a vibrating<br />
densitometer (Parr), the combined expansion <strong>of</strong> protein<br />
and hydration shell in concentrated protein solution is determined.<br />
<strong>The</strong> bulk component is subtracted [30]. <strong>The</strong><br />
resulting expansion coefficient is nearly temperature independent<br />
and larger than the bulk value as shown in<br />
fig. 4. In the hydrated powder the expansion coefficient<br />
is derived from the O-H stretching frequency <strong>of</strong> water,<br />
depending on the average hydrogen bond length O-H–<br />
H [9]. <strong>The</strong> expansion exhibits a striking discontinuity<br />
at TG =170 K, induced by the s<strong>of</strong>tening <strong>of</strong> the O-H–O<br />
hydrogen bond network [5, 9]. Both methods yield overlapping<br />
values in the intermediate temperature range.<br />
No anomaly is observed at Tfst = 220 K. <strong>The</strong>se results<br />
are hardly compatible with a density maximum or critical<br />
entropy-volume fluctuations. All observations agree,<br />
however, with a glass transition scenario <strong>of</strong> the hydration<br />
shell and a dynamic onset temperature, which varies with<br />
the probe frequency.<br />
USA 102, 16558 (2005).<br />
[17] K. Ito, C. Moynihan, and C. A. Angell, Nature 398, 492<br />
(1999).<br />
[18] E. Mamontov, L. Vlcek, D. Wesolowski, P. Cummins,<br />
J. Rosenqvist, W. Wang, D. Cole, L. Anovitz, and<br />
G. Gasparovic, Phys. Rev. E. 79, 051504 (2009).<br />
[19] H. Crespi, in: Stable isotopes in the life sciences IAEA,<br />
Vienna, 111 (1977).<br />
[20] A. Gaspar, S. Busch, M. Appavou, W. Haeussler,<br />
R. Georgiee, Y. Su, and W. Doster, Bioch.<br />
Biophys. Act. <strong>Protein</strong> and Proteomics doi:<br />
10.1016/j.bbapap.2009.024 (2009).<br />
[21] T. Schirmer, W. Bode, and R. Huber, J. Mol. Biol. 196,<br />
677 (1987).<br />
[22] H. Middendorf and S. J. Randall, Phil. Trans. R. Soc.<br />
London B 290, 639 (1980).<br />
[23] K. Bradley, S. Chen, M. Bellissent-Funel, and H. Crespi,<br />
Biophys. Chem. 53, 37 (1994).<br />
[24] J. Wuttke and al., Z. Phys. Chem. submitted (2009).<br />
[25] M. Settles and W. Doster, Faraday Discussion 103, 269<br />
(1996).<br />
[26] W. Goetze and L. Sjoegren, Rep. Prog. Phys. 55, 241<br />
(1992).<br />
[27] W. Doster, M. Diehl, R. Gebhardt, R. Lechner, and<br />
J. Pieper, Physica B 301, 65 (2003).<br />
[28] J. Swenson, H. Jansson, and R. Bergman, Phys. Rev.<br />
Lett. 96, 247802 (2006).<br />
[29] M. Vogel, Phys. Rev. Lett. 101, 225701 (2008).<br />
[30] M. Hiebl and R. Maksymiw, Biopol. 31, 161 (1991).<br />
[31] S. Pawlus, S. Khodadadi, and A. Sokolov, Phys. Rev.<br />
Lett. 100, 108103 (2008).<br />
4