The Travel & Tourism Competitiveness Report 2013
The Travel & Tourism Competitiveness Report 2013
The Travel & Tourism Competitiveness Report 2013

You also want an ePaper? Increase the reach of your titles
YUMPU automatically turns print PDFs into web optimized ePapers that Google loves.
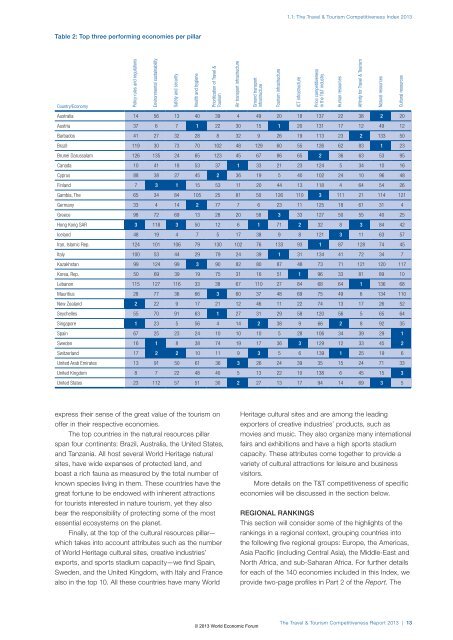
Table 2: Top three performing economies per pillar<br />
Country/Economy Policy rules and regulations<br />
Environmental sustainability<br />
Safety and security<br />
Health and hygiene<br />
Prioritization of <strong>Travel</strong> &<br />
<strong>Tourism</strong><br />
1.1: <strong>The</strong> <strong>Travel</strong> & <strong>Tourism</strong> <strong>Competitiveness</strong> Index <strong>2013</strong><br />
Australia 14 56 13 40 39 4 49 20 18 137 22 38 2 20<br />
Austria 37 6 7 1 22 30 15 1 20 131 17 12 49 12<br />
Barbados 41 27 32 28 8 32 9 26 19 113 23 2 133 50<br />
Brazil 119 30 73 70 102 48 129 60 55 126 62 83 1 23<br />
Brunei Darussalam 126 135 24 65 123 45 67 86 65 2 36 63 53 95<br />
Canada 10 41 18 53 37 1 33 21 23 124 5 34 10 16<br />
Cyprus 88 38 27 45 2 36 19 5 40 102 24 10 96 48<br />
Finland 7 3 1 15 53 11 20 44 13 118 4 64 54 26<br />
Gambia, <strong>The</strong> 65 34 84 105 25 81 50 126 110 3 111 21 114 121<br />
Germany 33 4 14 2 77 7 6 23 11 125 18 61 31 4<br />
Greece 98 72 69 13 28 20 58 3 33 127 50 55 40 25<br />
Hong Kong SAR 3 118 3 50 12 6 1 71 2 32 8 3 84 42<br />
Iceland 48 19 4 7 5 17 38 9 8 121 3 11 63 57<br />
Iran, Islamic Rep. 124 101 106 79 130 102 76 133 93 1 87 128 74 45<br />
Italy 100 53 44 29 79 24 39 1 31 134 41 72 34 7<br />
Kazakhstan 99 124 99 3 90 82 80 87 48 73 71 121 120 117<br />
Korea, Rep. 50 69 39 19 75 31 16 51 1 96 33 81 89 10<br />
Lebanon 115 127 116 33 38 67 110 27 84 68 64 1 136 68<br />
Mauritius 28 77 36 66 3 60 37 48 69 75 49 6 134 110<br />
New Zealand 2 22 9 17 21 12 46 11 22 74 13 17 26 52<br />
Seychelles 55 70 91 63 1 27 31 29 58 120 56 5 65 64<br />
Singapore 1 23 5 56 4 14 2 38 9 66 2 8 92 35<br />
Spain 67 25 23 24 10 10 10 5 28 106 34 39 29 1<br />
Sweden 16 1 8 38 74 19 17 36 3 129 12 33 45 2<br />
Switzerland 17 2 2 10 11 9 3 5 6 139 1 25 19 6<br />
United Arab Emirates 13 91 50 61 36 3 26 24 39 35 15 24 71 33<br />
United Kingdom 8 7 22 48 40 5 13 22 10 138 6 45 15 3<br />
United States 23 112 57 51 30 2 27 13 17 94 14 69 3 5<br />
express their sense of the great value of the tourism on<br />
offer in their respective economies.<br />
<strong>The</strong> top countries in the natural resources pillar<br />
span four continents: Brazil, Australia, the United States,<br />
and Tanzania. All host several World Heritage natural<br />
sites, have wide expanses of protected land, and<br />
boast a rich fauna as measured by the total number of<br />
known species living in them. <strong>The</strong>se countries have the<br />
great fortune to be endowed with inherent attractions<br />
for tourists interested in nature tourism, yet they also<br />
bear the responsibility of protecting some of the most<br />
essential ecosystems on the planet.<br />
Finally, at the top of the cultural resources pillar—<br />
which takes into account attributes such as the number<br />
of World Heritage cultural sites, creative industries’<br />
exports, and sports stadium capacity—we find Spain,<br />
Sweden, and the United Kingdom, with Italy and France<br />
also in the top 10. All these countries have many World<br />
Air transport infrastructure<br />
Ground transport<br />
infrastructure<br />
© <strong>2013</strong> World Economic Forum<br />
<strong>Tourism</strong> infrastructure<br />
ICT infrastructure<br />
Price competitiveness<br />
in the T&T industry<br />
Heritage cultural sites and are among the leading<br />
exporters of creative industries’ products, such as<br />
movies and music. <strong>The</strong>y also organize many international<br />
fairs and exhibitions and have a high sports stadium<br />
capacity. <strong>The</strong>se attributes come together to provide a<br />
variety of cultural attractions for leisure and business<br />
visitors.<br />
More details on the T&T competitiveness of specific<br />
economies will be discussed in the section below.<br />
REGIONAL RANKINGS<br />
This section will consider some of the highlights of the<br />
rankings in a regional context, grouping countries into<br />
the following five regional groups: Europe, the Americas,<br />
Asia Pacific (including Central Asia), the Middle-East and<br />
North Africa, and sub-Saharan Africa. For further details<br />
for each of the 140 economies included in this Index, we<br />
provide two-page profiles in Part 2 of the <strong>Report</strong>. <strong>The</strong><br />
Human resources<br />
Affinity for <strong>Travel</strong> & <strong>Tourism</strong><br />
Natural resources<br />
Cultural resources<br />
<strong>The</strong> <strong>Travel</strong> & <strong>Tourism</strong> <strong>Competitiveness</strong> <strong>Report</strong> <strong>2013</strong> | 13