Metabolic Disease: MILLIPLEX® RIas, and ELISa ... - Millipore
Metabolic Disease: MILLIPLEX® RIas, and ELISa ... - Millipore
Metabolic Disease: MILLIPLEX® RIas, and ELISa ... - Millipore
Create successful ePaper yourself
Turn your PDF publications into a flip-book with our unique Google optimized e-Paper software.
Data Sheet<br />
Product Selection Guide<br />
<strong>Metabolic</strong> <strong>Disease</strong>: MILLIPLEX ® MaP,<br />
<strong>RIas</strong>, <strong>and</strong> <strong>ELISa</strong> Immunoassays<br />
Luminex ® xMAP ® Technology
MILLIPLEX MAP<br />
<strong>and</strong> <strong>Metabolic</strong> Syndrome<br />
With the incidence of type 2 diabetes on the rise even among children<br />
<strong>and</strong> teens, the study of hormones linked to metabolic syndrome is essential to<br />
both treatment <strong>and</strong> prevention.<br />
Obesity, diabetes <strong>and</strong> associated conditions under the umbrella of<br />
<strong>Metabolic</strong> Syndrome are urgent health issues. Hormones produced<br />
by various organs of the endocrine system, including adipocytes, the<br />
pancreas <strong>and</strong> the GI tract, play an integrated role in regulating energy<br />
<strong>and</strong> metabolism.<br />
Inside this guide you’ll find a comprehensive list of MILLIPLEX MAP<br />
adipokines/adipocytes, endocrine hormones, gut hormone panels, <strong>and</strong><br />
our new metabolic panels, based on the Luminex xMAP platform.<br />
MILLIPLEX MAP enables you to investigate the modulation <strong>and</strong> expression<br />
of dozens of analytes simultaneously, giving you the advantage of speed<br />
<strong>and</strong> sensitivity, <strong>and</strong> dramatically improving productivity. And now, with<br />
the introduction of our magnetic bead kits, you can choose the assay<br />
type that best fits your research needs.<br />
<strong>Metabolic</strong> disease research plays a<br />
significant role in achieving a deeper<br />
underst<strong>and</strong>ing of disease states such as:<br />
• <strong>Metabolic</strong> Syndrome<br />
• Diabetes<br />
• Obesity<br />
• Cardiovascular <strong>Disease</strong>
Available Multiplex Panels:<br />
Adipokine / Adipocyte, page 3<br />
• Human Adipokine Panels A <strong>and</strong> B,<br />
<strong>and</strong> Adipocyte<br />
• Mouse Adipokine, Adipocyte,<br />
<strong>and</strong> Adiponectin Single-Plex<br />
• Rat Adipokine, Adipocyte,<br />
<strong>and</strong> Adiponectin Single-Plex<br />
• Canine Adipokine<br />
Food<br />
Intake<br />
GIP<br />
GUT<br />
GLP-2<br />
GRP<br />
PYY<br />
Gastrin<br />
Oxyntomodulin<br />
VIP<br />
CCK<br />
Obestatin<br />
Body<br />
Weight<br />
Energy<br />
Expediture<br />
GLP-1<br />
Ghrelin<br />
PANCREAS<br />
Proinsulin<br />
C-Peptide<br />
Amylin<br />
PYY3-36<br />
Glucagon<br />
PP<br />
Somatostatin<br />
Endocrine Hormone, page 8<br />
• Human<br />
• Mouse<br />
• Rat<br />
• Canine<br />
Gut Hormone, page 13<br />
• Human<br />
• Mouse<br />
• Rat<br />
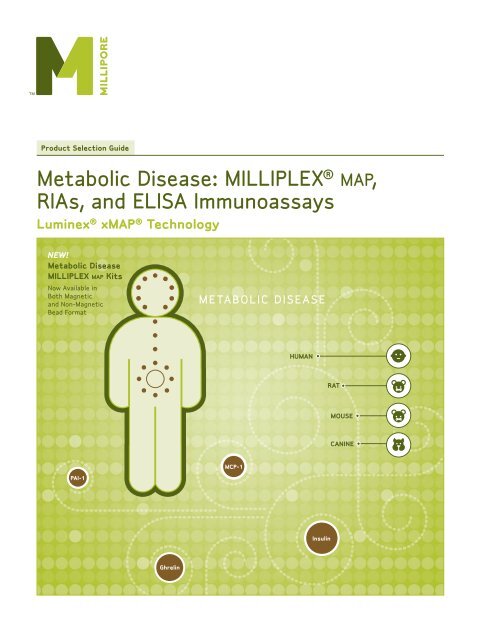
Diabetes <strong>and</strong> Obesity Biomarkers<br />
HYPOTHALAMUS<br />
NPY<br />
MCH<br />
AgRP<br />
Orexin<br />
Insulin Myostatin<br />
Musclin<br />
Adiponectin<br />
Resistin<br />
Leptin<br />
HUMAN MOUSE RAT<br />
CANINE<br />
IGF-1, page 17<br />
• Human<br />
• Rat/Mouse<br />
<strong>Metabolic</strong> <strong>Disease</strong>, page 18<br />
• Human, Non-magnetic<br />
Bead Format<br />
• Human, Magnetic<br />
Bead Format<br />
MUSCLE<br />
IL-6<br />
IL-8<br />
IL-10<br />
TNFα<br />
MCP-1 1<br />
MIF<br />
PAI-1<br />
ASP<br />
Adipsin n<br />
FAT<br />
Cortisol<br />
HGF<br />
NGF<br />
VEGF<br />
Visfatin<br />
Vaspin<br />
RBP4<br />
Chemerin<br />
Available from <strong>Millipore</strong><br />
1
2<br />
MILLIPLEX MAP:<br />
Advancing <strong>Metabolic</strong> <strong>Disease</strong> Research<br />
<strong>Metabolic</strong> syndrome is a cluster of conditions that occur together, including<br />
increased blood pressure, elevated insulin levels, excess body fat around the<br />
waist <strong>and</strong> abnormal cholesterol levels. Key features of metabolic syndrome<br />
include insulin resistance, glucose intolerance, hypertension, dyslipidemia <strong>and</strong><br />
central obesity—all of which are risk factors for atherosclerosis, coronary heart<br />
disease, type 2 diabetes, kidney disease, <strong>and</strong> even premature death. Adults with<br />
metabolic syndrome show a low-grade inflammation, whose link with obesity may<br />
be dysregulated adipocyte production of pro- <strong>and</strong> anti-inflammatory factors.<br />
Consequently, research done in this area covers multi-faceted fields of cytokines,<br />
acute phase proteins, diabetes <strong>and</strong> obesity related hormones, as well as other<br />
cardiovascular disease biomarkers.<br />
The study results shown below, published in Physiological Research, 2006,<br />
demonstrate a clear improvement of endothelial dysfunction markers after<br />
rosiglitazone treatment in patients with type 2 diabetes. This finding is in<br />
agreement with previously published studies showing that thiazolidinediones<br />
improve the mechanical properties of the vessel wall.<br />
Effect of PPAR-g Agonist Treatment on Markers of Endothelial Dysfunction in Patients with Type 2 Diabetes Mellitus<br />
Serum concentrations of Plasminogen Activator Inhibitor-1 (PAI-1), soluble VCAM-1 (sVCAM-1), soluble E-Selectin (sE-Selectin),<br />
<strong>and</strong> adiponectin in normal, diabetic, <strong>and</strong> diabetic patients treated with rosiglitazone (Av<strong>and</strong>ia) for 5 months as measured using<br />
the human CVD1 cardiovascular MILLIPLEX MAP.<br />
R. Dolezalová, M. Haluzík, L. Bosanská, Z. Lacinová, T. Stulc, M. Haluzík, Physiological Research, November 6 (2006)
MILLIPLEX MAP Adipokine <strong>and</strong><br />
Adipocyte Multiplex Panels<br />
In the past the role of white adipose tissue was thought to be limited to energy<br />
storage <strong>and</strong> internal organ protection. The discovery of leptin secretion from<br />
adipocytes in 1994 led to the recognition that white adipose tissue is involved<br />
in a variety of metabolic <strong>and</strong> physiological processes. Adipocytes secrete a<br />
number of hormones called adipokines with functions that include appetite <strong>and</strong><br />
energy balance, insulin sensitivity, <strong>and</strong> lipid metabolism. One of these adipokines,<br />
adiponectin, is involved in the regulation of lipid <strong>and</strong> glucose metabolism,<br />
influencing the body’s response to insulin. Also, its anti-inflammatory effects on<br />
the cellular lining of blood vessel walls may help to explain the association of high<br />
adiponectin levels with a reduced risk of heart attack.<br />
Serum / Plasma<br />
Samples<br />
Cell Culture<br />
Samples<br />
AVAILABLE ANALYTES<br />
Human Adipokine Panel A<br />
Human Adipokine Panel B<br />
Mouse Adipokine<br />
Rat Adipokine<br />
Canine Adipokine<br />
Mouse Single Plex<br />
Rat Single Plex<br />
Human Adipocyte<br />
Mouse Adipocyte<br />
Rat Adipocyte<br />
Adiponectin<br />
HGF<br />
*PAI-1 (active) <strong>and</strong> PAI-1 (total) cannot be plexed together.<br />
IL-1β<br />
IL-6<br />
IL-8<br />
Insulin<br />
Leptin<br />
MCP-1<br />
NGF<br />
PAI-1 (active)*<br />
PAI-1 (total)*<br />
Resistin<br />
TNFα<br />
3
4<br />
Human Adipokine Panels A, B<br />
(serum/plasma samples)<br />
Human Adipocyte Panel<br />
(cell culture samples)<br />
PERFORMANCE SPECIFICATIONS<br />
Precision<br />
Intra-assay: < 8%<br />
Inter-assay: < 21%<br />
Specificity<br />
Cross-reactivity between the antibodies <strong>and</strong> any of the<br />
other analytes within each panel is non-detectable or<br />
negligible.<br />
Assay Conditions<br />
• These kits may be used for the analysis of all or any<br />
combination of analytes within a panel in serum/plasma<br />
using the Adipokine Panels A <strong>and</strong> B <strong>and</strong> cell/tissue<br />
extract or culture samples using the Adipocyte Panel.<br />
• If using Adipokine Panel A with serum or plasma<br />
samples, a 1:400 dilution is required.<br />
• These are overnight assays requiring 25 µL sample size.<br />
• PAI-1 active <strong>and</strong> PAI-1 total cannot be plexed together.<br />
Analyte<br />
St<strong>and</strong>ard<br />
Curve Range<br />
(pg/mL)<br />
Serum<br />
Adipokine<br />
Panel A<br />
100,000 100<br />
MILLIPLEX MAP<br />
10,000<br />
10 Human Adipocyte Panel<br />
1,000<br />
0<br />
St<strong>and</strong>ard Curves<br />
100,000<br />
100<br />
0 1 10 100 1,000 10,000 100,000 1,000,000<br />
10,000<br />
10<br />
1,000<br />
0<br />
Concentration (pg/mL)<br />
100 0 1 10 100 1,000 10,000 100,000 1,000,000<br />
Sensitivity (pg/mL)<br />
10<br />
Accuracy (%)<br />
Concentration (pg/mL)<br />
Serum<br />
Adipokine<br />
Panel B<br />
100,000<br />
MILLIPLEX MAP<br />
10,000<br />
Human Serum Adipokine Panel A<br />
1,000 St<strong>and</strong>ard Curves Adiponectin<br />
100,000 100<br />
10,000 10<br />
Resistin<br />
MILLIPLEX MAP<br />
Human Serum Adipokine Panel A<br />
PAI-1<br />
1,0000<br />
100,000<br />
100<br />
0<br />
St<strong>and</strong>ard Curves<br />
100 10,000<br />
Adiponectin<br />
1,000,000 Resistin<br />
10,000<br />
10<br />
Concentration (pg/mL) PAI-1<br />
1,000<br />
0<br />
100<br />
10<br />
0<br />
Adiponectin<br />
100 10,000 1,000,000<br />
Resistin<br />
PAI-1<br />
Concentration (pg/mL)<br />
0<br />
0 1Serum 10 100 1,000 10,000 Serum 100,000 1,000,000<br />
Resistin<br />
PAI-1<br />
Adipocyte Panel Adipokine Adipokine<br />
Concentration (pg/mL)<br />
Panel A<br />
Panel B<br />
Adipocyte NGF Panel<br />
Adiponectin 16 to 250,000 145.4 - 80.2 100.8 - 95.5<br />
HGF 3.2 to 50,000 1.3 19.2 1.6 99.9 96.3 90.6<br />
Insulin 3.2 to 50,000 - 2.5 1.0 - 89.2 89.1<br />
IL-1b 0.64 to 10,000 - 0.1 0.1 - 93.9 92.1<br />
IL-6 0.64 to 10,000 - 0.1 0.1 - 93.9 92.1<br />
IL-8 0.64 to 10,000 - 0.1 0.1 - 93.9 92.1<br />
Leptin 16 to 250,000 - 85.4 27.4 - 99.8 95.7<br />
MCP-1 0.64 to 10,000 - 0.1 0.5 - 90.2 92.0<br />
NGF 0.64 to 10,000 - 2.5 1.0 - 89.2 89.1<br />
PAI-1 3.2 to 50,000 1.3 19.2 1.6 99.9 96.3 90.6<br />
Resistin 3.2 to 50,000 6.7 - 4.5 100.8 - 90.2<br />
TNFa 0.64 to 10,000 - 0.2 0.1 - 91.5 94.9<br />
HUMAN<br />
MFI<br />
MFI<br />
MFI<br />
MFI<br />
MFI<br />
MFI<br />
MFI<br />
MFI<br />
MFI<br />
0<br />
10,000 100<br />
Human Serum Adipokine Panel A<br />
St<strong>and</strong>ard Curves<br />
0 100 10,000 1,000,000<br />
Concentration MILLIPLEX (pg/mL) MAP<br />
Human Serum Adipokine Panel B<br />
St<strong>and</strong>ard Curves<br />
100,000<br />
MILLIPLEX MAP<br />
10,000 Human Serum Adipokine Panel B<br />
St<strong>and</strong>ard Curves<br />
1,000<br />
100,000<br />
MILLIPLEX MAP<br />
100<br />
10,000 Human Serum Adipokine Panel B<br />
St<strong>and</strong>ard Curves<br />
0<br />
100,000 1,000<br />
0 10 100 1,000 10,000 100,000 1,000,000<br />
Concentration (pg/mL)<br />
1,0000<br />
0 10 100 1,000 10,000 100,000 1,000,000<br />
100<br />
Concentration (pg/mL)<br />
0<br />
0 10 100 1,000 10,000 100,000 1,000,000<br />
Concentration MILLIPLEX (pg/mL) MAP<br />
Human Adipocyte Panel<br />
St<strong>and</strong>ard Curves<br />
100,000<br />
10,000<br />
MILLIPLEX MAP<br />
Human Adipocyte Panel<br />
1,000 St<strong>and</strong>ard Curves<br />
IL-1β<br />
IL-6<br />
IL-8<br />
Leptin<br />
IL-1β TNFα<br />
IL-6 MCP-1<br />
IL-8 HGF<br />
Leptin Insulin<br />
IL-1β<br />
TNFα NGF<br />
IL-6<br />
MCP-1<br />
IL-8<br />
HGF<br />
Leptin<br />
Insulin<br />
TNFα<br />
NGF<br />
MCP-1<br />
HGF<br />
Insulin<br />
NGF<br />
IL-1β<br />
IL-6<br />
IL-8<br />
Leptin<br />
IL-1β TNFα<br />
IL-6 MCP-1<br />
IL-8 HGF<br />
Leptin Adiponectin<br />
IL-1β<br />
TNFα Resistin<br />
IL-6<br />
MCP-1 PAI-1<br />
IL-8<br />
HGF NGF<br />
Leptin<br />
Adiponectin<br />
TNFα<br />
Resistin<br />
MCP-1<br />
PAI-1<br />
HGF<br />
NGF<br />
Adiponectin
Mouse Adipokine Panel<br />
(serum/plasma samples)<br />
Mouse Adipocyte Panel<br />
(cell culture samples)<br />
Mouse Adiponectin<br />
Single Plex<br />
PERFORMANCE SPECIFICATIONS<br />
St<strong>and</strong>ard Curve Ranges<br />
Adipokine Panel <strong>and</strong><br />
Adiponectin Single Plex: 16 to 50,000 pg/mL<br />
Adipocyte Panel: 3.2 to 10,000 pg/mL<br />
Precision<br />
Intra-assay: < 5%<br />
Inter-assay: < 12%<br />
Specificity<br />
Cross-reactivity between the antibodies <strong>and</strong> any of the<br />
other analytes within each panel is non-detectable or<br />
negligible.<br />
Assay Conditions<br />
• These kits may be used for the analysis of all or any<br />
combination of analytes within a panel in serum/plasma<br />
using the Adipokine Panel <strong>and</strong> cell/tissue extract or<br />
culture samples using the Adipocyte Panel.<br />
• The measurement of adiponectin in serum or plasma<br />
requires a 1:5000 dilution because the circulating levels<br />
of this protein are at a µg/mL range.<br />
• This is an overnight assay requiring 10 µL sample size.<br />
Analyte<br />
100,000<br />
100<br />
MILLIPLEX MAP<br />
10,000<br />
10 Mouse Serum Adipokine<br />
1,000<br />
1<br />
100,000<br />
100 10<br />
St<strong>and</strong>ard Curves<br />
100 1,000 10,000 100,000<br />
10,000<br />
10<br />
1,000<br />
1<br />
Concentration (pg/mL)<br />
100 10 100 1,000 10,000 100,000<br />
Sensitivity (pg/mL)<br />
1 10 100 1,000 10,000<br />
Accuracy (%)<br />
100,000<br />
Concentration (pg/mL)<br />
Serum Adipokine Panel Adipocyte Panel Serum Adipokine Panel Adipocyte Panel<br />
Adiponectin - 2.6 - 104<br />
Insulin 42.2 - 95 -<br />
IL-6 1.9 1.9 105 106<br />
Leptin 16.7 16.8 101 109<br />
MCP-1 14.4 9.7 99 106<br />
PAI-1 16.4 10.8 105 106<br />
Resistin 1.8 1.9 104 106<br />
TNFa 4.4 2.8 95 96<br />
MFI<br />
MFI<br />
MFI<br />
100,000<br />
10,000<br />
MFI<br />
MFI<br />
MFI<br />
MFI<br />
MFI<br />
MFI<br />
1,000<br />
10<br />
1<br />
10 100 1,000 10,000 100,000<br />
Concentration MILLIPLEX (pg/mL) MAP<br />
Mouse Adipocyte<br />
St<strong>and</strong>ard Curves<br />
100,000<br />
10,000<br />
MILLIPLEX MAP<br />
Mouse Adipocyte<br />
1,000 St<strong>and</strong>ard Curves<br />
100,000<br />
100 MILLIPLEX MAP<br />
10,000<br />
10<br />
1,000<br />
0<br />
100,000<br />
100<br />
0<br />
Mouse Adipocyte<br />
St<strong>and</strong>ard Curves<br />
10 100 1,000 10,000 100,000<br />
10,000<br />
10<br />
1,000<br />
0<br />
Concentration (pg/mL)<br />
100 0 10 100 1,000 10,000 100,000<br />
10 Concentration (pg/mL)<br />
0<br />
0 10 100 1,000 10,000 100,000<br />
Concentration MILLIPLEX (pg/mL) MAP<br />
Mouse Adiponectin Single Plex<br />
St<strong>and</strong>ard Curves<br />
10,000<br />
1,000<br />
MILLIPLEX MAP<br />
Mouse Adiponectin Single Plex<br />
St<strong>and</strong>ard Curves<br />
10,000<br />
100 MILLIPLEX MAP<br />
Mouse Adiponectin Single Plex<br />
1,000<br />
10<br />
St<strong>and</strong>ard Curves<br />
10,000<br />
1 10 100 1,000 10,000 100,000<br />
100<br />
Concentration (pg/mL)<br />
1,000<br />
10<br />
100<br />
1 10 100 1,000 10,000 100,000<br />
Concentration (pg/mL)<br />
10<br />
Mouse Serum Adipokine<br />
St<strong>and</strong>ard Curves<br />
MILLIPLEX MAP<br />
Mouse Serum Adipokine<br />
St<strong>and</strong>ard Curves<br />
Concentration (pg/mL)<br />
Insulin<br />
MCP-1<br />
Leptin<br />
IL-6<br />
TNFα Insulin<br />
PAI-1 MCP-1<br />
Resistin Leptin<br />
IL-6<br />
Insulin<br />
TNFα<br />
MCP-1<br />
PAI-1<br />
Leptin<br />
Resistin<br />
IL-6<br />
TNFα<br />
PAI-1<br />
Resistin<br />
MCP-1<br />
Leptin<br />
IL-6<br />
TNFα<br />
PAI-1 MCP-1<br />
Resistin Leptin<br />
Adiponectin<br />
IL-6<br />
TNFα<br />
MCP-1<br />
PAI-1<br />
Leptin<br />
Resistin<br />
IL-6<br />
Adiponectin<br />
TNFα<br />
PAI-1<br />
Resistin<br />
Adiponectin<br />
MOUSE<br />
5
6<br />
Rat Adipokine Panel<br />
(serum/plasma samples)<br />
Rat Adipocyte Panel<br />
(cell culture samples)<br />
Rat Adiponectin Single Plex<br />
PERFORMANCE SPECIFICATIONS<br />
Precision<br />
Adipocyte Panel (in buffer)<br />
Intra-assay: < 8% Inter-assay: < 20%<br />
Adipokine Panel (in matrix)<br />
Intra-assay: < 4% Inter-assay: < 14%<br />
Adiponectin Single Plex (in buffer)<br />
Intra-assay: < 5% Inter-assay: < 13%<br />
Specificity<br />
Cross-reactivity between the antibodies <strong>and</strong> any of the<br />
other analytes within each panel is non-detectable or<br />
negligible.<br />
Assay Conditions<br />
• These kits may be used for the analysis of all or any<br />
combination of analytes within a panel in serum/plasma<br />
using the Adipokine Panel <strong>and</strong> cell/tissue extract or<br />
culture samples using the Adipocyte Panel.<br />
• The measurement of adiponectin in serum or plasma<br />
requires a 1:500 dilution because the circulating levels<br />
of this protein are at a µg/mL range.<br />
• This is an overnight assay requiring 25 µL sample size.<br />
• PAI-1 active <strong>and</strong> PAI-1 total cannot be plexed together.<br />
10 100 1,000 10,000 100,000 1,000,000<br />
St<strong>and</strong>ard<br />
Sensitivity* (pg/mL) Concentration (pg/mL) Accuracy (%)<br />
Analyte Curve Range<br />
MILLIPLEX MAP<br />
(pg/mL)<br />
Adipocyte Adipokine Adiponectin Adipocyte Canine Adipokine Adipokine Panel Adiponectin<br />
Adiponectin<br />
IL-1b<br />
IL-6<br />
Insulin<br />
Leptin<br />
MCP-1<br />
PAI-1 (active)<br />
PAI-1 (total)<br />
TNFa<br />
122 to 50,000<br />
4.9 to 20,000<br />
12.2 to 50,000<br />
12.2 to 50,000<br />
12.2 to 50,000<br />
4.9 to 20,000<br />
12.2 to 50,000<br />
12.2 to 50,000<br />
4.9 to 20,000<br />
(in buffer)<br />
32.7<br />
0.9<br />
3.4<br />
-<br />
2.5<br />
10.5<br />
14.7<br />
12.5<br />
1.1<br />
(in serum)<br />
-<br />
1.2<br />
8.8<br />
52.5<br />
9.7<br />
25.8<br />
31.6<br />
30.7<br />
3.2<br />
(in buffer)<br />
100,000<br />
40.7<br />
10,000<br />
-<br />
100,000<br />
1,000<br />
-<br />
10,000<br />
100<br />
-<br />
100,000 1,000<br />
10<br />
-<br />
10,000 100<br />
1<br />
-<br />
1,000 10<br />
-<br />
1001<br />
-<br />
10<br />
-<br />
1<br />
1<br />
(in buffer) St<strong>and</strong>ard Curves (in serum) (in buffer)<br />
MILLIPLEX MAP<br />
Canine<br />
99<br />
Adipokine Panel<br />
- 95<br />
St<strong>and</strong>ard Curves<br />
96MILLIPLEX MAP 103 -<br />
Canine Adipokine Panel<br />
89 106 -<br />
St<strong>and</strong>ard Curves<br />
Resistin<br />
- 107 Adiponectin -<br />
97 103 Resistin -<br />
99 106 Adiponectin -<br />
10100 1,000 10,000 100,000 1,000,000<br />
92 110 Resistin -<br />
Concentration (pg/mL)<br />
117 98 Adiponectin -<br />
10100 1,000 10,000 100,000 1,000,000<br />
Concentration 99 (pg/mL) 116 -<br />
1<br />
* Minimum Detectable Concentrations<br />
1 10100 1,000 10,000 100,000 1,000,000<br />
RAT<br />
MFI<br />
MFI<br />
MFI<br />
100,000<br />
10,000<br />
100,000<br />
1,000<br />
10,000<br />
100,000 100<br />
1,000<br />
10,000 10<br />
100<br />
1<br />
1,000<br />
MFI<br />
MFI<br />
MFI<br />
MFI<br />
MFI<br />
MFI<br />
MFI<br />
MFI<br />
MFI<br />
10<br />
100 1<br />
10<br />
100,000<br />
1<br />
10,000<br />
100,000<br />
1,000<br />
10,000<br />
100,000 100<br />
1,000<br />
10,000 10<br />
100<br />
1<br />
1,000<br />
10<br />
100 1<br />
10<br />
1<br />
MILLIPLEX MAP<br />
Rat Adipokine Panel<br />
St<strong>and</strong>ard Curves<br />
MILLIPLEX MAP<br />
Insulin<br />
Rat Adipokine Panel<br />
MCP-1<br />
St<strong>and</strong>ard Curves<br />
Leptin<br />
MILLIPLEX MAP<br />
Insulin<br />
Rat Adipokine Panel<br />
IL-1β<br />
MCP-1<br />
St<strong>and</strong>ard Curves<br />
IL-6<br />
Leptin<br />
Insulin TNFα<br />
IL-1β<br />
MCP-1 PAI-1<br />
IL-6<br />
Leptin<br />
TNFα<br />
10 100 1,000 10,000 100,000 IL-1β<br />
PAI-1<br />
Concentration (pg/mL)<br />
IL-6<br />
TNFα<br />
10 100 1,000 10,000 100,000<br />
PAI-1<br />
Concentration (pg/mL)<br />
10 100 1,000 10,000 100,000<br />
Concentration (pg/mL)<br />
MILLIPLEX MAP<br />
Rat Adipocyte Panel<br />
St<strong>and</strong>ard Curves<br />
MILLIPLEX MAP<br />
MCP-1<br />
Rat Adipocyte Panel<br />
Leptin<br />
St<strong>and</strong>ard Curves<br />
IL-1β<br />
MILLIPLEX MAP<br />
MCP-1<br />
IL-6<br />
Rat Adipocyte Panel<br />
Leptin<br />
TNFα<br />
St<strong>and</strong>ard Curves<br />
IL-1β<br />
MCP-1 PAI-1<br />
IL-6<br />
Leptin Adiponectin<br />
TNFα<br />
IL-1β<br />
PAI-1<br />
IL-6<br />
10 100 1,000 10,000 100,000 1,000,000 Adiponectin<br />
TNFα<br />
Concentration (pg/mL)<br />
PAI-1<br />
10 100 1,000 10,000 100,000 1,000,000<br />
Adiponectin<br />
Concentration (pg/mL)<br />
10 100 1,000 10,000 100,000 1,000,000<br />
Concentration (pg/mL)<br />
MILLIPLEX MAP<br />
Rat Adiponectin Single Plex<br />
St<strong>and</strong>ard Curves<br />
MILLIPLEX MAP<br />
10,000<br />
Rat Adiponectin Single Plex<br />
St<strong>and</strong>ard Curves<br />
1,000<br />
10,000<br />
100<br />
1,000<br />
10,000 10<br />
100<br />
1,000 1<br />
MILLIPLEX MAP<br />
Rat Adiponectin Single Plex<br />
St<strong>and</strong>ard Curves<br />
10 10 100 1,000 10,000 100,000 1,000,000<br />
100<br />
1<br />
Concentration (pg/mL)<br />
10 10 100 1,000 10,000 100,000 1,000,000<br />
Concentration (pg/mL)<br />
1<br />
Concentration (pg/mL)
Canine Adipokine Panel<br />
PERFORMANCE SPECIFICATIONS<br />
Precision<br />
Intra-assay: < 10% Inter-assay: < 17%<br />
Specificity<br />
Cross-reactivity between the antibodies is non-detectable<br />
or negligible.<br />
Assay Conditions<br />
• These kits may be used for the analysis of all or any<br />
combination of analytes within a panel in serum/plasma<br />
using the Adipokine Panel <strong>and</strong> cell/tissue extract or<br />
culture samples using the Adipocyte Panel.<br />
• The measurement of adiponectin <strong>and</strong> resistin in serum<br />
or plasma requires a 1:500 dilution.<br />
• The user must determine the appropriate dilutions of<br />
cell culture supernatant.<br />
• This is an overnight assay requiring 25 µL sample size<br />
Analytes St<strong>and</strong>ard Curve Range (pg/mL) Sensitivity* (pg/mL) Accuracy (%)<br />
Adiponectin 32 to 500,000 22.1 115<br />
Resistin 3.2 to 50,000 1.5 116<br />
* Minimum Detectable Concentrations<br />
MFI<br />
100,000<br />
10,000<br />
1,000<br />
100<br />
10<br />
Concentration (pg/mL)<br />
MILLIPLEX MAP<br />
Canine Adipokine Panel<br />
St<strong>and</strong>ard Curves<br />
1<br />
1 10100 1,000 10,000 100,000 1,000,000<br />
Concentration (pg/mL)<br />
Resistin<br />
Adiponectin<br />
CANINE<br />
7
8<br />
MILLIPLEX MAP<br />
Endocrine Multiplex Panels<br />
Hormones produced by various organs of the endocrine system, including<br />
adipocytes, the pancreas <strong>and</strong> the GI tract, play an integrated role in regulating<br />
energy <strong>and</strong> metabolism. These key hormones are linked to obesity <strong>and</strong><br />
diabetes <strong>and</strong> may be involved in the pathogenesis of metabolic disorders.<br />
Leptin, a gatekeeper hormone produced by adipocytes, regulates appetite<br />
<strong>and</strong> metabolism. Further downstream, amylin, glucagon <strong>and</strong> insulin are key<br />
glycemic control hormones produced by the pancreas, <strong>and</strong> are regulated by<br />
gut hormones such as GLP-1. C-peptide, a byproduct of insulin production,<br />
converts metabolic signals to nitric oxide signaling, <strong>and</strong> is a marker of diabetes.<br />
AVAILABLE ANALYTES<br />
Human<br />
Mouse<br />
Rat<br />
Canine<br />
Amylin* (active)<br />
Amylin* (total)<br />
C-Peptide<br />
GLP-1 (active)<br />
Glucagon<br />
*Amylin (active) <strong>and</strong> Amylin (total) cannot be plexed together.<br />
Insulin<br />
Leptin
Human Endocrine Panel<br />
PERFORMANCE SPECIFICATIONS<br />
St<strong>and</strong>ard Curve Range<br />
6.2 to 4,500 pM for all analytes<br />
Specificity<br />
Cross-reactivity between the antibodies <strong>and</strong> any of the<br />
other analytes in this panel is non-detectable or negligible.<br />
Assay Conditions<br />
• Amylin (active) <strong>and</strong> Amylin (total) cannot be plexed<br />
together.<br />
• This kit may be used for the analysis of either active<br />
amylin or total amylin with any or all of the analytes in<br />
the panel in serum, plasma, other body fluids, <strong>and</strong> cell/<br />
tissue extract or culture samples.<br />
• This is an overnight assay requiring 25 µL sample size.<br />
STANDARD UNIT COMPARISON<br />
Hormone Molecular Weight 1,000 pM<br />
Glucagon<br />
ng/mLInsulin<br />
Amylin 3,903<br />
100<br />
100<br />
GLP-1 (active)<br />
0.39<br />
C-Peptide 3,617 100 0<br />
0.36<br />
GLP-1 (active) 3,297<br />
1<br />
100<br />
10 100 1,000 10,000<br />
0.33<br />
Glucagon 3,483 100<br />
Concentration (pM)<br />
0.34<br />
Insulin 5,808 100 0.58<br />
Leptin 16,027 100 1.60<br />
Precision<br />
Hormone Sensitivity MinDC (pM)<br />
MILLIPLEX MAP Accuracy (%)<br />
Intra-Assay (%CV) Inter-Assay Rat Endocrine (%CV) Panel<br />
St<strong>and</strong>ard Curves<br />
Amylin* (active) 1.5 3.8 100,000 8.4 80<br />
Amylin* (total) 2.3 4.7 10,000 9.3<br />
Amylin (active)<br />
94<br />
Leptin<br />
C-Peptide 2.7 7.3 1,000 4.2 Glucagon 84<br />
GLP-1 (active) 3.4 5.1 100 7.4 136 Insulin<br />
Glucagon 2.2 4.9<br />
10<br />
7.1<br />
GLP-1 (active)<br />
93<br />
Insulin 3.0 2.6<br />
1<br />
7.2 83<br />
Leptin 8.7 5.1 1 7.4 10 100 1,000 10,000 103<br />
* Amylin (active) <strong>and</strong> Amylin (total) cannot be plexed together.<br />
Concentration (pM)<br />
MFI<br />
MFI<br />
MFI<br />
MFI<br />
100,000<br />
10,000<br />
1,000<br />
100<br />
10,000<br />
1 10 100 1,000 10,000<br />
Concentration (pM)<br />
MILLIPLEX MAP<br />
Mouse Endocrine Panel<br />
St<strong>and</strong>ard Curves in Serum Matrix<br />
100,000<br />
100,000<br />
10,000<br />
1,000<br />
100<br />
10<br />
MILLIPLEX MAP<br />
Human Endocrine 6-plex Assay<br />
St<strong>and</strong>ard Curves<br />
MILLIPLEX MAP<br />
Canine Endocrine Panel<br />
St<strong>and</strong>ard Curves<br />
Amylin (active)<br />
Leptin<br />
Glucagon<br />
GLP-1 (active)<br />
C-Peptide<br />
Insulin<br />
Amylin (active)<br />
Leptin<br />
Leptin<br />
HUMAN<br />
Glucagon<br />
Insulin<br />
GLP-1 (active)<br />
9
10<br />
Mouse Endocrine Panel<br />
PERFORMANCE SPECIFICATIONS<br />
St<strong>and</strong>ard Curve Range<br />
6.2 to 4,500 pM for all analytes<br />
Precision<br />
Intra-assay: 3.8 – 10.6%<br />
Inter-assay: 4.8 – 20.7%<br />
Specificity<br />
Cross-reactivity between the antibodies <strong>and</strong> any of the<br />
other analytes in this panel is non-detectable or negligible.<br />
Assay Conditions<br />
• This kit may be used for the analysis of all or any<br />
combination of the analytes in this panel in serum,<br />
plasma, other body fluids, <strong>and</strong> cell/tissue extract or<br />
culture sample.<br />
• This is an overnight assay requiring 10 µL sample size.<br />
STANDARD UNIT COMPARISON<br />
1,000<br />
Glucagon<br />
Hormone Molecular Weight pM<br />
100<br />
ng/mLInsulin<br />
GLP-1 (active)<br />
Amylin 3,921 10 100 0.58<br />
GLP-1 (active) 3,297 100 1<br />
0.33<br />
Glucagon 3,483 1001 10 100 1,000 10,0000.35<br />
Insulin 5,800 100<br />
Concentration (pM)<br />
0.58<br />
Leptin 16,162 100 1.60<br />
Hormone Sensitivity MinDC (pM)<br />
Accuracy (%)<br />
Serum Matrix (%) MILLIPLEX MAP Serum Samples (%)<br />
Amylin (active) 6.2 101<br />
Canine Endocrine Panel<br />
St<strong>and</strong>ard Curves 80<br />
GLP-1 (active) 6.2 100,000 101 115<br />
Leptin<br />
Glucagon 6.2 10,000 99.7 106<br />
Glucagon<br />
Insulin 55.6 1,000 100 106Insulin<br />
Leptin 6.2 100 101 97GLP-1<br />
(active)<br />
MOUSE<br />
MFI<br />
MFI<br />
MFI<br />
MFI<br />
10,000<br />
1,000<br />
100<br />
10,000<br />
0<br />
1 10 100 1,000 10,000<br />
Concentration (pM)<br />
MILLIPLEX MAP<br />
Mouse Endocrine Panel<br />
St<strong>and</strong>ard Curves in Serum Matrix<br />
100,000<br />
1,000<br />
100<br />
100,000<br />
10,000<br />
10<br />
1 10 100 1,000 10,000<br />
Concentration (pM)<br />
MILLIPLEX MAP<br />
Rat Endocrine Panel<br />
St<strong>and</strong>ard Curves<br />
1<br />
1 10 100 1,000 10,000 100,000<br />
Concentration (pM)<br />
Glucagon<br />
GLP-1 (active)<br />
C-Peptide<br />
Insulin<br />
Amylin (active)<br />
Leptin<br />
Glucagon<br />
Insulin<br />
GLP-1 (active)<br />
Amylin (active)<br />
Leptin
Rat Endocrine Panel<br />
PERFORMANCE SPECIFICATIONS<br />
St<strong>and</strong>ard Curve Range<br />
Amylin (active): 17 to 18,000 pM<br />
GLP-1 (active): 23 to 23,000 pM<br />
Glucagon: 15 to 6,000 pM<br />
Insulin: 7 to 10,000 pM<br />
Leptin: 98 to 7,000 pM<br />
Precision<br />
Intra-assay: 3.8 – 10.6%<br />
Inter-assay: 4.8 – 20.7%<br />
Specificity<br />
Cross-reactivity between the antibodies <strong>and</strong> any of the<br />
other analytes in this panel is non-detectable or negligible.<br />
Assay Conditions<br />
• This kit may be used for the analysis of all or any<br />
combination of the analytes in this panel in serum,<br />
plasma, other body fluids, <strong>and</strong> cell/tissue extract or<br />
culture samples.<br />
• This is an overnight assay requiring 10 µL sample size.<br />
STANDARD UNIT COMPARISON<br />
Concentration (pM)<br />
Hormone Molecular Weight pM ng/mL<br />
Amylin 3,921 100 0.58<br />
GLP-1 (active) 3,297 100 0.33<br />
Glucagon 3,483 100 0.35<br />
Insulin 5,800 100 0.58<br />
Leptin 16,162 100 1.60<br />
Hormone<br />
Sensitivity Accuracy (%)<br />
MinDC (pM) Serum Matrix (%)<br />
Amylin (active) 6.2 101<br />
GLP-1 (active) 6.2 101<br />
Glucagon 6.2 99.7<br />
Insulin 55.6 100<br />
Leptin 6.2 101<br />
MFI<br />
MFI<br />
100<br />
0<br />
100,000<br />
10,000<br />
1,000<br />
100<br />
10<br />
1<br />
100,000<br />
10,000<br />
1,000<br />
100<br />
10<br />
1 10 100 1,000 10,000<br />
Concentration (pM)<br />
MILLIPLEX MAP<br />
Rat Endocrine Panel<br />
St<strong>and</strong>ard Curves<br />
1 10 100 1,000 10,000<br />
Concentration (pM)<br />
MILLIPLEX MAP<br />
Canine Endocrine Panel<br />
St<strong>and</strong>ard Curves<br />
1<br />
1 10 100 1,000 10,000 100,000<br />
GLP-1 (active)<br />
Amylin (active)<br />
Leptin<br />
Glucagon<br />
Insulin<br />
GLP-1 (active)<br />
Leptin<br />
Glucagon<br />
Insulin<br />
GLP-1 (active)<br />
RAT<br />
11
12<br />
Canine Endocrine Panel<br />
PERFORMANCE SPECIFICATIONS<br />
Specificity<br />
Cross-reactivity between the antibodies <strong>and</strong> any of the<br />
other analytes in this panel is non-detectable or negligible.<br />
Assay Conditions<br />
• This kit may be used for the analysis of all or any<br />
combination of the analytes in this panel in serum,<br />
plasma, other body fluids, <strong>and</strong> cell/tissue extract or<br />
culture samples.<br />
• The assay requires a 1:3 dilution in serum or plasma<br />
using assay buffer.<br />
• Users will need to determine the appropriate dilution<br />
when using cell or tissue culture supernatants.<br />
• This is an overnight assay requiring 25 µL sample size.<br />
Hormone<br />
St<strong>and</strong>ard Curve<br />
Range (pg/mL)<br />
Sensitivity MinDC<br />
(pg/mL)<br />
Precision<br />
Intra-Assay (%CV) Inter-Assay (%CV)<br />
Accuracy (%)<br />
GLP-1 (active) 20.6 to 15,000 12.1 5.6 14.6 73.7<br />
Glucagon 5.5 to 4,000 5.1 10.2 17.8 96.4<br />
Insulin 137.2 to 100,000 73.0 4.7 13.4 81.4<br />
Leptin 137.2 to 100,000 148.0 4.6 17.6 55.1<br />
CANINE<br />
MFI<br />
10<br />
1<br />
100,000<br />
10,000<br />
1,000<br />
100<br />
10<br />
1 10 100 1,000 10,000<br />
Concentration (pM)<br />
MILLIPLEX MAP<br />
Canine Endocrine Panel<br />
St<strong>and</strong>ard Curves<br />
1<br />
1 10 100 1,000 10,000 100,000<br />
Concentration (pM)<br />
GLP-1 (active)<br />
Leptin<br />
Glucagon<br />
Insulin<br />
GLP-1 (active)
MILLIPLEX MAP Gut<br />
Hormone Multiplex Panels<br />
In the study of obesity, advances are unfolding at a rapid pace, providing<br />
new hope for unraveling <strong>and</strong> potentially eradicating this disease. What we<br />
know about obesity has been transformed by the identification of several<br />
gut hormones or peptide hormones. While much remains unknown about<br />
the specific role they play in the cause of obesity, we do know that these<br />
peptides play a significant role in the regulation of gut motility <strong>and</strong> secretion,<br />
pancreatic islet hormone secretion, food intake <strong>and</strong> energy expenditure.<br />
In addition evidence of their presence <strong>and</strong> synthesis may be detectable in<br />
other organs of the body, including the brain where they may function as<br />
neuropeptides, taking part in both neurotransmission <strong>and</strong> neuromodulation.<br />
AVAILABLE ANALYTES<br />
Human<br />
Mouse<br />
Rat<br />
Amylin* (active)<br />
Amylin* (total)<br />
Ghrelin (active)<br />
GIP (total)<br />
GLP-1 (active)<br />
*Amylin (active) <strong>and</strong> Amylin (total) cannot be plexed together.<br />
Insulin<br />
Leptin<br />
PP<br />
PYY (total)<br />
13
Ghrelin (pg/mL) Ghrelin (pg/mL)<br />
Leptin (pg/mL Leptin x 1000) (pg/mL x 1000)<br />
Amylin (pg/mL) Amylin (pg/mL)<br />
PP (pg/mL)<br />
PP (pg/mL)<br />
300<br />
250<br />
200<br />
300<br />
150<br />
250<br />
100<br />
200<br />
50<br />
150<br />
0<br />
100<br />
250<br />
200<br />
14<br />
50<br />
0<br />
16<br />
14<br />
12<br />
10<br />
16<br />
14<br />
8<br />
6<br />
12<br />
4<br />
10<br />
2<br />
8<br />
0<br />
6<br />
150<br />
250<br />
100 200<br />
10<br />
150<br />
0<br />
100<br />
10<br />
140<br />
120<br />
100<br />
0<br />
140 80<br />
120 60<br />
100 40<br />
20 80<br />
60 0<br />
40<br />
20<br />
0<br />
4<br />
2<br />
0<br />
120<br />
14<br />
Serum Ghrelin Serum Ghrelin<br />
100<br />
300<br />
80<br />
250<br />
60<br />
200 Serum Ghrelin Serum Ghrelin<br />
40<br />
300<br />
15020<br />
250<br />
1000<br />
200 Fast 1<br />
50<br />
150<br />
0<br />
Fast 100 1Fast<br />
Post 1<br />
Serum 12 AmylinSerum<br />
GIPSerum<br />
GIP<br />
Figure 1. 140 Gut Hormone 140Levels<br />
Before <strong>and</strong> After Meal<br />
10<br />
120<br />
250<br />
120 8 120<br />
100<br />
200<br />
100 6 100Serum<br />
GIP Serum GIP<br />
80<br />
150<br />
140 80 4 80 140<br />
250<br />
2<br />
60<br />
120 60<br />
60 120<br />
100<br />
0<br />
200 40<br />
100<br />
Post<br />
40<br />
40 100<br />
Fast 1 Post<br />
10<br />
20 80<br />
2080<br />
150 20<br />
0<br />
60 0<br />
060<br />
0<br />
100<br />
Post Fast Fast Fast 1<br />
1<br />
40<br />
1<br />
40<br />
Post Post Post<br />
50<br />
20<br />
20<br />
10<br />
Ghrelin (pg/mL)<br />
Ghrelin (pg/mL) GIP (pg/mL)<br />
Fast<br />
Leptin (pg/mL<br />
GLP-1<br />
x 1000)<br />
Leptin (pg/mL x 1000)<br />
(pg/mL)<br />
40<br />
Serum Leptin Serum Leptin<br />
16<br />
30<br />
14<br />
12 20<br />
Serum Leptin Serum Leptin 100<br />
10<br />
10<br />
16<br />
80<br />
8<br />
14<br />
60<br />
60<br />
12<br />
40<br />
4 Fast 1<br />
Post<br />
10<br />
2<br />
20<br />
8<br />
0<br />
0<br />
6<br />
Fast Fast 1 Post 1 Post<br />
4<br />
Amylin (pg/mL)<br />
Amylin (pg/mL) PYY (pg/mL)<br />
PP (pg/mL)<br />
Insulin (pg/mL x 1000)<br />
140<br />
Fast<br />
0<br />
50<br />
120<br />
100<br />
Serum Amylin Serum Amylin<br />
80<br />
250<br />
60<br />
200<br />
Serum 40 Amylin Serum Amylin<br />
150<br />
250 20<br />
PP (pg/mL)<br />
100 2000<br />
10<br />
150<br />
10<br />
0<br />
2.5<br />
2<br />
0<br />
Serum GIP<br />
1 Fast Post 1<br />
Serum GLP-1<br />
1Fast<br />
Post 1<br />
Serum PYY<br />
Fast<br />
0<br />
100<br />
Fast 1Fast<br />
Fast<br />
Post 1<br />
1 Fast Post 1<br />
Serum GIP Correlation Insulin<br />
Serum 2 PP Serum PP<br />
140<br />
1.5<br />
120<br />
100<br />
1<br />
Serum PP<br />
80 140<br />
.5<br />
60 120<br />
Serum PP<br />
0<br />
40 100<br />
2080<br />
Fast 1<br />
060<br />
Fast 40<br />
Fast<br />
20<br />
0<br />
1<br />
Post<br />
Post<br />
Post<br />
Post<br />
Leptin Correlation<br />
Fast 1 Post 1 Post<br />
1Fast<br />
Post 1<br />
Amylin (pg/mL)<br />
PP (pg/mL)<br />
140<br />
120<br />
Post<br />
GIP (pg/mL)<br />
GIP (pg/mL)<br />
0<br />
Fast 1Fast<br />
Serum Amylin<br />
200 Serum PPSerum<br />
GLP-1 Serum GLP-1<br />
50<br />
50<br />
150<br />
GLP-1 (pg/mL)<br />
GLP-1 (pg/mL)<br />
40<br />
Serum GLP-1 Serum GLP-1<br />
3050<br />
2040<br />
Fast<br />
1030<br />
020<br />
Post 1Fast<br />
Post 1<br />
80 Serum PYYSerum<br />
PYY<br />
120<br />
60<br />
100<br />
40<br />
Fast 80<br />
20<br />
60<br />
0<br />
1 Post<br />
Fast 40 1Fast<br />
Post 1<br />
PYY (pg/mL)<br />
PYY (pg/mL)<br />
Insulin (pg/mL x 1000)<br />
Insulin (pg/mL x 1000)<br />
Serum PYYSerum<br />
PYY<br />
120<br />
100<br />
10<br />
Serum Insulin Serum Insulin<br />
2.5<br />
2<br />
Serum Insulin Serum Insulin<br />
1.52.5<br />
1 2<br />
.51.5<br />
Ghrelin 0 1Correlation<br />
Fast 1Fast<br />
Post 1<br />
Post 1<br />
Post 1<br />
Post<br />
Post<br />
0<br />
Post<br />
Post<br />
20<br />
20<br />
Figure 2. Gut Hormone Correlations MILLIPLEX MAP vs. ELISA<br />
0<br />
0<br />
Post<br />
Fast 1 Fast Post 1<br />
Post<br />
Insulin Correlation<br />
Post<br />
GIP (pg/mL) GIP (pg/mL)<br />
Leptin (pg/mL x 1000)<br />
GLP-1 (pg/mL) GLP-1 (pg/mL) Amylin (pg/mL)<br />
Fast<br />
PYY (pg/mL) PP (pg/mL)<br />
PYY (pg/mL)<br />
Insulin (pg/mL Insulin x 1000) (pg/mL x 1000)<br />
0<br />
250<br />
16<br />
40<br />
100<br />
30<br />
10 50<br />
20 40 0<br />
10 30<br />
20 0<br />
10<br />
140<br />
120<br />
0<br />
100<br />
120<br />
80<br />
100<br />
60<br />
80<br />
40<br />
120<br />
20 60<br />
100<br />
40 0<br />
80<br />
20<br />
60<br />
0<br />
40<br />
2.5<br />
2<br />
1.5 2.5<br />
12<br />
1.5 .5<br />
01<br />
.5<br />
0<br />
1 Fast<br />
Serum Leptin<br />
.5<br />
0<br />
1<br />
0<br />
Fast 1 Fast<br />
Serum PP<br />
Fast<br />
1 Fast<br />
Post<br />
Post 1<br />
Amylin (pg/mL) PYY (pg/mL)<br />
PP (pg/mL) Insulin (pg/mL x 1000)<br />
Lep<br />
Post<br />
Post<br />
0<br />
2.5<br />
2<br />
140 1.5<br />
120<br />
1<br />
100<br />
.5<br />
80<br />
600<br />
40<br />
20<br />
2<br />
0<br />
Fast<br />
GLP-1 (pg/mL)<br />
Fast<br />
Fast<br />
50<br />
40<br />
Serum PYY<br />
30<br />
20<br />
Serum Amylin<br />
10<br />
0<br />
Fast<br />
100<br />
Serum Insulin<br />
80<br />
PYY (pg/mL)<br />
Fast<br />
Fast<br />
Insulin (pg/mL x 1000)<br />
120<br />
60<br />
Serum 40 PP<br />
20<br />
0<br />
2.5<br />
2<br />
1.5<br />
1<br />
.5<br />
0<br />
1<br />
1<br />
1<br />
1<br />
1<br />
PP Correlation<br />
PYY Correlation<br />
Fast<br />
Fast<br />
Post<br />
Serum GLP-1<br />
1<br />
Post<br />
Post<br />
Serum PYY<br />
1<br />
Post<br />
Post<br />
Serum Insulin<br />
Figures 1 <strong>and</strong> 2. Assay was validated with fasting <strong>and</strong> postpr<strong>and</strong>ial in normal human serum <strong>and</strong> plasma samples (n=20). Our data showed<br />
significant meal-stimulated responses of circulating gut hormones as expected. The sample values generated with the multiplex assay<br />
correlated well with those generated using commercially available ELISA kits.<br />
1<br />
Post<br />
Post<br />
Post
Human Gut Hormone Panel<br />
PERFORMANCE SPECIFICATIONS<br />
Precision<br />
Intra-assay: < 11%<br />
Inter-assay: < 19%<br />
Specificity<br />
Cross-reactivity between the antibodies <strong>and</strong> any of the<br />
other analytes in this panel is non-detectable or negligible.<br />
Assay Conditions<br />
• Amylin (active) <strong>and</strong> Amylin (total) cannot be plexed<br />
together.<br />
• This kit may be used for the analysis of either active<br />
amylin or total amylin with any or all of the analytes in<br />
the panel in serum, plasma, other body fluids, <strong>and</strong> cell/<br />
tissue extract or culture samples.<br />
• This is an overnight assay requiring 25 µL sample size.<br />
MILLIPLEX MAP<br />
Mouse Gut Hormone Panel<br />
St<strong>and</strong>ard Curves<br />
Ghrelin (active)<br />
Hormone St<strong>and</strong>ard Curve Range (pg/mL)<br />
100,000<br />
Sensitivity MinDC (pg/mL)<br />
10,000<br />
Leptin<br />
Accuracy (%)<br />
GIP (total)<br />
Amylin* (active) 27.4 to 20,000 31.5 90 GLP-1 (active)<br />
Amylin* (total) 27.4 to 20,000<br />
1,000<br />
3.2<br />
Amylin (active)<br />
93<br />
PP<br />
Ghrelin (active) 13.7 to 10,000 1001.8<br />
85 PYY (total)<br />
GIP (total) 2.7 to 2,000 0.2<br />
10<br />
89 Insulin<br />
GLP-1 (active) 13.7 to 10,000 5.2 1 10 100 1,000 10,000 100,000 83<br />
Insulin 137 to 100,000 44.5 Concentration (pg/mL)<br />
85<br />
Leptin 137 to 100,000 2.4 102<br />
PP 13.7 to 10,000 2.4 88<br />
PYY (total) 13.7 to 10,000 8.4 107<br />
ANALYTES<br />
Human<br />
Mouse<br />
Rat<br />
Canine**<br />
Amylin* (active)<br />
Amylin* (total)<br />
Ghrelin (active)<br />
GIP (total)<br />
GLP-1 (active)<br />
*Amylin (active) <strong>and</strong> Amylin (total) cannot be plexed together.<br />
**Coming Soon<br />
Insulin<br />
Leptin<br />
MFI<br />
MFI<br />
MFI<br />
PP<br />
100,000<br />
10,000<br />
1,000<br />
100<br />
10<br />
100,000<br />
PYY (total)<br />
10,000<br />
1,000<br />
100<br />
MILLIPLEX MAP<br />
Human Gut Hormone Panel<br />
St<strong>and</strong>ard Curves<br />
1 10 100 1,000 10,000 100,000 1,000,000<br />
Concentration (pg/mL)<br />
MILLIPLEX MAP<br />
Rat Gut Hormone Panel<br />
St<strong>and</strong>ard Curves<br />
Glucagon<br />
10<br />
1 10 100 1,000 10,000 100,000<br />
Concentration (pg/mL)<br />
Ghrelin (active)<br />
Leptin<br />
GIP (total)<br />
GLP-1 (active)<br />
Amylin (active)<br />
PP<br />
PYY (total)<br />
Insulin<br />
Ghrelin (active)<br />
Leptin<br />
GIP (total)<br />
GLP-1 (active)<br />
Amylin (active)<br />
PP<br />
PYY (total)<br />
Insulin<br />
HUMAN<br />
15
16<br />
Mouse Gut Hormone Panel<br />
Rat Gut Hormone Panel<br />
PERFORMANCE SPECIFICATIONS<br />
Precision<br />
Intra-assay: < 7%<br />
Inter-assay: < 23%<br />
Specificity<br />
Cross-reactivity between the antibodies <strong>and</strong> any of the<br />
other analytes in this panel is non-detectable or negligible.<br />
Assay Conditions<br />
• These kits may be used for the analysis of all or any<br />
combination of the analytes in this panel in serum,<br />
plasma, other body fluids, <strong>and</strong> cell/tissue extract or<br />
culture samples.<br />
• These overnight assays requiring 25 µL sample size.<br />
MOUSE<br />
Hormone<br />
RAT<br />
St<strong>and</strong>ard Curve<br />
Range (pg/mL)<br />
Sensitivity MinDC<br />
(pg/mL)<br />
MFI<br />
MFI<br />
MFI<br />
MFI<br />
100,000<br />
10,000 10,000<br />
1,000 1,000<br />
100 100<br />
Concentration (pg/mL)<br />
10 10<br />
1 1 10 10 100 100 1,000 1,000 10,000 10,000 100,000<br />
Concentration (pg/mL)<br />
100,000<br />
10,000 10,000<br />
1,000 1,000<br />
100 100<br />
MILLIPLEX MAP MAP<br />
Mouse Gut Gut Hormone Panel<br />
St<strong>and</strong>ard Curves<br />
MILLIPLEX MAP MAP<br />
Rat Rat Gut Gut Hormone Panel<br />
St<strong>and</strong>ard Curves<br />
10 10<br />
1 1 10 10 100 100 1,000 1,000 10,000 10,000 100,000<br />
Concentration (pg/mL)<br />
Accuracy (%)<br />
Ghrelin (active)<br />
Leptin<br />
GIP GIP (total)<br />
GLP-1 (active)<br />
Amylin (active)<br />
PP PP<br />
PYY PYY (total)<br />
Insulin<br />
Ghrelin (active)<br />
Leptin<br />
GIP GIP (total)<br />
GLP-1 (active)<br />
Amylin (active)<br />
PP PP<br />
PYY PYY (total)<br />
Insulin<br />
Mouse Rat Mouse Rat<br />
Amylin (active) 41 to 30,000 7 20 96 92<br />
Ghrelin (active) 7 to 5,000 2 2 91 90<br />
GIP (total) 3 to 2,000 1 1 91 90<br />
GLP-1 (active) 41 to 30,000 28 28 85 84<br />
Insulin 69 to 50,000 25 28 92 93<br />
Leptin 69 to 50,000 22 27 90 87<br />
PP 7 to 5,000 17 17 84 88<br />
PYY (total) 7 to 5,000 16 16 84 86
MILLIPLEX MAP Human <strong>and</strong><br />
Rat/Mouse IGF-1 Single Plexes<br />
Insulin-like Growth Factor (IGF-1) is a polypeptide endocrine<br />
hormone similar in structure to insulin. Stimulated by growth<br />
hormone <strong>and</strong> produced primarily in the liver, it binds to the<br />
IGF-1 receptor with a high affinity <strong>and</strong> to the insulin receptor<br />
with a much lower affinity. The tyrosine kinase IGF-1 receptor<br />
is a potent activator of the Akt signaling pathway, which drives<br />
a variety of processes including cell growth <strong>and</strong> division <strong>and</strong><br />
apoptosis inhibition. Because approximately 98% of IGF-1 is<br />
always bound to one of six binding proteins (IGF-BP), extraction<br />
is required to measure extracellular protein concentrations.<br />
Increased levels of IGF-1 have been correlated with an increased<br />
risk of cancer. In addition, while involved in reducing hemoglobin<br />
A1C levels <strong>and</strong> daily insulin consumption in types 1 <strong>and</strong> 2<br />
diabetes, these increased levels have been also implicated in the<br />
development of diabetic retinopathy. Drugs have been developed<br />
as replacement therapy for severe primary IGF-1 deficiency, a<br />
group of diseases in which patients do not respond to growth<br />
hormone therapy.<br />
PERFORMANCE SPECIFICATIONS<br />
St<strong>and</strong>ard Curve Range<br />
Human: 137 to 100,000 pg/mL<br />
Rat/Mouse: 3.2 to 10,000 pg/mL<br />
Sensitivity<br />
Human: 60 pg/mL<br />
Rat/Mouse: 3.2 pg/mL<br />
Accuracy<br />
Human: 84%<br />
Rat/Mouse: 99%<br />
Precision<br />
Human<br />
Intra-assay: < 5% Inter-assay: < 12%<br />
Rat/Mouse<br />
Intra-assay: < 10% Inter-assay: < 5%<br />
Specificity<br />
The Ab pair used in each assay is specific <strong>and</strong> displays<br />
no cross-reactivity to insulin or IGF-2.<br />
Assay Conditions<br />
Human<br />
MFI<br />
MFI<br />
MFI<br />
MFI<br />
10,000<br />
1,000<br />
10,000 100<br />
1,000 10<br />
100<br />
10<br />
100,000<br />
10,000<br />
1,000<br />
100,000<br />
100<br />
100 1,000<br />
Concentration (pg/mL)<br />
10,000 100,000<br />
10,000<br />
10<br />
1,000 1 10 100 1,000 10,000 100,000<br />
100<br />
MILLIPLEX MAP<br />
Human IGF-1 Single Plex<br />
St<strong>and</strong>ard Curve<br />
MILLIPLEX MAP<br />
Human IGF-1 Single Plex<br />
St<strong>and</strong>ard Curve<br />
100 1,000<br />
Concentration (pg/mL)<br />
MILLIPLEX MAP<br />
Rat/Mouse IGF-1 Single Plex<br />
St<strong>and</strong>ard Curve<br />
10<br />
1 10 100 1,000 10,000 100,000<br />
Concentration (pg/mL)<br />
10,000 100,000<br />
MILLIPLEX MAP<br />
Rat/Mouse IGF-1 Single Plex<br />
St<strong>and</strong>ard Curve<br />
Concentration (pg/mL)<br />
• This assay may be used for the analysis human IGF-1 in<br />
serum, plasma, other body fluids, <strong>and</strong> cell/tissue extract<br />
or culture samples.<br />
• Sample extraction is required for the measurement of<br />
IGF-1 in serum or plasma.<br />
• This is an overnight assay requiring 25 µL sample size.<br />
Rat/Mouse<br />
• This assay may be used for the analysis of rat/mouse<br />
IGF-1 in serum, plasma, other body fluids, <strong>and</strong> cell/tissue<br />
extract or culture samples.<br />
• This single plex requires a 1:200 dilution of 25 µL of<br />
serum or plasma in assay buffer. Users need to<br />
determine appropriate dilutions in cell/tissue extracts or<br />
culture samples.<br />
• This is an overnight assay requiring 25 µL sample size.<br />
17
18<br />
MILLIPLEX MAP <strong>Metabolic</strong><br />
Multiplex Panels<br />
Key features of metabolic syndrome include insulin resistance, glucose<br />
intolerance, hypertension, dyslipidemia, central obesity <strong>and</strong> low-grade inflammation.<br />
These features are risk factors for atherosclerosis, coronary heart disease, type<br />
2 diabetes, kidney disease <strong>and</strong> premature death. Given the diverse manifestations<br />
<strong>and</strong> long-term effects of metabolic syndrome, a comprehensive study of this disease<br />
category requires reliable quantitation of cytokines, acute phase proteins, diabetes<br />
<strong>and</strong> obesity related hormones, as well as other cardiovascular disease biomarkers.<br />
The MILLIPLEX MAP <strong>Metabolic</strong> Multiplex Panels contain the most comprehensive range<br />
of analytes for studying metabolic pathways across multiple organ systems.<br />
AVAILABLE ANALYTES<br />
Human Non-Magnetic Bead Format<br />
Human Magnetic Bead Format<br />
Amylin* (active)<br />
Amylin* (total)<br />
*Amylin (active) <strong>and</strong> Amylin (total) cannot be plexed together.<br />
C-peptide<br />
Ghrelin (active)<br />
GIP (total)<br />
GLP-1 (active)<br />
Glucagon<br />
IL-6<br />
Insulin<br />
Leptin<br />
MCP-1<br />
PP<br />
PYY<br />
TNFα
Human <strong>Metabolic</strong> Hormone Panel (Non-Magnetic Bead)<br />
PERFORMANCE SPECIFICATIONS<br />
Specificity<br />
Cross-reactivity between the antibodies <strong>and</strong> any of the<br />
other analytes in this panel is non-detectable or negligible.<br />
Assay Conditions<br />
• Overnight assay requiring 25 µL sample size.<br />
• No sample dilution is required for serum <strong>and</strong> plasma.<br />
• See kit protocol for instructions regarding magnetic<br />
bead applications.<br />
Analyte<br />
St<strong>and</strong>ard Curve<br />
Range (pg/mL)<br />
Sensitivity<br />
(pg/mL)<br />
Precision<br />
Intra-Assay (%CV) Inter-Assay (%CV)<br />
Accuracy (%)<br />
Amylin (active) 27 to 20,000 11.0 < 7 < 13 69<br />
C-Peptide 69 to 50,000 20.0 < 4 < 8 94<br />
Ghrelin (active) 14 to 10,000 3.0 < 4 < 7 92<br />
GIP (total) 3 to 2,000 0.7 < 5 < 7 87<br />
GLP-1 (active) 14 to 10,000 20.0 < 3 < 11 79<br />
Glucagon 14 to 10,000 10.0 < 5 < 10 70<br />
IL-6 14 to 10,000 2.4 < 7 < 13 82<br />
Insulin 137 to 100,000 50.0 < 4 < 8 97<br />
Leptin 137 to 100,000 160.0 < 9 < 8 74<br />
MCP-1 14 to 10,000 2.4 < 5 < 11 85<br />
PP 14 to 10,000 5.0 < 4 < 9 91<br />
PYY 14 to 10,000 19.0 < 4 < 12 91<br />
TNFa 3 to 2,000 0.6 < 5 < 13 86<br />
MFI<br />
100,000<br />
10,000<br />
1,000<br />
100<br />
10<br />
MILLIPLEX MAP<br />
Human <strong>Metabolic</strong> Hormone<br />
Non-Magnetic Beads Panel<br />
St<strong>and</strong>ard Curves<br />
1 10 100 1,000 10,000 100,000<br />
Concentration (pg/mL)<br />
Amylin (active)<br />
C-Peptide<br />
Ghrelin (active)<br />
GIP (total)<br />
GLP-1 (active)<br />
Glucagon<br />
IL-6<br />
Insulin<br />
Leptin<br />
MCP-1<br />
PP<br />
PYY<br />
TNFα<br />
HUMAN<br />
19
20<br />
Human <strong>Metabolic</strong> Hormone Panel (Magnetic Bead)<br />
PERFORMANCE SPECIFICATIONS<br />
Specificity<br />
Cross-reactivity between the antibodies <strong>and</strong> any of the<br />
other analytes in this panel is non-detectable or negligible.<br />
Assay Conditions<br />
• Overnight assay requiring 25 µL sample size.<br />
• No sample dilution is required for serum <strong>and</strong> plasma.<br />
• Assay requires a magnetic bead plate washer<br />
(Alternatively, you can use <strong>Millipore</strong> filter plates with a<br />
vacuum manifold, Catalogue No. MSVMHTS00)<br />
Analyte<br />
St<strong>and</strong>ard Curve<br />
Range (pg/mL)<br />
Sensitivity (pg/mL)<br />
Precision<br />
Intra-Assay (%CV) Inter-Assay (%CV)<br />
Accuracy (%)<br />
Amylin (active) 27 to 20,000 8.0 < 3 < 21 81<br />
C-Peptide 69 to 50,000 4.0 < 8 < 16 83<br />
Ghrelin (active) 14 to 10,000 2.0 < 3 < 7 92<br />
GIP (total) 3 to 2,000 0.4 < 4 < 10 91<br />
GLP-1 (active) 14 to 10,000 12.0 < 2 < 13 81<br />
Glucagon 14 to 10,000 5.0 < 3 < 11 79<br />
IL-6 14 to 10,000 1.6 < 7 < 17 90<br />
Insulin 137 to 100,000 35.0 < 3 < 10 90<br />
Leptin 137 to 100,000 138.0 < 7 < 10 78<br />
MCP-1 14 to 10,000 2.0 < 3 < 11 84<br />
PP 14 to 10,000 3.0 < 6 < 9 92<br />
PYY 14 to 10,000 22.0 < 7 < 8 94<br />
TNFa 3 to 2,000 0.2 < 3 < 12 97<br />
HUMAN<br />
MFI<br />
100,000<br />
10,000<br />
1,000<br />
100<br />
10<br />
MILLIPLEX MAP<br />
Human <strong>Metabolic</strong> Hormone<br />
Magnetic Beads Panel<br />
St<strong>and</strong>ard Curves<br />
1 10 100 1,000 10,000 100,000<br />
Concentration (pg/mL)<br />
Amylin (active)<br />
C-Peptide<br />
Ghrelin (active)<br />
GIP (total)<br />
GLP-1 (active)<br />
Glucagon<br />
IL-6<br />
Insulin<br />
Leptin<br />
MCP-1<br />
PP<br />
PYY<br />
TNFα
Comparison of Human <strong>Metabolic</strong> Hormone Panel<br />
(Non-Magnetic Beads) <strong>and</strong> Human <strong>Metabolic</strong><br />
Hormone Panel (Magnetic beads)<br />
<strong>Millipore</strong> now offers two different types of Human<br />
<strong>Metabolic</strong> Hormone Panels for use with Luminex xMAP<br />
technology. The kits contain identical components, except<br />
for the magnetic beads. Our regular polystyrene bead kit<br />
contains fluorescently dyed polymer beads with an<br />
antibody attached to surface carboxyl groups, creating<br />
covalent bonds on the bead surface. Magnetic polystyrene<br />
beads contain encapsulated magnetite, <strong>and</strong> bead surface<br />
chemistries are identical to non-magnetic beads.<br />
The advantage of the magnetic bead is that it allows more<br />
rapid <strong>and</strong> consistent wash steps. <strong>Millipore</strong> provides both<br />
magnetic <strong>and</strong> non-magnetic kits so that you can decide<br />
which format is best for your laboratory. Our studies have<br />
shown that the two kits perform identically (see data<br />
below), so you can be assured that your magnetic bead<br />
assay results will be identical to results from nonmagnetic<br />
bead kits! To order our kits or speak to a<br />
technical service representative, call 1-866-441-8400 or<br />
visit us online at: www.millipore.com/milliplex_ordering.<br />
MFI<br />
Comparison of Human <strong>Metabolic</strong> Hormone<br />
Panels (Magnetic <strong>and</strong> Non-Magnetic Beads)<br />
Insulin<br />
100,000<br />
10,000<br />
1,000<br />
100<br />
10<br />
1<br />
10,000<br />
1,000<br />
MFI 100,000<br />
100<br />
10<br />
1<br />
1 10 100<br />
pM<br />
Magnetic<br />
Non-Magnetic<br />
1,000 10,000<br />
Comparison of Human <strong>Metabolic</strong> Hormone<br />
Panels (Magnetic <strong>and</strong> Non-Magnetic Beads)<br />
C-Peptide<br />
Magnetic<br />
Non-Magnetic<br />
ADVANTAGES OF MAGNETIC BEAD kITS<br />
• Walk-away washing<br />
• Lower <strong>and</strong> more consistent coefficients of variation (CVs)<br />
• High throughput<br />
Comparison of Human <strong>Metabolic</strong> Hormone<br />
Panels (Magnetic <strong>and</strong> Non-Magnetic Beads)<br />
• Improved performance with Insulin “sticky” samples<br />
(e.g. 100,000 samples with high nonspecific binding)<br />
10,000<br />
• Flexible – can be washed manually with filter plates<br />
MFI<br />
MFI<br />
1,000<br />
100<br />
10<br />
1<br />
10,000<br />
1,000<br />
100<br />
10<br />
1<br />
1 10 100<br />
pM<br />
1 10100 pM<br />
Magnetic<br />
Non-Magnetic<br />
1,000 10,000<br />
Comparison of Human <strong>Metabolic</strong> Hormone<br />
Panels (Magnetic <strong>and</strong> Non-Magnetic Beads)<br />
C-Peptide<br />
100,000<br />
Magnetic<br />
Non-Magnetic<br />
1,000 10,000<br />
HUMAN<br />
21
22<br />
Luminex xMAP Technology<br />
With xMAP technology, you will benefit from<br />
the ability to simultaneously quantitate up to<br />
100 analytes in a single sample, using as little<br />
as 25 µL or less.<br />
• Speed/High-Throughput: Simultaneously measure<br />
the concentration of a large number of analytes,<br />
enabling you to do more faster, gaining early <strong>and</strong><br />
comprehensive data so critical to your work.<br />
xMAP TECHNOLOGY PROCESS FLOW<br />
Bead #56, TNF-α<br />
Bead #29, IFN-γ<br />
Bead #12, IL-6<br />
1 Luminex uses proprietary techniques<br />
to internally color-code microspheres<br />
with two fluorescent dyes. Through<br />
precise concentrations of these dyes,<br />
100 distinctly colored bead sets can be<br />
created, each of which is coated with a<br />
specific capture antibody.<br />
2 After an analyte from a test sample is<br />
captured by the bead, a biotinylated<br />
detection antibody is introduced. The<br />
reaction mixture is then incubated with<br />
Streptavidin PE conjugate, the reporter<br />
molecule, to complete the reaction on<br />
the surface of each microsphere.<br />
COMPARISON OF THE xMAP & ELISA TECHNOLOGIES<br />
• Accuracy: xMAP technology generates real-time<br />
analysis <strong>and</strong> accurate quantification of biological<br />
interactions.<br />
• Reproducibility: The high-volume production of<br />
xMAP beads allows assay st<strong>and</strong>ardization that<br />
solid-phased flat arrays cannot provide.<br />
Side-by-side comparison of Multiplexing vs. ELISAs (Study of 10 different analytes in 80 test samples).<br />
xMAP Technology ELISA<br />
Number of plates required 1 10<br />
Results per plate 800 80<br />
Total sample used per panel 50 µL 4 mL<br />
Internal controls possible Yes No<br />
Dynamic Range 1-10,000 pg/mL 10-2500 pg/mL<br />
Lower limit of detection ~1 pg/mL ~1 pg/mL<br />
3 The microspheres are allowed to<br />
pass rapidly through a laser, which<br />
excites the internal dyes marking the<br />
microsphere set. A second laser excites<br />
PE, the fluorescent dye on the reporter<br />
molecule.
MILLIPLEX MAP: Everything You Need –<br />
All In One Place<br />
MILLIPLEX MAP<br />
MILLIPLEX Analyzer<br />
MILLIPLEX Analyst<br />
BioMarker Services<br />
PRODUCTS<br />
• Higher Quality – Industry-leading QC, QA <strong>and</strong> Six Sigma Principles<br />
• More Efficient – Analytically validated panels for consistency <strong>and</strong> reproducibility<br />
• All-In-One Kit – A single kit with a single catalog number<br />
• More Flexible – Select only the analytes needed or choose a pre-mixed kit<br />
• Continuity of Knowledge Is the Key – <strong>Millipore</strong> “owns” every step of the process,<br />
from R&D to manufacturing<br />
• More Choices – The broadest range of multiplex analytes for the Luminex xMAP platform<br />
INSTRUMENTS<br />
• Speed/High-Throughput – Simultaneously measure the concentration of a large number<br />
of different analytes, allowing you to do more faster, gaining early <strong>and</strong> comprehensive<br />
data so critical to your work.<br />
• Accuracy – xMAP technology generates real-time analysis <strong>and</strong> accurate quantification of<br />
the biological interactions.<br />
• Reproducibility – High-volume production of xMAP microspheres allows assay<br />
st<strong>and</strong>ardization that solid-phased flat arrays cannot provide.<br />
• Low Sample Volume – With minimal h<strong>and</strong>s-on time, you can screen more than 40<br />
analytes in a single sample using as little as 25 µL or less.<br />
SOFTWARE<br />
• The Luminex xPONENT ® software helps you manage <strong>and</strong> track all of your multiplex<br />
assays by combining ease of use <strong>and</strong> flexibility to perform both protein <strong>and</strong> nucleic acid<br />
testing on one system. It’s also compatible with the upcoming magnetic bead (MagPlex beads) assays, <strong>and</strong> will be moving forward with compatible future instrument platforms.<br />
• NEW! <strong>Millipore</strong> now offers MILLIPLEX Analyst software, developed exclusively for<br />
<strong>Millipore</strong> by VigeneTech ® . This data analysis package helps you do your best work with<br />
increased speed <strong>and</strong> efficiency. MILLIPLEX Analyst software provides a whole new level<br />
of data analysis by allowing you to import large data sets <strong>and</strong> benefit from the ability to<br />
calculate your results in seconds. The user-friendly plate setup feature lets you work<br />
with speed <strong>and</strong> efficiency while the unique algorithms on even the most challenging data<br />
sets give you the performance you need for multiplexing analysis.<br />
SERVICES<br />
• <strong>Millipore</strong>’s BMS (a part of BioPharma Services) has been performing immunoassays for<br />
over 25 years.<br />
• Assay services are available for RIAs, ELISAs, IRMAs <strong>and</strong> multiplex assays, using both<br />
<strong>Millipore</strong> kits as well as any commercially available assays.<br />
• Quality control, reproducible results, <strong>and</strong> confidentiality are of paramount importance<br />
to our BMS team.<br />
• <strong>Millipore</strong>’s Regulatory Compliant Laboratory is uniquely positioned to provide<br />
bioanalytical services to support your preclinical <strong>and</strong> clinical studies.<br />
For a complete <strong>and</strong> up-to-date list of MILLIPLEX MAP analytes, visit www.millipore.com/analytes.<br />
23
α
24<br />
ORDERING INFORMATION<br />
Description Quantity Catalogue No.<br />
adipocyte /<br />
adipokine Panels<br />
Human Serum Adipokine Panel A 96-well plate HADK1-61K-A<br />
Human Serum Adipokine Panel B 96-well plate HADK2-61K-B<br />
Human Adipocyte Panel 96-well plate HADCYT-61K<br />
Mouse Serum Adipokine Panel 96-well plate MADPK-71K<br />
Mouse Adipocyte Panel 96-well plate MADPCYT-72K<br />
Mouse Adiponectin Single Plex 96-well plate MADPK-71K-ADPN<br />
Rat Adipokine Panel 96-well plate RADPK-81K<br />
Rat Adipocyte Panel 96-well plate RADPCYT-82K<br />
Rat Adiponectin Single Plex 96-well plate RADPK-81K-ADPN<br />
Canine Adipokine Panel 96-well plate CADPK-91K<br />
Endocrine Panels Human Endocrine Panel 96-well plate HENDO-65K<br />
Gut Hormone<br />
Panels<br />
Mouse Endocrine Panel 96-well plate MENDO-75K<br />
Rat Endocrine Panel 96-well plate RENDO-85K<br />
Canine Endocrine Panel 96-well plate CENDO-95K<br />
Human IGF-1 Single Plex 96-well plate HIGF1-52K-01<br />
Rat/Mouse IGF-1 Single Plex 96-well plate RMIGF187K<br />
Human Gut Hormone Panel 96-well plate HGT-68K<br />
Mouse Gut Hormone Panel 96-well plate MGT-78K<br />
Rat Gut Hormone Panel 96-well plate RGT-88K<br />
IGF-1 Human IGF-1 Single Plex 96-well plate HIGF1-52K<br />
<strong>Metabolic</strong> <strong>Disease</strong><br />
Panels<br />
Rat/Mouse IGF-1 Single Plex 96-well plate MRIGF187K<br />
Human, Non-Magnetic Panel 96-well plate HMH-34K<br />
Human, Magnetic Panel 96-well plate HMHMAG-34K<br />
OTHER RELATED PRODUCTS<br />
• MILLIPLEX m a p Multiplex Panels<br />
- Cardiovascular <strong>Disease</strong> (CVD): Human, Mouse, Rat<br />
- Apolipoprotein: Human<br />
- Thyroid: Rat<br />
- Pituitary: Human, Rat<br />
- Stress Hormone: Rat<br />
- Coming Soon! Human Neuroendocrine<br />
(brain-derived protein) Panel.<br />
• And, more … visit: millipore.com/bmia<br />
GPCR<br />
• GPCR Receptors<br />
- GLP-1 receptor: ChemiScreen membrane preps<br />
(Cat. No. HTS0163M)<br />
- Glucagon receptors: ChemiScreen membrane preps<br />
(Cat. No. HTS112M)<br />
- Ready-to-Assay frozen cells (Cat. No. HTS112F)<br />
• GIP receptors<br />
- ChemiScreen membrane preps (Cat. No. HTS134M)<br />
- Ready-to-Assay frozen cells (Cat. No. HTS134F)<br />
• And, more … visit: www.millipore.com/gpcr<br />
antibodies<br />
• Anti-Adiponectin, clone RADI 06 (Cat. No. MAB3854)<br />
• Anti-Adiponectin, clone MADI 14 (Cat. No. MAB3832)<br />
• Anti-Adiponectin, Globular Domain Region (Cat. No. MAB3608)<br />
• Anti-Adiponectin, clone ADI773 (Cat. No. MAB3604)<br />
• Anti-Adiponectin (Cat. No. AB3267P)<br />
• Anti-IGF-1 (Cat. No. MAB1120)<br />
• Anti-IGF-1 (rabbit polyclonal (Cat. No. 07-1411))<br />
• Anti-phospho-IR/IGF1R (Tyr1158/Tyr1162/T (Cat. No. 07-841))<br />
• Anti-phospho-IR/IGF1R (Tyr1158 (Cat. No. 07-839))<br />
• Anti-phospho-IRS1 (Ser307 (Cat. No. 07-247))<br />
• Anti-Insulin Receptor (b-Subunit), clone CT-3 (Cat. No. 05-1104)<br />
• Anti-phospho-IRS1 (Ser302 mouse / Ser307 human), clone 8.1.2<br />
(Cat. No. 05-1086)<br />
• Anti-IRS1, agarose conjugate (Cat. No. 16-146)<br />
• Anti-phospho-IRS1 (Y162 (Cat. No. 09-432))<br />
• Anti-phospho-IRS1 (Ser636/Ser639 (Cat. No. 09-430))<br />
• Anti-phospho-IRS1 (Tyr941 (Cat. No. 07-848))<br />
• Anti-phospho-IRS1 (Tyr1229 (Cat. No. 07-845))<br />
• Anti-phospho-IRS1 (Tyr1179 (Cat. No. 07-844))<br />
• And, more … visit: www.millipore.com/antibodies
VigeneTech


