Through the Cycle - IBISWorld
Through the Cycle - IBISWorld
Through the Cycle - IBISWorld

Create successful ePaper yourself
Turn your PDF publications into a flip-book with our unique Google optimized e-Paper software.
C&I Lending<br />
in Challenging Times<br />
A smart lender can still find<br />
solid opportunities in C&I_p.12<br />
December 2011–January 2012<br />
Credit Risk<br />
Certified<br />
RMA’s Credit Risk<br />
Certification (CRC) is<br />
a key to training at two<br />
large banks_p.28
12<br />
Economic Environment<br />
December 2011–January 2012 The RMA Journal<br />
Hemera/THinksTock
<strong>Through</strong> <strong>the</strong> <strong>Cycle</strong> <strong>Cycle</strong><br />
by Rick buczynski<br />
How to Identify<br />
<strong>the</strong> Best C&I<br />
Lending Opportunities<br />
in Challenging Times<br />
As of this writing in early September, <strong>the</strong>re is no<br />
beacon to light a clear course through stormy economic<br />
seas. The financial markets continue to ebb<br />
and flow on <strong>the</strong> unpredictable tides of good<br />
and bad economic news. Consumer confidence<br />
remains weak and fragile. Households<br />
are tightening <strong>the</strong>ir belts and working off<br />
<strong>the</strong>ir heavy debts<br />
Keynes’s “paradox of thrift” warns us that<br />
starving this financial fever may just leave us<br />
all dead from hunger. Still, it is not bad news,<br />
just a necessary adjustment to <strong>the</strong> overleveraged<br />
spending spree that was a key factor in<br />
<strong>the</strong> euphoric run-up of household debt, a<br />
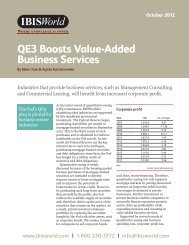
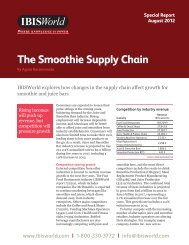
harbinger of <strong>the</strong> Great Recession (Figure 1).<br />
Business investment and private-sector<br />
job creation, both necessary catalysts for a<br />
solid, sustainable recovery, seem trapped in<br />
a maelstrom of uncertainty despite generally<br />
strong profits and a corporate America awash<br />
Markets can remain irrational longer<br />
than you can remain solvent.<br />
Figure 1<br />
$2,600<br />
$2,550<br />
$2,500<br />
$2,450<br />
$2,400<br />
$2,350<br />
$2,300<br />
John Maynard Keynes, British economist (1883-1946)<br />
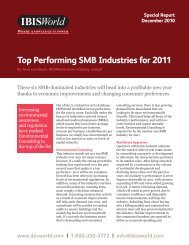
in cash. Profits have been robust, while <strong>the</strong> national<br />
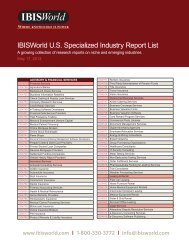
unemployment rate remains stubbornly high (Figure<br />
2). The unemployment numbers (14 million)<br />
Total Consumer Credit Outstanding:<br />
Stepping Down from (or Falling Off?)<br />
<strong>the</strong> Mountain of Debt<br />
Billions, Seasonally Adjusted<br />
$2,250<br />
2007-01 2007-07 2008-01 2008-07 2009-01 2009-07 2010-01 2010-07 2011-01 2011-06<br />
Source: Federal Reserve Board<br />
The RMA Journal December 2011–January 2012<br />
13
14<br />
Figure 2<br />
$2,000<br />
$1,900<br />
$1,800<br />
$1,700<br />
$1,600<br />
$1,500<br />
$1,400<br />
$1,300<br />
$1,200<br />
$1,100<br />
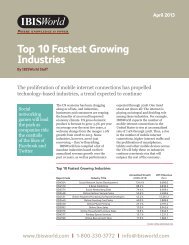
Figure 3<br />
15<br />
10<br />
5<br />
0<br />
-5<br />
-10<br />
-15<br />
Profits Rise Amid Weak Job Creation<br />
$1,000 2008 2009 2010 QI 2011 QII 2011<br />
underestimate <strong>the</strong> underemployed (8.8 million part-time<br />
workers seeking full-time work) and discouraged workers<br />
(those who have dropped out of <strong>the</strong> labor market, probably<br />
ano<strong>the</strong>r 6 or 7 million people).<br />
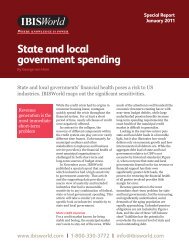
Unlike <strong>the</strong> fiscal stimulus provided by <strong>the</strong> American<br />
Recovery and Reinvestment Act of 2009 (ARRA), federal,<br />
state, and local governments are facing <strong>the</strong> prospects of<br />
unprecedented austerity as <strong>the</strong> debate to contain growth<br />
of public debt has taken center stage (Figure 3).<br />
President Obama’s recent job creation initiative is a step<br />
in <strong>the</strong> right direction, albeit a small one given <strong>the</strong> dearth<br />
of fiscal ammunition <strong>the</strong> administration needs to prime its<br />
governmental guns. To be sure, traction will clearly have<br />
to come from <strong>the</strong> private sector as U.S. policy makers have<br />
December 2011–January 2012 The RMA Journal<br />
Corp Profits (B)<br />
Unemploy (%)<br />
Sources: Bureau of Economic Analysis and Bureau of Labor Statistics<br />
Real Government Spending: Goodbye Stimulus?<br />
Seasonally Adjusted, Annualized<br />
Q1 2010 Q2 2010 Q3 2010 Q4 2010 Q1 2011 Q2 2011<br />
10<br />
Source: Bureau of Economic Analysis<br />
9<br />
8<br />
7<br />
6<br />
5<br />
Federal Defense<br />
Federal Nondefense<br />
State and Local<br />
yet to find <strong>the</strong> Holy Grail that will pull <strong>the</strong> U.S. out of <strong>the</strong><br />
malaise.<br />
Compounding jitters are problems brewing overseas,<br />
including China’s fight to control inflation and <strong>the</strong> European<br />
Union’s struggle to contain <strong>the</strong> region’s sovereign debt<br />
crisis.<br />
According to September’s National Association of Business<br />
Economists survey, GDP growth this year will be a<br />
paltry 1.7% and will <strong>the</strong>n accelerate slightly to 2.3% in<br />
2012. These forecasts are down 1% from <strong>the</strong> May survey.<br />
Unquestionably, <strong>the</strong> likelihood of a deleterious double-dip<br />
recession has increased.<br />
So… Where Do We Go from Here?<br />
An article in <strong>the</strong> December 2009-January 2010 RMA Journal 1<br />
offered some suggestions for finding solid C&I lending<br />
opportunities, which may be worth rereading since much<br />
of that analysis remains relevant. As underscored above,<br />
however, <strong>the</strong> economic landscape has changed dramatically<br />
and several of <strong>IBISWorld</strong>’s banking clients recommended<br />
that we revisit <strong>the</strong> topic.<br />
Obviously, this article can’t possibly delineate all of <strong>the</strong><br />
lending opportunities or risks. None<strong>the</strong>less, its aim is to<br />
provide some insights and, in particular, offer a methodology<br />
for seeking sensible opportunities. Our criteria will<br />
identify sectors that:<br />
• Are in <strong>the</strong> growth phase of <strong>the</strong>ir industry life cycle and<br />
are well positioned to take advantage of a sustained, if<br />
not spotty, economic rebound.<br />
• Do not present inordinate risks should a double-dip<br />
recession or shallow growth path result.<br />
• Are not excessively volatile.<br />
• Possess some attractive attributes regarding <strong>the</strong> level of<br />
competition and barriers to entry (based on <strong>the</strong> work of<br />
Anita McGahan and Michael Porter 2 ).<br />
• Are capital-intensive, implying a large borrowing<br />
capacity.<br />
• Can be potentially targeted as small business or midmarket<br />
clients.<br />
• Have strong growth potential over <strong>the</strong> next five years.<br />
Not an easy task indeed! But we believe we have a strong<br />
algorithm that takes advantage of <strong>the</strong> winds of change to<br />
clear <strong>the</strong> fog.<br />
What Can We Learn from History and <strong>the</strong> Recent <strong>Cycle</strong>?<br />
Although each cycle has its own unique characteristics, a<br />
long-term analysis of past economic recoveries reveals a<br />
concrete starting point.<br />
Using real value-added 3 data at <strong>the</strong> two-digit NAICS<br />
(North American Industry Classification System) level<br />
from <strong>the</strong> Bureau of Economic Analysis and <strong>the</strong> timing<br />
of recession troughs as defined by <strong>the</strong> National Bureau<br />
of Economic Research, <strong>IBISWorld</strong> examined <strong>the</strong> last 10
ecoveries going back to 1950 (Great Recession data was<br />
excluded). The research measured sectoral growth and its<br />
volatility versus that of GDP. Table 1 combines this data<br />
with figures from <strong>the</strong> 2008–09 recession and 2010, <strong>the</strong><br />
year of recovery.<br />
Table 1<br />
Industry Sector<br />
Gross domestic<br />
product (GDP)<br />
Agriculture, forestry,<br />
fishing & hunting<br />
Value Added by Industry (Average Annual Growth, % Change)<br />
Great<br />
Recession<br />
Growth<br />
Recovery<br />
Year 2010<br />
Average of<br />
Previous<br />
Recoveries<br />
Difference<br />
2010 and<br />
Previous<br />
-2.6% 2.9% 5.0% -2.1%<br />
Historical<br />
Volatility<br />
Index<br />
14.4% 0.9% 1.8% -0.9% Very High<br />
Mining 24.0% 3.0% 1.5% 1.5% High<br />
Utilities -3.0% 1.3% 4.3% -3.0% Medium<br />
Construction -21.3% -3.7% 3.1% -6.8% High<br />
Manufacturing -13.5% 5.8% 7.8% -2.0% Medium-High<br />
Wholesale trade 2.7% 4.2% 7.2% -3.0% Medium-High<br />
Retail trade -8.9% 5.2% 6.3% -1.1% Medium<br />
Transportation &<br />
warehousing<br />
-12.2% 1.8% 5.9% -4.1% Medium-High<br />
Information 1.6% 4.9% 5.2% -0.3% Low<br />
Finance and insurance 2.2% 3.2% 2.4% 0.8% Medium<br />
Real estate & rental<br />
and leasing<br />
Professional, scientific<br />
& technical services<br />
Administrative &<br />
waste mgmt services<br />
0.7% 0.7% 4.7% -4.0% Medium<br />
0.8% 2.3% 3.9% -1.6% Medium<br />
-10.4% 5.4% 5.1% 0.3% Medium<br />
Educational services 0.3% 0.2% 3.1% -2.9% Medium<br />
Health care &<br />
social assistance<br />
Arts, entertainment<br />
& recreation<br />
Accommodation<br />
& food services<br />
O<strong>the</strong>r services,<br />
except government<br />
5.8% 2.8% 4.7% -1.9% Low<br />
-9.4% 5.4% 5.0% 0.4% Medium<br />
-14.6% 3.2% 5.0% -1.8% Medium<br />
-11.6% 1.5% 2.4% -0.9% Medium<br />
Sources: Chain-Type Quantity Indexes for Value Added by Industry, Bureau of Economic Analysis; <strong>IBISWorld</strong><br />
Notes: Great Recession growth was cumulative over <strong>the</strong> 2008–09 period. The column “Difference 2010 and Previous” is <strong>the</strong> “Recovery<br />
Year 2010” column minus <strong>the</strong> “Average of Previous Recoveries” column. Historical volatility is measured using standard deviations<br />
of <strong>the</strong> value-added data in recovery years. It was built using standard deviations of <strong>the</strong> economic recovery years since 1950.<br />
Below is a selected summary of Table 1. The next section<br />
drills down to a more granular five-digit level.<br />
• Agriculture and mining: We decided to group <strong>the</strong>se toge<strong>the</strong>r<br />
since commodity prices can be highly correlated<br />
(see our July–August 2011 Journal article on oil prices 4 ).<br />
These highly volatile industries expanded rapidly during<br />
<strong>the</strong> Great Recession, riding <strong>the</strong> wave of buoyant prices<br />
bucking historical trends, until <strong>the</strong> “destructive demand”<br />
factor kicked in. To quote our July piece: “Higher (commodity)<br />
prices undermine demand in a weakened economy,<br />
trimming <strong>the</strong> sails of hyped-up energy (commodity)<br />
prices.” There are none<strong>the</strong>less a myriad of lending opportunities<br />
that we’ll address.<br />
• Utilities: This relatively low-risk, low-variance sector<br />
seems to run in tandem with general economic performance.<br />
It does not lead or lag.<br />
• Construction: This sector is, in a word, horrible. Residential<br />
housing remains in <strong>the</strong> doldrums and <strong>the</strong> commercial<br />
real estate<br />
market is weak. Public<br />
works spending,<br />
<strong>the</strong> centerpiece of <strong>the</strong><br />
ARRA, seems doubtful<br />
in <strong>the</strong> near future<br />
given <strong>the</strong> burden of<br />
government debt.<br />
• Manufacturing: This<br />
sector typically out-<br />
Higher (commodity)<br />
prices undermine<br />
demand in a weakened<br />
economy, trimming <strong>the</strong><br />
sails of hyped-up energy<br />
(commodity) prices.<br />
performs o<strong>the</strong>r industry segments in recovery years and<br />
2010 was no exception, growing 5.8% compared with a<br />
2.9% climb in GDP. Durable goods production was up<br />
nearly 10%.<br />
• Trade: Historically, both wholesale and retail trade rebound<br />
sharply during recoveries. However, <strong>the</strong>re are<br />
many caveats on <strong>the</strong> retail side given broad, powerful<br />
structural changes. Inroads made by warehouse clubs<br />
and super-centers, toge<strong>the</strong>r with consumers’ growing<br />
preference for buying online, have cut so deeply into<br />
traditional retail shopping that many of <strong>the</strong>se retailers,<br />
sturdy 10 to 15 years ago, are barely surviving today.<br />
• Transportation and warehousing: This highly procyclical<br />
sector tracks GDP very closely and is <strong>the</strong>refore vulnerable<br />
to downside risks. In fact, this group declined a<br />
whopping 12.2% during 2008–09. Air transportation fell<br />
12.5% during <strong>the</strong> two-year recessionary period, while<br />
rail went off <strong>the</strong> tracks even far<strong>the</strong>r, dropping more than<br />
16%. Warehousing and storage fell “only” 6.6%, possibly<br />
on <strong>the</strong> need to find space for unsold inventories.<br />
• Information: This industry has been dominated by rapid<br />
structural and technological change. It’s populated by<br />
industries in <strong>the</strong> growth phase of <strong>the</strong>ir life cycles (software<br />
publishing) as well as those in serious declines (audio<br />
production studios). Hence, <strong>the</strong> analysis of aggregates<br />
simply dilutes <strong>the</strong> granular realities. The following section<br />
will help identify some key sweet spots.<br />
• Finance and insurance: This sector is a laggard during economic<br />
recoveries. Although it actually expanded slightly<br />
during <strong>the</strong> recession, if we do <strong>the</strong> math for <strong>the</strong> 2007–09<br />
period <strong>the</strong> group as a whole contracted. Hit especially<br />
hard were investment banks and related entities (NAICS<br />
523)—think Lehman Bro<strong>the</strong>rs and WaMu—which contracted<br />
more than 30% in <strong>the</strong> three-year time frame.<br />
• Professional, scientific, and technical services: This segment<br />
held up well during <strong>the</strong> recession, but experienced a<br />
tepid upturn in 2010. None<strong>the</strong>less, we think <strong>the</strong>re are<br />
positive points of interest, as will be articulated below.<br />
• Administrative and waste management services: This sector<br />
The RMA Journal December 2011–January 2012 15
16<br />
contracted more than 10% during <strong>the</strong> recession, but seems<br />
to be on <strong>the</strong> uptick. Garbage in, garbage out, so this group<br />
emerges from recessions without much volatility.<br />
• Educational and health care services: These services tend to<br />
be stable historically. However, government budget constraints,<br />
toge<strong>the</strong>r with <strong>the</strong> cautious discretionary spending<br />
patterns of households, are complicating attempts to rank<br />
lending opportunities in <strong>the</strong>se important areas.<br />
• Arts, entertainment, and recreation and Accommodation and<br />
food services: These two industry sectors mirror GDP performance<br />
in recovery years, which doesn’t augur well in an<br />
iffy economic climate. They declined precipitously during<br />
<strong>the</strong> Great Recession (9.4% and 14.6%, respectively).<br />
Some Selected Opportunities<br />
Agriculture and Forestry<br />
Many banks have a long history of lending successfully to<br />
this sector despite its volatility. Some notable areas going<br />
forward are shown in Table 2.<br />
Table 2<br />
Industry<br />
(5-Digit NAICS)<br />
Agriculture a Safe Bet, with Some Strong Lending Opportunities<br />
Revenue 2011 MM$<br />
5-Year Average<br />
Growth 2011-15<br />
Soybean, oilseed, and corn farming may continue to benefit<br />
from government policies to support renewable energy<br />
sources. However, an article on alternative energy in <strong>the</strong><br />
September 2011 Journal 5 pointed out that biofuels are not<br />
cost effective without government support. None<strong>the</strong>less,<br />
economic recovery will buttress farm prices. As for soybeans<br />
and corn, depleted stocks suggest firm prices through 2012,<br />
which could spill over to o<strong>the</strong>r basic commodities.<br />
Generally, high capital requirements indicate a strong<br />
capacity to borrow fur<strong>the</strong>r, enhancing <strong>the</strong> allure of this<br />
sector. Riding <strong>the</strong> wave of <strong>the</strong> trend to outsource, excellent<br />
opportunities can be found in agriculture and forestry<br />
support services in this capital-hungry group.<br />
Energy and Utilities<br />
An article in <strong>the</strong> July–August 2011 Journal 6 addressed opportunities<br />
and risks associated with exposure to <strong>the</strong> natural<br />
December 2011–January 2012 The RMA Journal<br />
Capital Intensity<br />
Dairy farms 33,500 2.3% High<br />
Forest support services 2,230 3.6% Medium<br />
Soybean farming 29,789 1.1% High<br />
Oilseed farming 867 3.9% High<br />
Corn farming 72,063 3.4% High<br />
Cotton farming 11,453 1.3% High<br />
Chicken & turkey<br />
meat production<br />
27,940 1.5% High<br />
Crop services 13,671 3.3% High<br />
Livestock production<br />
support<br />
4,821 2.6% Medium<br />
Timber services 1,043 2.9% High<br />
Source: <strong>IBISWorld</strong>, Inc.<br />
gas supply chain. One bright area singled out was smallscale<br />
gas exploration and production, where lending would<br />
range between $5 million and $50 million.<br />
To be sure, care must be taken when accessing plans in<br />
this arena. As <strong>the</strong> September Journal article points out, <strong>the</strong>re<br />
is a clear disparity between firms that generate alternative<br />
energy and those that manufacture equipment. One case in<br />
point is solar power providers, an emerging industry that<br />
made our short list in Table 3. In contrast, solar panel<br />
producers face adverse competition from low-cost producers<br />
overseas, such as China. The recent bankruptcy of<br />
government-supported solar panel manufacturer Solyndra<br />
underscores this risk.<br />
Table 3<br />
Industry<br />
(5-Digit NAICS)<br />
Energy and Utilities: Strong Growth and Borrowing Appetite<br />
Revenue 2011 MM$<br />
5-Year Average<br />
Growth 2011-15<br />
Capital Intensity<br />
Solar power 79 7.9% High<br />
Water supply<br />
& irrigation<br />
Sewage treatment<br />
facilities<br />
59,995 3.5% High<br />
41,587 1.8% High<br />
Source: <strong>IBISWorld</strong>, Inc.<br />
Construction<br />
Despite record-low interest rates, housing remains in <strong>the</strong><br />
doldrums and commercial real estate is a nonstarter at this<br />
juncture. As analyzed in a July 2011 <strong>IBISWorld</strong> special<br />
report, 7 public works projects are likely to experience heavy<br />
cuts as <strong>the</strong> government retreats from <strong>the</strong> free-spending days<br />
of <strong>the</strong> ARRA.<br />
For <strong>the</strong> longer term, we are more bullish on <strong>the</strong> residential<br />
side. Household formation, a leading driver of growth,<br />
is still robust. When <strong>the</strong> U.S. finally achieves sustained<br />
GDP growth and job creation, home builders and hired<br />
contractors will benefit, and <strong>the</strong>re is a grand upside here as<br />
housing starts have been at dreadfully low levels for more<br />
than four years. The $64,000 question is when a revival<br />
will take place (Table 4).<br />
Table 4<br />
Industry<br />
(5-Digit NAICS)<br />
Construction’s Bright Spots<br />
Revenue 2011 MM$<br />
5-Year Average<br />
Growth 2011-15<br />
Capital Intensity<br />
Water well drilling 4,704 4.2% Medium<br />
Oil & gas pipeline<br />
construction<br />
Road & highway<br />
maintenance<br />
38,880 5.0% Medium<br />
46,000 3.0% Medium<br />
Excavators 25,475 5.3% Medium<br />
Demolition & wrecking 4,478 4.9% Medium<br />
Source: <strong>IBISWorld</strong>, Inc.<br />
Manufacturing<br />
There are some gold nuggets in manufacturing and, hopefully,<br />
we hit some highlights in our December 2009 article,
particularly in <strong>the</strong> areas of biotechnology and nanomaterials.<br />
A distilled version of our current research is found in<br />
Table 5.<br />
We are cautiously optimistic for <strong>the</strong> mature auto industry<br />
given restructuring and pent-up demand. By August 2011,<br />
car sales were up 9.3% from a year earlier, spurred by a<br />
15.5% jump in purchases of small vehicles. Growth for light<br />
trucks was in double digits as well. GM, Ford, and Chrysler<br />
all gained market share, mainly at <strong>the</strong> expense of Toyota<br />
and Honda. Despite <strong>the</strong> “cash for clunkers” tax break, <strong>the</strong><br />
average age of cars on <strong>the</strong> road peaked in 2010 at 8.8 years.<br />
So as Americans retire <strong>the</strong>ir personal vehicles and replace<br />
<strong>the</strong>ir business fleets, mostly with small cars and light trucks,<br />
many banks’ vehicle financing portfolios will put <strong>the</strong> pedal<br />
to <strong>the</strong> metal and enjoy some fast growth!<br />
Table 5<br />
Industry<br />
(5-Digit NAICS)<br />
American Manufacturing Still Has Some Life in Its Legs<br />
Revenue 2011 MM$<br />
5-Year Average<br />
Growth 2011-15<br />
Capital Intensity<br />
Biotechnology 92,396 9.6% Medium<br />
Mining, oil & gas<br />
machinery manufacturing<br />
Medical instrument &<br />
supply manufacturing<br />
19,588 4.9% Medium<br />
100,802 4.4% Medium<br />
Tortilla production 3,031 3.6% Medium<br />
Wineries 15,920 5.2% Medium<br />
Vitamin & supplement<br />
manufacturing<br />
Automobile engine &<br />
parts manufacturing<br />
27,855 4.5% High<br />
25,413 3.4% High<br />
Distilleries 6,937 4.1% High<br />
Generic pharmaceutical<br />
manufacturing<br />
Medical device<br />
manufacturing<br />
Wire & cable<br />
manufacturing<br />
48,844 7.3% High<br />
60,243 6.4% Medium<br />
17,827 5.8% Medium<br />
Source: <strong>IBISWorld</strong>, Inc.<br />
The Information Sector<br />
What a morass! This broad sector is so diverse and is becoming<br />
so integrated with o<strong>the</strong>r business lines that <strong>the</strong> lines of<br />
NAICS definitions are blurring. Never<strong>the</strong>less, <strong>the</strong> sector’s<br />
divergent prospects merit some attention.<br />
Obviously, this sector is riding <strong>the</strong> roller coaster of <strong>the</strong><br />
digital revolution. Traditional publishing is in decay, content<br />
industries are seeking new distribution channels, and<br />
technologically advanced companies are looking to fur<strong>the</strong>r<br />
leverage <strong>the</strong>ir infrastructure to maximize returns. While<br />
print media get taken for a ride, information ga<strong>the</strong>rers are<br />
finding o<strong>the</strong>r thrill-ride channels. Table 6 lists a selection<br />
of <strong>the</strong> few promising potential growth segments presenting<br />
low risk.<br />
Business Services<br />
The professional and business services sector usually plods<br />
Table 6<br />
Industry<br />
(5-Digit NAICS)<br />
Information’s Sweet Spots<br />
Revenue 2011 MM$<br />
5-Year Average<br />
Growth 2011-15<br />
Capital Intensity<br />
Software publishing 156,317 2.5% Low<br />
Database, storage<br />
& backup software<br />
publishing<br />
Business analytics &<br />
enterprise software<br />
publishing<br />
23,917 4.3% Low<br />
23,917 5.4% Low<br />
Cable networks 16,742 3.0% Low<br />
Cable, Internet &<br />
telephone providers<br />
Wireless telecommunications<br />
carriers<br />
133,359 6.4% Medium<br />
204,437 3.2% High<br />
News syndicates 2,535 2.2% Medium<br />
Internet service providers 43,100 6.0% High<br />
Voice over Internet<br />
protocol<br />
14,116 17.4% High<br />
Search engines 24,485 3.8% Medium<br />
Internet publishing<br />
& broadcasting<br />
along with relatively slow but stable growth. Many industries<br />
in this group are relatively secure and should do nicely<br />
even in a gradual recovery. Business outsourcing, as noted<br />
in our December 2009 RMA Journal article, will support<br />
traditional opportunities including:<br />
• Law firms.<br />
• Accounting, tax, bookkeeping, and payroll services.<br />
• Engineering services.<br />
• Scientific research and development.<br />
• Debt collection agencies.<br />
• Security, burglar, and fire alarm services.<br />
Ano<strong>the</strong>r group of niche industries, listed in Table 7, is<br />
poised in a growth mode and providing safe, solid returns.<br />
Table 7<br />
Industry<br />
(5-Digit NAICS)<br />
Laboratory testing<br />
services<br />
38,694 6.8% High<br />
Business and Administrative Services on <strong>the</strong> Rise<br />
Revenue 2011 MM$<br />
5-Year Average<br />
Growth 2011-15<br />
Source: <strong>IBISWorld</strong>, Inc.<br />
Capital Intensity<br />
16,277 5.2% Medium<br />
Environmental consulting 19,084 9.4% Low<br />
Scientific & economic<br />
consulting<br />
23,693 3.8% Low<br />
Veterinary services 29,317 3.8% Low<br />
Human resources &<br />
benefits administration<br />
56,467 4.2% Low<br />
Correctional facilities 36,242 7.5% Low<br />
Credit bureaus &<br />
rating agencies<br />
9,159 7.8% Medium<br />
Pest control 10,568 5.6% Low<br />
Landscaping services 59,205 3.7% Low<br />
Packaging &<br />
labeling services<br />
8,395 5.1% Medium<br />
Recycling facilities 4,598 7.7% High<br />
Source: <strong>IBISWorld</strong>, Inc.<br />
The RMA Journal December 2011–January 2012 17
18<br />
Education<br />
We are very cold and introspective on education at <strong>the</strong> moment.<br />
According to <strong>IBISWorld</strong>’s July special report, budget<br />
pressures threaten public schools, <strong>the</strong> testing and educational<br />
support services, colleges and universities, and a whole host<br />
of o<strong>the</strong>r education-related industries. On <strong>the</strong> o<strong>the</strong>r hand, one<br />
area that we are relatively sanguine on is trade and technical<br />
schools, which tend to be countercyclical.<br />
Be alert, though, because <strong>the</strong> risk of lending to <strong>the</strong> once<br />
high-flying for-profit universities is expected to escalate (for<br />
more on this, see <strong>the</strong> <strong>IBISWorld</strong> article on for-profit universities<br />
in <strong>the</strong> November 2011 RMA Journal 8 ). This industry has<br />
seen its reputation suffer as a result of controversial practices<br />
that accompanied its recent surge in growth.<br />
For-profit universities, also called proprietary colleges,<br />
have a unique place in <strong>the</strong> education world. Unlike traditional<br />
public and private institutions, <strong>the</strong>se schools are<br />
publicly traded. By investing a huge proportion of dollars<br />
into marketing, for-profit universities have attained massive<br />
enrollment rates. On <strong>the</strong> basis of revenue and enrollment<br />
numbers alone, <strong>the</strong> steady growth of <strong>the</strong>se universities<br />
makes <strong>the</strong> industry enticing for lenders. However, even<br />
though <strong>the</strong>ir growth status allows <strong>the</strong>m to rise above nonprofit<br />
schools in terms of profit and revenue, for-profit universities<br />
are coming under increased government regulation.<br />
So beware.<br />
Health Care<br />
Though typically considered a low-risk industry characterized<br />
by low unemployment and smooth growth, health care<br />
finds itself in <strong>the</strong> murky waters of low returns. Several factors<br />
present challenges, notably <strong>the</strong> relentlessly rising costs<br />
and lingering doubts over <strong>the</strong> course and effectiveness of<br />
<strong>the</strong> Obama administration’s health care initiatives.<br />
The jury is still out on how health care reform will affect<br />
Medicare and Medicaid. In <strong>the</strong> August 2011 issue of<br />
Commercial Insights, 9 <strong>IBISWorld</strong> colleague Sophia Snyder<br />
identified <strong>the</strong> top 10 health care industries that garner <strong>the</strong><br />
highest share of revenue from private insurance companies.<br />
Lending to <strong>the</strong>se industries is a definite hedge against uncertainties<br />
in funding Medicare and Medicaid:<br />
“… <strong>the</strong> Department of Health and Human Services<br />
December 2011–January 2012 The RMA Journal<br />
(HHS) released health insurance exchange rules that<br />
will govern how states set up and run marketplaces<br />
where individuals and small businesses can shop for<br />
health insurance coverage. This new framework will<br />
impact several industries that derive a significant percentage<br />
of revenue from private insurance coverage.<br />
In <strong>the</strong> next five years, <strong>IBISWorld</strong> forecasts <strong>the</strong> top 10<br />
industries to see additional growth in revenue and<br />
operating profit as a result of <strong>the</strong> new rules…” (see<br />
Table 8).<br />
Table 8<br />
Health Care Revenues<br />
Health Care Industry Revenue % from Private Insurance<br />
Specialist doctors 55.5%<br />
Primary care doctors 55.0%<br />
Podiatrists 51.5%<br />
Dentists 45.0%<br />
Diagnostic and medical laboratories 43.5%<br />
Pharmacies and drug stores 42.0%<br />
Ambulance services 40.0%<br />
Emergency and o<strong>the</strong>r outpatient care centers 37.5%<br />
Hospitals 34.5%<br />
Mental health and substance abuse centers 25.0%<br />
Source: <strong>IBISWorld</strong>, Inc.<br />
Despite <strong>the</strong> changing face of traditional health-carerelated<br />
businesses, however, risks remain low. After all, no<br />
pain, no gain. Some of <strong>the</strong> juiciest areas are found in Table 9.<br />
Table 9<br />
Industry<br />
(5-Digit NAICS)<br />
Growth Areas in Health Care<br />
Revenue 2011 MM$<br />
5-Year Average<br />
Growth 2011-15<br />
Capital Intensity<br />
Dentists 109,494 3.5% Medium<br />
Optometrists 13,140 2.3% Low<br />
Physical <strong>the</strong>rapists 27,401 6.9% Low<br />
Podiatrists 4,637 3.6% Low<br />
Alternative health<br />
care providers<br />
Mental health &<br />
substance abuse clinics<br />
Emergency & o<strong>the</strong>r<br />
outpatient care centers<br />
Diagnostic & medical<br />
laboratories<br />
11,595 4.3% Low<br />
11,810 3.7% Low<br />
86,660 5.0% Medium<br />
46,759 4.2% Medium<br />
Ambulance services 13,934 5.4% Low<br />
Blood, organ & ambulatory<br />
health services<br />
10,545 7.0% Low<br />
Hospitals 756,952 4.1% Medium<br />
Specialty hospitals 36,193 5.8% Low<br />
Mental retardation<br />
facilities<br />
Mental health &<br />
substance abuse centers<br />
Elderly & disabled<br />
services<br />
20,842 3.0% Low<br />
9,408 2.6% Low<br />
28,137 6.2% Low<br />
Source: <strong>IBISWorld</strong>, Inc.
For more on this industry, see <strong>the</strong> additional articles<br />
on ambulatory care, senior care facilities, and hot start-up<br />
industries. 10<br />
Miscellaneous Opportunities<br />
Finally, Table 10 presents a hodgepodge of o<strong>the</strong>r promising<br />
industries to be targeted.<br />
Table 10<br />
Industry<br />
(5-Digit NAICS)<br />
Revenue 2011 MM$<br />
O<strong>the</strong>r Smart Picks<br />
5-Year Average<br />
Growth 2011-15<br />
Capital Intensity<br />
Mining services 88,160 4.8% High<br />
Stone mining 13,006 3.6% High<br />
Sand & gravel mining 7,002 4.1% High<br />
Mineral & phosphate<br />
mining<br />
E-commerce &<br />
online auctions<br />
Credit card processing<br />
& money transferring<br />
4,888 1.9% High<br />
186,384 9.4% Medium<br />
43,689 4.3% Medium<br />
Public transportation 38,077 2.3% High<br />
Source: <strong>IBISWorld</strong>, Inc.<br />
Conclusion: It’s <strong>the</strong> Best and <strong>the</strong> Worst of Times<br />
When Charles Dickens wrote A Tale of Two Cities in 1859,<br />
his 60-year perspective on <strong>the</strong> French Revolution allowed<br />
him to see both <strong>the</strong> good and <strong>the</strong> bad in that historical event.<br />
Eighty years removed from <strong>the</strong> Great Depression and two<br />
years after <strong>the</strong> Great Recession, we have drawn on <strong>the</strong> records<br />
of those difficult times to find some potential bright spots<br />
in <strong>the</strong> current downward adjustment to economic growth.<br />
Most of us thought we would be on a steady, albeit slow,<br />
recovery path by now. The first-half stall in growth is disconcerting,<br />
but corporate profits remain reasonably healthy and<br />
<strong>the</strong>re is plenty of cash in <strong>the</strong> system. Instability in Europe<br />
is a mild contagion, but it’s not a pandemic.<br />
To be blunt, it’s up to all of us in <strong>the</strong> private sector to<br />
lead <strong>the</strong> way, starting with smart lending. This article has<br />
identified roughly 80 industries here worthy of lender<br />
investigation, evaluation, and underwriting. Maybe we<br />
can learn from economic history and back some winners<br />
in this 80-horse recessionary race. v<br />
••<br />
Rick Buczynski, Ph.D., is a senior vice president and chief economist at <strong>IBISWorld</strong>. He<br />
thanks Dev Strischek of SunTrust Banks, Inc. for his continuing support and guidance.<br />
<strong>IBISWorld</strong> papers are available from Rick by request. He can be reached at rickb@<br />
ibisworld.com.<br />
Notes<br />
1. Rick Buczynski, “Where Do We Go from Here?” The RMA Journal,<br />
December 2009–January 2010.<br />
2. Anita McGahan and Michael Porter, “How Much Does Industry<br />
Matter, Really?” Strategic Management Journal 18 (1997).<br />
3. Industry value added is also called industry gross product. In<br />
short, it describes <strong>the</strong> market value of goods and services produced<br />
by an industry minus <strong>the</strong> cost of goods and services used by <strong>the</strong><br />
industry in <strong>the</strong> production process.<br />
4. Rick Buczynski and Justin Molavi, “$150 Oil? What Would This<br />
Mean for Your Bank?” The RMA Journal, July-August 2011.<br />
5. Justin Molavi and Deborah Stampli, “Alternative Energy: Government<br />
Incentives Ignite Growth,” The RMA Journal, September<br />
2011.<br />
6. Justin Molavi and Rick Buczynski, “The U.S. Is Stepping on <strong>the</strong><br />
Gas: Lending Opportunities in Natural Gas and Related Industries,”<br />
The RMA Journal, July–August 2011.<br />
7. <strong>IBISWorld</strong> Research Staff, “Top 25 Industries Negatively Affected<br />
by Federal Spending Cuts,” <strong>IBISWorld</strong> Special Report, July 2011.<br />
8. Kevin Culbert and Deborah Stampli, “The Risky Business of For-<br />
Profit Universities,” The RMA Journal, November 2011.<br />
9. Sophia Snyder, “Top 10 Industries to Benefit from Health Insurance<br />
Exchange Rules,” Commercial Insights, American Bankers Association,<br />
August 2011.<br />
10. Sophia Snyder and Deborah Stampli, “Ambulatory Care Offers<br />
Significant Opportunities for Lenders,” The RMA Journal, June 2011;<br />
Mary Jo Taylor, “Lending to Senior Care Facilities,” The RMA Journal,<br />
October 2011; and <strong>IBISWorld</strong> Research Staff, “5 Hot Start-Up Sectors,”<br />
<strong>IBISWorld</strong> Special Report, September 2011.<br />
For additional information, consider <strong>the</strong> RMA course<br />
Analyzing <strong>the</strong> Commercial Borrower’s Industry, Market,<br />
and Competitive Risk.<br />
The RMA Journal December 2011–January 2012<br />
19