Problem Areas Credit Risk - IBISWorld
Problem Areas Credit Risk - IBISWorld
Problem Areas Credit Risk - IBISWorld

You also want an ePaper? Increase the reach of your titles
YUMPU automatically turns print PDFs into web optimized ePapers that Google loves.
Economic Environment<br />
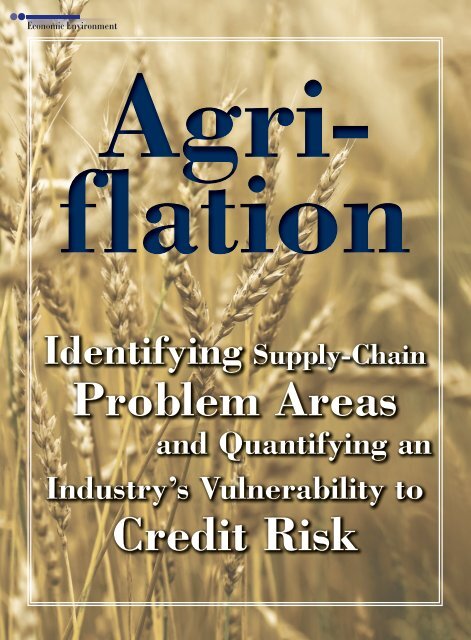
Agriflation<br />
Identifying Supply-Chain<br />
<strong>Problem</strong> <strong>Areas</strong><br />
and Quantifying an<br />
Industry’s Vulnerability to<br />
<strong>Credit</strong> <strong>Risk</strong>
Rising prices for food commodities have ripple effects<br />
on industries downstream. Lenders can evaluate how rising<br />
prices affect certain industries and the resulting impact on a<br />
firm’s credit risk.<br />
b y Gav i n Sm i t h<br />
Th e f i r s t a rt i c l e in this series, which appeared in the September<br />
issue, focused on the sharp increase in the price<br />
of agricultural goods and sought to distinguish the shortterm<br />
factors that have pushed up prices from longer-term<br />
fundamentals. A key underpinning of this series is that<br />
price increases in one industry have ripple effects through<br />
an economic supply chain—with an associated increase<br />
in credit risk.<br />
Monitoring and measuring the risk faced by companies<br />
along a supply chain is essential to sound bank-lending<br />
practices. Not all industries, or companies, are created<br />
equal and risk is rarely spread evenly. Separating the good<br />
risks from the bad risks is a significant challenge.<br />
Understanding industry fundamentals and their inherent<br />
strengths and weaknesses will offer some indication of<br />
the robustness of companies that face a supply-chain price<br />
rise. In this article, we create two simple agribusiness supply<br />
chains that show the interconnectedness of industries<br />
(and thus the means by which risk is spread) and highlight<br />
the factors that can increase or mitigate credit risks.<br />
The first article pinpointed corn, soybean, and wheat<br />
farming as major areas of interest, given that the supply<br />
chain from these three industries involves many agricultural<br />
producers, foodstuff manufacturers and processors,<br />
wholesalers and storage providers, as well as retailers.<br />
This article will focus on price increases in the corn, soybean,<br />
and wheat farming industries and the ability of industries<br />
in the animal production and food production<br />
supply chains to weather a supply-chain price shock. We<br />
will highlight industry characteristics that help determine<br />
the typical company’s vulnerability to sharply rising input<br />
prices and offer benchmarks that lenders can use to<br />
quantify the relative risk level faced by the sector and the<br />
companies that operate in it.<br />
The Supply Chain<br />
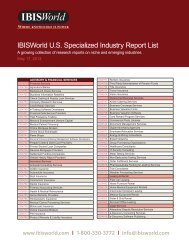
Figures 1 and 2 each show eight key industries located<br />
downstream of the corn, soybean, and wheat farming industries.<br />
Figure 1 shows the animal production supply<br />
chain. Figure 2 shows the food production supply chain.<br />
These 16 industries rely on the goods sold by crop farmers<br />
and therefore are susceptible to the recent rise in agricultural<br />
input prices.<br />
Purchase costs for animal production industries along<br />
the crop-growing supply chain total $114.7 billion. Average<br />
profitability along the chain is around 12.6% of<br />
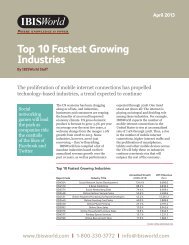
industry revenue. The value of the food production supply<br />
chain is greater at $220.3 billion. Purchases from in-<br />
Figure 1<br />
Agriculture and Animal Production Supply Chain<br />
Corn,<br />
Soybean<br />
& Wheat<br />
Farming<br />
Animal Products— Downstream Demand Turkey Production 44.0%<br />
Material Purchase Costs (% of revenue) Animal Food Production 61.0%<br />
Beef Cattle Production 48.8% Egg & Poultry Wholesale 83.0%<br />
Milk Production & Dairy Cattle 51.9% Beef & Pork Wholesale 83.6%<br />
Hog & Pig Farming 50.0% Total Purchase Costs $114.7bn<br />
Chicken Production 52.2% Average Profit Margin 12.6%<br />
Source: IBISWORLD, INC.<br />
The RMA Journal October 2008 43
Figure 2<br />
Agriculture and Food Production Supply Chain<br />
Corn,<br />
Soybean<br />
& Wheat<br />
Farming<br />
Food Products— Downstream Demand Cookie, Cracker & Pasta Production 40.4%<br />
Material Purchase Costs (% of revenue) Tortilla Production 43.8%<br />
Flour Milling 73.0% Syrup & Flavoring Production 27.7%<br />
Margarine & Cooking Oil Processing 70.2% Corn, Wheat & Soybean Wholesaling 89.3%<br />
Cereal Production 32.4%% Total Purchase Costs $220.3bn<br />
Bread Production 36.1% Average Profit Margin 20.4%<br />
Source: IBISWORLD, INC.<br />
dustries in this chain include a wider array of goods and<br />
services from sources other than primary producers, although<br />
this trend is not uniform. At an average of 20.4%<br />
of total industry revenue, the average profit margin of the<br />
food production industries is greater than that of the animal<br />
production chain.<br />
Evaluating and Measuring Industry Vulnerability<br />
Below is a summary of criteria used to evaluate and measure<br />
an industry’s vulnerability to a supply-chain price<br />
shock. The checklists contained in Tables 1 and 2 establish<br />
industry benchmarks used to judge the robustness of<br />
an industry’s typical company. Key factors a lender must<br />
consider are:<br />
• Purchase costs as a proportion of total revenue. This<br />
quantifies the average company’s overall exposure to<br />
input price shocks further up the supply chain. The<br />
bargaining dynamics of the supply chain can complicate<br />
matters. For instance, a bulk buyer or one with<br />
long-term supply contracts will secure a better price<br />
than a smaller company that purchases sporadically.<br />
Moreover, a company with an alternative supply source<br />
(or an alternative input), including the ability to import<br />
goods, will be able to strike a better deal to reduce risks<br />
associated with higher input prices.<br />
• Average industry profitability. This indicates the size<br />
of the average firm’s short-term financial buffer against<br />
higher variable costs. The buffer gives operators a<br />
chance to absorb input price rises by running down<br />
profit to avoid passing on costs to consumers (and<br />
risk losing market share) or failing to meet loan repayments.<br />
• Economic life-cycle stage. This is a qualitative and<br />
quantitative assessment of an industry’s markets, products,<br />
technology adoption, and revenue growth. A company<br />
that operates in a growth industry may be willing<br />
to accept higher short-term prices to stay in business<br />
in the hope of future profits. Industries in the decline<br />
phase provide an operator with fewer alternative business<br />
strategies and therefore have increased credit risk.<br />
• Average size of an industry player. This can be used to<br />
benchmark a company’s bargaining power in the supply<br />
chain and its ability to exploit economies of scale.<br />
• <strong>IBISWorld</strong> Industry Health Index. This score (described<br />
in the first article) measures the impact of external<br />
variables on an industry, thereby putting operators<br />
in a real-world context.<br />
Agriculture and the Animal Production Chain<br />
The price-shock vulnerability checklist (Table 1) shows<br />
that a number of industries are susceptible to supply-chain<br />
price increases. Of clear concern are industries in the decline<br />
stage of their life cycles. Decline is characterized by<br />
falling or static per capita consumption of the good or service<br />
the industry produces. As such, an operator’s decision<br />
to pass on a price increase to consumers will likely hasten<br />
the buyer’s move away from the good. Moreover, decline<br />
is characterized by only cosmetic industry-technology<br />
change, meaning companies are unlikely to develop new<br />
production processes that could increase productivity and<br />
mitigate the full impact of rising input prices.<br />
Of the industries in the decline stage of their life cycles,<br />
the two wholesalers stand out as particularly vulnerable<br />
given thin profit margins and high purchase costs. The<br />
data shows a very low tolerance for input price rises, namely<br />
4.8% in the egg and poultry wholesaling industry and<br />
only 3% in the beef and pork wholesaling industry. This<br />
means a typical operator in the beef and pork wholesaling<br />
44<br />
October 2008 The RMA Journal
Table 1<br />
Industry<br />
Purchase Costs<br />
(% of total revenue)<br />
Profit Rate<br />
(% of revenue)<br />
Price-shock Vulnerability Checklist<br />
Implied Input Price<br />
Rise 'Buffer'<br />
Industry Life-<br />
Cycle Stage<br />
Average Size of<br />
Industry Company ($)<br />
<strong>IBISWorld</strong> Industry<br />
Health Index<br />
Beef Cattle Production 48.8 15.0 30.7 Mature 73,365 106.1<br />
Milk Production & Dairy Cattle 51.9 13.0 25.0 Mature 502,688 99.3<br />
Hog & Pig Farming 50.0 14.0 28.0 Decline 481,334 103.7<br />
Chicken Production 52.2 18.5 35.4 Mature 968,033 119.2<br />
Turkey Production 44.0 14.1 32.0 Mature 1,176,110 123.6<br />
Animal Food Production 61.0 19.6 32.1 Mature 21,721,465 110.8<br />
Egg & Poultry Wholesale 83.0 4.0 4.8 Decline 10,859,586 79.1<br />
Beef & Pork Wholesale 83.6 2.5 3.0 Decline 9,760,094 77.6<br />
industry might bear a short-term increase in input costs<br />
of only 3% before considering passing on prices or threatening<br />
default. These pressures are likely to accelerate the<br />
general move toward wholesale function bypass and play<br />
to the strengths of vertically integrated agribusinesses that<br />
grow, process, wholesale, and even retail goods.<br />
The saving grace of the wholesale sector is the large<br />
average size of an industry operator. Buying power is a<br />
key pressure point along any supply chain. In comparison<br />
to most farmers, wholesale firms have a high degree of<br />
bargaining power in the supply chain. Firms at or larger<br />
than the benchmarks noted can use economies of scale in<br />
purchasing, storage, and distribution that a smaller company<br />
would find more difficult. The discrepancy in establishment<br />
size is a fair indication of one company’s power<br />
compared with another.<br />
Evidence of the way supply-chain dynamics operate<br />
is calculable. According to the U.S. Department of Agriculture<br />
(USDA), the retail price of beef increased 16.6%<br />
between 2002 and 2007, and all of this occurred between<br />
wholesalers and retailers. A comparison of the farm gate<br />
price of beef and the wholesale price shows a fall of 6.2%<br />
over the same period. Clearly, the discrepancy between<br />
average farm size and average wholesaler and manufacturer<br />
is vital.<br />
Supply-chain credit risk is mitigated by reasonably high<br />
average profit margins, which operators can use as a shortterm<br />
buffer against price shocks before passing the price<br />
to consumers (or further down the supply chain) or, in the<br />
worst-case scenario, before credit default.<br />
The animal food production industry is particularly<br />
well sheltered with a significant average establishment<br />
size (manufacturing is reliant on economies of scale that<br />
reduce unit prices) and a profit margin touching 20%<br />
of revenue. The buffer in this industry’s cost structure is<br />
32.1%. Although purchase costs are reasonably high, they<br />
are spread across crop and noncrop industries.<br />
Moreover, the mature stage of the industry life cycle<br />
allows the best companies to segment their product offerings.<br />
Higher-quality goods will probably be marked up<br />
in price at the retail level (pet food accounts for around<br />
30% of industry revenue), while lower-end goods (such as<br />
cattle feed) will benefit from some near-term price crosssubsidization.<br />
The <strong>IBISWorld</strong> Industry Health Index shows an average<br />
score across all industries in the chain of 102.4—ranging<br />
from a very healthy 123.6 points for turkey production to<br />
a low of 77.6 points in the beef and pork wholesale industry.<br />
Turkey producers are aided by the fact that purchase<br />
costs account for only 44% of total revenue (the lowest in<br />
this supply chain). Of that total, only about 15 percentage<br />
points come from crops (as used for feed). Further along<br />
the turkey production supply chain, operators are helped<br />
by the high price of turkey livestock, a low incidence of<br />
disease, and changing consumer consumption habits favoring<br />
white meat.<br />
Three industries fall below the baseline 100 level, suggesting<br />
relatively poor health. In the case of the milk production<br />
and dairy cattle industry, problems stem from the<br />
industry operators’ reliance on crops as feed. <strong>IBISWorld</strong><br />
estimates that crops account for about 20 percentage<br />
points of purchase costs (which total 51.9% of revenue).<br />
The industry also suffers from a weakening supply chain<br />
of its own. Key buyers, such as the dairy product manufacturing<br />
industry, which accounts for about 30% of total<br />
demand, will grow only 0.6% in 2009. Another key buyer,<br />
the ice cream manufacturing industry, will decline 0.9%.<br />
Agriculture and the Food Production Chain<br />
The benchmark checklist for industries in the food production<br />
supply chain (Table 2) has two industries in the<br />
growth stage of their life cycles: the tortilla production<br />
industry and corn, wheat, and soybean wholesaling. On<br />
closer inspection of the latter, we find that expansion is<br />
concentrated in the corn segment, especially sales to producers<br />
of ethanol and other biofuels. Expansion in this<br />
The RMA Journal October 2008 45
Table 2<br />
Industry<br />
Purchase Costs<br />
(% of total revenue)<br />
Industries in Food Production Supply Chain<br />
Profit Rate<br />
(% of revenue)<br />
Implied Input Price<br />
Rise ’Buffer’<br />
Industry Life-<br />
Cycle Stage<br />
Average Size of<br />
Industry Company ($)<br />
<strong>IBISWorld</strong> Industry<br />
Health Index<br />
Flour Milling 73.0 15.0 20.5 Mature 36,196,730 71.8<br />
Margarine & Cooking Oil Processing 70.2 15.0 21.4 Mature 124,543,827 70.7<br />
Cereal Production 32.4 43.5 134.3 Mature 180,525,000 114.3<br />
Bread Production 36.1 19.0 52.6 Mature 3,931,639 100.1<br />
Cookie, Cracker & Pasta Production 40.4 21.7 53.7 Mature 28,534,268 108.3<br />
Tortilla Production 43.8 18.8 42.9 Growth 7,531,546 114.5<br />
Syrup & Flavoring Production 27.7 26.1 94.2 Decline 57,388,966 105.1<br />
Corn, Wheat & Soybean Wholesaling 89.3 5.0 5.6 Growth 37,309,661 83.2<br />
product line has been significant enough to push up the<br />
industry’s profit margin to 5% of revenue, which is beyond<br />
the sliver normally associated with wholesaling.<br />
Moreover, the industry’s average company size, $37<br />
million, reflects strong buying power. Data from the<br />
USDA shows that major wholesalers (and, by extension,<br />
manufacturers to which they sell) and retailers have successfully<br />
“out-bargained” farmers. For instance, the value<br />
of cereal and bakery products returned to the farmer fell<br />
from 14% in 1980 to 6% in 2006. Over the same period,<br />
the retail cost of cereal and bakery products increased<br />
153%. The source of power in this chain clearly is not<br />
with farmers.<br />
Profit margins across the whole food production supply<br />
chain are relatively high, which provides a short-term buffer<br />
against default. Indeed, three industries return a buffer<br />
level greater than 50%, with a typical operator in the cereal<br />
production industry able to bear a short-term price rise<br />
of 134% before taking ameliorative action. Profit margins<br />
are buoyed by the relatively low cost of labor in this chain.<br />
Wage costs are an average of 4.8% of revenue compared<br />
to 6.2% for those in the animal food supply chain. Wage<br />
costs have been eroded by the extensive use of machinery<br />
and large-scale manufacturing plants. Reasonably benign<br />
purchase prices over the past five to 10 years have fed<br />
directly into profit ratios, with minimal leakage into depreciable<br />
investment spending on newer machinery.<br />
The <strong>IBISWorld</strong> Industry Health Index scores for the<br />
industries in the food production segment average out at<br />
96 points, meaning the supply chain as a whole is in a<br />
slightly riskier position than the baseline measurement<br />
in 2005. The riskiest are the margarine and cooking oil<br />
processing industry (with a score of 70.7 points) and the<br />
flour milling industry (71.8 points). These two industries<br />
have very high purchase costs at 70.2% and 73% of revenue,<br />
respectively.<br />
More importantly, these purchases are concentrated<br />
in the three industries that have experienced the highest<br />
rise in agricultural prices. On average, wheat purchases<br />
account for around 30% of total revenue for a typical flour<br />
miller. Meanwhile, oilseed crops account for 35% of revenue<br />
in the margarine and cooking oil processing industry<br />
and corn accounts for another 10%, making the rise in<br />
agricultural prices a cause for concern.<br />
Some Companies Are Stronger Than Others<br />
With the purchase cost of agricultural goods high and rising,<br />
the average profit margins of industries in a number<br />
of supply chains are likely to be eroded. The best enterprises<br />
will weather the storm over the short term without<br />
threat of credit default or passing on price increases<br />
to consumers (and dissuading people from buying the<br />
good). Some weaker enterprises, especially those in industries<br />
susceptible to supply-chain price shocks, will suffer.<br />
Consequently, credit risk will increase.<br />
A number of key indicators have been determined and<br />
quantified in this article to help determine the robustness<br />
of an industry as it deals with price increases from suppliers.<br />
An industry’s life-cycle stage accounts for a number<br />
of industry fundamentals and will prove a solid guide to<br />
the industry’s long-term viability. In the short term, an industry’s<br />
purchase costs, the distribution or concentration<br />
of those costs, and the average profit margin are central<br />
to judging changes to the credit risk environment. This<br />
article established some benchmarks figures for 16 key<br />
industries.<br />
The third and final article in this series will focus on<br />
stress-test modeling. In this way, we can hypothesize further<br />
agricultural price rises (and falls) and other macroeconomic<br />
shocks that help pinpoint weaknesses along the<br />
agribusiness supply chain. v<br />
••<br />
Gavin Smith is a senior economic analyst at <strong>IBISWorld</strong> Inc., a Los Angeles-based<br />
industry intelligence firm. Contact him by e-mail at gavins@ibisworld.com.<br />
46<br />
October 2008 The RMA Journal