N.Z. MARINE DEPARTMENT-FISHERIE,S BULLETIN No. .į
N.Z. MARINE DEPARTMENT-FISHERIE,S BULLETIN No. .į
N.Z. MARINE DEPARTMENT-FISHERIE,S BULLETIN No. .į

You also want an ePaper? Increase the reach of your titles
YUMPU automatically turns print PDFs into web optimized ePapers that Google loves.
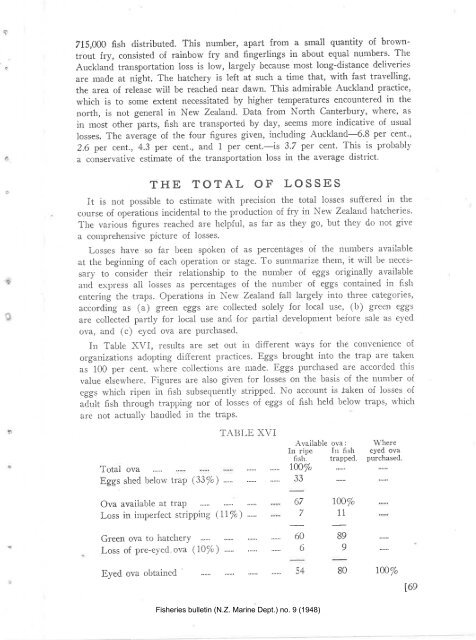
715,000 fish distributed. This number, apart from a small quantity of browntrout<br />
fry, consisted of rainbow fry and frngerlings in about equal numbers' The<br />
Aucklancl transportation loss is low, largely because most long-distance deliveries<br />
are macle at night. The hatchery is left at such a time that, with fast travelling,<br />
the area of release will be reachecl near dawn. This admirable Auckland practice,<br />
whicl-r is to some extent necessitated by higher temperatures encountered in the<br />
north, is not general in New Zealand. Data from <strong>No</strong>rth Canterbury, 'lvhere, as<br />
i¡ most other parts, fish are transporteci by day, seems more indicative of usual<br />
losses. The average of the four figures given, including Auckland-6.8 per cent.,<br />
2.6 per cent., 4.3 per cent., and 1 per cent.-is 3.7 per cent. This is probabl¡,<br />
a conservative estimate of the tra,nsportation loss in the avelage distr-ict.<br />
THE TOTAL OF LOSSES<br />
It is not possible to estimate with precision the total losses suffered in the<br />
course of operations incidental to tire production of fry in Nerv Zealancl l.ratcheries.<br />
The various figures reachecl are helpful, as far as they go, but they do not give<br />
a colnprehellsive picture of losses;.<br />
Losses have so far l¡een spoken of as percentages of the uutntrers availal¡le<br />
at the beginning of eacl-r operatiorr or stage. To summarize them, it \\'-i11 be necessary<br />
to consider their relationship to the number of eggs originally available<br />
and express all losses as percentages of the number of eggs contained in fish<br />
enterirrg the traps. Operations in New Zealand fall largely into three categories,<br />
according as (a) green eggs are collected solely for local use, (b) green eggs<br />
are collected partly for local use ancl for partial development before sale as eyed<br />
ova, and (c) eyed ova are purchased.<br />
I¡ Table ,\VI, results are set out in different ways for the cotlveniellce of<br />
organizations adoptir-rg different practices. Eggs brought into the trap are taken<br />
as 100 per cent. r,r,here collections are macle. Eggs purchased are accorded this<br />
value elsewhere. Figures are also given for losses on the basis of the nun-rber of<br />
eggs which ripen ir-r flsh subsecluently 51¡lpp"d. <strong>No</strong> account is Jaken of losses of<br />
aãult fish through trapping nor of losses of eggs of frsh held below traps, which<br />
are rlot actually handied in the traps.<br />
TA]]LE XVI<br />
Available ova: \ñ'here<br />
In ripe In fish eyed ova<br />
fish. trapped. purchased.<br />
Total ova<br />
tæ%<br />
Eggs shecl below traP (33%) .. . 33<br />
Ova available at traP<br />
Loss in imperfect stlipping (.Il%) .. ..<br />
Green ova to hatcl-rerY<br />
Loss of pre-eyed ova (10/'") ."...<br />
Eyed ova obtainecl<br />
67<br />
7<br />
*t 69<br />
5+<br />
Fisheries bulletin (N.Z. Marine Dept.) no. 9 (1948)<br />
ßo%<br />
11<br />
80 tjo%<br />
l6e