North Yukon Conceptual Oil and Gas Development Scenario And ...
North Yukon Conceptual Oil and Gas Development Scenario And ...
North Yukon Conceptual Oil and Gas Development Scenario And ...

You also want an ePaper? Increase the reach of your titles
YUMPU automatically turns print PDFs into web optimized ePapers that Google loves.
<strong>North</strong> <strong>Yukon</strong><br />
<strong>Conceptual</strong> <strong>Oil</strong> <strong>and</strong> <strong>Gas</strong> <strong>Development</strong> <strong>Scenario</strong><br />
<strong>And</strong><br />
Local Benefits Assessment<br />
Prepared for:<br />
<strong>North</strong> <strong>Yukon</strong> <strong>Oil</strong> <strong>and</strong> <strong>Gas</strong> Working Group<br />
Prepared by:<br />
Fekete Associates Inc.<br />
<strong>and</strong><br />
Vector Research
November 23, 2005<br />
<strong>Yukon</strong> Government<br />
<strong>Oil</strong> <strong>and</strong> <strong>Gas</strong> Management Branch<br />
Suite 300, 211 Main Street<br />
3rd Floor Shopper's Plaza<br />
Box 2703<br />
Whitehorse, YT<br />
Y1A 2C6<br />
Attention: Mr. John Masterson<br />
Director<br />
Dear Sir:<br />
Re: <strong>North</strong> <strong>Yukon</strong><br />
<strong>Conceptual</strong> <strong>Oil</strong> <strong>and</strong> <strong>Gas</strong> <strong>Development</strong> <strong>Scenario</strong><br />
<strong>And</strong> Local Benefits Assessment<br />
As per the terms of contract <strong>Yukon</strong> Government contract # 531-402001-0207, we submit our<br />
completed report (attached).<br />
Should you have any questions, please contact David Dunn at 1-800-625-2488.<br />
Yours truly,<br />
FEKETE ASSOCIATES INC. VECTOR RESEARCH<br />
“original signed by” “original signed by”<br />
David W. Dunn, P.Eng. Paul Kishchuk, B.A. M.A.<br />
Vice President President<br />
DWD/<br />
Fekete Associates Inc. Vector Research<br />
2000, 540 – 5 th Avenue S.W. PO Box 31126<br />
Calgary, Alberta T2P 0M2 Whitehorse, <strong>Yukon</strong> Y1A 5P7<br />
403.213.4200/800.625.2488 867.668.3164
<strong>North</strong> <strong>Yukon</strong><br />
<strong>Conceptual</strong> <strong>Oil</strong> <strong>and</strong> <strong>Gas</strong> <strong>Development</strong> <strong>Scenario</strong><br />
<strong>And</strong> Local Benefits Assessment<br />
Executive Summary<br />
♦ This report presents a development scenario that the authors deem reasonable given<br />
the current information available. Actual development will inevitably evolve differently<br />
as wells are drilled <strong>and</strong> new discoveries are made. The intent of this report is not to<br />
construct a definitive plan, but to project plausible levels of oil <strong>and</strong> gas activities <strong>and</strong><br />
then assess the local benefits <strong>and</strong> challenges to the <strong>Yukon</strong> people.<br />
♦ <strong>Development</strong> scenarios in this report are based on the resource estimates previously<br />
prepared by the <strong>Yukon</strong> Geological Service (“YGS”)<br />
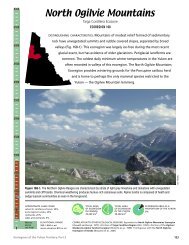
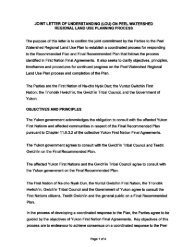
♦ Of the six <strong>North</strong> <strong>Yukon</strong> geological basins, Eagle Plain has the greatest potential for<br />
development <strong>and</strong> is the focus of this report. Peel Plateau is secondarily addressed.<br />
♦ The YGS study identifies a gas resource of 5.39 Tcf at Eagle Plain, enough to supply<br />
as 20” gas pipeline for more than 20 years.<br />
♦ <strong>Development</strong> of the <strong>North</strong> <strong>Yukon</strong> gas resources depends on prior construction of the<br />
Mackenzie Valley Pipeline (“MVP”) or the Alaska Highway Pipeline Project (“AHPP”).<br />
♦ The optimal pipeline route for a <strong>North</strong> <strong>Yukon</strong> <strong>Gas</strong> Pipeline is along the Dempster<br />
highway to connect with the Mackenzie Valley Pipeline at Inuvik.<br />
♦ Start-up of the Mackenzie Valley pipeline is predicted to occur in 2014. <strong>North</strong> <strong>Yukon</strong><br />
gas is predicted to begin flowing by 2017.<br />
♦ Based on available geological data, it is predicted that exploration activity will be<br />
focused in the southeastern part of the Eagle Plain basin.<br />
♦ Drilling activity is predicted to commence in earnest in 2008, once construction of the<br />
Mackenzie Valley Pipeline has been approved.<br />
♦ A total of 873 wells are ultimately predicted to be drilled at Eagle Plain. Multiple<br />
directional wells are expected to be from pads, thereby reducing surface disturbance.<br />
♦ Employment levels will peak at 1500 during pipeline construction. The on-going direct<br />
employment level is estimated to be 178 year-round positions plus another 153 jobs<br />
during winter. Secondary jobs are estimated to be 100 to 200.<br />
♦ Royalty revenue from gas production is estimated to be 61.9 – 143.4 MM$ per year.<br />
♦ Although <strong>Yukon</strong> <strong>and</strong> First Nations governments will receive significant royalty revenue,<br />
the bulk of the royalties will flow to the federal government. The major benefit of oil<br />
<strong>and</strong> gas development to the <strong>Yukon</strong> people is therefore not in the royalty revenue but<br />
rather in direct investment, local business development <strong>and</strong> ensuing taxes.<br />
♦ <strong>Oil</strong> development may proceed separately from, <strong>and</strong> possibly in advance of, a gas<br />
pipeline. <strong>Oil</strong> production from Eagle Plain could conceivably meet much of the dem<strong>and</strong><br />
for refined petroleum products within the <strong>Yukon</strong>.<br />
♦ A framework has been presented in which the socio-economic effects of oil <strong>and</strong> gas<br />
development can be weighed <strong>and</strong> considered with respect to the span, degree <strong>and</strong><br />
timing of each effect.
Table of Contents<br />
1 Introduction ...................................................................................................................1<br />
2 Consulting Expertise.....................................................................................................1<br />
3 Terms of Reference ......................................................................................................2<br />
4 Scope of Work ..............................................................................................................3<br />
5 Certificates of Qualification ...........................................................................................5<br />
6 Limitations of Report.....................................................................................................8<br />
7 Resource Assessment..................................................................................................9<br />
7.1 <strong>Gas</strong> Resources – <strong>North</strong> <strong>Yukon</strong> Basins ..............................................................9<br />
7.2 <strong>Gas</strong> Resources – Eagle Plain ..........................................................................11<br />
7.3 <strong>Gas</strong> Resources – Peel Plateau........................................................................13<br />
7.4 <strong>Oil</strong> Resources – Eagle Plain ............................................................................13<br />
8 Pipelines .....................................................................................................................14<br />
8.1 Mackenzie Valley Pipeline ...............................................................................14<br />
8.2 Alaska Highway Pipeline Project .....................................................................15<br />
8.3 Pipeline Timeline <strong>and</strong> Regulations...................................................................16<br />
8.4 <strong>North</strong> <strong>Yukon</strong> <strong>Gas</strong> Pipeline Routes ...................................................................17<br />
8.5 <strong>North</strong> <strong>Yukon</strong> <strong>Gas</strong> Pipeline Size........................................................................19<br />
8.6 <strong>North</strong> <strong>Yukon</strong> <strong>Gas</strong> Pipeline Timeline .................................................................22<br />
9 <strong>Development</strong> <strong>Scenario</strong> ...............................................................................................23<br />
9.1 Operating Economics.......................................................................................23<br />
9.2 Drilling Fairways – <strong>Gas</strong> ....................................................................................25<br />
9.3 Drilling Timeframe <strong>and</strong> Number of Wells – <strong>Gas</strong>...............................................26<br />
9.4 Peel Plateau.....................................................................................................34<br />
9.5 Drilling Rigs......................................................................................................36<br />
9.6 Seismic ............................................................................................................37<br />
9.7 Processing Plant ..............................................................................................38<br />
9.8 Gathering Pipelines..........................................................................................39<br />
9.9 Roads...............................................................................................................39<br />
9.10 <strong>Oil</strong> <strong>Development</strong> ..............................................................................................40<br />
10 Local Markets .............................................................................................................41<br />
10.1 <strong>Oil</strong> Products .....................................................................................................41<br />
10.2 Electrical Dem<strong>and</strong> <strong>and</strong> Natural <strong>Gas</strong> Generation..............................................41<br />
11 Operating Environment...............................................................................................44
11.1 <strong>Oil</strong> <strong>and</strong> gas development regulations...............................................................45<br />
11.2 Open access to data ........................................................................................45<br />
11.3 Application process <strong>and</strong> timing ........................................................................45<br />
11.4 Royalties/taxes/local requirements ..................................................................45<br />
11.5 L<strong>and</strong> sale procedures/tenure ...........................................................................45<br />
11.6 Infrastructure....................................................................................................46<br />
11.7 Pipeline access requirements ..........................................................................46<br />
11.8 Conditions needed for on-going production growth .........................................46<br />
11.9 Risk mitigation..................................................................................................47<br />
12 Economic Benefits ...........................................................................................48<br />
12.1 Royalties ..........................................................................................................48<br />
12.2 Direct Investment .............................................................................................50<br />
12.3 Employment .....................................................................................................51<br />
12.4 Pipeline ............................................................................................................52<br />
12.4.1 Feasibility Phase............................................................................52<br />
12.4.2 Planning Phase..............................................................................52<br />
12.4.3 Pipeline Construction Phase..........................................................52<br />
12.4.4 Pipeline Operation Phase ..............................................................53<br />
12.4.5 Total Direct Pipeline Employment Levels <strong>and</strong> Job Types..............53<br />
12.4.6 <strong>Oil</strong> Related Employment Levels <strong>and</strong> Job Types ............................58<br />
12.4.7 Drilling Rigs....................................................................................60<br />
12.4.8 Seismic ..........................................................................................60<br />
12.4.9 Well Servicing ................................................................................60<br />
12.4.10 Road Construction .........................................................................60<br />
12.4.11 Gathering Pipelines........................................................................60<br />
12.4.12 Operations .....................................................................................60<br />
12.4.13 Total Employment Levels...............................................................60<br />
12.5 Business Opportunities ....................................................................................64<br />
13 Community Preparation ..............................................................................................65<br />
13.1 Potential socio-economic effects: a framework................................................65<br />
13.2 Potential community strategies to prepare for sustained <strong>and</strong> responsible oil <strong>and</strong><br />
gas development ........................................................................................................67<br />
13.2.1 Benefit Plans..................................................................................67<br />
13.2.2 Human Resource Planning ............................................................68<br />
13.2.3 Benefit Agreements .......................................................................69
13.2.4 Expectations Management ............................................................70<br />
14 Constraints to <strong>Development</strong>.............................................................................74
1 Introduction<br />
In April 2005, the <strong>North</strong> <strong>Yukon</strong> <strong>Oil</strong> <strong>and</strong> <strong>Gas</strong> Working Group, comprised of representatives<br />
from the <strong>Yukon</strong> government, Vuntut Gwitchin First Nation, Trondek Hwech’ First Nation <strong>and</strong><br />
the First Nation of the Na-cho Nyak Dun, recommended that a consultant be hired to<br />
prepare a strategic overview of oil <strong>and</strong> gas prospects <strong>and</strong> the potential oil <strong>and</strong> gas<br />
development scenario in <strong>North</strong> <strong>Yukon</strong>. The objective of the strategic analysis is to enable<br />
the <strong>Yukon</strong> government <strong>and</strong> First Nations to collectively plan for future oil <strong>and</strong> gas<br />
development in <strong>North</strong> <strong>Yukon</strong> through examining the supply/dem<strong>and</strong> scenario, development<br />
objectives, opportunities for community participation, short-term <strong>and</strong> longer-term benefits<br />
as well as constraints to development. The study may also serve to inform the <strong>North</strong> <strong>Yukon</strong><br />
<strong>and</strong> Peel Watershed L<strong>and</strong> Planning Commissions.<br />
2 Consulting Expertise<br />
A consortium of Fekete Associates Inc. (“Fekete”) <strong>and</strong> Vector Research (“Vector”) were<br />
commissioned to prepare the strategic overview report.<br />
Fekete is an independent consulting firm that provides engineering <strong>and</strong> geological services<br />
<strong>and</strong> software to the oil <strong>and</strong> gas industry. The company has been in business for over 30<br />
years <strong>and</strong> employs a full-time staff of 126 engineers, geologists, technologists,<br />
programmers <strong>and</strong> support staff in its Calgary office. Fekete’s expertise with respect to this<br />
project is the calculation of oil <strong>and</strong> gas volumes present underground, the estimation of<br />
production rates <strong>and</strong> the calculation of the economic value of the production, including<br />
royalties to governments/First Nations <strong>and</strong> netbacks to operators. Fekete undertook to<br />
conduct the Resource Assessment, <strong>Development</strong> <strong>Scenario</strong>s <strong>and</strong> Timeline, Local Market,<br />
Operating Environment <strong>and</strong> <strong>Yukon</strong> Benefits sections of the project scope. Principal authors<br />
were Fekete’s Vice President, David Dunn, P.Eng. <strong>and</strong> Project Engineer, Jason Wilhelm,<br />
P.Eng.<br />
Vector Research is an independent economic research consultancy based in Whitehorse,<br />
<strong>Yukon</strong> with expertise in five focus areas: Economic Effects <strong>and</strong> Project Assessment,<br />
Energy <strong>and</strong> Resource Policy, Public Finance <strong>and</strong> <strong>North</strong>ern Economics, First Nation<br />
Taxation <strong>and</strong> Finance, Strategic Planning <strong>and</strong> Performance Measurement.<br />
Paul Kishchuk, President of Vector Research, holds BA <strong>and</strong> MA degrees in economics <strong>and</strong><br />
has more than 14 years of experience in the fields of economics <strong>and</strong> public finance. He is a<br />
skilled researcher <strong>and</strong> analyst whether working with numbers or words <strong>and</strong> is adept at<br />
presenting findings in a clear manner in both written <strong>and</strong> presentation formats. Paul has<br />
successfully managed a wide variety of projects including intergovernmental initiatives. He<br />
is an experienced trainer having designed, constructed <strong>and</strong> delivered several workshops on<br />
research <strong>and</strong> finance-related topics.<br />
Prior to moving to Whitehorse in 1992, Paul worked for the Office of the Comptroller<br />
General as well as the Department of Indian Affairs <strong>and</strong> <strong>North</strong>ern <strong>Development</strong>. Since 1992<br />
he has worked in both government <strong>and</strong> private industry. When employed in government he<br />
was Senior Economist for <strong>Yukon</strong> Economic <strong>Development</strong> <strong>and</strong> Director of Revenue<br />
Services for <strong>Yukon</strong> Finance. While in private industry Paul has gained in-depth experience<br />
in energy <strong>and</strong> resource policy <strong>and</strong> an extensive underst<strong>and</strong>ing of the fiscal aspects of the<br />
<strong>Yukon</strong> First Nation l<strong>and</strong> claim agreements. He has also been active in the fields of<br />
economic effects/project assessment, strategic planning <strong>and</strong> performance measurement.<br />
1
Paul is an adjunct faculty member at <strong>Yukon</strong> College where he teaches introductory<br />
microeconomics <strong>and</strong> macroeconomics. He has also guest lectured in the University of<br />
Alaska Southeast’s Master of Public Administration Program on various public finance<br />
topics. Vector undertook to write the Community Preparation section of the project scope.<br />
3 Terms of Reference<br />
The consultant’s primary task was to synthesize <strong>and</strong> analyze existing information <strong>and</strong> data,<br />
although some original research was required, <strong>and</strong> to advise the <strong>North</strong> <strong>Yukon</strong> <strong>Oil</strong> <strong>and</strong> <strong>Gas</strong><br />
Working Group <strong>and</strong> the OGMB of the potential <strong>North</strong> <strong>Yukon</strong> oil <strong>and</strong> gas development<br />
scenario over the next twenty years. Specifically, the consultant’s m<strong>and</strong>ate was to:<br />
♦ Provide contextual information including operating environment both for industry <strong>and</strong><br />
governments (<strong>Yukon</strong>, <strong>Yukon</strong> First Nations <strong>and</strong> Canada) <strong>and</strong> core assumptions needed<br />
to develop a sustainable <strong>and</strong> responsible oil <strong>and</strong> gas industry in <strong>North</strong> <strong>Yukon</strong>.<br />
♦ Using existing oil <strong>and</strong> gas resource assessments provide an overview of <strong>North</strong><br />
<strong>Yukon</strong>’s oil <strong>and</strong> gas development production potential.<br />
♦ Indicate the potential size <strong>and</strong> type of development with <strong>and</strong> without the Mackenzie<br />
<strong>and</strong> Alaska Natural <strong>Gas</strong> Pipelines. Information on pipeline development will be<br />
provided by the Business <strong>Development</strong> <strong>and</strong> Pipeline Branch. Based on this<br />
information, the consultant will provide an estimate of potential upstream oil <strong>and</strong> gas<br />
development, including seismic programs, wells, <strong>and</strong> potential projects.<br />
♦ Indicate to what extent, if any, <strong>Yukon</strong> oil <strong>and</strong> gas development could supply the local<br />
market (for instance by natural gas <strong>and</strong> propane).<br />
♦ Identify constraints to short <strong>and</strong> medium term oil <strong>and</strong> gas development in <strong>North</strong> <strong>Yukon</strong>.<br />
To assist the <strong>North</strong> <strong>Yukon</strong> <strong>Oil</strong> <strong>and</strong> <strong>Gas</strong> Working Group in its planning, the consultant will:<br />
♦ Indicate the potential benefits of oil <strong>and</strong> gas development to the <strong>North</strong> <strong>Yukon</strong> First<br />
Nation communities <strong>and</strong> <strong>Yukon</strong>ers, in both short term (up to five years) <strong>and</strong> future<br />
scenarios i.e. employment <strong>and</strong> economic spin-offs.<br />
♦ Indicate in which <strong>North</strong> <strong>Yukon</strong> basins, over a twenty year time period, the likely<br />
sequence in which development may occur.<br />
♦ Indicate what communities can do to prepare for sustained <strong>and</strong> responsible oil <strong>and</strong> gas<br />
development i.e. capacity development, gaining the knowledge to make informed<br />
decisions, training for jobs, managing expectations (plans for potential bust or boom<br />
scenarios).<br />
2
4 Scope of Work<br />
The specific work plan was developed in conjunction with OGMB as follows:<br />
Resource Assessment<br />
♦ Tabular summary by basin/area/zone/well of oil <strong>and</strong> gas resources based on<br />
YGS/GSC reports (no new, independent reserve assignments).<br />
♦ Ranking of basin/area/zone/wells by propsectivity for production <strong>and</strong> conditions<br />
precedent required for development.<br />
♦ Short comparison of <strong>North</strong> <strong>Yukon</strong> resources versus Mackenzie Valley/<strong>North</strong> Slope.<br />
<strong>Development</strong> <strong>Scenario</strong><br />
♦ Pipelines<br />
♦ Seismic<br />
♦ Drilling<br />
♦ Roads<br />
• Mackenzie Valley pipeline<br />
• Alaska Highway pipeline<br />
• Dedicated pipeline<br />
• other<br />
♦ Pipelines<br />
♦ Facilities<br />
♦ Production Forecasts<br />
Local Market<br />
♦ Summary of current energy dem<strong>and</strong> by type, sources <strong>and</strong> delivery costs.<br />
♦ Analysis of potential for energy replacement/supplementation including expected<br />
delivered cost including effect of major pipelines on assumptions.<br />
♦ This work will rely on dem<strong>and</strong> data to be provided by the <strong>Yukon</strong> government for the<br />
towns of Whitehorse, Faro, Old Crow <strong>and</strong> Dawson.<br />
Operating Environment<br />
♦ Expectations of industry based on southern learnings (solicit input from operators)<br />
• <strong>Oil</strong> <strong>and</strong> gas development regulations<br />
• Open access to data<br />
• Application process/forecastable timing<br />
• Royalties/taxes/local requirements<br />
• L<strong>and</strong> sale procedures/tenure<br />
• Infrastructure<br />
3
• Pipeline access<br />
• Conditions for continued production growth<br />
• Risk mitigation<br />
<strong>Yukon</strong> Benefits<br />
♦ Economic Benefit<br />
• Royalties<br />
• Direct investment<br />
• Jobs<br />
− Pipeline<br />
− Drilling<br />
− Seismic<br />
− Well Servicing<br />
− Road Construction<br />
− Gathering Pipelines<br />
− Operations<br />
• Business Opportunities<br />
Community Preparation<br />
♦ Capacity <strong>Development</strong><br />
♦ Knowledge Capture<br />
♦ Training<br />
♦ Managing Expectations<br />
♦ Boom/Bust scenarios<br />
Constraints to <strong>Development</strong><br />
♦ Risk Analysis Workshop<br />
Note that this section was contemplated in the original project scope but was later<br />
deleted from the project terms.<br />
4
5 Certificates of Qualification<br />
I, David W. Dunn, certify that:<br />
CERTIFICATE OF QUALIFICATION<br />
1. I graduated from the University of Alberta with a B.Sc. (Distinction) in Petroleum<br />
Engineering in 1982. I have in excess of 22 years experience in the petroleum industry.<br />
2. I am a registered Professional Engineer in the Province of Alberta, Canada.<br />
3. I am employed by the consulting engineering firm, Fekete Associates Inc., named as<br />
having prepared a report titled, “<strong>Conceptual</strong> <strong>Oil</strong> <strong>and</strong> <strong>Gas</strong> <strong>Development</strong> <strong>Scenario</strong> <strong>and</strong><br />
Local Benefits Assessment, <strong>North</strong> <strong>Yukon</strong> Project” dated October 21, 2005.<br />
4. I have no interest, directly or indirectly, in the <strong>Yukon</strong> Government or in the <strong>Yukon</strong> First<br />
Nations, nor in the properties evaluated. I do not expect to obtain any interest, directly<br />
or indirectly in the properties evaluated, nor in any securities pertaining thereto.<br />
5<br />
“original signed by”<br />
David W. Dunn, P. Eng.
I, Jason K. Wilhelm, certify that:<br />
CERTIFICATE OF QUALIFICATION<br />
1. I graduated from the University of Saskatchewan with a B.Sc. in Chemical Engineering<br />
in 1996 <strong>and</strong> have in excess of 8 years experience in the petroleum industry.<br />
2. I am a registered Professional Engineer in the Province of Alberta.<br />
3. I am employed by the consulting engineering firm, Fekete Associates Inc., named as<br />
having prepared a report titled, “<strong>Conceptual</strong> <strong>Oil</strong> <strong>and</strong> <strong>Gas</strong> <strong>Development</strong> <strong>Scenario</strong> <strong>and</strong><br />
Local Benefits Assessment, <strong>North</strong> <strong>Yukon</strong> <strong>Gas</strong> Pipeline Project” dated October 21, 2005.<br />
4. I have no interest, directly or indirectly, in the <strong>Yukon</strong> Government or in the <strong>Yukon</strong> First<br />
Nations, nor in the properties evaluated. I do not expect to obtain any interest, directly<br />
or indirectly in the properties evaluated, nor in any securities pertaining thereto.<br />
6<br />
“original signed by”<br />
Jason K. Wilhelm, P. Eng.
I, Paul Kishchuk certify that:<br />
CERTIFICATE OF QUALIFICATION<br />
1. I hold a Bachelors Degree in Economics from the University of Saskatchewan <strong>and</strong> a<br />
Masters Degree in Economics from Carleton University <strong>and</strong> have in excess of 14 years<br />
experience in the fields of economics <strong>and</strong> public finance.<br />
3. I am employed by the consulting firm, Vector Research, named as having prepared a<br />
report titled, “<strong>Conceptual</strong> <strong>Oil</strong> <strong>and</strong> <strong>Gas</strong> <strong>Development</strong> <strong>Scenario</strong> <strong>and</strong> Local Benefits<br />
Assessment, <strong>North</strong> <strong>Yukon</strong> <strong>Gas</strong> Pipeline Project” dated October 21, 2005.<br />
4. I have no interest, directly or indirectly, in the <strong>Yukon</strong> Government or in the <strong>Yukon</strong> First<br />
Nations, nor in the properties evaluated. I do not expect to obtain any interest, directly<br />
or indirectly in the properties evaluated, nor in any securities pertaining thereto.<br />
7<br />
“original signed by”<br />
Paul Kishchuk
6 Limitations of Report<br />
This report presents a development scenario that the authors deem reasonable given the<br />
current information available. Actual development will inevitably evolve differently as wells<br />
are drilled <strong>and</strong> new discoveries are made. The intent of this report is not to construct a<br />
definitive plan, but to project plausible levels of oil <strong>and</strong> gas activities <strong>and</strong> then assess the<br />
local benefits <strong>and</strong> challenges to the <strong>Yukon</strong> people.<br />
This is a conceptual study, undertaken with the intent of thinking through the development<br />
process. This report therefore is neither comprehensive nor definitive in its scope <strong>and</strong><br />
conclusions. It means to highlight issues for further discussion <strong>and</strong> action. It is understood<br />
that the results of this report will be used by the <strong>North</strong> <strong>Yukon</strong> <strong>Oil</strong> <strong>and</strong> <strong>Gas</strong> Working Group,<br />
<strong>and</strong> possibly other interested parties, as a basis for open discussion on planning for oil <strong>and</strong><br />
gas development in <strong>North</strong> <strong>Yukon</strong>. For example, the focus area we have identified for<br />
seismic, wells, roads <strong>and</strong> pipelines comes from looking at the available underground<br />
geological <strong>and</strong> engineering data. Further planning will be necessary to integrate surface<br />
considerations such as ecosystems, First Nations l<strong>and</strong>s <strong>and</strong> best practices into a<br />
comprehensive development plan.<br />
8
7 Resource Assessment<br />
7.1 <strong>Gas</strong> Resources – <strong>North</strong> <strong>Yukon</strong> Basins<br />
Between November 2000 <strong>and</strong> June, 2005, the <strong>Yukon</strong> Geological Survey published a series of<br />
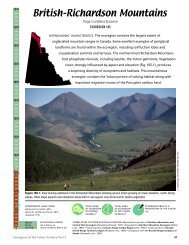
reports detailing the geology <strong>and</strong> resource potential of the <strong>North</strong> <strong>Yukon</strong> basins. The term<br />
“resource potential” refers to the total volumes of oil <strong>and</strong> gas that are inferred, from available<br />
geological <strong>and</strong> engineering data, to exist underground. Resource potential includes those<br />
volumes discovered to date plus those volumes that remain undiscovered.<br />
Figure 1: <strong>North</strong> <strong>Yukon</strong> Basins: Geographical Location <strong>and</strong> Resource Potential<br />
9
Details of the gas resource potential, as determined by the YGS, is included in Table 1<br />
below.<br />
Median <strong>Gas</strong> Expected Median<br />
Reservoir No. of Largest<br />
Basin <strong>and</strong> Play Potential Reservoirs Reservoir<br />
(Bcf) (Bcf)<br />
Eagle Plain<br />
Permian, Jungle Creek Formation S<strong>and</strong>stones stratigraphic gas 1,925 16 613<br />
Carboniferous, Hart Creek Formation S<strong>and</strong>stones <strong>and</strong> Carbonates stratigraphic gas 1,582 11 453<br />
L. Paleozoic (Cambrian to Middle Devonian) Carbonates stratigraphic gas 801 20 192<br />
L. Carboniferous Tuttle Formation S<strong>and</strong>stones stratigraphic gas 304 18 65<br />
L. Paleozoic (Cambrian to Middle Devonian) Carbonates structural gas 295 6 179<br />
Cretaceous S<strong>and</strong>stones structural gas 217 16 50<br />
Cretaceous S<strong>and</strong>stones stratigraphic gas 109 16 28<br />
Carboniferous, Hart Creek Formation S<strong>and</strong>stones <strong>and</strong> Carbonates structural gas 103 6 44<br />
Permian, Jungle Creek Formation S<strong>and</strong>stones structural gas 58 5 32<br />
Sub-Total<br />
Peel Plateau <strong>and</strong> Plain<br />
Peel Plain east of limit of deformation<br />
5,392 114 1,656<br />
Mesozoic clastics 1,640 55 118<br />
Upper Paleozoic clastics 237 9 48<br />
Paleozoic carbonate platform 2<br />
5 1 5<br />
Horn Plateau reef 3<br />
- 1 31<br />
Peel Plateau west of limit of deformation<br />
Mesozoic clastics 424 12 101<br />
Upper Paleozoic clastics 201 2 195<br />
Paleozoic carbonate margin 138 7 47<br />
Peel Plateau west of Trevor Fault<br />
Upper Paleozoic clastics 1<br />
10<br />
- 1 4<br />
Sub-Total 2,645 88 550<br />
K<strong>and</strong>ik<br />
Paleozoic marine structural 4<br />
481 10 171<br />
Mesozoic marine structural 5<br />
270 8 110<br />
Tertiary / Upper Cretaceous nonmarine 6<br />
101 30 30<br />
Sub-Total 852 48 311<br />
Bonnet Plume<br />
Lower Paleozoic Carbonate / Shale Facies Transition 601 6 236<br />
Upper Cretaceous-Tertiary Clastics 46 6 18<br />
Upper Cretaceous-Tertiary Clastic Subthrust 15 2 11<br />
Sub-Total 662 14 264<br />
<strong>North</strong> Coast *<br />
Herschel 7<br />
508 5 252<br />
<strong>Yukon</strong> Coastal Plain 299 3 212<br />
South Delta-Paleozoic 8<br />
65 15 61<br />
South Delta-Mesozoic 9<br />
15 8 14<br />
Sub-Total 886 31 539<br />
Old Crow **<br />
Upper Paleozoic carbonate 496 5 246<br />
Kekiktuk conglomerate 345 5 150<br />
Mesozoic clastics 10<br />
- 1 41<br />
Sub-Total 841 11 396<br />
* No allowance is made for portion of play within Ivvavik National Park <strong>and</strong> Herschel Isl<strong>and</strong> Territorial Park<br />
** No allowance is made for portion of play within Vuntut National Park<br />
1. Single accumulation expected with no median value predicted. Used mean play potential for median of largest pool.<br />
2. Single accumulation expected. Used meadian play potential for median of largest pool.<br />
3. Single accumulation expected with no median value predicted. Used mean play potential for median of largest pool.<br />
4. <strong>Yukon</strong> encompasses 52% of total play area<br />
5. <strong>Yukon</strong> encompasses 40 to 45% of total play area<br />
6. <strong>Yukon</strong> encompasses 35% of play area<br />
7. <strong>Yukon</strong> encompasses 81% of total play area<br />
8. <strong>Yukon</strong> encompasses 2.5% of total play area<br />
9. <strong>Yukon</strong> encompasses 2.5% of total play area<br />
10. Single accumulation expected with no median value predicted. Used mean play potential for median of largest pool.<br />
Table 1: <strong>North</strong> <strong>Yukon</strong> Basins <strong>Gas</strong> Resource Potential<br />
Totals 11,280 305 3,715
To put the size of the resource potential into perspective, Table 2 below is a comparison of<br />
published resource potential from other northern areas.<br />
Region Pipeline Resource Potential<br />
(Tcf)<br />
Alaska <strong>North</strong> Slope 1 AHPP 126.0<br />
Mackenzie Delta/Beaufort Sea 2 MVP 52.0<br />
<strong>North</strong> <strong>Yukon</strong> MVP or AHPP 11.3<br />
Table 2: Resource Potential Comparison<br />
The comparatively small size of the <strong>Yukon</strong> resource potential, in relation to the Alaska <strong>North</strong><br />
Slope <strong>and</strong> the Mackenzie Delta/Beaufort Sea, means that development in the <strong>North</strong> <strong>Yukon</strong><br />
is unlikely to proceed independently, but will depend upon being able to build a connecting<br />
pipeline to either the Mackenzie Valley Pipeline (“MVP”) or the Alaska Highway Pipeline<br />
Project (“AHPP”).<br />
The resource size <strong>and</strong> the proximity of each of the <strong>North</strong> <strong>Yukon</strong> basins to potential pipelines<br />
were the two factors considered in estimating where oil <strong>and</strong> gas activity is likely to develop<br />
first. All of the basins are 250 km or more away from the closest anticipated pipeline routes<br />
for MVP <strong>and</strong> AHPP. To justify building a 250 km lateral, our estimate is that a minimum of 1<br />
Tcf of gas would be required to guarantee a 20 year supply of gas. The resource potential<br />
of each of the <strong>North</strong> Coast, Old Crow, Bonnet Plume <strong>and</strong> K<strong>and</strong>ik basins falls below this<br />
threshold. In future, offshore development may increase the resources of the <strong>North</strong> Coast<br />
sufficiently to exceed the threshold. Also, coal-bed methane (“CBM”) resources could<br />
increase the potential within the Bonnet Plume basin. The YGS study for Bonnet Plume<br />
notes the presence of extensive coals however no gas content data is available that permits<br />
an assessment of the CBM volumes at this time. <strong>Development</strong> of CBM is expected to follow<br />
conventional gas exploration, <strong>and</strong> is projected to occur more than 20 years in the future.<br />
The Eagle Plain <strong>and</strong> Peel Plateau basins have the greatest resource potential <strong>and</strong> were<br />
therefore concluded to be the key areas for initial exploration. The proximity of Bonnet<br />
Plume to both Eagle Plain <strong>and</strong> Peel Plateau make it the logical choice as next-in-line for<br />
development.<br />
7.2 <strong>Gas</strong> Resources – Eagle Plain<br />
The YGS report on Eagle Plain is very recent, having been issued in June, 2005. The YGS<br />
assessment of the resource potential is significantly greater than previous estimates<br />
prepared by the National Energy Board (“NEB”) <strong>and</strong> the Canadian <strong>Gas</strong> Potential Committee<br />
(“CGPC”) <strong>and</strong> GLJ Petroleum Consultants. The GLJ numbers were available from their<br />
supply study report that was prepared for the MVP proponents.<br />
1 http://www.bp.com/sectiongenericarticle.do?categoryId=2011306&contentId=2016535<br />
2 “An Evaluation of the Economic Impacts Associated with the Mackenzie Valley <strong>Gas</strong> Pipeline <strong>and</strong> Mackenzie Delta<br />
<strong>Gas</strong> <strong>Development</strong>”, Wright Mansell Research Ltd., pS2<br />
11
A comparison of the GLJ <strong>and</strong> YGS gas-in-place (not gas resource) estimates for the Eagle<br />
Plain basin is shown in Table 3 below:<br />
Original <strong>Gas</strong>-in-Place Original <strong>Oil</strong>-in-Place<br />
GLJ YGS GLJ YGS<br />
Imperial Bcf Bcf MMbbls MMbbls<br />
Low 293 2379 - 132<br />
Best Estimate 607 6055 - 437<br />
High 1183 12000 - 926<br />
Table 3: <strong>Gas</strong>-in-Place Comparison, Eagle Plain Basin<br />
To underst<strong>and</strong> why the YGS resource numbers for Eagle Plain are higher than previous<br />
GLJ, NEB <strong>and</strong> CGPC studies, we quote from the YGS report as follows:<br />
“Much of the difference in the assessed values results from differences in input<br />
parameters, most specifically the number of expected prospects <strong>and</strong> the prospect<br />
level risks. Comparisons indicated that the CGPC routinely produces more<br />
conservative estimates than the assessors employed to prepare this report. Since<br />
the differences arise from subjective interpretations, extrapolations <strong>and</strong> selection of<br />
analogues, it is impossible to vindicate one interpretation over the other. However,<br />
historical analysis of basins assessments <strong>and</strong> even the historical vindication of<br />
individual plays, as presented above in the methodology section, indicates that there<br />
is a tendency to be conservative in the estimate of undiscovered potential, that is not<br />
borne out historically.<br />
Most notably, even the optimistic assessors of Western Canadian Sedimentary<br />
Basin crude oil <strong>and</strong> natural gas potential have found that the assessments of<br />
ultimate potential inferred between 10 <strong>and</strong> 20 years ago are now seen to be smaller<br />
that the established reserve, while the basin is still an active <strong>and</strong> successful target of<br />
continued exploration. Whether the estimates produced herein will also be shown to<br />
be conservative cannot be known now, but the trends of history, in basins with much<br />
more data <strong>and</strong> activity, suggest that assessments performed early in the exploratory<br />
history of a basin are a very conservative relative to the ultimate potential proved by<br />
decades of active exploration <strong>and</strong> thous<strong>and</strong>s of wells. Certainly the numerous<br />
indications of petroleum in wells in the Eagle Plain Basin suggest that it should be<br />
considered a highly prospective region, which would tend to prefer the current<br />
assessment over the previous efforts…” 3<br />
Which number is correct? At this early stage of development, there is no “correct” number,<br />
just a range of estimates. The YGS study is the most comprehensive work to date, having<br />
taken two or more years to complete. GLJ did not have the benefit of the YGS report (the<br />
GJL report was issued in May 2005). Also, the MVP proponents have stated they do not<br />
wish to build a lateral pipeline to the <strong>Yukon</strong> <strong>and</strong> hence it is underst<strong>and</strong>able that they may not<br />
have given GLJ a m<strong>and</strong>ate to study the <strong>Yukon</strong> in depth. (see further discussion in the<br />
Pipelines Timeline <strong>and</strong> Regulations section of this report).<br />
3 YGS Open File 2005-2/GSC Open File 4922. pp 80-81.<br />
12
We estimate that 1.9 Tcf of gas will be required to fill the <strong>North</strong> <strong>Yukon</strong> <strong>Gas</strong> Pipeline<br />
(“NYGP”) for 20 years. Our view therefore is that, even if the YGS median gas resource<br />
estimate of 5.39 Tcf is optimistic, finding 1.9 Tcf is reasonable <strong>and</strong> we conclude that the<br />
eventual construction of NYGP is feasible.<br />
This study used the YGS resource estimates in preparing the expected development<br />
scenario.<br />
7.3 <strong>Gas</strong> Resources – Peel Plateau<br />
With estimated gas resources of 2.6 Tcf, Peel Plateau has the potential for justifying the<br />
NYGP on a st<strong>and</strong> alone basis. The rugged topography in the Peel area suggests that<br />
development will lag Eagle Plain.<br />
7.4 <strong>Oil</strong> Resources – Eagle Plain<br />
Table 4 below is a summary of the potential oil resources within the <strong>Yukon</strong> as determined by<br />
the YGS. Note that Peel Plateau basin is not predicted to be oil-prone.<br />
Median <strong>Oil</strong> Play Expected Median<br />
Reservoir No. of Largest<br />
Basin <strong>and</strong> Play Potential Reservoirs Reservoir<br />
(MMbbls) (MMbbls)<br />
Eagle Plain<br />
Permian, Jungle Creek Formation S<strong>and</strong>stones structural oil 87 4 51<br />
Carboniferous, Hart Creek Formation S<strong>and</strong>stones <strong>and</strong> Carbonates structural oil 69 5 31<br />
Carboniferous, Hart Creek Formation S<strong>and</strong>stones <strong>and</strong> Carbonates stratigraphic oil 68 5 32<br />
L. Carboniferous Tuttle Formation S<strong>and</strong>stones stratigraphic oil 62 5 28<br />
Cretaceous S<strong>and</strong>stones structural oil 60 6 25<br />
Cretaceous S<strong>and</strong>stones stratigraphic oil 36 7 14<br />
Sub-Total<br />
K<strong>and</strong>ik<br />
382 32 182<br />
Paleozoic marine structural 1<br />
85 3 72<br />
Tertiary / Upper Cretaceous nonmarine 2<br />
76 30 23<br />
Sub-Total<br />
<strong>North</strong> Coast *<br />
160 33 94<br />
Herschel 3<br />
195 5 98<br />
South Delta-Mesozoic 4<br />
5 4 4<br />
Sub-Total 200 9 102<br />
* No allowance is made for portion of play within Ivvavik National Park <strong>and</strong> Herschel Isl<strong>and</strong> Territorial Park<br />
1. <strong>Yukon</strong> encompasses 15% of total play area<br />
2. <strong>Yukon</strong> encompasses 35% of total play area<br />
3. <strong>Yukon</strong> encompasses 81% of total play area<br />
4. <strong>Yukon</strong> encompasses 2.5% of total play area<br />
13<br />
Totals 742 74 228<br />
Table 4: Eagle Plain <strong>and</strong> Peel Plateau/Plain Plays <strong>and</strong> Resource Potential<br />
The oil resources are 44% of the size of the gas resources within the <strong>North</strong> <strong>Yukon</strong>, based on<br />
a conversion factor of 6.77 Mcf/bbl. Natural gas is the main attraction for producing<br />
companies <strong>and</strong> will form the backbone of development in <strong>North</strong> <strong>Yukon</strong>, but gas production<br />
will be dependant on a connecting pipeline to MVP or AHPP. Conversely, oil development<br />
will be dependant on local dem<strong>and</strong> in the <strong>Yukon</strong>, albeit some of that dem<strong>and</strong> may come<br />
from the construction of the NYGP.
8 Pipelines<br />
8.1 Mackenzie Valley Pipeline<br />
This report has been compiled between August <strong>and</strong> November, 2005 <strong>and</strong>, as such, reflects<br />
the current state of knowledge about the Mackenzie Valley Pipeline (“MVP”) <strong>and</strong> Alaska<br />
Highway Pipeline Project (“AHPP”) applications. <strong>Development</strong> of <strong>North</strong> <strong>Yukon</strong> gas<br />
resources is dependent on one of the two pipelines proceeding whereas development of the<br />
oil resources could proceed independently, without the need for any pipelines.<br />
The MVP will be closer to Eagle Plain <strong>and</strong> is the more economical option however a tie-in to<br />
either MVP or AHPP is technically feasible.<br />
The Mackenzie Valley Pipeline is a joint venture between Imperial <strong>Oil</strong> Ventures Limited, the<br />
Aboriginal Pipeline Group (“APG”), ConocoPhilips Canada (<strong>North</strong>) Limited, Shell Canada<br />
Limited <strong>and</strong> ExxonMobil Canada Properties (collectively called the Mackenzie Valley<br />
Pipeline Co-Venturers). TransCanada Pipelines (“TCPL”) is providing funding to APG in<br />
return for rights to acquire an interest in the pipeline <strong>and</strong> future expansions as well as a<br />
financial return if the project goes ahead.<br />
The MVP will be a 30 inch pipe extending 1220 km from Inuvik to northern Alberta where it<br />
will tie into the existing TCPL system (Figure 2). Initially the MVP will transport gas volumes<br />
of 1.2 Bcf/d with expansion capacity to 1.9 Bcf/d upon installation of additional compression.<br />
To put this in perspective, the pipeline will transport enough gas to heat between 5 <strong>and</strong> 8<br />
million Canadian homes. In addition, a liquids pipeline will run parallel to the gas pipeline<br />
route from Inuvik to Norman Wells where it will connect with the existing oil pipeline. Total<br />
cost of the pipeline is estimated at $7.7 billion Cdn.<br />
4 http://www.mackenziegasproject.com/theProject/<br />
Figure 2: Proposed MVP Route 4<br />
14
In a press release dated April 28, 2005 Imperial <strong>Oil</strong>, on behalf of the Mackenzie Valley Co-<br />
Venturers announced that all geotechnical, engineering <strong>and</strong> construction contract work was<br />
halted due to “insufficient progress on key areas critical to the project – the finalization of<br />
benefits <strong>and</strong> access agreements <strong>and</strong> the establishment of a clear regulatory process,<br />
including timelines”. The benefits in question included hospitals, schools <strong>and</strong> other<br />
infrastructure to be built by MVP in First Nations communities. Imperial went on to express<br />
concern that the “Co-Venturers were being asked to assume responsibility for matters<br />
beyond the project scope <strong>and</strong> that they had asked the Canadian Federal <strong>and</strong> <strong>North</strong>West<br />
Territories governments to take ownership of these matters”.<br />
Just before this report was finalized, Imperial <strong>Oil</strong> issued a press release on November 23,<br />
2005, that it had “advised the National Energy Board” that, given recent progress in a<br />
number of key areas, the proponents are now ready to proceed to public hearings on the<br />
proposed project, with the expectation that recently negotiated benefits <strong>and</strong> access<br />
agreement terms with northern aboriginal groups will be fully ratified <strong>and</strong> executed in<br />
December 2005.” 5<br />
8.2 Alaska Highway Pipeline Project<br />
The Alaska Highway Pipeline Project is being promoted by the <strong>North</strong> Slope Producers<br />
Group consisting of BP, ExxonMobil <strong>and</strong> ConocoPhilips. Note that ExxonMobil <strong>and</strong><br />
ConocoPhilips are also members of the Mackenzie Producers Group. The AHPP would<br />
consist of a 48 to 52 inch pipeline extending 2916 km from the gas fields at Prudhoe Bay in<br />
Alaska, through Fairbanks <strong>and</strong> Whitehorse <strong>and</strong> on through northeastern British Columbia to<br />
Boundary Lake on the British Columbia/Alberta border where the new pipeline will connect<br />
with the existing TCPL gas system (Figure 3).<br />
Figure 3: Proposed AHPP route 6<br />
5<br />
http://www.mackenziegasproject.com/moreInformation/upload/MGP_readiness_112305.pdf<br />
6<br />
http://www.emr.gov.yk.ca/pipeline/ahpp.html<br />
15
Initial capacity on AHPP will be 4.5 Bcf/d with an ultimate capacity of 6.0 Bcf/d as<br />
compression is added. Costs are estimated to be in the order of $25 - 30 billion Cdn. 7<br />
Planning for the AHPP began in the 1970’s. The “pre-build” portion of the line was built by<br />
Foothills Pipelines in the 1980’s <strong>and</strong> 1990’s from Caroline, Alberta to markets in eastern<br />
Canada <strong>and</strong> the US. Foothills is now wholly owned by TCPL who maintain that they still<br />
hold the rights, under the <strong>North</strong>ern Pipeline Act (“NPA”) to build the remaining Canadian<br />
portion of the line through the <strong>Yukon</strong> <strong>and</strong> northern British Columbia. Regulatory approvals<br />
for the pipeline were issued under the NPA <strong>and</strong>, if implemented, would reduce the planning<br />
phase by 2 – 3 years, giving the AHPP a time advantage over MVP. Nonetheless, BP is<br />
questioning the validity of the now 30 year old NPA, <strong>and</strong> new hearings in front of the NEB<br />
may result, again delaying the project.<br />
8.3 Pipeline Timeline <strong>and</strong> Regulations<br />
Which pipeline will proceed first? Each has its own regulatory hurdles. The general<br />
consensus in the media is that MVP is closer to being constructed however, if delayed,<br />
AHPP could leap ahead. From the perspective of the development scenarios <strong>and</strong><br />
prospective social benefits contemplated in this report, one of the two pipelines must be built<br />
first before a lateral can be constructed to connect northern <strong>Yukon</strong> gas to southern markets.<br />
Eventually both pipelines are expected to be built however the first will have a distinct<br />
advantage in meeting the immediate market dem<strong>and</strong> <strong>and</strong> the laggard will likely be delayed<br />
for a number of years until market dem<strong>and</strong> again exceeds supply. An extensive discussion<br />
of the <strong>North</strong> American supply/dem<strong>and</strong> situation can be found in a report prepared by<br />
Navigant Consulting, Inc. <strong>and</strong> Environmental Analysis, Inc. in support of the MVP. 8<br />
The only certainty is that MVP <strong>and</strong> AHPP construction will be staged as there are not<br />
enough pipeline crews <strong>and</strong> steel mills to build both large-diameter pipelines at once. For the<br />
purposes of this study, it has been assumed that the MVP issues will be resolved by 2008<br />
<strong>and</strong> that the pipeline will come on-stream in 2014. The AHPP pipeline has been assumed to<br />
come on-stream in 2018. The resulting timelines are shown in Figure 4.<br />
Figure 4: Pipeline Timelines<br />
7 http://www.camput.org/documents/Kvisle-paper.pdf<br />
8 http://www2.ngps.nt.ca/applicationsubmission/navigant.html<br />
16
Two, inter-related, issues with respect to the MVP are key to development of <strong>North</strong> <strong>Yukon</strong><br />
gas resources. The first is that the <strong>Yukon</strong> government has intervened in the MVP hearings,<br />
advocating that MVP should be regulated as a “basin opening” pipeline <strong>and</strong> that tariffs for<br />
any laterals such as the NYGP would be rolled into the rate base of the entire MVP system.<br />
MVP’s opening position is that it is a dedicated pipeline for the Mackenzie Producers Group<br />
<strong>and</strong> that it will not contemplate building laterals. The <strong>Yukon</strong> government commissioned a<br />
report from Confer Consulting Ltd. that concluded that the public good was best served if<br />
costs for all extensions to the MVP were rolled into the rate base. 9<br />
The second, <strong>and</strong> greatest, issue of relevance to the <strong>Yukon</strong> at the MVP hearings is the<br />
estimated size of natural gas resources in the <strong>North</strong> <strong>Yukon</strong>. As discussed earlier in this<br />
report, the MVP proponents submitted a <strong>Gas</strong> Resource <strong>and</strong> Supply Study 10 prepared by<br />
GLJ Petroleum Consultants, an engineering consulting firm. The GLJ report, dated May 1,<br />
2004, focused principally on the resource potential in the Mackenzie delta, offshore <strong>and</strong><br />
Coleville Hills <strong>and</strong> briefly addressed Eagle Plain. They relied upon two previous geological<br />
<strong>and</strong> engineering studies, one conducted by the NEB in 2000 <strong>and</strong> another conducted by the<br />
Canadian <strong>Gas</strong> Potential Committee (“CGPC”) in 2001. GLJ concluded that Eagle Plain “has<br />
been excluded at this time because the currently recognized resource potential is insufficient<br />
to support a separate, connecting pipeline”. As part of its intervention in the NEB hearing,<br />
the <strong>Yukon</strong> government has submitted the YGS study to counter this argument.<br />
8.4 <strong>North</strong> <strong>Yukon</strong> <strong>Gas</strong> Pipeline Routes<br />
Four connecting pipeline scenarios have been contemplated <strong>and</strong> prioritized in Table 5:<br />
Rank Source Destination Connecting<br />
Pipeline<br />
17<br />
Distance<br />
(km)<br />
1 Eagle Plain Inuvik, NWT MVP 350<br />
2 Eagle Plain Tok, Alaska AHPP 513<br />
3 Eagle Plain Whitehorse, YT AHPP 750<br />
4 Eagle Plain Little Chicago, NWT MVP 400<br />
Table 5: NYGP Route Options <strong>and</strong> Distances<br />
The route from Eagle Plain to Inuvik would follow the Dempster highway <strong>and</strong> is the shortest,<br />
easiest <strong>and</strong> least expensive pipeline route however compression costs will be higher due to<br />
the higher operating pressure of MVP. Option 2 is an interconnect to AHPP with the<br />
shortest route being a connection at Tok, Alaska. Part of the route follows the Dempster<br />
Highway for 253 km to the Dawson junction <strong>and</strong> then follows the Top of the World Highway<br />
to Tok. Higher pipelining costs have been included for this steep portion of the route.<br />
Option 3 is a significantly longer tie-in to AHPP at Whitehorse but has lower costs per<br />
kilometer as it has less topographical relief <strong>and</strong> follows existing road allowances for its entire<br />
distance. It also has the benefit of retaining all of the infrastructure within the <strong>Yukon</strong><br />
Territory. The last, <strong>and</strong> least likely option, is a direct connection to MVP at their first<br />
compressor site named Little Chicago, north of Fort Good Hope. In order for this option to<br />
9<br />
https://www.neb-one.gc.ca/lleng/livelink.exe/fetch/2000/90464/90550/338535/338661/343078/345737/367972/A0R0Q7_-<br />
_Written_Evidence.pdf?nodeid=367979&vernum=0<br />
10<br />
www2.ngps.nt.ca/applicationsubmission/Documents/MGP_GLJ_Final_<strong>Gas</strong>_Resources_<strong>and</strong>_Supply_Study_Conte<br />
nts_Set_3_S.pdf
have merit, significant reserves would need to be discovered at Peel Plain which would<br />
justify situating the major pipeline in that direction. Construction costs are significantly<br />
higher for this option as the route is across difficult terrain. The four option routes are<br />
illustrated in Figure 5.<br />
18
`<br />
Figure 5: NYGP Route Options<br />
8.5 <strong>North</strong> <strong>Yukon</strong> <strong>Gas</strong> Pipeline Size<br />
A connecting pipeline from Eagle Plain to either MVP or AHPP is expected to be 12”, 16” or<br />
20” (305 mm, 406 mm or 508 mm) in diameter. Costs to prepare a pipeline right-of-way are<br />
a large portion of the costs <strong>and</strong> are the same regardless of the pipeline size. A pipeline<br />
smaller than 12” would have insufficient gas flow to justify the high right-of-way costs. At the<br />
other end of the spectrum, our view is that the size of the Eagle Plain resource, <strong>and</strong> the<br />
expected discovery rate, does not merit a pipeline larger than 20”.<br />
A computer simulation of the three pipeline pipeline options was undertaken using Fekete’s<br />
F.A.S.T. Piper TM software to determine throughput <strong>and</strong> compression requirements. Pipeline<br />
operating pressure was assumed to be 12.4 MPa (1800 psi). By comparison, AHPP was<br />
19
originally contemplated to operate at 14.1 MPa (2050 psi) but the final design pressure may<br />
be at higher. MVP has been designed to operate at 18 MPa (2610 psi).<br />
Maximum gas rates were determined by imposing a maximum frictional pressure loss of<br />
16.5 kPa/km (4 psi/mile) <strong>and</strong> one compressor station per 250 km. A base case was then<br />
run assuming the maximum gas rate was reduced by a factor of 1.6. Major pipelines are<br />
generally constructed with sufficient compression for the base case <strong>and</strong> then exp<strong>and</strong>ed by<br />
1.6 times with the installation of additional compression to achieve the maximum gas rate.<br />
Both MVP <strong>and</strong> AHPP have been designed on this basis.<br />
The resulting gas base <strong>and</strong> maximum gas rates are shown in Table 6 below:<br />
Pipe Size<br />
Case <strong>Gas</strong> Rate<br />
(MMcf/d)<br />
305 mm(12”) Base 69<br />
Max 110<br />
406 mm (16”) Base 138<br />
Max 220<br />
508 mm (20’) Base 256<br />
Max 410<br />
Table 6: Pipeline Sizes <strong>and</strong> <strong>Gas</strong> Rates<br />
Pipelining <strong>and</strong> compression costs have been gathered from Fekete’s internal files <strong>and</strong> from<br />
published details for MVP. Costs vary according to the type of terrain, the size of the pipe<br />
<strong>and</strong> the amount of compression required. The results are summarized in Table 7:<br />
20
Distances (km) EP to Inuvik EP to Tok EP to WT EP to LC<br />
All Weather Road Distance 350 513 750<br />
Off Road Distance 0 0 400<br />
<strong>Gas</strong> Rates (MMcf/d)<br />
305 mm (12") - Base 69 69 69 69<br />
305 mm (12") - Max 110 110 110 110<br />
406 mm (16") - Base 138 138 138 138<br />
406 mm (16") - Max 220 220 220 220<br />
508 mm (20") - Base 256 256 256 256<br />
508 mm (20") - Max 410 410 410 410<br />
Pipelining Costs (MM$)<br />
305 mm (12") 525 1,000 1,125 1,229<br />
406 mm (16") 560 1,067 1,200 1,312<br />
508 mm (20") 595 1,134 1,275 1,400<br />
Compression Requirements (HP)<br />
305 mm (12") - Base 9,000 7,900 8,600 8,800<br />
305 mm (12") - Max 17,300 21,200 24,800 16,800<br />
406 mm (16") - Base 17,700 15,400 16,800 17,400<br />
406 mm (16") - Max 34,400 37,300 43,500 32,300<br />
508 mm (20") - Base 25,200 21,400 24,200 24,900<br />
508 mm (20") - Max 51,400 65,100 77,800 49,300<br />
Compression Costs (MM$)<br />
305 mm (12") - Base 81 71 77 79<br />
305 mm (12") - Max 156 191 223 151<br />
406 mm (16") - Base 159 139 151 157<br />
406 mm (16") - Max 310 336 392 291<br />
508 mm (20") - Base 227 193 218 224<br />
508 mm (20") - Max 463 586 700 444<br />
Total Costs (MM$)<br />
305 mm (12") - Base 606 1,071 1,202 1,308<br />
305 mm (12") - Max 681 1,191 1,348 1,380<br />
406 mm (16") - Base 719 1,206 1,351 1,469<br />
406 mm (16") - Max 870 1,403 1,592 1,603<br />
508 mm (20") - Base 822 1,326 1,493 1,624<br />
508 mm (20") - Max 1,058 1,720 1,975 1,844<br />
Cost/Rate (MM$/MMcf/d)<br />
305 mm (12") - Base 8.78 15.53 17.43 18.96<br />
305 mm (12") - Max 6.19 10.83 12.26 12.55<br />
406 mm (16") - Base 5.21 8.74 9.79 10.64<br />
406 mm (16") - Max 3.95 6.38 7.23 7.29<br />
508 mm (20") - Base 3.21 5.18 5.83 6.34<br />
508 mm (20") - Max 2.58 4.19 4.82 4.50<br />
Table 7: Pipeline Size Analysis<br />
The conclusion is that a 508 mm (20” line) from Eagle Plain to an MVP connection at Inuvik<br />
is the most economically viable option with an initial rate of 256 Mcf/d <strong>and</strong> capacity to<br />
increase to 410 MMcf/d with additional compression.<br />
21
This report does not advocate a 508 mm (20”) pipeline as the only economic option, merely<br />
that it appears to be a reasonable choice <strong>and</strong> reflects the type of activity that may be<br />
expected in <strong>North</strong> <strong>Yukon</strong>.<br />
8.6 <strong>North</strong> <strong>Yukon</strong> <strong>Gas</strong> Pipeline Timeline<br />
As discussed above, MVP is projected to come on-stream in 2014. We expect that NYGP<br />
will tie into MVP as it is the closer, less expensive <strong>and</strong> earlier option. We estimate an onstream<br />
date of 2017 for NYGP as this would give MVP sufficient time to install the additional<br />
compression required to h<strong>and</strong>le the gas volumes flowing in from NYGP. We estimate that<br />
NYGP will deliver the base rate of 256 MMcf/d into MVP in 2017 <strong>and</strong> that the rate will<br />
increase to the maximum NYGP capacity of 410 MMcf/d in 2021.<br />
Even if MVP comes on earlier, it will still take five years for gas development at Eagle Plain<br />
to be ready to justify proceeding to the approval process for the <strong>North</strong> <strong>Yukon</strong> gas pipeline,<br />
meaning that the earliest this could proceed would be 2011, or one year earlier than shown<br />
in Figure 6. Overall, the timelines may move forward or back by one or two years, but our<br />
estimate of the activity levels doesn’t change.<br />
Figure 6: NYGP Timeline<br />
22
9 <strong>Development</strong> <strong>Scenario</strong><br />
9.1 Operating Economics<br />
Before considering where to drill, it is first necessary to conduct an economic test of whether<br />
the production of gas in <strong>North</strong> <strong>Yukon</strong> is profitable. This test evaluates whether gas<br />
producers can make an operating profit once the gas is on production. If this test fails,<br />
operators will not even consider drilling as they would not realize the positive cashflow<br />
needed to payout their investment in drilling, pipelines <strong>and</strong> facilities.<br />
Table 8 below illustrates the operating netback calculation on a year by year basis.<br />
Beginning with the forecasted price of natural gas in the Alberta market (AECO Hub price<br />
from Fekete’s price forecast), pipeline tariffs (Intra-Alberta, MVP <strong>and</strong> the estimated NYGP<br />
tariff) are deducted to yield a net sales price at Eagle Plain. After paying local<br />
compression/processing costs, the <strong>Yukon</strong> royalty of 10% is then calculated on the wellhead<br />
price. Finally, operating costs (fixed plus variable) are deducted to arrive at the net<br />
operating profit (right-h<strong>and</strong> column in Table 8). Fixed costs include wages <strong>and</strong> benefits,<br />
overhead <strong>and</strong> maintenance, items that do not fluctuate with production rates. Variable<br />
operating costs include consumables such as fuel.<br />
The analysis shows that companies can expect to make an operating profit. Whether the<br />
operating cashflow is sufficient to payout the drilling investment will depend on how<br />
successful companies are in their exploration efforts, a question that is outside the scope of<br />
this study. What this analysis says is that the <strong>North</strong> <strong>Yukon</strong> has positive economics that will<br />
attract competitive exploration from numerous companies.<br />
Note that the price for gas is forecasted to decline from the current level of $10.69/Mcf to a<br />
low of $6.80/Mcf in 2010, reflecting an expected softening of the supply/dem<strong>and</strong> balance as<br />
new gas production is brought on-stream in response to the current high prices.<br />
Nonethless, the operating profit is predicted to be positive in all years. Production is not<br />
expected to commence until 2017 however if that timeframe is either accelerated or<br />
delayed, a positive cashflow remains attainable.<br />
23
Fekete<br />
AECO-C<br />
<strong>Gas</strong> Price<br />
Forecast<br />
Intra-<br />
Alberta<br />
Tariffs ($/Mcf)<br />
MVP NYGP<br />
Total<br />
Tariffs<br />
Net <strong>Gas</strong><br />
Price<br />
at Eagle<br />
Plain<br />
Facilty/<br />
Comp.<br />
Cost<br />
24<br />
Wellhead<br />
Price<br />
Royalty<br />
@<br />
10%<br />
Fixed<br />
Operating<br />
Costs 1,2<br />
Variable<br />
Operating<br />
Costs 2<br />
Total<br />
Operating<br />
Costs 2<br />
Net<br />
Operating<br />
Profit 3,4<br />
Year<br />
$Cdn $/Mcf $/Mcf $/Mcf $/Mcf $/Mcf $/Mcf $/Mcf $/Mcf $/well/month $/Mcf $/Mcf $/Mcf<br />
2005 (Q4) 10.69 0.31 1.29 0.45 2.05 8.64 $0.25 $8.39 0.84 $ 7,500.00 $ 0.60 $ 1.74 $ 6.90<br />
2006 9.66 0.31 1.29 0.45 2.05 7.61 $0.25 $7.36 0.74 $ 7,725.00 $ 0.60 $ 1.64 $ 5.97<br />
2007 8.57 0.31 1.29 0.45 2.05 6.52 $0.25 $6.27 0.63 $ 7,956.75 $ 0.60 $ 1.53 $ 4.99<br />
2008 7.68 0.31 1.29 0.45 2.05 5.64 $0.25 $5.39 0.54 $ 8,195.45 $ 0.60 $ 1.44 $ 4.20<br />
2009 6.80 0.31 1.29 0.45 2.05 4.75 $0.25 $4.50 0.45 $ 8,441.32 $ 0.60 $ 1.36 $ 3.40<br />
2010 7.14 0.31 1.29 0.45 2.05 5.09 $0.25 $4.84 0.48 $ 8,694.56 $ 0.60 $ 1.39 $ 3.70<br />
2011 7.49 0.31 1.29 0.45 2.05 5.45 $0.25 $5.20 0.52 $ 8,955.39 $ 0.60 $ 1.43 $ 4.02<br />
2012 7.87 0.31 1.29 0.45 2.05 5.82 $0.25 $5.57 0.56 $ 9,224.05 $ 0.60 $ 1.47 $ 4.35<br />
2013 8.26 0.31 1.29 0.45 2.05 6.22 $0.25 $5.97 0.60 $ 9,500.78 $ 0.60 $ 1.51 $ 4.71<br />
2014 8.68 0.31 1.29 0.45 2.05 6.63 $0.25 $6.38 0.64 $ 9,785.80 $ 0.60 $ 1.55 $ 5.08<br />
2015 9.11 0.31 1.29 0.45 2.05 7.06 $0.25 $6.81 0.68 $ 10,079.37 $ 0.60 $ 1.60 $ 5.47<br />
2016 9.57 0.31 1.29 0.45 2.05 7.52 $0.25 $7.27 0.73 $ 10,381.75 $ 0.60 $ 1.64 $ 5.87<br />
2017 10.04 0.31 1.29 0.45 2.05 8.00 $0.25 $7.75 0.77 $ 10,693.21 $ 0.60 $ 1.69 $ 6.30<br />
2018 10.55 0.31 1.29 0.45 2.05 8.50 $0.25 $8.25 0.82 $ 11,014.00 $ 0.60 $ 1.75 $ 6.75<br />
2019 11.07 0.31 1.29 0.45 2.05 9.03 $0.25 $8.78 0.88 $ 11,344.42 $ 0.60 $ 1.80 $ 7.22<br />
2020 11.63 0.31 1.29 0.45 2.05 9.58 $0.25 $9.33 0.93 $ 11,684.76 $ 0.60 $ 1.86 $ 7.72<br />
Notes: 1 Average well rate of 5.0 MMcf/d.<br />
2 Assumes annual inflation rate of 3%<br />
3 Net operating profit before (risked) capital investment for seismic, drilling, roads <strong>and</strong> pipelines.<br />
4 All prices <strong>and</strong> costs in $Cdn<br />
Table 8: Operating Netback Analysis
9.2 Drilling Fairways – <strong>Gas</strong><br />
Whereas it is the size of the <strong>North</strong> <strong>Yukon</strong> resources that justifies the construction of a gas<br />
pipeline, it is the distribution of the resources, both geographically <strong>and</strong> by depth, that will<br />
dictate the level of field activity including seismic, drilling, pipeline <strong>and</strong> road construction.<br />
The majority of the drilling will target gas plays.<br />
Referring back to Table 1, the gas plays are categorized as structural <strong>and</strong> stratigraphic<br />
traps. Historically drilling has targeted the structural plays as they are easier to identify on<br />
seismic which explain why the wells drilled to date have been clustered around the two<br />
major structural highs at Chance <strong>and</strong> Blackie. While gas <strong>and</strong> oil have been discovered in<br />
these plays, the size of the individual pools discovered are relatively small. The YGS study<br />
concludes the larger targets are the stratigraphic plays, particularly in the Jungle Creek, Hart<br />
Creek <strong>and</strong> Tuttle Formations that occur at depths of 500 to 3500 metres (Figure 7), well<br />
within the capability of st<strong>and</strong>ard drilling rigs in western Canada.<br />
Figure 7: Eagle Plain Geological Cross Section 11<br />
Geographically, the Jungle Creek formation is limited to the Blackie area of the Eagle Plain<br />
basin, southeast of the Dempster Highway. The Hart Creek <strong>and</strong> Tuttle formations are also<br />
present in the Blackie area <strong>and</strong> the prospectivity of encountering multiple horizons in this<br />
area leads us to predict that it will be the prime area for drilling. From the southeast, drilling<br />
11 YGS Open File 2005-02: Figure 9<br />
25
will progress through the discovered pools at Chance <strong>and</strong> will continue northward following<br />
the Hart Creek <strong>and</strong> Tuttle trends. Natural topographical obstructions consisting of the<br />
Porcupine River to the west <strong>and</strong> the Eagle River to the east are expected to focus drilling<br />
within this fairway (Figure 8).<br />
Exploration<br />
Fairway<br />
Figure 8: Exploration Fairway<br />
9.3 Drilling Timeframe <strong>and</strong> Number of Wells – <strong>Gas</strong><br />
To date, 33 wells have been drilled at Eagle Plain <strong>and</strong> 19 at Peel Plateau/Plain within the<br />
<strong>Yukon</strong> <strong>and</strong> an additional 24 in the NWT. Much of this drilling occurred between 1957 <strong>and</strong><br />
1985. Drilling has been suspended due to the lack of a gas pipeline.<br />
In order to contract for pipeline capacity, operating companies will need to be assured that<br />
they have sufficient gas reserves to deliver the fixed contract volume for 20 years. Our<br />
NYGP base case is 256 MMcf/d which, over twenty years, equals 1.9 Tcf. We predict that<br />
operating companies will drill exploration wells until they have discovered approximately half<br />
this amount, or 934 Bcf <strong>and</strong> have sufficient confidence that the remaining 934 Bcf can be<br />
discovered. At that time, we predict that drilling activity will cease until a pipeline is<br />
approved <strong>and</strong> operators are certain that any future wells can be produced.<br />
The number of exploration wells required to discover 934 Bcf of gas depends on the drilling<br />
success rate, defined as the number of exploration wells that need to be drilled in order to<br />
discover one gas pool. The YGS study provides an indication of expected success rates by<br />
providing estimates of the number of prospects <strong>and</strong> number of pools in each formation as<br />
shown in Table 9.<br />
26
Exploration Delineation <strong>Development</strong><br />
Success Success Success<br />
Area Play # Formation Play Type Pools Prospects Rate Rate Rate<br />
Eagle Plain Play 1 Eagle Plain Gp Stratigraphic 16 58 3.63 1.67 1.25<br />
Eagle Plain Play 2 Eagle Plain Gp Structural 16 57 3.56 1.67 1.25<br />
Eagle Plain Play 3 Jungle Creek Stratigraphic 16 55 3.44 1.67 1.25<br />
Eagle Plain Play 4 Jungle Creek Structural 5 31 6.20 1.67 1.25<br />
Eagle Plain Play 5 Hart Creek Stratigraphic 11 45 4.09 1.67 1.25<br />
Eagle Plain Play 6 Hart Creek Structural 6 23 3.83 1.67 1.25<br />
Eagle Plain Play 7 Tuttle Stratigraphic 18 113 6.28 1.67 1.25<br />
Table 9: Drilling Success Rates<br />
Once a pool is discovered by an exploration well, delineation wells are drilled to define the<br />
boundaries <strong>and</strong> confirm the size of the pool. When the pool is scheduled to be placed on<br />
production, additional development wells are drilled to provide sufficient gas flowrate to fill<br />
the pipeline on a daily basis. Delineation <strong>and</strong> development well success rates have been<br />
estimated by Fekete.<br />
Finally, in our calculations we have estimated 1 in 6.66 wells will encounter more than one<br />
pool, as shown in Figure 9, thereby reducing the total number of wells needed.<br />
12 Source: <strong>Yukon</strong> OGMB<br />
Figure 9: Illustration of stacked pools in Eagle Plain Basin 12<br />
27
The YGS reports provide a statistical distribution of the size of the 114 gas pools at Eagle<br />
Plain, sorted by formation <strong>and</strong> pool size. Operating companies will drill the largest, least<br />
expensive (i.e. shallowest) targets first, however, there will be hits <strong>and</strong> misses. Modeling of<br />
the discovery sequence has been done by applying weighting factors to the formation depth<br />
<strong>and</strong> pool size. A third, r<strong>and</strong>om weighting factor was applied to each pool to account for the<br />
unpredictability of the size of each discovery. A graph of the projected discovery order is<br />
shown in Figure 10.<br />
Pool Size - Marketable <strong>Gas</strong> (Bcf)<br />
600<br />
500<br />
400<br />
300<br />
200<br />
100<br />
Eagle Plain<br />
Projected Pool Discovery Sequence<br />
0<br />
0 20 40 60 80 100 120<br />
28<br />
Pools<br />
Figure 10: Predicted Pool Discovery Sequence
Marketable <strong>Gas</strong> Discovered (Bcf)<br />
5,000<br />
4,000<br />
3,000<br />
2,000<br />
1,000<br />
Eagle Plain<br />
Cumlative <strong>Gas</strong> Discovered<br />
0<br />
0 100 200 300 400 500 600 700<br />
# of Exploration + Delineation Wells Drilled<br />
Figure 11: Cumulative <strong>Gas</strong> Discoveries<br />
29<br />
NYGP Max <strong>Gas</strong> Threshold<br />
NYGP Base Case <strong>Gas</strong> Threshold<br />
Figure 11 shows the same data as Figure 10 but with the vertical axis plotted as cumulative<br />
gas discovered. The graph show that 28 exploration wells will need to be drilled to discover<br />
the threshold 934 Bcf of reserves. Thereafter, drilling will proceed to i) discover enough<br />
additional gas reserves to justify exp<strong>and</strong>ing the NYGP <strong>and</strong> ii) to drill the development wells<br />
to ensure sufficient daily gas production to fill the pipeline.<br />
An average initial flowrate of 5.0 MMcf/d has been used for all wells. Data available to date<br />
shows rates from 0.5 to 10 MMcf/d. An annual decline rate of 15% was applied to all wells.<br />
Figure 12 below illustrates the contribution of the pools, in the discovery sequence<br />
corresponding to Figure 9.<br />
The total number of drilling pads (up to 4 wells per pad), production wells <strong>and</strong> the total<br />
number of wells drilled is shown in Figure 13.
Total Marketable <strong>Gas</strong> Rate (MMcf/d)<br />
450.0<br />
400.0<br />
350.0<br />
300.0<br />
250.0<br />
200.0<br />
150.0<br />
100.0<br />
50.0<br />
0.0<br />
Production Forecast by Pool - Eagle Plain Only<br />
30<br />
2017<br />
2018<br />
2019<br />
2020<br />
2021<br />
2022<br />
2023<br />
2024<br />
2025<br />
2026<br />
2027<br />
2028<br />
2029<br />
2030<br />
2031<br />
2032<br />
2033<br />
2034<br />
2035<br />
2036<br />
2037<br />
2038<br />
2039<br />
2040<br />
2041<br />
2042<br />
2043<br />
2044<br />
2045<br />
Year<br />
Figure 12: Production Forecast by Pool – Eagle Plain Only
# of Wells or Pads<br />
1000<br />
900<br />
800<br />
700<br />
600<br />
500<br />
400<br />
300<br />
200<br />
100<br />
Well Forecast - Eagle Plain<br />
0<br />
2000 2005 2010 2015 2020 2025 2030 2035 2040 2045<br />
31<br />
Year<br />
Wells on Production Pads Wells Drilled<br />
Figure 13: Drilling Forecasts
The final step in this development scenario was to map where the wells, calculated in Figure<br />
13, are likely to be located. A series of “snapshot” maps at 5, 10, 15 <strong>and</strong> 20 year intervals<br />
are shown in Figure 14 to Figure 18.<br />
Figure 14: Current snap-shot<br />
Figure 13: Current snap-shot<br />
Figure 15: 5 year snap-shot - Eagle Plain<br />
32
Figure 15: 10 year snap-shot<br />
Figure 16: 10 year snap-shot – Eagle Plain<br />
Figure 17: 15 year snap-shot – Eagle Plain<br />
33
Figure 18: 20 year snap-shot – Eagle Plain<br />
These snapshots show our projected development pattern based on our current knowledge<br />
of the geology. As stated in the limitations to this report, the sequence of actual discovery<br />
events will inevitably vary from this prediction. In particular, it should not be inferred from<br />
this scenario that drilling will initially be confined only to the south area of the exploration<br />
fairway. Operating companies will each stake out their respective areas across the basin<br />
based on success at competitive l<strong>and</strong> sales. Which of those companies will have drilling<br />
success will depend upon their efforts <strong>and</strong> expertise.<br />
9.4 Peel Plateau<br />
All of the discussion to this point has focused on Eagle Plain. With the largest gas resource<br />
it has the potential for filling the NYGP for more than 20 years. Peel Plateau requires a<br />
longer pipeline to connect to NYGP <strong>and</strong> the pipeline would have to traverse difficult terrain<br />
with deeply incised valleys. As such, we project that tie-in of Peel Plateau wells will occur<br />
more than 20 years after Eagle Plain <strong>and</strong> have therefore not included Peel wells in the<br />
drilling forecast.<br />
When Peel is eventually developed, the Mesozoic clastics (Trevor Formation, Arctic Red<br />
Formation <strong>and</strong> Martin House Formation) will be the principal targets as they constitute 78%<br />
of the total resource at Peel <strong>and</strong> occur at shallow depths as shown on Figure 19.<br />
34
Figure 19: Peel Plateau Geological Cross Section 13<br />
Geographically the Trevor, Arctic Red <strong>and</strong> Martin House Formations are limited to a narrow<br />
corridor along the east side of Peel Plateau up to the <strong>Yukon</strong>/NWT boundary. A single<br />
development snapshot for Peel after 20 years (i.e. some 50 years from now) is shown in<br />
Figure 20.<br />
13 <strong>Yukon</strong> Government, Call for Bids, 2001, Figure 3<br />
35
Figure 20: 50 year snap-shot: Eagle Plain <strong>and</strong> Peel Plateau<br />
9.5 Drilling Rigs<br />
Following on the number of wells required, the level of drilling rig activity has been predicted<br />
based on a winter drilling season of 14 weeks from mid-December through to the end of<br />
March. The average well takes approximately 3 weeks to drill. Accounting for rig moves,<br />
each rig is capable of drilling 4 wells per drilling season. Figure 21 shows the resulting<br />
projected rig activity. Note that the drop in activity in 2012 reflects the waiting period during<br />
which operators will delay further drilling pending confirmation that construction of the NYGP<br />
will proceed.<br />
36
# of Rigs<br />
16<br />
14<br />
12<br />
10<br />
8<br />
6<br />
4<br />
2<br />
0<br />
2006<br />
2008<br />
2010<br />
2012<br />
2014<br />
2016<br />
2018<br />
2020<br />
Rig Forecast - Eagle Plain<br />
2022<br />
2024<br />
37<br />
2026<br />
Year<br />
2028<br />
Rig Forecast<br />
2030<br />
2032<br />
Figure 21: Drilling Rig Forecast<br />
9.6 Seismic<br />
The number of seismic lines required is a function both of the depth of the target pools as<br />
well as their areal size. As a rule of thumb, the spacing between seismic lines should be no<br />
larger than the depth of the target formation that the seismic attempts to image. For both<br />
Eagle Plain <strong>and</strong> Peel Plateau/Plain, average formation depth is approximately 3000 m.<br />
Therefore it is estimated that the initial seismic lines will be spaced 3000m (3 km) apart. A<br />
3 km x 3 km grid in the drilling fairway is calculated to eventually reach an ultimate length of<br />
5000 km of seismic. To support drilling activity of 4 to 6 rigs, this equates to 200 km of<br />
seismic each year.<br />
Detailed seismic at a spacing of 1 km x 1 km will then be required to precisely image the<br />
boundaries of an estimated 50% of the 114 gas pools. Given an average pool size of 20 sq<br />
km, we estimate an ultimate length of 4600 km of detailed seismic or 200 km per year.<br />
Seismic will be shot over a l<strong>and</strong>scape at Eagle Plain <strong>and</strong> Peel Plateau that transgresses<br />
from alpine tundra in the southern Ogilvie Mountains to sub-arctic boreal forest (taiga) in the<br />
central part of the plain to Arctic tundra at the Arctic circle (66° 33’ 39” lat) near the center of<br />
the basin. Scudder describes the tundra as open canopy woodl<strong>and</strong> with very stunted st<strong>and</strong>s<br />
of pine, black spruce, larch <strong>and</strong> lesser quantities of white spruce. Typical arctic tundra<br />
consists of sheathed cottongrass, aquatic sedge, arctic willow <strong>and</strong> white arctic bell-heather.<br />
A photo of the area is shown in Figure 22.<br />
2034<br />
2036<br />
2038<br />
2040<br />
2042<br />
2044
Figure 22: Eagle Plain at Arctic Circle. Richardson Mountains in background (photograph by S.G. Cannings). 14<br />
Within the Taiga ecosystem, low impact seismic is expected to navigate through the open<br />
forest by cutting the undergrowth, leaving the st<strong>and</strong>ing timber intact as much as possible. A<br />
photo of conventional vs low impact seismic is shown in Figure 23 <strong>and</strong> Figure 24.<br />
Figure 23: Conventional Seismic Figure 24: Low-impact seismic 15<br />
Within the sub-alpine <strong>and</strong> arctic tundra regions, winter access seismic should result in<br />
minimal residual footprint.<br />
9.7 Processing Plant<br />
A central processing facility <strong>and</strong> compressor station will need to be located along the<br />
Dempster Highway at the NYGP terminus near the town of Eagle Plain. At the central<br />
14 p 42 in G.G.E. Scudder, Environment of the <strong>Yukon</strong>, University of British Columbia, undated<br />
15 http://www.emr.gov.yk.ca/oil<strong>and</strong>gas/info/faq.html<br />
38
processing plant, the gas is treated to dehydrate the gas to meet pipeline specifications <strong>and</strong><br />
to compress the gas into the NYGP.<br />
The limited gas analysis available to date (Table 10) shows limited natural gas liquids.<br />
Indeed, the gas has an average inert (N2 + CO2) composition of 5.4% <strong>and</strong> any natural gas<br />
liquids (“NGL”) <strong>and</strong> liquefied petroleum gases (“LPG”) would need to remain in the gas<br />
stream in order to meet pipeline heating value specifications. We therefore predict that no<br />
liquids will be separated at Eagle Plain.<br />
Sample # 1 2 3 4 5 6 7 8 9 10 11 Average<br />
Well M-08 M-08 G-08 M-59 B-34 J-19 J-19 M-08 M-08 J-19 J-19<br />
N2 2.55 1.54 4.39 0.68 0.83 3.60 0.59 2.49 2.00 0.42 0.37 1.77<br />
CO2 0.14 0.37 0.31 0.76 1.91 5.33 5.19 7.35 7.19 7.24 5.08 3.72<br />
H2S 0.00 0.00 0.00 0.00 0.00 0.00 0.02 0.00 0.07 0.42 0.00 0.05<br />
C1 96.97 97.55 94.53 94.47 86.64 76.01 83.61 80.70 80.79 80.93 84.29 86.95<br />
C2 0.24 0.24 0.12 0.01 6.91 6.82 6.32 5.69 5.83 9.15 5.99 4.30<br />
C3 0.04 0.06 0.01 0.07 2.35 4.66 2.41 2.34 2.43 2.58 2.49 1.77<br />
iC4 0.14 0.17 0.03 0.01 0.25 0.69 0.33 0.31 0.34 0.35 0.31 0.27<br />
nC4 0.02 0.02 0.05 0.51 1.21 0.83 0.56 0.66 0.71 0.64 0.52<br />
C5+ Bbl/MMcf 0.0 0.5 5.4 0.0 5.9 15.7 6.7 5.2 6.6 11.6 8.1 6.0<br />
BTU/cf 987 999 997 1107 1152 1093 1029 1046 1089 1094 1059<br />
Table 10: <strong>Gas</strong> Analyses – Eagle Plain 16<br />
9.8 Gathering Pipelines<br />
Gathering pipelines are required to connect each producing well (not every well drilled).<br />
Multiple wells drilled from pads will share a pipeline <strong>and</strong> all pipelines will ultimately connect<br />
to a main trunk flowing to a central processing plant at the Eagle Plain terminus of the<br />
NYGP. At the time of start-up of the NYGP, we have predicted that approximately 76 wells,<br />
located on 22 pads will be tied-in by pipelines <strong>and</strong> placed on production. These pads will be<br />
clustered near the southeast corner of Eagle Plain.<br />
Dehydration surface facilities will be required at each drilling pad.<br />
Gathering pipelines will extend from each pad to a mainline gathering system. It is<br />
estimated that an average of 5 km of pipeline will initially be required to connect each pad.<br />
Over time this average will decrease to 2 km as more development wells are drilled from<br />
existing pads. We have calculated total gathering pipelines of 1276 km.<br />
The initial mainline system will connect wells to the central processing facility. Initially, 50<br />
km of mainline pipeline will connect the closest pools near Chance <strong>and</strong> Blackie. The system<br />
is projected to exp<strong>and</strong> by approximately 20 km each year for 25 years resulting in a total of<br />
540 km of mainline pipeline.<br />
9.9 Roads<br />
Drilling will be conducted during the winter season only. Winter roads are required to each<br />
well drilled with all weather roads built to the producing wells only. Minimum disturbance<br />
16 Source: Fekete internal files – data gathered from <strong>Yukon</strong> public well data<br />
39
practices dictate that roads will follow existing seismic lines with widening conducted where<br />
necessary within the taiga ecosystem. In the alpine <strong>and</strong> arctic tundra regions, winter roads<br />
will follow the most gradual terrain with no clearing required <strong>and</strong> minimal residual footprint.<br />
All weather roads will again follow pipeline routes to producing wells <strong>and</strong> will be built up with<br />
gravel. Total permanent road distance is therefore predicted to be the same as the pipeline<br />
distances.<br />
9.10 <strong>Oil</strong> <strong>Development</strong><br />
<strong>Oil</strong> development may proceed independently of, <strong>and</strong> possibly in advance of, the gas<br />
development. One operator, <strong>North</strong>ern Cross, has proposed plans to begin producing two oil<br />
wells in Eagle Plain. Initially oil would be trucked to southern refineries until such time as<br />
the wells’ productivity is confidently established <strong>and</strong> justifies construction of a refinery at<br />
Eagle Plain capable of processing 2500 bbls/d, sufficient to meet the dem<strong>and</strong> within the<br />
<strong>Yukon</strong> for refined petroleum products.<br />
<strong>Oil</strong> supply to the refinery can be met by approximately 10 - 20 wells. Seismic <strong>and</strong> drilling<br />
procedures discussed above for gas are also applicable to oil however the exploration area<br />
will be confined to Chance area. As such, the seismic shot for gas in this area will also be<br />
used for identifying oil targets. Exploration drilling will identify both gas <strong>and</strong> oil pools. No<br />
additional exploration wells are required over those estimated above for gas. Roads will be<br />
required to each oil well in order to truck the oil from storage tanks, at the well pads, to the<br />
refinery.<br />
Refined products will be trucked along the Dempster Highway to mines <strong>and</strong> towns in<br />
southern <strong>Yukon</strong>. At this time, there are no foreseeable plans to build an oil or refined<br />
products pipeline.<br />
40
10 Local Markets<br />
10.1 <strong>Oil</strong> Products<br />
Dem<strong>and</strong> for refined oil products within the <strong>Yukon</strong> is shown in Table 11 below:<br />
Aviation Motor Aviation Stove <strong>Oil</strong> Diesel Light Lube <strong>Oil</strong>s<br />
<strong>Gas</strong>oline <strong>Gas</strong>oline Turbo Fuel Kerosene<br />
(bbls/yr)<br />
Fuel <strong>Oil</strong> Fuel <strong>Oil</strong> & Greases Other Total<br />
Beaver Creek 28<br />
1,010<br />
181<br />
228<br />
1,108<br />
437<br />
12<br />
68<br />
3,072<br />
Burwash L<strong>and</strong>ing 19<br />
695<br />
125<br />
157<br />
763<br />
301<br />
8<br />
47<br />
2,114<br />
Carcross 106<br />
3,837<br />
688<br />
866<br />
4,209<br />
1,659<br />
46<br />
258 11,668<br />
Carmacks 104<br />
3,791<br />
679<br />
855<br />
4,158<br />
1,639<br />
45<br />
255 11,527<br />
Dawson City 456 16,571<br />
2,970 3,739 18,179<br />
7,165<br />
198 1,116 50,394<br />
Destruction Bay 15<br />
528<br />
95<br />
119<br />
580<br />
228<br />
6<br />
36<br />
1,607<br />
Faro 88<br />
3,197<br />
573<br />
721<br />
3,508<br />
1,382<br />
38<br />
215<br />
9,724<br />
Haines Junction 202<br />
7,322<br />
1,312 1,652<br />
8,032<br />
3,166<br />
87<br />
493 22,266<br />
Marsh Lake 71<br />
2,586<br />
464<br />
583<br />
2,837<br />
1,118<br />
31<br />
174<br />
7,863<br />
Mayo 101<br />
3,661<br />
656<br />
826<br />
4,016<br />
1,583<br />
44<br />
246 11,133<br />
Old Crow 68<br />
2,456<br />
440<br />
554<br />
2,694<br />
1,062<br />
29<br />
165<br />
7,469<br />
Pelly Crossing 73<br />
2,641<br />
473<br />
596<br />
2,898<br />
1,142<br />
32<br />
178<br />
8,033<br />
Ross River 88<br />
3,188<br />
571<br />
719<br />
3,498<br />
1,378<br />
38<br />
215<br />
9,695<br />
Tagish 47<br />
1,724<br />
309<br />
389<br />
1,891<br />
745<br />
21<br />
116<br />
5,242<br />
Teslin 106<br />
3,865<br />
693<br />
872<br />
4,240<br />
1,671<br />
46<br />
260 11,753<br />
Watson Lake 396 14,374<br />
2,577 3,243 15,770<br />
6,215<br />
172<br />
968 43,714<br />
Whitehorse 5,720 207,832<br />
37,255 46,894 228,005 89,859<br />
2,480 13,993 632,039<br />
Other 31<br />
1,121<br />
201<br />
253<br />
1,230<br />
485<br />
13<br />
76<br />
3,410<br />
Total 7,718 280,399<br />
50,263 63,268 307,616 121,235<br />
3,346 18,879 852,724<br />
Table 11: <strong>Yukon</strong> Petroleum Product Consumption<br />
Average data on total <strong>Yukon</strong> consumption was obtained from <strong>Yukon</strong> government files for the<br />
years 2000-2003 <strong>and</strong> was allocated to individual communities in Table 11 based on<br />
population. Total consumption of 852,724 bbls/yr equates to 2336 bbl/d or roughly the size<br />
of the refinery proposed by <strong>North</strong>ern Cross. The potential oil resources at Eagle Plain are<br />
easily capable of meeting both the current oil dem<strong>and</strong> supply <strong>and</strong> the forecasted dem<strong>and</strong> as<br />
new mines come into production. Properties of the oil may not be amenable to refining into<br />
all of the above products but it is reasonable to assume that the major products of diesel,<br />
fuel oil <strong>and</strong> stove oil can be readily refined.<br />
The economic viability of a refinery at Eagle Plain is based on its proximity to the local<br />
<strong>Yukon</strong> markets. Trucking distances within the <strong>Yukon</strong> for the refined products are 300 – 750<br />
km, much less than the 2100 – 2800 km distance from refineries at Strathcona near<br />
Edmonton. While more efficient, the Strathcona refineries must purchase their crude oil<br />
feedstock at market rates. Conversely, a refinery at Eagle Plain will have higher operating<br />
costs but lower input costs as it will likely be built by a producing company such that there is<br />
no transfer pricing between the wellhead <strong>and</strong> the refinery. It is not possible at this time to<br />
estimate how much lower fuel costs would be, merely that a local supply is feasible.<br />
10.2 Electrical Dem<strong>and</strong> <strong>and</strong> Natural <strong>Gas</strong> Generation<br />
<strong>Yukon</strong> electrical dem<strong>and</strong> generation is shown in Table 12 <strong>and</strong> electrical generation capacity<br />
is shown in Table 13.<br />
41
<strong>Yukon</strong> Total Electricity Generation (MW.h)<br />
Hydro Thermal Wind<br />
2003 287,257 32,808 925<br />
2002 270,377 38,000 1,100<br />
2001 265,874 36,131 1,125<br />
2000 259,064 36,989 394<br />
1999 247,342 48,147 267<br />
1998 270,011 41,815 259<br />
1997 258,924 117,302 226<br />
1996 362,032 138,899 221<br />
1995 317,205 70,316 227<br />
1994 259,934 33,138 243<br />
1993 289,300 47,999 86<br />
Table 12: <strong>Yukon</strong> Electrical Dem<strong>and</strong><br />
Capacity<br />
Utility Summer Winter<br />
Hydro Facilities (MW) (MW)<br />
Whitehorse YEC 40.0 24.0<br />
Aishihik Lake YEC 30.0 30.0<br />
Mayo Lake YEC 5.4 5.4<br />
Fish Lake YECL 1.3 0.7<br />
Total 76.7 60.1<br />
Wind Facilities<br />
Haeckel Hill (Bonus) YEC 0.15<br />
Haeckel Hill (Vestas) YEC 0.66<br />
Total 0.81<br />
Diesel Facilities<br />
Whitehorse YEC 25.0<br />
Faro YEC 5.4<br />
Dawson City YEC 6.0<br />
Mayo YEC 2.0<br />
Watson Lake YECL 5.0<br />
Carmacks YECL 1.3<br />
Haines Junction YECL 1.3<br />
Teslin YECL 1.3<br />
Ross River YECL 1.0<br />
Beaver Creek YECL 0.9<br />
Destruction Bay YECL 0.9<br />
Old Crow YECL 0.7<br />
Pelly Crossing YECL 0.7<br />
Stewart Crossing YECL 0.3<br />
Swift River YECL 0.3<br />
Total 52.1<br />
Total Capacity 129.6<br />
Table 13: <strong>Yukon</strong> Electrical Generation Capacity<br />
Thermally generated electricity burns expensive diesel that currently accounts for 11% of<br />
territorial electrical supply. As discussed above, a refinery at Eagle Plain has the potential<br />
for lowering diesel costs however the greatest benefit would occur by replacing diesel<br />
generated electricity with turbines fueled by cleaner burning natural gas. An off-take from<br />
AHPP could fuel a gas fired combined-cycle generator that would feed electricity into the<br />
existing Aishinhik/Whitehorse/Carmacks/Faro/Ross River 138kV transmission system.<br />
Remote communities would still rely on diesel powered generators. Nonetheless,<br />
Whitehorse accounts for the largest electrical dem<strong>and</strong> <strong>and</strong> a gas turbine would be a distinct<br />
advantage. New mines scheduled to come into production at Minto <strong>and</strong> Willams Creek<br />
would add an estimated additional 40 – 50 MW of dem<strong>and</strong> that could be tied into the<br />
42
existing grid <strong>and</strong> would benefit from lower operating costs. Table 14 illustrates the potential<br />
fuel cost saving.<br />
Diesel Natural <strong>Gas</strong><br />
Cost at Whitehorse 1.05 $/l 7.65 $/Mcf (1)<br />
Heating Value 33700 Btu/l 1000 Btu/Mcf<br />
Heating Cost 31.16 $/MMBtu 7.65 $/MMBtu<br />
Generator Efficiency 25 % 45 %<br />
Net Fuel Cost 124.63 $/MMBtu 17.00 $/MMBtu<br />
1. Estimated cost in 2013 when AHPP begins shipping gas<br />
Table 14: Electrical Generation Fuel Cost Comparison<br />
Note that the above table does not take into account capital <strong>and</strong> operating costs for a gas<br />
turbine versus a diesel generator. Clearly however, natural gas holds the potential to<br />
significantly reduce electrical costs.<br />
43
11 Operating Environment<br />
This section presents the views of industry companies on issues that they would consider in<br />
any decision to resume exploration in <strong>North</strong> <strong>Yukon</strong>.<br />
Letters were sent to four companies who currently hold leases in the <strong>Yukon</strong>:<br />
Chevron Canada Resources Limited<br />
Devon Canada Limited<br />
Hunt <strong>Oil</strong> Company<br />
<strong>North</strong>ern Cross Energy Limited<br />
Text of the letter was as follows:<br />
Fekete Associates Inc. has been commissioned by the <strong>Oil</strong> <strong>and</strong> <strong>Gas</strong> Management<br />
Branch (“OGMB”) of the <strong>Yukon</strong> Government to prepare a strategic overview of oil<br />
<strong>and</strong> gas prospects <strong>and</strong> potential development scenarios in <strong>North</strong> <strong>Yukon</strong> assuming<br />
that either the Mackenzie Valley or Alaska Highway pipeline projects proceed.<br />
The objective of the strategic analysis is to enable the <strong>Yukon</strong> government <strong>and</strong> First<br />
Nations to collectively plan for future oil <strong>and</strong> gas development in <strong>North</strong> <strong>Yukon</strong><br />
through examining supply/dem<strong>and</strong> scenarios, development objectives, opportunities<br />
for community participation, <strong>and</strong> short-term <strong>and</strong> longer-term benefits as well as<br />
constraints to development. The study may also serve to inform the <strong>North</strong> <strong>Yukon</strong><br />
<strong>and</strong> Peel Watershed Planning Commissions.<br />
One portion of the study will focus upon the physical <strong>and</strong> regulatory environment<br />
faced by companies operating in the <strong>Yukon</strong>. The <strong>Yukon</strong> government <strong>and</strong> First<br />
Nations wish to promote an open dialogue with operators in order to underst<strong>and</strong> the<br />
needs of industry <strong>and</strong> to streamline procedures in order to expedite development of<br />
the territories oil <strong>and</strong> gas assets. To this end, they have asked that we solicit from<br />
the key operators in the <strong>Yukon</strong> with respect to:<br />
i. <strong>Oil</strong> <strong>and</strong> gas development regulations<br />
ii. Access to data<br />
iii. Application process <strong>and</strong> timing<br />
iv. Royalties/taxes/local requirements<br />
v. L<strong>and</strong> sale procedures/tenure<br />
vi. Infrastructure<br />
vii. Pipeline access requirements<br />
viii. Conditions needed for on-going production growth <strong>and</strong> increasing ROR<br />
ix. Risk mitigation<br />
We respectfully seek your input on the above points or any other issues you wish to<br />
raise, including both the positive <strong>and</strong> the challenges. The responses will be collated<br />
<strong>and</strong> summarized by Fekete <strong>and</strong> included anonymously in our report.<br />
Feed back was obtained from two of the companies in the form of meetings <strong>and</strong> phone<br />
conversations. Their views are presented here in an amalgamated form, without reference<br />
to the specific companies.<br />
44
11.1 <strong>Oil</strong> <strong>and</strong> gas development regulations<br />
One operator commented that they would expect the <strong>Yukon</strong> to have similar regulations to<br />
other jurisdictions such as Alberta, British Columbia or NWT, <strong>and</strong> if that were the case, they<br />
had no concerns. However, operators need to underst<strong>and</strong> the regulations, in advance, for<br />
everything from seismic to drilling to pipelining to production in order to plan the details of<br />
their work plans.<br />
11.2 Open access to data<br />
Spurring competitive drilling activity requires an open <strong>and</strong> transparent system whereby all<br />
operators have equal access to data including core data, drilling cuttings, well logs, drill<br />
stem <strong>and</strong> production tests <strong>and</strong> more. Responsibility for collecting, collating <strong>and</strong> making<br />
available relevant data falls under the jurisdiction of the <strong>Yukon</strong> <strong>Oil</strong> <strong>and</strong> <strong>Gas</strong> Management<br />
Branch. Operators have expressed that they have found OGMB staff approachable <strong>and</strong><br />
knowledgeable.<br />
The <strong>Yukon</strong> government has commissioned comprehensive geological studies on the<br />
northern sedimentary basins by the <strong>Yukon</strong> Geological Survey. These reports are publicly<br />
available <strong>and</strong> the most recent of these, the Eagle Plain report, which has generated<br />
renewed interest in the <strong>Yukon</strong> will have been reviewed by many industry operators, not just<br />
the four companies who currently hold oil <strong>and</strong> gas rights in Eagle Plain. In summary, data<br />
access is not an impediment for operators electing to work in the north <strong>Yukon</strong>.<br />
11.3 Application process <strong>and</strong> timing<br />
The common theme from operators is “tell us the rules <strong>and</strong> set out a timeline that we can all<br />
live by”. Exploration in the <strong>Yukon</strong> is complicated by the short winter working season. All<br />
equipment <strong>and</strong> manpower must be organized, staged <strong>and</strong> ready to move immediately upon<br />
freeze-up.<br />
Equipment organization <strong>and</strong> mobilization requires long lead time <strong>and</strong> it is expensive to stage<br />
equipment only to have the work delayed. Operators will therefore insist on having<br />
approvals in h<strong>and</strong> well in advance of the winter activity season.<br />
11.4 Royalties/taxes/local requirements<br />
<strong>Yukon</strong>’s royalty regulations (draft) use a formula that is similar to Alberta’s <strong>and</strong> is familiar to<br />
operators. Overall the royalties are lower than southern jurisdictions, thus offsetting the<br />
higher operating costs in the north <strong>and</strong> equalizing the attractiveness of <strong>North</strong> <strong>Yukon</strong> in<br />
comparison to other areas.<br />
Municipal taxes, road permits etc. are minor issues that need to be understood by operators.<br />
11.5 L<strong>and</strong> sale procedures/tenure<br />
The <strong>Yukon</strong> government is actively working to address concerns that l<strong>and</strong> sale procedures<br />
were difficult to underst<strong>and</strong>. Proposed revisions have been announced that would make the<br />
process more efficient <strong>and</strong> responsive. Companies will be able to request l<strong>and</strong>s that they<br />
wish to have posted <strong>and</strong> the government will set out, in advance, dates on which those<br />
requests will be opened <strong>and</strong> considered. From that date, the process of evaluating <strong>and</strong><br />
consulting on environmental, socio-economic <strong>and</strong> surface access issues would take 120<br />
days before issuing a call for bids, considerably shorter <strong>and</strong> less cumbersome than the 300<br />
45
days under the current l<strong>and</strong> sale procedure. By comparison, the l<strong>and</strong> sale process in<br />
Alberta takes approximately 60 days.<br />
In a competitive bidding situation, operators submit sealed bids including a “bonus” that they<br />
are willing to pay to the government in consideration for being awarded the oil <strong>and</strong> gas<br />
rights. The rights go the highest bidder. Since 1998, four l<strong>and</strong> sales in the <strong>Yukon</strong> have<br />
netted a total of $24 million in work commitments. Currently four operators hold leases at<br />
Eagle Plain.<br />
L<strong>and</strong> sale procedures do not apply on Category A l<strong>and</strong>s on which First Nations manage the<br />
oil <strong>and</strong> gas rights directly, nor in areas of unsettled l<strong>and</strong> claims.<br />
As l<strong>and</strong> sales are the point of entry for all oil <strong>and</strong> gas activities, revising this process was a<br />
logical starting point in updating <strong>and</strong> clarifying the conditions for operators wishing to explore<br />
in the <strong>Yukon</strong>.<br />
11.6 Infrastructure<br />
The Dempster Highway is a significant piece of infrastructure without which development of<br />
the Eagle Plain <strong>and</strong> Peel Plateau oil <strong>and</strong> gas resources would be much more difficult. Still,<br />
additional infrastructure is essential to support the level of activity described above. In the<br />
employment <strong>and</strong> business opportunity sections below, we describe the type of services<br />
required to support the pipeline construction <strong>and</strong> drilling activities. All of these people will<br />
create a dem<strong>and</strong> at Eagle Plain for the typical infrastructure found in a small town including<br />
the street, water <strong>and</strong> sewer, accommodations, restaurants, grocery store, medical post, gas<br />
station <strong>and</strong> a supply store.<br />
Initially the pipeline company will construct a camp that will provide all of these services<br />
within a confined, dedicated facility. Inevitably, private enterprises will spring up around the<br />
camp forming the nucleus of the town that will remain once most of the workers <strong>and</strong> the<br />
camp have departed. Operators will look to use the available resources, only building their<br />
own infrastructure where none exists.<br />
11.7 Pipeline access requirements<br />
As discussed in Section 1 of this report, all of the assumptions for development of the<br />
<strong>Yukon</strong>’s oil <strong>and</strong> gas resources hinge on not only the construction of either MVP or AHPP,<br />
but also the right to have <strong>Yukon</strong> gas accepted for delivery into either system at reasonable<br />
toll rates. To begin exploration in earnest, operators need a clear signal on the regulatory<br />
<strong>and</strong> pipeline access issues. This doesn’t mean the pipe has to be going in the ground, but<br />
there has to be a clear timeline (which means no further regulatory hurdles) as to when the<br />
pipeline will start to be built.<br />
11.8 Conditions needed for on-going production growth<br />
The drilling scenario presented in this report is based upon assessments of a reasonable<br />
pipeline size <strong>and</strong> volumes of gas needed to fill that pipeline. The assumptions are<br />
considered reasonable with respect to the size of the resources identified in the YGS report.<br />
If however, the exploration success rate proves to be better than the 1 in 6 ratio used in this<br />
report, operators may well have excess gas that they would then want to transport to<br />
market. Operators will have greater incentive to continue exploration if there is a process in<br />
place whereby pipeline capacity can be further exp<strong>and</strong>ed, with additional compression or<br />
line looping. They will want to feel confident that their on-going gas discoveries can be<br />
46
ought on production quickly, thereby increasing the rate of return on their investment. If<br />
not, those investment dollars will be directed to more immediate prospects in the Mackenzie<br />
Delta, southern Canada or elsewhere in the world.<br />
11.9 Risk mitigation<br />
There are many uncertainties facing oil <strong>and</strong> gas operators venturing into the <strong>Yukon</strong>.<br />
Regulations, infrastructure, available manpower, supplies, different technical <strong>and</strong><br />
environmental challenges are but some of the issues that need to be addressed. In<br />
southern Canada, all such issues are well understood <strong>and</strong> operators can easily assess the<br />
level of risk that drilling may not be permitted or able to proceed. Bringing the <strong>Yukon</strong> up to a<br />
comparable level will ensure that its potential is not discounted by operators simply due to a<br />
lack of underst<strong>and</strong>ing. The corollary is that operators will expect that regulations, once inplace,<br />
will not be changed unexpectedly, arbitrarily or on short-notice .<br />
47
12 Economic Benefits<br />
Economic benefits to the people of the <strong>Yukon</strong> from oil <strong>and</strong> gas development have been<br />
subdivided into four headings:<br />
♦ Royalties<br />
♦ Direct Investment<br />
♦ Employment<br />
♦ Business opportunities<br />
12.1 Royalties<br />
<strong>Yukon</strong> <strong>Oil</strong> <strong>and</strong> <strong>Gas</strong> Royalty Regulations (Draft) is the legislation governing the amount of<br />
royalty paid by oil <strong>and</strong> gas producers to the <strong>Yukon</strong> government. The legislation covers most<br />
l<strong>and</strong>s in the <strong>Yukon</strong> including all of the <strong>North</strong> <strong>Yukon</strong> l<strong>and</strong>s addressed in this report. Royalty<br />
structures have a significant impact on the economics that producers consider before<br />
deciding to proceed with drilling. The royalty rate reflects a balance between attracting<br />
investment from industry yielding a fair return to the people of the <strong>Yukon</strong>. The draft<br />
regulations propose an ad valorem royalty with a base rate of 5 percent for the first 36<br />
months of production. Thereafter, the royalty rate has a base of 10 percent with a formula<br />
under which the royalty can increase up to a maximum of 15 percent depending on gas<br />
prices. The regulations have been formulated to be clearly understood, attractive to<br />
producers, fair to the people of the <strong>Yukon</strong> <strong>and</strong> easy to administer by the government.<br />
A forecast of the potential royalties from gas production, assuming a flat 10% royalty rate is<br />
shown in Table 15.<br />
48
Year<br />
Fekete<br />
AECO-C<br />
<strong>Gas</strong> Price<br />
Forecast<br />
Intra-<br />
Alberta<br />
Tariffs ($/Mcf)<br />
MVP NYGP<br />
49<br />
Total<br />
Tariffs<br />
Net <strong>Gas</strong><br />
Price<br />
at Eagle<br />
Plain<br />
Pipeline<br />
<strong>Gas</strong> Rate<br />
Annual<br />
Revenue<br />
Annual<br />
<strong>Yukon</strong><br />
Royalty<br />
at 10%<br />
$Cdn/Mcf $/Mcf $/Mcf $/Mcf $/Mcf $/Mcf MMcf/d MM$ Cdn MM$ Cdn<br />
2005 (Q4) 10.69 0.31 1.29 0.45 2.05 8.64 0 0.0 0.0<br />
2006 9.66 0.31 1.29 0.45 2.05 7.61 0 0.0 0.0<br />
2007 8.57 0.31 1.29 0.45 2.05 6.52 0 0.0 0.0<br />
2008 7.68 0.31 1.29 0.45 2.05 5.64 0 0.0 0.0<br />
2009 6.80 0.31 1.29 0.45 2.05 4.75 0 0.0 0.0<br />
2010 7.14 0.31 1.29 0.45 2.05 5.09 0 0.0 0.0<br />
2011 7.49 0.31 1.29 0.45 2.05 5.45 0 0.0 0.0<br />
2012 7.87 0.31 1.29 0.45 2.05 5.82 0 0.0 0.0<br />
2013 8.26 0.31 1.29 0.45 2.05 6.22 0 0.0 0.0<br />
2014 8.68 0.31 1.29 0.45 2.05 6.63 256 619.4 61.9<br />
2015 9.11 0.31 1.29 0.45 2.05 7.06 256 660.0 66.0<br />
2016 9.57 0.31 1.29 0.45 2.05 7.52 256 702.5 70.3<br />
2017 10.04 0.31 1.29 0.45 2.05 8.00 256 747.2 74.7<br />
2018 10.55 0.31 1.29 0.45 2.05 8.50 410 1271.9 127.2<br />
2019 11.07 0.31 1.29 0.45 2.05 9.03 410 1350.8 135.1<br />
2020 11.63 0.31 1.29 0.45 2.05 9.58 410 1433.6 143.4<br />
Table 15: Potential <strong>Gas</strong> Royalty Revenue<br />
This analysis illustrates the total projected royalties from all wells drilled in the Eagle Plain<br />
basin, including those wells that may be drilled on Crown l<strong>and</strong>s or on Settlement (Category<br />
A) l<strong>and</strong>s. Assuming that First Nations with Category A l<strong>and</strong>s adopt royalty regulations in<br />
common with the <strong>Yukon</strong> government, the proportion of the total royalty attributable to<br />
Category A l<strong>and</strong>s would be in proportion to the gas production rate from those wells located<br />
on Category A l<strong>and</strong>s.<br />
In addition, oil production has the potential to generate additional royalties amounting to<br />
approximately 5% of the gas royalties as shown in Table 16.
Fekete<br />
Edmonton <strong>Oil</strong><br />
Price<br />
Forecast<br />
Trucking 1<br />
Taylor<br />
to<br />
Edm<br />
tariff<br />
Net <strong>Oil</strong><br />
Price<br />
at Eagle<br />
Plain<br />
50<br />
<strong>Oil</strong><br />
Production<br />
Rate<br />
Annual<br />
Revenue<br />
Annual<br />
<strong>Yukon</strong><br />
Royalty<br />
at 10%<br />
($Cdn/bbl) ($/bbl) ($/bbl) ($/bbl) (bbl/d) (MM$ Cdn) (MM$ Cdn)<br />
77.25 25.00 1.50 50.75 0 0.0 0.0<br />
72.10 25.00 1.50 45.60 0 0.0 0.0<br />
66.00 25.00 1.50 39.50 0 0.0 0.0<br />
59.90 25.00 1.50 33.40 250 3.0 0.3<br />
53.80 25.00 1.50 27.30 500 5.0 0.5<br />
54.88 25.00 1.50 28.38 2500 25.9 2.6<br />
55.97 25.00 1.50 29.47 2500 26.9 2.7<br />
57.09 25.00 1.50 30.59 2500 27.9 2.8<br />
58.23 25.50 1.50 31.23 2500 28.5 2.9<br />
59.40 26.01 1.50 31.89 2500 29.1 2.9<br />
60.59 26.53 1.50 32.56 2500 29.7 3.0<br />
61.80 27.06 1.50 33.24 2500 30.3 3.0<br />
63.04 27.60 1.50 33.93 2500 31.0 3.1<br />
64.30 28.15 1.50 34.64 2500 31.6 3.2<br />
65.58 28.72 1.50 35.36 2500 32.3 3.2<br />
66.89 29.29 1.50 36.10 2500 32.9 3.3<br />
1 Trucking costs estimated to nearest refinery at Taylor, B.C.<br />
Table 16: Potential <strong>Oil</strong> Royalty Revenue<br />
Under federal/territorial agreements, 60% to 80% of royalties in excess of 3 MM$/yr flow<br />
back to the federal government. It is evident therefore that the major benefit of oil <strong>and</strong> gas<br />
development to the <strong>Yukon</strong> people is not in the royalty revenue but rather in the local<br />
business development, investment <strong>and</strong> taxes. This situation is similar to the experience of<br />
Newfoundl<strong>and</strong> <strong>and</strong> Nova Scotia in the development of their offshore resources. Further<br />
discussion on this point is included in Section 13: Community Preparation of this report.<br />
12.2 Direct Investment<br />
It has yet to be determined who will build <strong>and</strong> own the NYGP. Possible owners include:<br />
♦ Producers<br />
♦ Pipeline companies<br />
♦ Local Investors including First Nations<br />
Producers have the greatest motivation to advance the pipeline project. Once the pipeline is<br />
in place, the producers will be able to develop natural gas that is currently str<strong>and</strong>ed.<br />
However, construction <strong>and</strong> operation of a major pipeline is not generally undertaken by<br />
operators <strong>and</strong> they may not have the specific experience <strong>and</strong> skills to conduct the detailed<br />
work required. Also, pipeline investment has a very long-term payout, lower risk <strong>and</strong> lower<br />
rates of return than drilling for oil <strong>and</strong> gas. Investors in producing companies are looking for<br />
higher returns on their investment <strong>and</strong> generally don’t like to see these operating companies<br />
have significant capital tied up in long-term investments that are not part of their core<br />
business.
TransCanada Pipelines Limited, Enbridge Inc., Duke Energy Services <strong>and</strong> a number of<br />
other pipeline companies are c<strong>and</strong>idates to build the pipeline. Each has experience in<br />
building the pipelines as well as operating the compressors needed to manage flow volumes<br />
through the pipe. TransCanada’s pipeline system extends from northwestern Alberta to<br />
Chicago <strong>and</strong> New York <strong>and</strong> TransCanada will be the operator of the MVP <strong>and</strong> is the leading<br />
c<strong>and</strong>idate to operate the AHPP as well. Enbridge is a competitor for the AHPP. They<br />
currently have a 50% interest in the Canadian portion of the Alliance <strong>Gas</strong> Pipeline between<br />
Fort St. John, B.C. <strong>and</strong> Cromer, Saskatchewan. The pipeline continues on to Chicago.<br />
Duke Energy Services operates the natural gas gathering <strong>and</strong> mainline transmission system<br />
in British Columbia.<br />
A pipeline company will be prepared to spend the capital to build a pipeline once they have<br />
firm contracts with producers for pipeline capacity. These contracts are often for twenty<br />
years <strong>and</strong> commit the producer to ship a specific volume of gas <strong>and</strong> to pay a fixed tariff to<br />
the pipeline company for shipping the gas. The producer is obligated to pay for the<br />
contracted volume of gas even if, for some reason, its wells are unable to deliver enough<br />
gas.<br />
The MVP model is one that could be followed for NYGP. MVP is a consortium of producers<br />
<strong>and</strong> First Nations. In turn, a pipeline company (TransCanada) funded the First Nations<br />
portion of the costs. TransCanada will build <strong>and</strong> operate the pipeline in return for a portion<br />
of the First Nations’ share in the project. The First Nations will retain an interest in the<br />
project <strong>and</strong> will share in the profits from the pipeline. This is one model that brings together<br />
all interested parties with the necessary expertise to address environmental <strong>and</strong> cultural<br />
issues during the construction <strong>and</strong> operation of the pipeline.<br />
Many of the issues regarding ownership, pipeline access <strong>and</strong> tariffs with respect to the<br />
public good in developing new oil <strong>and</strong> gas resources in a remote part of Canada are being<br />
discussed at the National Energy Board (“NEB”) hearings on the MVP. The MVP<br />
consortium has announced that it does not wish to consider building lateral pipelines to tie<br />
into their mainline. The gas fields belonging to the individual producers within MVP<br />
(Imperial, ConocoPhilips, Shell <strong>and</strong> Exxon) are located in the Mackenzie delta <strong>and</strong> these<br />
companies do not benefit from building laterals to connect wells owned by other operators<br />
as those wells would displace MVP Producers gas in the MVP mainline.<br />
Interventions by the <strong>Yukon</strong> Government in the MVP hearings before the NEB have<br />
advocated that laterals connecting to MVP be part of that system (not operated separately)<br />
<strong>and</strong> that a “rolled-in” toll system be adopted. Both measures would ultimately benefit orderly<br />
development of <strong>North</strong> <strong>Yukon</strong> oil <strong>and</strong> gas fields. The NEB’s decision on these matters will<br />
establish some of the framework under which the NYGP will eventually proceed.<br />
12.3 Employment<br />
Direct employment resulting from oil <strong>and</strong> gas activities have been estimated for the following<br />
sectors:<br />
♦ Pipeline<br />
• Feasibility Phase<br />
• Planning Phase<br />
• Pipeline Construction Phase<br />
• Pipeline Operation Phase<br />
♦ Drilling Rigs<br />
♦ Seismic<br />
51
♦ Well Servicing<br />
♦ Road Construction<br />
♦ Pipelining<br />
♦ Operating Companies<br />
12.4 Pipeline<br />
12.4.1 Feasibility Phase<br />
The feasibility phase generally requires one to two years to complete. During this time,<br />
the consortium proposing to build the pipeline will prepare first estimates of the project<br />
economics <strong>and</strong> identify key hurdles that must be cleared in order to proceed. Legal<br />
frameworks, contractual arrangements <strong>and</strong> internal budget approvals constitute much of<br />
the work. During this time, the work is expected to be located at the various company<br />
head offices in Calgary with a few jobs in the <strong>Yukon</strong>, in the form of community relations<br />
<strong>and</strong> traditional knowledge staff manning a satellite office in Whitehorse. At the end of<br />
the feasibility phase, the consortium will decide whether to proceed with a regulatory<br />
application that will require production of extensive details on all aspects of the<br />
proposed project<br />
12.4.2 Planning Phase<br />
The planning phase involves preparation of all the technical studies including pipeline<br />
routing, river crossings, soil studies, sizing, equipment design, pressure ratings,<br />
facilities, compressors, infrastructure needs, environmental studies, public consultation,<br />
manpower <strong>and</strong> skill requirements, right-of-way agreements, formal supply commitment<br />
<strong>and</strong> tariff agreements plus all the other plans essential to a large <strong>and</strong> concentrated<br />
construction effort. The conclusion of the planning phase is marked by successfully<br />
obtaining regulatory approval.<br />
The MVP planning phase was projected to be 3 – 4 years <strong>and</strong>, with the latest regulatory<br />
delays, will inevitably stretch to at least 5 years. For the NYGP, the planning phase<br />
could be shortened to 2 – 3 years as it is expected that many of the regulatory<br />
precedents <strong>and</strong> procedures will have been established by the MVP <strong>and</strong> AHPP projects.<br />
During the planning phase, field work will generate further <strong>Yukon</strong> employment for<br />
environmental studies, surveying, public consultation <strong>and</strong> assessing the impact on local<br />
communities. Staffing in the Whitehorse office is expected to grow to approximately 30<br />
people.<br />
12.4.3 Pipeline Construction Phase<br />
Construction of the NYGP will be much faster than either MVP or AHPP because,<br />
regardless of which direction the pipeline goes, it will follow the Dempster Highway. For<br />
remote pipelining projects such as these, clearing the pipeline right-of-way <strong>and</strong> building<br />
access roads <strong>and</strong> air-strips along the right-of-way is not only a very large part of the<br />
cost, but also the slowest part of the work. The existing Dempster Highway<br />
infrastructure is situated through the middle of the <strong>North</strong> <strong>Yukon</strong> oil <strong>and</strong> gas fields <strong>and</strong> its<br />
use would cut almost two years of time <strong>and</strong> cost from what would otherwise be expected<br />
in a pipeline project across remote l<strong>and</strong>s.<br />
52
Employment levels escalate rapidly during the pipeline construction phase. Crews of<br />
approximately 750 people are required to build each section of the pipeline, extending<br />
some 120 km long. Total pipeline length is from Eagle Plain to Inuvik is approximately<br />
350 km. It is expected that construction would extend over two winter construction<br />
seasons, with two pipeline sections built each season. The total construction workforce<br />
is therefore estimated to be 1500 each winter for two years. For an AHPP connection,<br />
the distance from Eagle Plain to a tie-in near Tok, Alaska is 513 km. An additional<br />
section crew would be added each bringing the total workforce to 2250 each season.<br />
Jobs will be readily available to <strong>Yukon</strong>ers, with the remaining positions filled by<br />
southerners. All staff would be housed in temporary camps constructed along the<br />
Dempster Highway.<br />
12.4.4 Pipeline Operation Phase<br />
Facilities built along the pipeline will include a processing <strong>and</strong> compression plant located<br />
at Eagle Plain <strong>and</strong> a booster compressor located approximately half the distance<br />
between Eagle Plain <strong>and</strong> Inuvik. Once constructed, essentially all jobs will be located at<br />
these two locations. A total permanent workforce of approximately 30 people is<br />
anticipated. Most of the jobs will be located at Eagle Plain, where plant operators will be<br />
responsible for ensuring any oil is separated from the gas <strong>and</strong> that the gas is then<br />
dehydrated <strong>and</strong> compressed for delivery into the pipeline. The booster compressor<br />
facility will run automatically for most of the time <strong>and</strong> will require only 1 – 2 people to<br />
monitor <strong>and</strong> maintain the equipment. A few (2 – 5) jobs for environmental <strong>and</strong> corrosion<br />
monitors will be spread along the pipeline length.<br />
A lateral to AHPP would have an additional 2 booster compressors, resulting in an<br />
additional 4 jobs at those locations plus an additional 5 – 10 jobs for environmental <strong>and</strong><br />
corrosion monitors along the length.<br />
12.4.5 Total Direct Pipeline Employment Levels <strong>and</strong> Job Types<br />
Figure 25 below shows the total employment levels, by year <strong>and</strong> phase, directly<br />
resulting from pipeline construction.<br />
Table 17 lists the type of jobs that would be available within the <strong>Yukon</strong> throughout the<br />
four stages of a pipeline project.<br />
Reference: Job titles, descriptions <strong>and</strong> salary ranges for the Pipeline Construction<br />
phase in the above table have been obtained from the Mackenzie Valley Pipeline<br />
website: (http://www.mackenziegasproject.com/opportunities/employment/index.html).<br />
Detailed job descriptions may be viewed on the MVP website. Salaries in the above<br />
table have been estimated by increasing the 2001 data by 21.5%, reflecting a<br />
compound 5% annual inflation rate in salaries since 2001. In addition, for field<br />
positions, room <strong>and</strong> meals in temporary camps are generally provided by the employer.<br />
53
Number of Jobs<br />
2500<br />
2000<br />
1500<br />
1000<br />
500<br />
0<br />
Feasibility<br />
Phase<br />
Planning<br />
Phase<br />
0 1 2 3 4 5 6 7 8 9 10 11 12 13<br />
54<br />
Year<br />
Construction<br />
Phase<br />
MVP Lateral AHPP Lateral<br />
Figure 25: NYGP Estimated Direct Employment Levels<br />
Operations<br />
Phase
Phase Job Category Job Type Specific Job Title Skill Level Annual Salary<br />
Feasibility Support Services Knowledge<br />
Traditional Knowledge (TK)<br />
Skilled $38,000 -$50,000<br />
Specialists<br />
Specialists<br />
Community Consultation <strong>and</strong> Socio-<br />
Economic Coordinator<br />
Skilled $38,000 -$50,000<br />
Administrative Assistant Skilled $28,000 - $55,000<br />
Planning Project Management Management Project Manager Professional/Technical $47,000 - $95,000<br />
Engineering Engineer Professional Engineer Professional/Technical $60,000 – 110,000<br />
Pipeline<br />
Construction<br />
Support Services Knowledge<br />
Traditional Knowledge (TK)<br />
Skilled $38,000 -$50,000<br />
Specialists<br />
Specialists<br />
Community Consultation <strong>and</strong> Socio-<br />
Economic Coordinator<br />
Skilled $38,000 -$50,000<br />
Cultural Relations Coordinator Skilled $38,000 -$50,000<br />
Administrative Assistant Skilled $28,000 - $55,000<br />
Procurement <strong>and</strong><br />
Purchasing<br />
Logistics Coordinator Professional/Technical $49,000 - $98,000<br />
Contracts Coordinator Professional/Technical $49,000 - $98,000<br />
Environmental Environmental Monitor Skilled $38,000 -$50,000<br />
Information Information Technologist Skilled $38,000 -$50,000<br />
Survey Technologist Skilled $30,000 - $43,000<br />
Drafting Technologist Skilled $30,000 - $43,000<br />
Construction Supervisory Construction Manager Professional/Technical $90,000 - $110,000<br />
Foreman Professional/Technical $66,000 - $72,000<br />
Assistant Foreman Professional/Technical $66,000 - $72,000<br />
Assistant (Lead H<strong>and</strong>) Professional/Technical $55,000 - $72,000<br />
Equipment Operators Heavy Equipment Operator<br />
(Cat Skinner, Grader, Front-end<br />
Loader, Boom Trucks, Excavators)<br />
Skilled $62,000 - $72,000<br />
Truck Drivers Skilled $62,000 - $72,000<br />
Bus Driver Skilled $62,000 - $72,000<br />
Trades People Welders Skilled $47,000 - $77,000<br />
Mechanics Skilled $47,000 - $77,000<br />
Electricians Skilled $47,000 - $77,000<br />
55
Pipefitters Skilled $47,000 - $77,000<br />
Labour Swamper, Unskilled $17,000 - $32,000<br />
Nozzleman Unskilled $17,000 - $32,000<br />
<strong>Oil</strong>er Unskilled $17,000 - $32,000<br />
Parts Runner Unskilled $17,000 - $32,000<br />
Welder’s Helper Unskilled $17,000 - $32,000<br />
Labourer Unskilled $17,000 - $32,000<br />
Painter Unskilled $17,000 - $32,000<br />
Mechanic’s Helper Unskilled $17,000 - $32,000<br />
Engineering Engineer Professional Engineer Professional/Technical $60,000 – 110,000<br />
Project Management Management Project Manager Professional/Technical $47,000 - $95,000<br />
Operations Manager Professional/Technical $97,000 - $182,000<br />
Engineering Manager Professional/Technical $90,000 - $110,000<br />
Information Manager Professional/Technical $45,000 - $90,000<br />
Support Services Accommodations Camp Manager Skilled $60,000 - $75,000<br />
Camp Attendants Unskilled $17,000 - $25,000<br />
Camp Maintenance Unskilled $17,000 - $25,000<br />
Food Services Cook/Baker Unskilled $30,000 - $43,000<br />
Food Preparer Unskilled $17,000 - $28,000<br />
Kitchen Help Unskilled $17,000 - $28,000<br />
Health <strong>and</strong> Safety HSE Coordinator Professional/Technical $72,000 - $120,000<br />
First Aid Technologist Professional/Technical $60,000 - $72,000<br />
Logistics Coordinator Professional/Technical $49,000 - $98,000<br />
Contracts Coordinator Professional/Technical $49,000 - $98,000<br />
Office Support Office Manager Skilled $45,000 - $79,000<br />
Administrative Assistant Skilled $28,000 - $55,000<br />
Procurement <strong>and</strong><br />
Purchasing<br />
Procurement Manager Professional/Technical $36,000 - $79,000<br />
Purchasing Agent Professional/Technical $36,000 - $79,000<br />
Materials Coordinator Professional/Technical $36,000 - $79,000<br />
Security Guard Unskilled $17,000 - $43,000<br />
Field Coordinator Skilled $38,000 -$50,000<br />
56
Pipeline<br />
Operation<br />
Knowledge<br />
Traditional Knowledge (TK)<br />
Skilled $38,000 -$50,000<br />
Specialists<br />
Specialists<br />
Community Consultation <strong>and</strong> Socio-<br />
Economic Coordinator<br />
Skilled $38,000 -$50,000<br />
Cultural Relations Coordinator Skilled $38,000 -$50,000<br />
Employment <strong>and</strong> Training Counselor Skilled $38,000 -$50,000<br />
Environmental Environmental Monitor Skilled $38,000 -$50,000<br />
Information Information Technologist Skilled $38,000 -$50,000<br />
Survey Technologist Skilled $30,000 - $43,000<br />
Drafting Technologist Skilled $30,000 - $43,000<br />
Management Management Operations Manager Professional/Technical $97,000 - $182,000<br />
Engineering Engineer Professional Engineer Professional/Technical $60,000 – 110,000<br />
Operations Operators Foreman Professional/Technical $66,000 - $72,000<br />
Assistant Foreman Professional/Technical $66,000 - $72,000<br />
Pipeline Operator Skilled $50,000 - $65,000<br />
Plant Operator $50,000 - $65,000<br />
Trades People Welders Skilled $47,000 - $77,000<br />
Mechanics Skilled $47,000 - $77,000<br />
Electricians Skilled $47,000 - $77,000<br />
Pipefitters Skilled $47,000 - $77,000<br />
Support Services Health <strong>and</strong> Safety HSE Coordinator Professional/Technical $72,000 - $120,000<br />
Office Support Office Manager Skilled $45,000 - $79,000<br />
Administrative Assistant Skilled $28,000 - $55,000<br />
Procurement <strong>and</strong><br />
Purchasing<br />
Purchasing Agent Professional/Technical $36,000 - $79,000<br />
Materials Coordinator Professional/Technical $36,000 - $79,000<br />
Security Guard Unskilled $17,000 - $43,000<br />
Knowledge<br />
Traditional Knowledge (TK)<br />
Skilled $38,000 -$50,000<br />
Specialists<br />
Specialists<br />
Employment <strong>and</strong> Training Counselor Skilled $38,000 -$50,000<br />
Environmental Environmental Monitor Skilled $38,000 -$50,000<br />
Information Information Technologist Skilled $38,000 -$50,000<br />
Table 17: Pipeline Job Descriptions<br />
57
12.4.6 <strong>Oil</strong> Related Employment Levels <strong>and</strong> Job Types<br />
Additional jobs will also be generated at Eagle Plain to staff an oil refinery. Trucking of<br />
refined oil products will generate jobs throughout the <strong>Yukon</strong>. As discussed in the<br />
market section, much of the oil dem<strong>and</strong> will be predicated on the development of new<br />
mines in the <strong>Yukon</strong>. Steady employment levels are detailed in Table 18.<br />
Location Number of Jobs<br />
Eagle Plain – <strong>Oil</strong> Refinery 8<br />
Throughout <strong>Yukon</strong> – Trucking 10-15<br />
Table 18: <strong>Oil</strong> Related Employment Levels<br />
The types of oil related jobs are listed in Table 19 below.<br />
58
<strong>Oil</strong> Refining<br />
<strong>and</strong><br />
Transportation<br />
Management Management Operations Manager Professional/Technical $97,000 - $182,000<br />
Engineering Engineer Professional Engineer Professional/Technical $60,000 – 110,000<br />
Operations Operators Foreman Professional/Technical $66,000 - $72,000<br />
Assistant Foreman Professional/Technical $66,000 - $72,000<br />
Plant Operator $50,000 - $65,000<br />
Trades People Welders Skilled $47,000 - $77,000<br />
Mechanics Skilled $47,000 - $77,000<br />
Electricians Skilled $47,000 - $77,000<br />
Pipefitters Skilled $47,000 - $77,000<br />
Transportation Truck Drivers Skilled $62,000 - $72,000<br />
Support Services Health <strong>and</strong> Safety HSE Coordinator Professional/Technical $72,000 - $120,000<br />
Office Support Office Manager Skilled $45,000 - $79,000<br />
Administrative Assistant Skilled $28,000 - $55,000<br />
Procurement <strong>and</strong><br />
Purchasing<br />
Purchasing Agent Professional/Technical $36,000 - $79,000<br />
Materials Coordinator Professional/Technical $36,000 - $79,000<br />
Security Guard Unskilled $17,000 - $43,000<br />
Knowledge<br />
Traditional Knowledge (TK)<br />
Skilled $38,000 -$50,000<br />
Specialists<br />
Specialists<br />
Employment <strong>and</strong> Training Counselor Skilled $38,000 -$50,000<br />
Environmental Environmental Monitor Skilled $38,000 -$50,000<br />
Information Information Technologist Skilled $38,000 -$50,000<br />
Table 19: <strong>Oil</strong> Related Job Descriptions<br />
59
12.4.7 Drilling Rigs<br />
Drilling rig activity <strong>and</strong> related oil <strong>and</strong> gas field activities will generate the greatest<br />
number of jobs. A drilling rig consist of two crews of six consisting of a tool-pusher,<br />
driller, derrickh<strong>and</strong>, motorh<strong>and</strong> <strong>and</strong> two floorh<strong>and</strong>s. In addition to the twelve immediate<br />
jobs, approximately 15 additional jobs are generated in support companies to haul the<br />
rig equipment, provide cementing services, drilling mud, acidizing or fracturing services,<br />
wellhead equipment, water hauling, wellsite preparation, surveying <strong>and</strong> environmental<br />
assessment. Drilling rig activity will be limited to winter access months. The<br />
development scenario generated in Section 9 of this report predicts five drilling rigs will<br />
be required each winter.<br />
12.4.8 Seismic<br />
Seismic crews consist of four to six members using light duty trucks <strong>and</strong> quads. The<br />
predicted activity level would support three seismic crews each winter.<br />
12.4.9 Well Servicing<br />
Well servicing requires a smaller, truck mounted, rig that can access well sites year<br />
round. Service rigs have one daylight crews of four workers: driller,<br />
derrickh<strong>and</strong>/motorh<strong>and</strong> <strong>and</strong> two floor h<strong>and</strong>s. The same ancillary services provided to<br />
drilling rigs are also needed for service rigs. Two year-round service rigs are sufficient<br />
to support all wells in Eagle Plain.<br />
12.4.10 Road Construction<br />
Road construction will be required to each new well pad. Three crews of ten are<br />
predicted.<br />
12.4.11 Gathering Pipelines<br />
Gathering pipelines between the wells <strong>and</strong> the inlet plant to the NYGP are generally<br />
built by the individual producer companies. Small pipelining crews will be required to lay<br />
lines that would be one to twenty kilometers in length at a time. The type of jobs are<br />
identical to those itemized in the main pipeline section with additional requirements for<br />
surveying <strong>and</strong> clearing the right-of-way. Pipelining activities will generally be restricted<br />
to the winter season. Some summer can take place in summer when small diameter<br />
pipe can be installed with light duty equipment along existing roadways. Two yearround<br />
pipeline crews <strong>and</strong> an additional two crews each winter are predicted.<br />
12.4.12 Operations<br />
Finally, a permanent level of drilling <strong>and</strong> production will mean that four to eight operating<br />
companies will each have an office in either Eagle Plain or Whitehorse, staffed by<br />
approximately 10 people each including managers, well operators, rig supervisors,<br />
accountants <strong>and</strong> support staff.<br />
12.4.13 Total Employment Levels<br />
The total predicted employment levels are shown in Table 20.<br />
60
Activity Type Winter Jobs Year Round Jobs<br />
Seismic (3 crews) 18<br />
Drilling Rigs (5 rigs each winter) 75<br />
Service Rig (2 rigs year round) 8<br />
Road Construction (3 crews) 30<br />
Pipelining (2 winter+2 yr round) 60 60<br />
Operating Company office (8) 80<br />
Total 153 178<br />
Table 20: Drilling <strong>and</strong> Production Predicted Employment Levels<br />
Job descriptions <strong>and</strong> salaries for these jobs are shown in Table 21. Wages have been<br />
obtained from various company, industry group <strong>and</strong> employment websites.<br />
61
Seismic Operations Field Crew Crew Chief Skilled $75,000<br />
Vibrator Operator Skilled $65,000<br />
Observer Skilled $60,000<br />
Shooter/Jugh<strong>and</strong> Unskilled $35,000<br />
Drilling Operations Drilling Rigs Tool Pusher Skilled $75,000<br />
Driller Skilled $60,000<br />
Derrickh<strong>and</strong> Skilled $45,000<br />
Motorh<strong>and</strong> Skilled $42,000<br />
Floorh<strong>and</strong> Unskilled $36,000<br />
Drilling Operations Service Rig Driller Skilled $60,000<br />
Derrickh<strong>and</strong> Skilled $45,000<br />
Motorh<strong>and</strong> Skilled $42,000<br />
Floorh<strong>and</strong> Unskilled $36,000<br />
Drilling Support Services Cementing Cementing Operator Skilled $50,000<br />
Stimulation Acid Stimulation Operator Skilled $50,000<br />
Fracture Stimulation Operator Skilled $70,000<br />
Wireline Electric Wireline Operator Skilled $70,000<br />
Slickline Operator Skilled $60,000<br />
Packers/Tools Tool H<strong>and</strong> Skilled $60,000<br />
Drilling Road Construction Equipment Operators Heavy Equipment Operator<br />
(Grader, Front-end Loader,<br />
Excavators)<br />
Skilled $62,000 - $72,000<br />
Drilling Pipeline Equipment Operators Heavy Equipment Operator<br />
(Cat Skinner, Boom Trucks,<br />
Excavators)<br />
Skilled $62,000 - $72,000<br />
Operating<br />
Company<br />
Engineering Engineer Professional Engineer Professional/Technical $60,000 – 110,000<br />
Operations Operators Foreman Professional/Technical $66,000 - $72,000<br />
Assistant Foreman Professional/Technical $66,000 - $72,000<br />
Well Operator Skilled $50,000 - $65,000<br />
Support Services Health <strong>and</strong> Safety HSE Coordinator Professional/Technical $72,000 - $120,000<br />
Office Support Office Manager Skilled $45,000 - $79,000<br />
Administrative Assistant Skilled $28,000 - $55,000<br />
Procurement <strong>and</strong> Purchasing Agent Professional/Technical $36,000 - $79,000<br />
62
Purchasing<br />
Environmental Environmental Monitor Skilled $38,000 -$50,000<br />
Information Information Technologist Skilled $38,000 -$50,000<br />
Table 21: Drilling <strong>and</strong> Production Related Job Descriptions<br />
63
12.5 Business Opportunities<br />
Operating companies are not in the business of providing the myriad of support services<br />
required for their operations. Whenever possible, they will look to secure the services of<br />
local companies <strong>and</strong>, only when those services are missing will the company be forced to do<br />
the work themselves. Local business opportunities are the greatest opportunity for First<br />
Nations economic development <strong>and</strong> self-directed employment. It is estimated that some<br />
100 to 200 additional jobs would be generated as a result of oil <strong>and</strong> gas activity at Eagle<br />
Plain.<br />
Business Type Description<br />
Drilling Drilling Rigs, Service Rigs, Coiled Tubing, Cementing,<br />
Stimulation, Wireline, Downhole Tools<br />
Transportation Vehicle Rental, Trucking, Helicopter, Fixed Wing Aircraft<br />
Fuel Bulk fuel, propane, diesel fuel, aircraft fuel, gasoline, fuel<br />
oil, grease, lubricating oil, glycol <strong>and</strong> chemicals<br />
Communication Telecommunications, cellular phones, high-speed internet<br />
<strong>and</strong> cable TV<br />
Construction - Facilities Surveying<br />
Building supplies, hardware, paint, lumber supply <strong>and</strong><br />
plywood<br />
Electrical contracting <strong>and</strong> supplies<br />
Plumbing contracting <strong>and</strong> supplies<br />
Carpentry <strong>and</strong> finishing<br />
Heating, ventilation <strong>and</strong> air conditioning supply, installation<br />
<strong>and</strong> maintenance<br />
Electrical power generation <strong>and</strong> supply<br />
Construction - Pipeline General contracting<br />
Timber for pipeline skids <strong>and</strong> survey laths<br />
Welding services <strong>and</strong> supplies, such as acetylene <strong>and</strong><br />
oxygen<br />
Office Requirements Office space, supplies, furniture, computers <strong>and</strong> other<br />
equipment<br />
Personnel Requirements Secretarial, clerical, word processing, accounting,<br />
bookkeeping <strong>and</strong> payroll services<br />
Safety <strong>and</strong> Medical Medical facilities, supplies, services, air <strong>and</strong> ground<br />
ambulance, safety officers<br />
Logistics Materials h<strong>and</strong>ling, expediting, freight transport, light<br />
delivery <strong>and</strong> courier services<br />
Accommodation <strong>and</strong> Meals Apartments, hotels <strong>and</strong> motels, camps, restaurants,<br />
grocery stores<br />
Table 22: Business Opportunities 17<br />
17 adapted from http://www.mackenziegasproject.com/opportunities/businessOpportunities/index.html<br />
64
13 Community Preparation<br />
With knowledge of the potential scale <strong>and</strong> timing of oil <strong>and</strong> gas development in <strong>North</strong> <strong>Yukon</strong><br />
now in h<strong>and</strong>, this section of the paper turns to look at how <strong>Yukon</strong> communities can prepare<br />
for sustained <strong>and</strong> responsible oil <strong>and</strong> gas development. As prelude to describing potential<br />
approaches <strong>and</strong> strategies for community preparation, a framework for the identification of<br />
potential socio-economic effects resulting from oil <strong>and</strong> gas activity in <strong>North</strong> <strong>Yukon</strong> is<br />
introduced below.<br />
13.1 Potential socio-economic effects: a framework<br />
<strong>Development</strong> of oil <strong>and</strong> natural gas resources in <strong>North</strong> <strong>Yukon</strong> will spawn a variety of socioeconomic<br />
effects. The relevance <strong>and</strong> importance of a given effect is a matter of perspective.<br />
In terms of economic effects, typical perspectives include labour (households), businesses<br />
<strong>and</strong> government. In terms of social effects, perspectives can include health (mental <strong>and</strong><br />
physical), cultural well-being, lifestyles, demographics, l<strong>and</strong> use, community, <strong>and</strong> social<br />
organization. 18<br />
Within each of the economic <strong>and</strong> social perspectives, each project effect can be described<br />
according to three dimensions: timing, degree <strong>and</strong> span.<br />
In terms of timing, socio-economic effects can be direct or flow-on in nature. Direct effects<br />
are the most immediate of all project effects <strong>and</strong> are generally a clear result of the project.<br />
Flow-on effects are the result of direct effects. Flow-on effects last for a longer period of time<br />
than do direct effects <strong>and</strong> typically involve more individuals located in a broader geographic<br />
area. The duration of the effect (the length of time an effect lasts) is also an important<br />
aspect.<br />
With regard to degree, a socioeconomic effect may be positive or negative in nature.<br />
Positive effects are usually described as benefits (e.g., jobs) while negative effects are often<br />
described as impacts (e.g., changes in family structure). Whether positive or negative, the<br />
scale (or, size) of the effect is also important.<br />
The span of an effect refers to how far afield the effect is experienced – locally, territorially<br />
or nationally. Social effects tend to be experienced more at the local <strong>and</strong> territorial level<br />
while economic effects flow according to the economic linkages associated with the project.<br />
As a result, it is possible for some economic effects to be experienced only at distances far<br />
removed from the project location.<br />
The socio-economic effects framework is illustrated in Table 23 together with some<br />
examples of potential socio-economic effects. The list of potential effects has been derived<br />
from documentation describing the experiences in other oil <strong>and</strong> gas frontier regions, namely<br />
Atlantic Canada, the <strong>North</strong>west Territories (Mackenzie Valley) <strong>and</strong> coastal British Columbia.<br />
Note that the framework applies to each of the three main phases of oil <strong>and</strong> gas activity:<br />
exploration, development <strong>and</strong> production.<br />
18 Adapted from C.N. Taylor, C.H. Bryan, <strong>and</strong> C.G. Goodrich, Social Assessment: Theory, Process <strong>and</strong> Techniques<br />
(third edition), 2004, p.108.<br />
65
Economic Effects<br />
Labour<br />
employment<br />
wages/salaries<br />
training/education<br />
Business<br />
business opportunities<br />
business revenue<br />
capital/rental income<br />
technology transfers<br />
Government<br />
royalties<br />
provision of public services<br />
price inflation<br />
changes in fiscal flows<br />
economic output (GDP)<br />
Social Effects 19<br />
Health<br />
stress <strong>and</strong> anxiety related to<br />
working conditions<br />
substance abuse<br />
Cultural well-being<br />
changes in the cultural<br />
composition of communities<br />
effects on known cultural,<br />
historical, spiritual <strong>and</strong><br />
archeological resources<br />
Lifestyles<br />
loss of traditional livelihood<br />
change in wage/non-wage focus<br />
of community<br />
Demographics<br />
population change<br />
influx of temporary workers<br />
dissimilarity in age, gender, racial<br />
or ethnic composition<br />
L<strong>and</strong> use<br />
competing uses<br />
environmental degradation<br />
l<strong>and</strong> acquisition <strong>and</strong> disposal<br />
Community<br />
effects on perceived quality of life<br />
changes in social networks or<br />
community organizations<br />
Social organization<br />
changes in distribution of power<br />
<strong>and</strong> authority<br />
changes in wealth distribution<br />
direct<br />
□yes<br />
□ no<br />
□yes<br />
□ no<br />
□yes<br />
□ no<br />
□yes<br />
□ no<br />
□yes<br />
□ no<br />
□yes<br />
□ no<br />
□yes<br />
□ no<br />
□yes<br />
□ no<br />
□yes<br />
□ no<br />
□yes<br />
□ no<br />
--Timing -- -- Degree -- -- Span --<br />
flow-on<br />
□yes<br />
□ no<br />
□yes<br />
□ no<br />
□yes<br />
□ no<br />
□yes<br />
□ no<br />
□yes<br />
□ no<br />
□yes<br />
□ no<br />
□yes<br />
□ no<br />
□yes<br />
□ no<br />
□yes<br />
□ no<br />
□yes<br />
□ no<br />
duration<br />
_____<br />
_____<br />
_____<br />
_____<br />
_____<br />
_____<br />
_____<br />
_____<br />
_____<br />
_____<br />
66<br />
positive<br />
□yes<br />
□ no<br />
□yes<br />
□ no<br />
□yes<br />
□ no<br />
□yes<br />
□ no<br />
□yes<br />
□ no<br />
□yes<br />
□ no<br />
□yes<br />
□ no<br />
□yes<br />
□ no<br />
□yes<br />
□ no<br />
□yes<br />
□ no<br />
negative<br />
□yes<br />
□ no<br />
□yes<br />
□ no<br />
□yes<br />
□ no<br />
□yes<br />
□ no<br />
□yes<br />
□ no<br />
□yes<br />
□ no<br />
□yes<br />
□ no<br />
□yes<br />
□ no<br />
□yes<br />
□ no<br />
□yes<br />
□ no<br />
Table 23: Socio-economic effects framework<br />
19 Adapted in part from Jessica Turnley, Social, Cultural, Economic Impact Assessments: A Literature Review, United<br />
States Environmental Protection Agency, 2002, page 11.<br />
scale<br />
_____<br />
_____<br />
_____<br />
_____<br />
_____<br />
_____<br />
_____<br />
_____<br />
_____<br />
_____<br />
local<br />
□yes<br />
□ no<br />
□yes<br />
□ no<br />
□yes<br />
□ no<br />
□yes<br />
□ no<br />
□yes<br />
□ no<br />
□yes<br />
□ no<br />
□yes<br />
□ no<br />
□yes<br />
□ no<br />
□yes<br />
□ no<br />
□yes<br />
□ no<br />
territorial<br />
□yes<br />
□ no<br />
□yes<br />
□ no<br />
□yes<br />
□ no<br />
□yes<br />
□ no<br />
□yes<br />
□ no<br />
□yes<br />
□ no<br />
□yes<br />
□ no<br />
□yes<br />
□ no<br />
□yes<br />
□ no<br />
□yes<br />
□ no<br />
national<br />
□yes<br />
□ no<br />
□yes<br />
□ no<br />
□yes<br />
□ no<br />
□yes<br />
□ no<br />
□yes<br />
□ no<br />
□yes<br />
□ no<br />
□yes<br />
□ no<br />
□yes<br />
□ no<br />
□yes<br />
□ no<br />
□yes<br />
□ no
The socio-economic effects framework presented above can be used as a tool for the<br />
identification of the economic <strong>and</strong> social effects potentially resulting from oil <strong>and</strong> gas activity<br />
in <strong>North</strong> <strong>Yukon</strong>. The framework is to be implemented by first confirming, based on the<br />
experience of <strong>North</strong> <strong>Yukon</strong> stakeholders, what the likely socio-economic effects of oil <strong>and</strong><br />
gas activity in <strong>North</strong> <strong>Yukon</strong> are likely to be. For each effect so confirmed the next step is to<br />
indicate the expected timing, degree <strong>and</strong> span of each effect. To be comprehensive, the<br />
exercise should be undertaken for each of the three main phases of oil <strong>and</strong> gas activity<br />
(exploration, development <strong>and</strong> production). The results of the timing/degree/span exercise<br />
will provide a broad indication of where <strong>Yukon</strong> communities can focus their efforts in<br />
preparing for oil <strong>and</strong> gas development.<br />
13.2 Potential community strategies to prepare for sustained <strong>and</strong><br />
responsible oil <strong>and</strong> gas development<br />
On the basis of the results of the timing/degree/span exercise, communities can begin to<br />
prepare a max/min strategy which maximizes (i.e., enhances) the positive socio-economic<br />
effects <strong>and</strong> minimizes the negative socio-economic effects of oil <strong>and</strong> gas development. 20 To<br />
illustrate what some of the elements of such a max/min strategy might include, this section<br />
of the paper looks at some potential approaches to community preparation including: benefit<br />
plans, human resource planning, benefit agreements <strong>and</strong> expectations management.<br />
13.2.1 Benefit Plans<br />
A primary benefit of oil <strong>and</strong> gas development from the perspective of public governments is<br />
the capture of economic rents from resource development in the form of royalties. In the late<br />
1970s, the Government of Newfoundl<strong>and</strong>, recognizing that resource revenues in the form of<br />
oil <strong>and</strong> gas royalties would likely be forfeited under the federal-provincial equalization<br />
program, pursued an innovative regulatory policy approach which sought to maximize direct<br />
local benefits from industry development. A primary objective of the subsequent regulations<br />
was to “…minimize negative effects on traditional industries, communities <strong>and</strong> culture <strong>and</strong><br />
avoid ‘boom/bust’ effects.” 21 That objective has become embodied by so-called Benefit<br />
Plans which outline in detail the developer’s polices <strong>and</strong> procedures with respect to local<br />
benefits. Benefit Plans typically speak to:<br />
♦ “Supplier development, including identifying potential suppliers, providing them with<br />
information about technical, commercial <strong>and</strong> other requirements, <strong>and</strong> debriefing<br />
unsuccessful bidders.<br />
♦ Procurement policies, <strong>and</strong> especially bid packaging, which facilitate the opportunities<br />
for local companies.<br />
♦ Training, hiring <strong>and</strong> succession planning, such that the employment of local people is<br />
encouraged, including through the timely replacement of ‘expats.’ This often includes<br />
requirements related to the training, hiring <strong>and</strong> retention of women <strong>and</strong> minorities.<br />
20<br />
The absence of discussion here about the environmental effects of oil <strong>and</strong> gas development in <strong>North</strong> <strong>Yukon</strong> is not<br />
intended to diminish the importance of the environmental assessment process. It is fully expected that environmental<br />
assessments of the appropriate scale will be conducted under terms of the <strong>Yukon</strong> Environmental <strong>and</strong> Socioeconomic<br />
Assessment Act.<br />
21<br />
Mark Shrimpton, Benefiting Communities: Lessons from Around the Atlantic, Society of Petroleum Engineers,<br />
2002, pp. 2 &3.<br />
67
♦ Technology transfer <strong>and</strong> research <strong>and</strong> development, so as to ensure local suppliers of<br />
goods <strong>and</strong> services, <strong>and</strong> local employees, develop new capabilities related to industry<br />
requirements.” 22<br />
An example of a completed benefits plan, submitted by Husky <strong>Oil</strong> as part of the White Rose<br />
<strong>Oil</strong>field <strong>Development</strong> Application, may be found at:<br />
http://www.husky-oil.com/whiterose/development/.<br />
13.2.2 Human Resource Planning<br />
The employment of the local labour force by oil <strong>and</strong> gas companies (<strong>and</strong> their<br />
subcontractors) engaged in exploration, development <strong>and</strong> production activities in <strong>North</strong><br />
<strong>Yukon</strong> will be a major effect of oil <strong>and</strong> gas activity in <strong>North</strong> <strong>Yukon</strong>. The scale <strong>and</strong> timing of<br />
employment opportunities was illustrated in Section 12.4.5 in Figure 24 “NYGP Estimated<br />
Direct Employment Levels.”<br />
An effective human resource plan will accurately assess the gap between the human<br />
resource requirements of oil <strong>and</strong> gas development activity in <strong>North</strong> <strong>Yukon</strong> <strong>and</strong> the available<br />
labour pools in <strong>North</strong> <strong>Yukon</strong> <strong>and</strong> <strong>Yukon</strong>-wide. A starting point to the potential human<br />
resource requirements can be found in section 5 of this paper which lists the types of jobs<br />
required for resource development, pipeline development as well as oil refining. Profiling of<br />
<strong>North</strong> <strong>Yukon</strong> <strong>and</strong> <strong>Yukon</strong>-wide labour pools can be undertaken by first defining who<br />
constitutes a resident of <strong>North</strong> <strong>Yukon</strong> <strong>and</strong> <strong>Yukon</strong>-wide regions. The definition of residents is<br />
then followed by an examination of their employability in terms of wellness, general<br />
employment skills <strong>and</strong> occupation-specific competencies.<br />
Comparison of the human resource requirements with the labour pool profiles will yield an<br />
identification of the human resources gap. The final step in the human resource plan is the<br />
construction of a training plan designed to close the gap between industry needs <strong>and</strong> the<br />
local supply of labour.<br />
The oil <strong>and</strong> gas industry operates on a global scale. As such, the development of <strong>North</strong><br />
<strong>Yukon</strong>’s oil <strong>and</strong> gas resources will be driven by market forces. In consequence, it is difficult<br />
to predict the exact pattern of development <strong>and</strong> the exact human resource requirements<br />
corresponding to that pattern making human resource planning challenging. Significant lead<br />
time is required by both postsecondary academic institutions <strong>and</strong> private organizations to<br />
implement education <strong>and</strong> training programs <strong>and</strong> by students to actually complete their<br />
studies. The timely solving of this human resource planning challenge is of critical<br />
importance to industry development.<br />
An example of how to address the oil <strong>and</strong> gas industry human resource planning challenge<br />
is provided by the “Nova Scotia Offshore Labour Dem<strong>and</strong> Model” developed in response to<br />
the upswing in oil <strong>and</strong> gas industry activity in Nova Scotia in the early 00’s. 23 The model is<br />
not designed to provide a forecast of exploration <strong>and</strong> development activity but is instead a<br />
simulation model that can forecast the dem<strong>and</strong> for competency-based human resource<br />
requirements for a series of industry development scenarios. The core-competencies<br />
(combinations of knowledge, skills, abilities, education <strong>and</strong> experience) needed to effectively<br />
22 Ibid, p. 5.<br />
23 The complete 194 page document describing the Nova Scotia model can be found at:<br />
http://www.pr-ac.ca/files/Labour_Dem<strong>and</strong>_Model_-_Final_Report.pdf.<br />
68
perform more than 70 industry-related occupations are specified in the model. Designed to<br />
be flexible in response to changing market conditions, new discoveries <strong>and</strong> technological<br />
advancements, the spreadsheet-based model allows users to define various development<br />
scenarios <strong>and</strong> calculate the corresponding human resource requirements. By running<br />
multiple scenarios users can identify human resource requirements common to a variety of<br />
eventualities which can then be used as a basis for the start-up of discussions with postsecondary<br />
institutions <strong>and</strong> private training organizations.<br />
13.2.3 Benefit Agreements 24<br />
Benefit agreements are a commonly used tool in Canada’s north to ensure that local<br />
communities realize economic benefits from resource development projects. Indeed, section<br />
68 of the <strong>Yukon</strong>’s <strong>Oil</strong> <strong>and</strong> <strong>Gas</strong> Act explicitly requires that a benefits agreement be<br />
negotiated which provides opportunities for <strong>Yukon</strong> First Nations (government <strong>and</strong> citizens)<br />
on whose settlement l<strong>and</strong> oil <strong>and</strong> gas activity will be taking place, residents of communities<br />
affected by the oil <strong>and</strong> gas activity <strong>and</strong> other <strong>Yukon</strong> residents. The benefit agreement is to<br />
include opportunity provisions for:<br />
♦ employment <strong>and</strong> training, <strong>and</strong><br />
♦ the supply goods <strong>and</strong> services to the developer (<strong>and</strong> subcontractors). 25<br />
Benefit agreements are designed to stem the leakage of economic benefits from local<br />
communities <strong>and</strong> individuals. As such, they are not an attempt to expropriate economic rent<br />
for which industry proponents have already negotiated access. To illustrate, leakage ratios<br />
for a hypothetical construction project were calculated for Canada’s three northern<br />
territories.<br />
The leakage ratios were derived using input-output multipliers 26 from Statistics Canada’s<br />
2000 Interprovincial Input-Output Model. The ratios demonstrate the percentage of wages<br />
<strong>and</strong> salaries, gross domestic product GDP) <strong>and</strong> person years of employment “lost” when a<br />
construction project is undertaken in a jurisdiction other than the benchmark jurisdiction,<br />
Ontario. 27 The ratios represent the difference, in percentage terms, between a multiplier for<br />
direct <strong>and</strong> indirect effects within a given territory <strong>and</strong> the corresponding Ontario multiplier.<br />
The results of the analysis are shown in the figure below. The amount of leakage associated<br />
with a given amount of construction spending is indicated by the value of the leakage ratio.<br />
For example, in the <strong>Yukon</strong>, the leakage ratio for direct <strong>and</strong> indirect multiplier effects on<br />
wages <strong>and</strong> salaries resulting from a construction spending is 34%. This means that, relative<br />
to Ontario, 34% of the direct <strong>and</strong> indirect labour income associated with a construction<br />
project in the <strong>Yukon</strong> will “leak” out of the territorial economy. For example, if $10 million were<br />
spent in Ontario on a construction project, Ontario would experience $10 million dollars<br />
24<br />
Also commonly known as impact <strong>and</strong> benefit agreements.<br />
25<br />
A Benefits Agreement template for exploration activities which mirrors section 68 of the <strong>Yukon</strong> <strong>Oil</strong> <strong>and</strong> <strong>Gas</strong> Act is<br />
available at http://www.emr.gov.yk.ca/oil<strong>and</strong>gas/exploration/default.htm#benefits.<br />
26<br />
A popular approach to the measurement of the economic effects of a project is to use multipliers which derive from<br />
complex mathematical models called Input-Output (I-O) tables. Input-Output multipliers allow the tracing of changes<br />
in an economy that result from a “spending injection” such as the construction of a major project. Economic impact<br />
estimates calculated with Statistics Canada multipliers can be separated into direct <strong>and</strong> indirect components <strong>and</strong> can<br />
be limited to a provincial/territorial economy or can include impacts traced throughout the entire Canadian economy.<br />
Statistics Canada does not publish multipliers at the community level.<br />
27<br />
Ontario was chosen as the benchmark jurisdiction because it is Canada’s largest subnational economy <strong>and</strong> is<br />
therefore least likely to exhibit leakages.<br />
69
(percent)<br />
worth of positive labour income effects. Conversely, if the same $10 million was spent in the<br />
<strong>Yukon</strong>, one third ($3,333,000) of the positive labour income effects would leak out of the<br />
territory to the benefit of other jurisdictions.<br />
Correspondingly, 38% of the gross domestic product effects will leak away. In terms of direct<br />
<strong>and</strong> indirect employment effects, a construction project in the <strong>Yukon</strong> will result in less<br />
employment for local residents than it will for workers in other jurisdictions; 32% of jobs will<br />
leak out of the territorial economy. By way of comparison, as also shown in the figure,<br />
leakage ratios for labour income, salaries, GDP <strong>and</strong> employment for the <strong>North</strong>west<br />
Territories <strong>and</strong> Nunavut are higher than in the <strong>Yukon</strong>.<br />
80%<br />
70%<br />
60%<br />
50%<br />
40%<br />
30%<br />
20%<br />
10%<br />
0%<br />
Leakage Ratios Relative to Ontario Benchmark<br />
Direct <strong>and</strong> Indirect Multiplier Effects within Territory<br />
-- Construction Industry --<br />
Direct + Indirect Wages <strong>and</strong> Salaries<br />
Direct + Indirect GDP<br />
Direct + Indirect Employment<br />
<strong>Yukon</strong> NWT Nunavut<br />
Source: adapted from Statistic's Canada's 2000 Interprovincial Open Input-Output Model<br />
As Statistics Canada multipliers are not available at the community level, the calculation of<br />
sub-territorial level leakage ratios is not possible. The dominant economic role played by<br />
Whitehorse in the <strong>Yukon</strong> economy means, however, that if community-level leakage ratios<br />
could be calculated, they would most certainly be higher than the ratios presented above.<br />
13.2.4 Expectations Management<br />
For a max/min oil <strong>and</strong> gas development strategy be properly executed in <strong>North</strong> <strong>Yukon</strong> – one<br />
that maximizes the positive socio-economic effects <strong>and</strong> minimizes the negative socioeconomic<br />
effects – will require effective communication between local communities <strong>and</strong><br />
industry proponents. As noted by Mark Shrimpton, large-scale industrial activity often faces<br />
several stereotypical expectations from the get-go including:<br />
♦ “Most benefits will accrue to non-local corporations <strong>and</strong> their shareholders, with any<br />
local benefits being concentrated in the h<strong>and</strong>s of few highly specialized <strong>and</strong> already<br />
prosperous companies <strong>and</strong> individuals.<br />
70
♦ There will be boom-bust effects during construction activity, likely including housing<br />
shortages, traffic congestion, wage <strong>and</strong> cost of living inflation <strong>and</strong> crime <strong>and</strong> other<br />
social problems.<br />
♦ There will be negative social, economic, cultural <strong>and</strong> biophysical effects during<br />
operations, as the industry’s activities <strong>and</strong> culture undermine traditional industries <strong>and</strong><br />
local lifestyles, as the scale of industry activity fluctuates in response to price cycles<br />
<strong>and</strong> through chronic <strong>and</strong> occasional accidental releases of pollution.<br />
♦ The eventual cessation of activity will leave a negative social, economic, cultural <strong>and</strong><br />
biophysical legacy.” 28<br />
Shrimpton further notes, based on experiences in other frontier oil <strong>and</strong> gas regions, that for<br />
development to succeed according to the desires of all affected parties, a reciprocal<br />
program of public education <strong>and</strong> engagement is a critical requirement. In terms of the<br />
outcomes of the public education <strong>and</strong> engagement program, local stakeholders should have<br />
an improved underst<strong>and</strong>ing of the oil industry <strong>and</strong> the prospective effects of industry<br />
development as well as how industry will manage the effects. At the same time, “…it is also<br />
critical that oil industry personnel underst<strong>and</strong> the local political, cultural, social <strong>and</strong> economic<br />
context, including the local values, priorities <strong>and</strong> aspirations.” 29<br />
To prepare for oil <strong>and</strong> gas industry development, communities can: 30<br />
♦ gather information from oil <strong>and</strong> gas companies <strong>and</strong> industry associations;<br />
♦ seek to learn from the experiences of others (while bearing in mind that comparative<br />
research features both merits <strong>and</strong> pitfalls 31 );<br />
♦ host public workshops on the petroleum industry <strong>and</strong> the potential socio-economic<br />
effects of industry development; <strong>and</strong><br />
♦ establish multi-stakeholder committees to investigate <strong>and</strong> report on socio-economic<br />
effects issues.<br />
For its part, industry can facilitate a positive relationship with communities “…through<br />
collaborative <strong>and</strong> cooperative approaches involving all local <strong>and</strong> industry stakeholders” 32<br />
including:<br />
♦ learning about the local context;<br />
♦ educating people about the industry; <strong>and</strong><br />
♦ developing relationships <strong>and</strong> trust.<br />
This section has described four potential approaches to community preparation for the<br />
sustained <strong>and</strong> responsible development of <strong>North</strong> <strong>Yukon</strong> oil <strong>and</strong> gas resources. While no single<br />
28<br />
Mark Shrimpton, Benefiting Communities: Lessons from Around the Atlantic, Society of Petroleum Engineers,<br />
2002, pp. 2-3.<br />
29<br />
Ibid, p. 6.<br />
30<br />
Adapted from Mark Shrimpton, The Issue of Access: Confronting Community Expectations, Society of Petroleum<br />
Engineers, 2004, pp. 4-5.<br />
31<br />
A listing of the pitfalls of comparative may be found in The Issue of Access: Confronting Community Expectations<br />
at pages 4 <strong>and</strong> 5.<br />
32<br />
Mark Shrimpton <strong>and</strong> Keith Storey, Managing the Relationship Between the Offshore <strong>Oil</strong> Industry <strong>and</strong> Frontier<br />
Regions, Society of Petroleum Engineers, 2000, pp. 3-5.<br />
71
approach will be sufficient to address all of the potential socio-economic effects outlined in<br />
Table 23, combinations of approaches may be implemented. Innovative solutions reflective of<br />
the <strong>Yukon</strong>’s unique nature <strong>and</strong> circumstances also remain a possibility.<br />
72
References<br />
Brown, T., Foster, M. <strong>and</strong> Whiteside, M. (2002). Nova Scotia Offshore Labour Dem<strong>and</strong> Model Final<br />
Report. Prepared for Petroleum Research Atlantic Canada.<br />
Community Resource Services Ltd. (2003). Socio-economic Benefits from Petroleum Industry Activity in<br />
Newfoundl<strong>and</strong> <strong>and</strong> Labrador. Prepared for Petroleum Research Atlantic Canada.<br />
G.E. Bridges <strong>and</strong> Associates Inc. (2004). Socio-economic Expenditure Impacts Report (British Columbia<br />
Offshore <strong>Oil</strong> <strong>and</strong> <strong>Gas</strong> Socio-economic Issues Papers). Prepared for Royal Roads University.<br />
Locke, W. <strong>and</strong> Strategic Concepts Inc. (2004). Exploring Issues Related to Local Benefit Capture in<br />
Atlantic Canada’s <strong>Oil</strong> <strong>and</strong> <strong>Gas</strong> Industry. Prepared for Petroleum Research Atlantic Canada.<br />
Luton, H. <strong>and</strong> Cluck, R. (2000). Applied Social Science in MMS: A Framework for Decisionmaking.<br />
Minerals Management Service Environmental Studies Program.<br />
Mackenzie <strong>Gas</strong> Project Preliminary Information Package Section 7 Industrial Benefits Plan. (2003).<br />
Mackenzie <strong>Gas</strong> Project.<br />
Sable Offshore Energy Project Benefits Plan Decision Document. (1997). Canada-Nova Scotia Offshore<br />
Petroleum Board.<br />
Shrimpton, M. (2002). Benefiting Communities: Lessons from Around the Atlantic. Society of Petroleum<br />
Engineers.<br />
Shrimpton, M. <strong>and</strong> Storey, K. (2000). Managing the Relationship Between the Offshore <strong>Oil</strong> Industry <strong>and</strong><br />
Frontier Regions. Society of Petroleum Engineers.<br />
Shrimpton, M. (2004). The Issue of Access: Confronting Community Expectations. Society of Petroleum<br />
Engineers.<br />
Taylor, A., Severson-Baker, C., Winfield, M., Woynillowicz, D. <strong>and</strong> Griffiths, M. (2004). When the<br />
Government is L<strong>and</strong>lord: Economic Rent, Non-renewable Permanent Funds, <strong>and</strong> Environmental Impacts<br />
Related to <strong>Oil</strong> <strong>and</strong> <strong>Gas</strong> <strong>Development</strong>s in Canada. The Pembina Institute.<br />
Taylor, C., Bryan, C. <strong>and</strong> Goodrich, C. (2004). Social Assessment: Theory, Process <strong>and</strong> Techniques<br />
(third edition). Social Ecology Press.<br />
Turnley, J. (2002). Social, Cultural, Economic Impact Assessments: A Literature Review. Prepared for the<br />
Office of Emergency <strong>and</strong> Remedial Response, United States Environmental Protection Agency.<br />
White Rose <strong>Oil</strong>field <strong>Development</strong> Application Volume 1 Canada-Newfoundl<strong>and</strong> Benefits Plan. (2001).<br />
Husky <strong>Oil</strong> Operations Ltd.<br />
World Bank Group Activities in the Extractive Industries (Background Paper for the Extractive Industries<br />
Review). (2001) World Bank Group.<br />
73
14 Constraints to <strong>Development</strong><br />
The intent of this section was to be a compilation of outcomes of a workshop to be conducted<br />
with the <strong>North</strong> <strong>Yukon</strong> <strong>Oil</strong> <strong>and</strong> <strong>Gas</strong> Working Group. The intent of the workshop was to conduct a<br />
risk identification <strong>and</strong> planning process with all members invited to participate in identifying both<br />
positive <strong>and</strong> negative impacts of oil <strong>and</strong> gas development in <strong>North</strong> <strong>Yukon</strong>. Major issues that<br />
form constraints to development would be prioritized <strong>and</strong> catalogued along with suggestions for<br />
working through the issues.<br />
The results of the workshop were originally contemplated to be included in this report. It was<br />
later decided that the technical details of this report needed to be read, reviewed <strong>and</strong> discussed<br />
first. The workshop is still planned for a future time.<br />
74