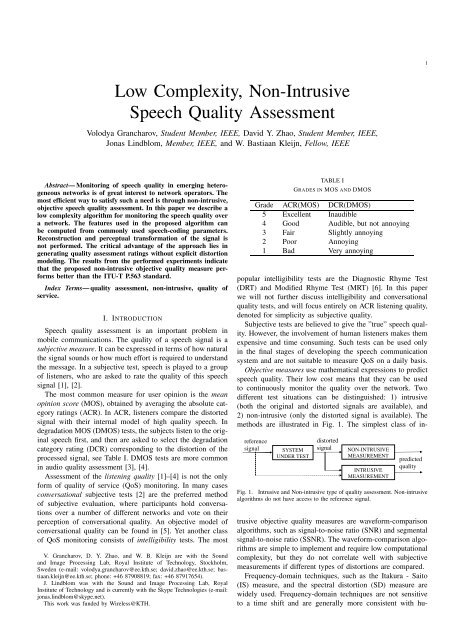
Low Complexity, Non-Intrusive Speech Quality Assessment
Low Complexity, Non-Intrusive Speech Quality Assessment
Low Complexity, Non-Intrusive Speech Quality Assessment

Create successful ePaper yourself
Turn your PDF publications into a flip-book with our unique Google optimized e-Paper software.
<strong>Low</strong> <strong>Complexity</strong>, <strong>Non</strong>-<strong>Intrusive</strong><br />
<strong>Speech</strong> <strong>Quality</strong> <strong>Assessment</strong><br />
Volodya Grancharov, Student Member, IEEE, David Y. Zhao, Student Member, IEEE,<br />
Jonas Lindblom, Member, IEEE, and W. Bastiaan Kleijn, Fellow, IEEE<br />
Abstract— Monitoring of speech quality in emerging heterogeneous<br />
networks is of great interest to network operators. The<br />
most efficient way to satisfy such a need is through non-intrusive,<br />
objective speech quality assessment. In this paper we describe a<br />
low complexity algorithm for monitoring the speech quality over<br />
a network. The features used in the proposed algorithm can<br />
be computed from commonly used speech-coding parameters.<br />
Reconstruction and perceptual transformation of the signal is<br />
not performed. The critical advantage of the approach lies in<br />
generating quality assessment ratings without explicit distortion<br />
modeling. The results from the performed experiments indicate<br />
that the proposed non-intrusive objective quality measure performs<br />
better than the ITU-T P.563 standard.<br />
Index Terms— quality assessment, non-intrusive, quality of<br />
service.<br />
I. INTRODUCTION<br />
<strong>Speech</strong> quality assessment is an important problem in<br />
mobile communications. The quality of a speech signal is a<br />
subjective measure. It can be expressed in terms of how natural<br />
the signal sounds or how much effort is required to understand<br />
the message. In a subjective test, speech is played to a group<br />
of listeners, who are asked to rate the quality of this speech<br />
signal [1], [2].<br />
The most common measure for user opinion is the mean<br />
opinion score (MOS), obtained by averaging the absolute category<br />
ratings (ACR). In ACR, listeners compare the distorted<br />
signal with their internal model of high quality speech. In<br />
degradation MOS (DMOS) tests, the subjects listen to the original<br />
speech first, and then are asked to select the degradation<br />
category rating (DCR) corresponding to the distortion of the<br />
processed signal, see Table I. DMOS tests are more common<br />
in audio quality assessment [3], [4].<br />
<strong>Assessment</strong> of the listening quality [1]–[4] is not the only<br />
form of quality of service (QoS) monitoring. In many cases<br />
conversational subjective tests [2] are the preferred method<br />
of subjective evaluation, where participants hold conversations<br />
over a number of different networks and vote on their<br />
perception of conversational quality. An objective model of<br />
conversational quality can be found in [5]. Yet another class<br />
of QoS monitoring consists of intelligibility tests. The most<br />
V. Grancharov, D. Y. Zhao, and W. B. Kleijn are with the Sound<br />
and Image Processing Lab, Royal Institute of Technology, Stockholm,<br />
Sweden (e-mail: volodya.grancharov@ee.kth.se; david.zhao@ee.kth.se; bastiaan.kleijn@ee.kth.se;<br />
phone: +46 87908819; fax: +46 87917654).<br />
J. Lindblom was with the Sound and Image Processing Lab, Royal<br />
Institute of Technology and is currently with the Skype Technologies (e-mail:<br />
jonas.lindblom@skype.net).<br />
This work was funded by Wireless@KTH.<br />
TABLE I<br />
GRADES IN MOS AND DMOS<br />
Grade ACR(MOS) DCR(DMOS)<br />
5 Excellent Inaudible<br />
4 Good Audible, but not annoying<br />
3 Fair Slightly annoying<br />
2 Poor Annoying<br />
1 Bad Very annoying<br />
popular intelligibility tests are the Diagnostic Rhyme Test<br />
(DRT) and Modified Rhyme Test (MRT) [6]. In this paper<br />
we will not further discuss intelligibility and conversational<br />
quality tests, and will focus entirely on ACR listening quality,<br />
denoted for simplicity as subjective quality.<br />
Subjective tests are believed to give the ”true” speech quality.<br />
However, the involvement of human listeners makes them<br />
expensive and time consuming. Such tests can be used only<br />
in the final stages of developing the speech communication<br />
system and are not suitable to measure QoS on a daily basis.<br />
Objective measures use mathematical expressions to predict<br />
speech quality. Their low cost means that they can be used<br />
to continuously monitor the quality over the network. Two<br />
different test situations can be distinguished: 1) intrusive<br />
(both the original and distorted signals are available), and<br />
2) non-intrusive (only the distorted signal is available). The<br />
methods are illustrated in Fig. 1. The simplest class of in-<br />
reference<br />
signal SYSTEM<br />
UNDER TEST<br />
distorted<br />
signal<br />
NON-INTRUSIVE<br />
MEASUREMENT<br />
INTRUSIVE<br />
MEASUREMENT<br />
predicted<br />
quality<br />
Fig. 1. <strong>Intrusive</strong> and <strong>Non</strong>-intrusive type of quality assessment. <strong>Non</strong>-intrusive<br />
algorithms do not have access to the reference signal.<br />
trusive objective quality measures are waveform-comparison<br />
algorithms, such as signal-to-noise ratio (SNR) and segmental<br />
signal-to-noise ratio (SSNR). The waveform-comparison algorithms<br />
are simple to implement and require low computational<br />
complexity, but they do not correlate well with subjective<br />
measurements if different types of distortions are compared.<br />
Frequency-domain techniques, such as the Itakura - Saito<br />
(IS) measure, and the spectral distortion (SD) measure are<br />
widely used. Frequency-domain techniques are not sensitive<br />
to a time shift and are generally more consistent with hu-<br />
1
2<br />
man perception [7]. The distinguishing characteristic of both<br />
waveform comparison and frequency domain techniques is<br />
that they are equipped with a simple schemes for combining<br />
the estimated per-frame distortions. In addition, they do not<br />
contain mappings that are trained by databases.<br />
A significant number of intrusive perceptual-domain measures<br />
has been developed. These measures incorporate knowledge<br />
of the human perceptual system. Mimicry of human<br />
perception is used for dimension reduction and a ”cognitive”<br />
stage is used to perform the mapping to a quality scale. The<br />
cognitive stage is trained by means of one or more databases.<br />
These measures include the Bark Spectral Distortion (BSD)<br />
[8], Perceptual <strong>Speech</strong> <strong>Quality</strong> (PSQM) [9], and Measuring<br />
Normalizing Blocks (MNB) [10], [11]. Perceptual evaluation<br />
of speech quality (PESQ) [12] and perceptual evaluation of<br />
audio quality (PEAQ) [13] are standardized state-of-the-art<br />
algorithms for intrusive quality assessment of speech, and<br />
audio respectively.<br />
Existing intrusive objective speech quality measures may<br />
automatically assess the performance of the communication<br />
system without the need for human listeners. However, intrusive<br />
measures require the presence of the original signal,<br />
which is typically not available in QoS monitoring. For<br />
such applications non-intrusive quality assessment must be<br />
used. These methods often include both mimicry of human<br />
perception and/or a mapping to the quality measure that is<br />
trained using databases.<br />
An early attempt towards non-intrusive speech quality<br />
measure based on a spectrogram of the perceived signal is<br />
presented in [14]. The spectrogram is partitioned, and variance<br />
and dynamic range calculated on a block-by-block basis. The<br />
average level of variance and dynamic range is used to predict<br />
speech quality.<br />
The non-intrusive speech quality assessment reported in<br />
[15] attempts to predict the likelihood that the passing audio<br />
stream is generated by the human vocal production system.<br />
The speech stream under assessment is reduced to a set<br />
of features. The parameterized data is used to estimate the<br />
perceived quality by means of physiologically based rules.<br />
The measure proposed in [16] is based on comparing the<br />
output speech to an artificial reference signal that is appropriately<br />
selected from a optimally clustered codebook. The Perceptual<br />
Linear Prediction (PLP) [17] coefficients are used as a<br />
parametric representation of the speech signal. A fifth-order<br />
all-pole model is performed to suppress speaker-dependent<br />
details of the auditory spectrum. The average distance between<br />
the unknown test vector and the nearest reference centroids<br />
provides an indication of speech degradation.<br />
Recent algorithms based on Gaussian-mixture probability<br />
models (GMM) of features derived from perceptually motivated<br />
spectral-envelope representations can be found in [18]<br />
and [19]. A novel, perceptually motivated speech quality assessment<br />
algorithm based on temporal envelope representation<br />
of speech is presented in [20] and [21].<br />
The International Telecommunication Union (ITU) standard<br />
for non-intrusive quality assessment, ITU-T P.563, can be<br />
found in [22]. A total of 51 speech features are extracted<br />
from the signal. Key features are used to determine a dominant<br />
distortion class, and in each distortion class a linear combination<br />
of features is used to predict a so-called intermediate<br />
speech quality. The final speech quality is estimated from the<br />
intermediate quality and 11 additional features.<br />
The above listed measures for quality assessment are designed<br />
to predict the effects of many types of distortions, and<br />
typically have high computational complexity. Such algorithms<br />
will be referred to as general speech quality predictors. It has<br />
been shown that non-intrusive quality prediction is possible<br />
at much lower complexity if it is assumed that the type of<br />
distortion is known, e.g., [23]. However, the latter class of<br />
measures is likely to suffer from poor prediction performance<br />
if the expected working conditions are not met.<br />
We conclude that existing algorithms either have a high<br />
complexity and a broad range of application or a low complexity<br />
and a narrow range of application. This has motivated<br />
us to develop a speech-quality assessment algorithm with<br />
low computational complexity. The algorithm predicts speech<br />
quality from generic features commonly used in speech coding<br />
(referred to as per-frame features), without an assumption<br />
of the type of distortion. In the proposed low-complexity,<br />
non-intrusive speech quality assessment (LCQA) algorithm an<br />
explicit distortion model is not used, but instead the quality<br />
estimate is based on global statistical properties of per-frame<br />
features. In the next section we provide the motivations for<br />
the critical choices made in the development of the LCQA<br />
algorithm, followed by a detailed algorithm description in<br />
section III. The performance of the proposed algorithm is<br />
compared with ITU-T P.563 in section IV.<br />
II. KEY ISSUES IN OBJECTIVE QUALITY ASSESSMENT<br />
In this section we discuss some unresolved questions in<br />
speech quality assessment. We give the reasoning for the conceptual<br />
choices behind the particular LCQA implementation,<br />
and outline the distinguished features of the algorithm.<br />
The human speech quality assessment process can be divided<br />
into two parts: 1) conversion of the received speech<br />
signal into auditory nerve excitations for the brain, and 2)<br />
cognitive processing in the brain, see Fig. 2. The key prin-<br />
distorted<br />
signal AUDITORY<br />
PROCESSING<br />
nerve<br />
excitation<br />
COGNITIVE<br />
MAPPING<br />
perceived<br />
quality<br />
Fig. 2. Human perception of speech quality involves both hearing and<br />
judgment.<br />
ciples of perceptual transform are signal masking, critical<br />
band spectral resolution, equal-loudness curves, and intensity<br />
loudness law, e.g., [24]. These principles are well studied and<br />
in most existing quality assessment algorithms a perceptual<br />
transform is a pre-processing step. The main implicit purpose<br />
of the perceptual transform is to perform perceptuallyconsistent<br />
dimension reduction on the speech signal. Ideally,<br />
a perceptual transformation retains all perceptually-relevant<br />
information, and discards all perceptually-irrelevant information.<br />
In practice, approximations and simplifications must be<br />
made and this goal may not be met. In some cases, perceptual
transformations may have high computational cost. To avoid<br />
these potential limitations, the proposed LCQA algorithm does<br />
not perform a perceptual transform, but instead the dimensionality<br />
is reduced simultaneously with the optimization of<br />
the mapping function coefficients. The goal is to minimize<br />
the loss of relevant information. Our approach is consistent<br />
with the recent emergence of algorithms performing quality<br />
assessment without a perceptual transform in image quality<br />
assessment [25].<br />
Many of the existing quality assessment algorithms are<br />
based on specific models of distortion, i.e., level of background<br />
noise, multiplicative noise, presence of ringing tones [22], or<br />
simulate a known distortion like handset receiver characteristics<br />
[12]. The LCQA algorithm does not incorporate an explicit<br />
model of the distortion. The speech quality estimate is based<br />
entirely on the statistics of a processed speech signal, and<br />
the distortion is implicitly assessed by its impact on these<br />
statistics. As a result, the LCQA algorithm is easily adapted<br />
to the next generation communication systems that will likely<br />
produce new types of distortions. While this direct approach is<br />
very efficient, the internal workings of the LCQA algorithm do<br />
not lend themselves to interpretation as readily as an algorithm<br />
that uses explicit perceptual transformations and distortion<br />
modeling.<br />
In some methods the speaker-dependent information is<br />
removed [18], [16]. However, it is known that telephony<br />
systems provide higher quality scores for some voices than<br />
for other voices [26]. Therefore, if the algorithm is to be<br />
used for continuous network monitoring, and balanced speech<br />
material for averaging cannot be guaranteed, the speakerdependent<br />
information is relevant. The algorithm presented in<br />
this paper incorporates the speaker-dependent information in<br />
the form of the pitch period and the coefficients of a tenthorder<br />
autoregressive (AR) model estimated by means of linear<br />
prediction.<br />
III. LOW-COMPLEXITY QUALITY ASSESSMENT<br />
The objective of the proposed LCQA algorithm is to provide<br />
an estimate for the MOS score of each utterance. In this paper<br />
with utterance we denote a pair of short sentences separated<br />
by a pause of 0.5 seconds. The total length of an utterance is<br />
approximately 8 s.<br />
The LCQA algorithm predicts speech quality using a simple<br />
set of features that is readily available from speech codecs<br />
in the network. Thus, the speech quality is predicted at low<br />
computational complexity, which makes the method useful for<br />
practical applications.<br />
The core of the LCQA algorithm is the 11-dimensional<br />
per-frame feature vector Φ, with the components defined in<br />
section III-A. The speech quality is not predicted directly from<br />
the per-frame vector, but from its global statistical properties,<br />
described as mean, variance, skew, and kurtosis of the perframe<br />
features. The statistical properties of the per-frame<br />
features (referred to as global features Ψ) form the input for<br />
GMM mapping, which estimates the speech quality level on<br />
a MOS scale.<br />
An interesting property of the LCQA algorithm is that the<br />
per-frame vector can be derived from the variance of the<br />
excitation of the AR model, the pitch period, and the tendimensional<br />
vector of line-spectral frequency (LSF) coefficients,<br />
{E e , T, f}, calculated over 20 ms speech frames. Since<br />
E e , T, and f are readily accessible in the network in the<br />
case of Code-Excited Linear Prediction (CELP) coders [27],<br />
the LCQA algorithm has additional flexibility not to extract<br />
the per-frame vector from the signal waveform, but from the<br />
network parameters.<br />
The general scheme of the LCQA algorithm is shown in<br />
Fig. 3. The module ”<strong>Speech</strong> Encoder Parameterization” stands<br />
for calculation of the E e , T, and f. In the case of CELP<br />
coders, this operation is not performed, and the per-frame<br />
vector is directly calculated from the bitstream parameters. In<br />
the experiments described in this paper, however, the per-frame<br />
vector was always calculated from the speech waveform using<br />
the single technique described in section III-D. Note that the<br />
speech quality is predicted once per utterance, from the global<br />
features.<br />
speech signal<br />
SPEECH ENCODER<br />
PARAMETERIZATION<br />
bitstream<br />
FEATURE<br />
EXTRACTION<br />
STATISTICAL<br />
DESCRIPTION<br />
GMM MAPPING<br />
local (per-frame)<br />
features<br />
global (per-utterance)<br />
features<br />
predicted speech quality<br />
Fig. 3. The structure of the LCQA algorithm. Dashed area represents the<br />
LCQA mode optimal for the CELP coders. In any other environment the<br />
LCQA can extract the required per-frame features from the waveform.<br />
A. <strong>Speech</strong> Features<br />
The basis of any type of automatic quality analysis system<br />
is the extraction of a feature vector. The set of features used<br />
in LCQA aims to capture the structural information from a<br />
speech signal. This is motivated by the fact that the natural<br />
speech signal is highly structured, and it is likely that human<br />
quality judgment relies on patterns extracted from information<br />
describing this structure. In this section we list the per-frame<br />
features that we have selected.<br />
3
4<br />
The spectral flatness measure [28] is related to the strength<br />
of the resonant structure in the power spectrum:<br />
<br />
1 π<br />
exp 2π −π<br />
Φ1(n) =<br />
log (Pn(ω))<br />
<br />
dω<br />
, (1)<br />
1<br />
2π<br />
π<br />
−π Pn(ω)dω<br />
where the AR envelope P (ω) is defined as the frequency<br />
response of the AR model with coefficients ak<br />
1<br />
P (ω) =<br />
|1 + p k=1 ake−jωk . (2)<br />
| 2<br />
The frame index is denoted by n, and p is the order of linear<br />
prediction analysis, typically set to ten for 8 kHz sampled<br />
signal.<br />
As a second per-frame feature we use spectral dynamics,<br />
defined as<br />
Φ2(n) = 1<br />
π<br />
2π<br />
(log Pn(ω) − log Pn−1(ω)) 2 dω. (3)<br />
−π<br />
The spectral dynamics feature has been studied and successfully<br />
used in speech coding [29], [30] and speech enhancement<br />
[31].<br />
The spectral centroid [32] determines the frequency area<br />
around which most of the signal energy concentrates<br />
Φ3(n) =<br />
π<br />
−π ω log (Pn(ω)) dω<br />
π<br />
−π log (Pn(ω))<br />
, (4)<br />
dω<br />
and it is also frequently used as an approximation of a measure<br />
of perceptual ”brightness”. The last three per-frame features<br />
are the variance of the excitation of the AR model E e n, the<br />
speech signal variance E s n, and the pitch period Tn. They will<br />
be denoted as Φ4(n), Φ5(n), and Φ6(n), respectively.<br />
The per-frame features presented above, and their first time<br />
derivatives (except the derivative of the spectral dynamics) are<br />
grouped in an 11 dimensional per-frame feature vector Φ(n).<br />
To clarify the notation, the elements of the per-frame feature<br />
vector are shown in Table II.<br />
TABLE II<br />
ELEMENTS OF PER-FRAME FEATURE VECTOR<br />
Description Feature Time derivative<br />
of feature<br />
Spectral flatness Φ1 Φ7<br />
Spectral dynamics Φ2 -<br />
Spectral centroid Φ3 Φ8<br />
Excitation variance Φ4 Φ9<br />
<strong>Speech</strong> variance Φ5 Φ10<br />
Pitch period Φ6 Φ11<br />
We hypothesize that the speech quality can be estimated<br />
from statistical properties of these per-frame features, and<br />
describe their probability distribution with the mean, variance,<br />
skewness, and kurtosis. The moments are calculated independently<br />
for each per-frame feature, and this gives a set of<br />
features that globally describe one speech utterance (global<br />
features):<br />
µΦi<br />
σΦi<br />
sΦi<br />
kΦi<br />
= 1<br />
| ˜ Ω|<br />
<br />
Φi(n) (5)<br />
n∈ ˜ Ω<br />
1<br />
=<br />
| ˜ <br />
Ω|<br />
1<br />
=<br />
| ˜ Ω|<br />
1<br />
=<br />
| ˜ <br />
Ω|<br />
(Φi(n) − µΦi )2<br />
n∈˜ Ω<br />
<br />
n∈˜ Ω (Φi(n) − µΦi )3<br />
σ 3/2<br />
Φi<br />
(6)<br />
(7)<br />
n∈˜ Ω (Φi(n) − µΦi )4<br />
σ2 . (8)<br />
Φi<br />
With ˜ Ω we denote the set of frames, of cardinality | ˜ Ω|,<br />
used to calculate statistics for each of the per-frame features<br />
Φi(n). The global features are grouped into one global feature<br />
set Ψ = {µΦi , σΦi , sΦi , kΦi }11 i=1 . In the next subsection we<br />
describe a two-step dimensionality reduction procedure that<br />
1) extracts the ”best” subset of frames ˜ Ω out of all available<br />
frames Ω, 2) and transforms global feature set Ψ into global<br />
feature set ˜ Ψ of low dimensionality.<br />
B. Dimensionality Reduction<br />
In this work dimensionality reduction is attained through a<br />
combination of frame selection and global feature selection.<br />
The dimensionality reduction algorithm is important to the<br />
practical performance of quality assessment systems. The<br />
main purpose of the dimensionality reduction algorithm is to<br />
improve predictive accuracy of the quality assessment system<br />
by removing irrelevant and redundant data. The dimensionality<br />
reduction algorithms presented in this section are based on a<br />
training procedure that will be described in detail in section IV.<br />
A commonly used approach in the quality assessment literature,<br />
is to remove non-speech regions based on a voice activity<br />
detector or an energy threshold [33]. We propose a generalization<br />
of this concept by considering activity thresholds<br />
in all per-frame feature dimensions. The scheme, presented<br />
in Table III allows speech active frames to be excluded if<br />
they do not carry information that improves the accuracy of<br />
speech quality prediction. The concept of the frame selection<br />
algorithm is to accept only frames where the per-frame feature<br />
vector Φ lies inside or on the surface of the 11-dimensional<br />
hypercube defined by threshold vector Θ.<br />
TABLE III<br />
THE OPTIMAL SET OF FRAMES AS A FUNCTION OF A THRESHOLD<br />
VECTOR Θ<br />
Initialize: ˜ Ω = {∅}<br />
for n ∈ Ω<br />
if Φ1(n) ∈ [Θ L 1 , Θ U 1 ] & . . . & Φ11(n) ∈ [Θ L 11, Θ U 11]<br />
Accept the n-th frame: ˜ Ω = ˜ Ω + {n}<br />
From Table III we can see that the optimal set of frames<br />
is determined by the threshold Θ = {ΘL i , ΘUi }11 i=1 , i.e.,<br />
˜Ω = ˜ Ω(Θ). We search for the threshold Θ that minimizes<br />
the criterion ε:<br />
Θ = arg min<br />
Θ∗ ε( ˜ Ω(Θ ∗ )). (9)
The criterion ε is calculated as the root-mean-square error<br />
(RMSE) performance of the LCQA algorithm:<br />
ε =<br />
N<br />
i=1 (Qi − ˆ Qi) 2<br />
, (10)<br />
N<br />
where ˆ Q is the predicted quality, and Q is the subjective<br />
quality. Here N is the number of MOS labeled utterances<br />
used in evaluation, see section IV. The optimization of the<br />
threshold Θ is based on the entire set of global features Ψ.<br />
The optimization of ε in (9), with the frame selection<br />
algorithm, described in Table III, results in the following<br />
criterion for the acceptance of the n-th frame:<br />
Φ5(n) > Θ L 5 & Φ1(n) < Θ U 1 & Φ2(n) < Θ U 2 , (11)<br />
with the threshold values Θ L 5 = 3.10, Θ U 1 = 0.67, and<br />
Θ U 2 = 4.21. We see that only three per-frame features have<br />
significant impact on the frame selection, namely speech<br />
variance Φ5, spectral flatness Φ1, and spectral dynamics Φ2.<br />
The first and second inequalities in (11) accept only frames<br />
with high-energy and a clear formant structure. This suggests<br />
that the LCQA algorithm extracts information about the speech<br />
quality predominately from voiced speech regions. The third<br />
inequality selects only stationary speech regions. Perhaps the<br />
latter result is due to distortion being more easily perceived<br />
in steady-state regions of the speech signal.<br />
The criterion (11) reduces significantly the number of<br />
frames processed by the LCQA algorithm. The number of selected<br />
frames varies with speakers and sentences, and typically<br />
˜Ω contains between 20% and 50% of the total frame set Ω.<br />
Once the optimal subset of frames ˜ Ω is found, we search for<br />
the optimal subset of global features ˜ Ψ. This optimization step<br />
is defined as follows: given the original set of global features<br />
Ψ of cardinality |Ψ|, and the optimal set of frames, ˜ Ω, select<br />
a subset of global features ˜ Ψ ⊂ Ψ of cardinality | ˜ Ψ| < |Ψ|<br />
that is optimized for the performance of the LCQA algorithm:<br />
˜Ψ = arg min<br />
˜Ψ ∗ ε(<br />
⊂Ψ<br />
˜ Ψ ∗ ). (12)<br />
A full search is the only dimensionality reduction procedure<br />
that guaranties that a global optimum is found. It is rarely<br />
applied due to its high computational requirements. The wellknown<br />
Sequential Forward Selection and Sequential Backward<br />
Selection, e.g., [34] are step-optimal only, since the best<br />
(worst) global feature is added (discarded), but the decision<br />
cannot be corrected at a later stage. The more advanced<br />
(L,R) algorithm [35] consists of applying Sequential Forward<br />
Selection L times, followed by R steps of Sequential Backward<br />
Selection. The Floating Search methods [36] are extensions of<br />
the (L,R) search methods, where the number of forward and<br />
backward steps is not pre-defined, but dynamically obtained.<br />
In our experiments we use the Sequential Floating Backward<br />
Selection procedure, which consists of applying after each<br />
backward step a number of forward steps as long as the<br />
resulting subsets are better than the previously evaluated ones,<br />
see Table IV.<br />
After optimization of ε in (12), the dimensionality of the<br />
global feature set is reduced from 44 to 14, i.e., | ˜ Ψ| = 14, and<br />
TABLE IV<br />
THE SEQUENTIAL FLOATING BACKWARD SELECTION PROCEDURE<br />
CONSISTS OF APPLYING AFTER EACH BACKWARD STEP A NUMBER OF<br />
FORWARD STEPS AS LONG AS THE RESULTING SUBSETS ARE BETTER<br />
THAN THE PREVIOUSLY EVALUATED ONES<br />
initialize: ˜ Ψ = Ψ<br />
while error does not increase by more than a threshold<br />
Exclusion Step:<br />
Find the least significant global feature<br />
Ψi− = arg min<br />
Ψi∈ ˜ ε(<br />
Ψ<br />
˜ Ψ − {Ψi})<br />
Exclude the feature<br />
˜Ψ = ˜ Ψ − {Ψ i −}<br />
while error decreases by more than a threshold<br />
Inclusion Steps:<br />
Find the most significant global feature<br />
these elements are:<br />
Ψi + = arg min<br />
Ψi∈ ˜ ε(<br />
Ψ<br />
˜ Ψ + {Ψi})<br />
Include the feature<br />
˜Ψ = ˜ Ψ + {Ψ i +}<br />
˜Ψ = {sΦ1 , σΦ2 , µΦ4 , µΦ5 , σΦ5 , sΦ5 , (13)<br />
= µΦ6 , sΦ7 , µΦ8 , µΦ9 , σΦ9 , sΦ9 , µΦ10 , µΦ11 }.<br />
We observe that all per-frame features are present (through<br />
their global features statistical representation) in the set ˜ Ψ,<br />
but the speech signal variance Φ5, and the derivative of the<br />
variance of the excitation signal Φ9 are most frequent. Another<br />
interesting observation is that global speech features based<br />
only on the first three moments are present, and the global<br />
features based on kurtosis seem to be less important.<br />
The presented two-stage dimensionality reduction procedure<br />
is sub-optimal, i.e., we do not optimize jointly for the optimal<br />
sets of ˜ Ω and ˜ Ψ. At the first stage we optimize the thresholds<br />
Θ for frame selection procedure given the entire set of global<br />
features Ψ. At the second stage we reduce dimensionality<br />
of the global feature set based on the optimal subset of<br />
frames ˜ Ω(Θ). The reason for using this sub-optimal procedure<br />
is the infeasibility of the joint optimization. However, the<br />
experiments presented in section V show that the proposed<br />
training scheme is sufficient to outperform the reference quality<br />
assessment methods.<br />
C. <strong>Quality</strong> Estimation Given the Global Feature Set<br />
Let Q denote the subjective quality of an utterance as<br />
obtained from MOS labeled training databases. We construct<br />
an objective estimator ˆ Q of the subjective quality as a function<br />
of a global feature set, i.e., ˆ Q = ˆ Q( ˜ Ψ), and search for the<br />
function closest to the subjective quality with respect to the<br />
5
6<br />
criterion<br />
ˆQ( ˜ Ψ) = arg min<br />
Q∗ ( ˜ E{(Q − Q<br />
Ψ)<br />
∗ ( ˜ Ψ)) 2 }, (14)<br />
where E{} is the expectation operator. The above defined<br />
criterion is the probabilistic measure corresponding to (12).<br />
It is well known, e.g., [37], that equation (14) is minimized<br />
by the conditional expectation<br />
ˆQ( ˜ Ψ) = E{Q| ˜ Ψ}, (15)<br />
and the problem reduces to the estimation of the conditional<br />
probability. To facilitate this estimation, we model the joint<br />
density of the global feature variables with the subjective MOS<br />
scores as a GMM<br />
M<br />
f(ϕ|λ) = ω (m) N (ϕ|µ (m) , Σ (m) ), (16)<br />
m=1<br />
where ϕ = [Q, ˜ Ψ], m is the mixture component index, ω (m)<br />
are the mixture weights, and N (ϕ|µ (m) , Σ (m) ) are multivariate<br />
Gaussian densities, with µ (m) , Σ (m) being the means and<br />
covariance matrices of the Gaussian densities.<br />
The GMM is completely specified by a set of M mean<br />
vectors, covariance matrices and mixture weights<br />
λ = {ω (m) , µ (m) , Σ (m) } M m=1, (17)<br />
and these coefficients are estimated off-line from a large training<br />
set using the expectation maximization (EM) algorithm<br />
[38]. Details on the data used for training are presented in<br />
section IV. Our experiments showed that it is sufficient to use<br />
12 full-covariance matrices (14 x 14), i.e., for dimensionality<br />
K = 14 and M = 12 Gaussians, this is M ∗ (1 + K + K ∗<br />
(K + 1)/2) = 1440 training parameters.<br />
Using the joint Gaussian mixture model, the conditional expectation<br />
can solved to be a weighted sum of component-wise<br />
conditional expectations, well-known for the Gaussian case<br />
[39]. Hence, the optimal quality estimator (15) is expressed as<br />
where<br />
and<br />
with µ (m)<br />
˜Ψ<br />
E{Q| ˜ Ψ} =<br />
M<br />
m=1<br />
u (m) ( ˜ Ψ)µ (m)<br />
Q| ˜ Ψ<br />
u (m) ( ˜ Ψ) = ω(m) N ( ˜ Ψ|µ (m)<br />
˜Ψ<br />
, Σ(m)<br />
˜Ψ ˜ Ψ )<br />
M k=1 ω(k) N ( ˜ Ψ|µ (k)<br />
˜Ψ<br />
, Σ(k)<br />
˜Ψ ˜ Ψ ),<br />
µ (m)<br />
Q| ˜ = µ(m)<br />
Ψ Q + Σ(m)<br />
˜ΨQ (Σ(m)<br />
˜Ψ ˜ Ψ )−1 ( ˜ Ψ − µ (m)<br />
˜Ψ<br />
(18)<br />
(19)<br />
), (20)<br />
, µ(m)<br />
Q , Σ(m)<br />
˜Ψ ˜ , Σ(m)<br />
Ψ ˜ΨQ<br />
being the means, covariance and<br />
cross-covariance matrices of ˜ Ψ and Q of the m-th mixture<br />
component.<br />
D. Implementation Details<br />
In this section we describe how per-frame features, for the<br />
n-th frame, are calculated, based entirely on {E e n, Tn, fn} and<br />
{E e n−1, Tn−1, fn−1}. Then we show how the global statistical<br />
properties are calculated recursively, without storing the perframe<br />
features in a buffer. We calculate the pitch period Tn<br />
according to [40], and the AR coefficients are extracted from<br />
the speech signal every 20 ms without overlap.<br />
To keep the complexity of the LCQA algorithm low, we<br />
redefine the per-frame features: spectral flatness, spectral dynamics,<br />
and spectral centroid. The new definitions are based<br />
entirely on the speech codec bitstream, and signal reconstruction<br />
is avoided.<br />
We approximate the spectral flatness as the ratio of the<br />
tenth-order prediction error variance and the signal variance<br />
Φ1(n) = Een E s . (21)<br />
n<br />
Given the variance of the excitation of the AR model, its<br />
definition<br />
ek = sk −<br />
10<br />
i=1<br />
aisk−i, (22)<br />
and AR coefficients ai, we calculate the signal variance<br />
without reconstructing the waveform sk using the reverse<br />
Levinson-Durbin recursion (step-down algorithm).<br />
The spectral dynamics are redefined as a weighted Euclidean<br />
distance in the LSF space:<br />
Φ2(n) = (fn − fn−1) T Wn(fn − fn−1), (23)<br />
where the inverse harmonic mean weight [41] is defined by<br />
the components of the LSF vector:<br />
W (ii)<br />
n = (f (i)<br />
n − f (i−1)<br />
n<br />
) −1 + (f (i+1)<br />
n<br />
− f (i)<br />
n ) −1 (24)<br />
W (ij)<br />
n = 0 (25)<br />
These weights are also used to obtain a redefined spectral<br />
centroid:<br />
Φ3(n) =<br />
10 (ii)<br />
i=1 iW n<br />
10 (ii)<br />
i=1 W n<br />
. (26)<br />
The spectral flatness and spectral dynamics are well approximated<br />
by (21) and (23). The correlation of the true with<br />
the approximated per-frame values, over the training set of<br />
TIMIT database [42], are 0.98 and 0.95 respectively. The<br />
approximation of spectral centroid with (26) is less accurate.<br />
The averaged correlation over the TIMIT database is 0.72. The<br />
difference of per-frame values of (4) and (26) are shown in<br />
Fig. 4.<br />
The approximation of (1), (3), and (4) with (21), (23), and<br />
(26) is advantageous in the case of evaluation of CELP coders.<br />
It is possible that in another environment the best option is to<br />
use different approximation of (1), (3), and (4).<br />
We calculate the selected global descriptors recursively, i.e.,<br />
the per-frame features are not stored in a buffer. Until the end<br />
of the utterance the mean is recursively updated<br />
n − 1<br />
µΦ(n) =<br />
n µΦ(n − 1) + 1<br />
Φ(n) (27)<br />
n<br />
to obtain the desired µΦ. Here n is the index over the<br />
accepted frames set ˜ Ω, as discussed earlier in this section. In<br />
a similar fashion, we propagate Φ2 , Φ3 , and Φ4 to obtain the<br />
central moments µ Φ2, µ Φ3, and µ Φ4. These quantities are used<br />
to obtain the remaining global descriptors, namely variance,<br />
skew, and kurtosis:
6.0<br />
5.4<br />
4.8<br />
4.2<br />
spectral centroid (redefined)<br />
spectral centroid<br />
390 400 410<br />
frames<br />
420 430<br />
Fig. 4. Spectral centroid (4) and redefined spectral centroid (26) values over<br />
speech frames.<br />
σΦ = µ Φ 2 − (µΦ) 2<br />
sΦ = µ Φ 3 − 3µΦµ Φ 2 + 2(µΦ) 3<br />
σ 3/2<br />
Φ<br />
(28)<br />
(29)<br />
kΦ = µ Φ4 − 4µΦµ Φ3 + 6(µΦ) 2 µ Φ2 − 3(µΦ) 4<br />
σ2 . (30)<br />
Φ<br />
Table V gives a short overview of the proposed LCQA algorithm.<br />
Note that for the experiments presented in section V, the<br />
required per-frame features are extracted from the waveform<br />
using the single case of 20 ms non-overlapping windows as<br />
described in section III-D. The per-frame features and are not<br />
obtained directly from the network. Thus, we only show that<br />
the chosen per-frame and global features allow the accurate<br />
prediction of speech quality. This provides proof-of-concept,<br />
but if actual CELP coder parameters are to be extracted from<br />
the network, then additional sources of variability may require<br />
further LCQA design and optimization work to attain accurate<br />
speech quality predictions. Some examples of these sources of<br />
additional variability are frame lengths and overlaps, window<br />
shapes, LPC orders and algorithms, pitch algorithms, postfiltering,<br />
and packet loss concealment behavior.<br />
IV. SPEECH DATABASES AND TRAINING<br />
In this section we first discuss speech databases used in<br />
the training and evaluation process of the LCQA algorithm.<br />
Then we reveal the details of the training process, used for<br />
the dimensionality reduction procedure (section III-B), and the<br />
performance evaluation (section V).<br />
A. <strong>Speech</strong> Databases<br />
For the training and evaluation procedure we used 11<br />
MOS labeled databases provided by Ericsson AB and 7<br />
similarly labeled databases from the ITU-T P.Supp 23 [43].<br />
Data with DMOS scores were excluded from our experiments,<br />
e.g., from ITU-T P.Supp 23 we excluded Experiment 2. The<br />
TABLE V<br />
OVERVIEW OF THE GENERIC LCQA ALGORITHM<br />
1) For the n-th speech frame calculate {E e n, Tn, fn}<br />
from the waveform or extract from the bitstream.<br />
2) Calculate per-frame feature vector Φ(n),<br />
based on {E e n, Tn, fn} and stored in a buffer<br />
{E e n−1, Tn−1, fn−1}.<br />
3) From a selected subset of frames ˜ Ω recursively<br />
calculate the central moments {µΦ, µ Φ2, µ Φ3, µ Φ4}. Frames selection is controlled by the threshold Θ.<br />
4) At the end of the utterance calculate global feature<br />
set ˜ Ψ = {µΦi , σΦi , sΦi , kΦi } as mean, variance,<br />
skew, and kurtosis of per-frame features.<br />
5) Predict the speech quality as a function of the<br />
global feature set ˆ Q = ˆ Q( ˜ Ψ), through GMM<br />
mapping.<br />
speech material in these databases contains utterances in the<br />
following languages: English, French, Japanese, Italian and<br />
Swedish. The databases contain a large variety of distortions,<br />
such as: different coding, tandeming, and modulated noise<br />
reference unit (MNRU) [44] conditions, as well as packet<br />
loss, background noise, effects of noise suppression, switching<br />
effects, different input levels, etc. The total size of the union<br />
of databases is 7646 utterances with averaged length 8s.<br />
B. Training<br />
We split the available databases into two parts, test set and<br />
training set. The test set is based on 7 databases from ITU-<br />
T P.Supp 23 (1328 utterances) and the training set is based<br />
on 11 Ericsson’s databases (6318 utterances). The test set is<br />
not available during the training, but used only for evaluation.<br />
The training, used for the dimensionality reduction scheme and<br />
performance evaluation experiments is based entirely on the<br />
training set. To improve generalization performance we use a<br />
training with noise procedure [45]. We create virtual (”noisy”)<br />
training patterns, by adding zero mean white Gaussian noise,<br />
at 20 dB SNR to the global feature set Ψ. In this manner for<br />
each global feature set we create four virtual sets, and the<br />
training is based on the union of the ”original” and ”noisy”<br />
features.<br />
V. PERFORMANCE EVALUATION<br />
In this section we present results from experiments, with<br />
respect to both prediction accuracy and computational complexity<br />
of the proposed algorithm. We compare the performance<br />
of the proposed LCQA algorithm with the standardized<br />
ITU-T P.563. The estimation performance is assessed using<br />
per-condition correlation coefficient R between the predicted<br />
quality ˆ Q and the subjective quality Q:<br />
R =<br />
<br />
i ( ˆ Qi − µ Q ˆ)(Qi − µQ)<br />
<br />
<br />
i ( ˆ <br />
Qi − µ Q ˆ) 2<br />
i (Qi − µQ) 2<br />
, (31)<br />
where µQ and µ ˆ Q are the mean values of the introduced<br />
variables, and summation is over conditions. Table VI contains<br />
7
8<br />
the performance results in terms of the selected performance<br />
metric over a test set of 7 databases from ITU-T P.Supp 23.<br />
The ITU-T P.Supp 23 Exp 1 contains speech coding distortions,<br />
produced by seven standard speech codecs (predominantly<br />
using G.729 speech codec [46]) alone, or in tandem<br />
configuration. In the ITU-T P.Supp 23 Exp 3 G.729 speech<br />
codec is evaluated under various channel error conditions like<br />
frame erasure, random bit error, and background noise. The<br />
test results, presented in Table VI clearly indicate that the<br />
proposed LCQA algorithm outperforms the standardized ITU-<br />
T P.563.<br />
TABLE VI<br />
PERFORMANCE OF THE LCQA ALGORITHM IN TERMS OF PER-CONDITION<br />
CORRELATION COEFFICIENT OVER ITU-T P.SUPP 23 DATABASES<br />
Database Language LCQA ITU-T P.563<br />
Exp 1 A French 0.94 0.88<br />
Exp 1 D Japanese 0.94 0.81<br />
Exp 1 O English 0.95 0.90<br />
Exp 3 A French 0.93 0.87<br />
Exp 3 C Italian 0.95 0.83<br />
Exp 3 D Japanese 0.94 0.92<br />
Exp 3 O English 0.93 0.91<br />
Processing time and memory requirements are important<br />
figures of merit for the quality estimation algorithms. The<br />
LCQA algorithm has insignificant memory requirements: a<br />
buffer of 12+12 scalar values, calculated from the previous<br />
and current frame is needed (future frames are not required),<br />
as well as memory for the mixture of 12 Gaussians.<br />
In Table VII we demonstrate the difference in computational<br />
complexity between the proposed LCQA and the ITU-T P.563.<br />
The comparison is between the optimized ANSI-C implementation<br />
of ITU-T P.563 and the MATLAB 7 implementation of<br />
LCQA, both executed on a Pentium 4 machine at 2.8 GHz<br />
with 1 GB RAM. With LCQA-P we denote the case where<br />
input features {E e n, Tn, fn} are readily available from codecs<br />
used in the network.<br />
TABLE VII<br />
EXECUTION TIME (IN S) FOR UTTERANCES OF AVERAGED LENGTH 8 S<br />
Execution time (in s)<br />
ITU-T P.563 LCQA LCQA-P<br />
Time 4.63 1.24 0.01<br />
VI. CONCLUSIONS<br />
We demonstrated that a low-complexity non-intrusive<br />
speech quality assessment algorithm can be a valuable tool<br />
for monitoring the performance of a speech communication<br />
system. The proposed quality assessment algorithm operates<br />
on a heavily restricted parametric representation of speech,<br />
without the need for a perceptual transform of the input<br />
signal. By means of experiments over MOS labeled databases<br />
we demonstrated that the presented algorithm predicts speech<br />
quality more accurately than the standardized ITU-T P.563, at<br />
much lower complexity.<br />
In the proposed algorithm, the distortion is modeled only<br />
implicitly by its effect on the distribution of the selected perframe<br />
speech features. Since there is no explicit distortion<br />
model, the algorithm is easily extendable towards quality<br />
assessment of future communication systems.<br />
ACKNOWLEDGMENT<br />
The authors would like to thank Stefan Bruhn of Ericsson<br />
AB for providing MOS databases and also thank the anonymous<br />
reviewers whose valuable comments led to improvement<br />
of the paper.<br />
REFERENCES<br />
[1] ITU-T Rec. P.830, “Subjective performance assessment of telephoneband<br />
and wideband digital codecs,” 1996.<br />
[2] ITU-T Rec. P.800, “Methods for Subjective Determination of Transmission<br />
<strong>Quality</strong>,” 1996.<br />
[3] ITU-R Rec. BS.1534-1, “Method for the subjective assessment of<br />
intermediate quality level of coding systems,” 2005.<br />
[4] ITU-R Rec. BS.1284-1, “General methods for the subjective assessment<br />
of sound quality,” 2003.<br />
[5] ITU-T Rec. G.107, “The e-model, a computational model for use in<br />
transmission planning,” 2005.<br />
[6] M. Goldstein, “Classification of methods used for assessment of text-tospeech<br />
systems according to the demands placed on the listener,” <strong>Speech</strong><br />
Communication, vol. 16, pp. 225–244, 1995.<br />
[7] S. Quackenbush, T. Barnwell, and M. Clements, Objective Measures of<br />
<strong>Speech</strong> <strong>Quality</strong>. Prentice Hall, 1988.<br />
[8] S. Wang, A. Sekey, and A. Gersho, “An objective measure for predicting<br />
subjective quality of speech coders,” IEEE J. Selected Areas in Commun.,<br />
vol. 10, no. 5, pp. 819–829, 1992.<br />
[9] J. Beerends and J. Stemerdink, “A perceptual speech-quality measure<br />
based on a psychoacoustic sound representation,” J. Audio Eng. Soc,<br />
vol. 42, no. 3, pp. 115–123, 1994.<br />
[10] S. Voran, “Objective estimation of perceived speech quality - Part I:<br />
Development of the measuring normalizing block technique,” IEEE<br />
Trans. <strong>Speech</strong>, Audio Processing, vol. 7, no. 4, pp. 371–382, 1999.<br />
[11] S. Voran, “Objective estimation of perceived speech quality - Part II:<br />
Evaluation of the measuring normalizing block technique,” IEEE Trans.<br />
<strong>Speech</strong>, Audio Processing, vol. 7, no. 4, pp. 383–390, 1999.<br />
[12] ITU-T Rec. P. 862, “Perceptual evaluation of speech quality (PESQ),”<br />
2001.<br />
[13] ITU-R. BS.1387-1, “Method for Objective Measurements of Perceived<br />
Audio <strong>Quality</strong> (PEAQ),” 2001.<br />
[14] O. Au and K. Lam, “A novel output-based objective speech quality<br />
measure for wireless communication,” Signal Processing Proceedings,<br />
4th Int. Conf., vol. 1, pp. 666–669, 1998.<br />
[15] P. Gray, M. Hollier, and R. Massara, “<strong>Non</strong>-intrusive speech-quality<br />
assessment using vocal-tract models,” in Proc. IEE Vision, Image and<br />
Signal Processing, vol. 147, pp. 493–501, 2000.<br />
[16] J. Liang and R. Kubichek, “Output-based objective speech quality,” IEEE<br />
44th Vehicular Technology Conf., vol. 3, no. 8-10, pp. 1719–1723, 1994.<br />
[17] H. Hermansky, “Perceptual linear prediction (PLP) analysis of speech,”<br />
J. Acous. Soc. Amer., vol. 87, pp. 1738–1752, 1990.<br />
[18] T. Falk, Q. Xu, and W.-Y. Chan, “<strong>Non</strong>-intrusive GMM-based speech<br />
quality measurement,” in Proc. IEEE Int. Conf. Acous., <strong>Speech</strong>, Signal<br />
Processing, vol. 1, pp. 125–128, 2005.<br />
[19] G. Chen and V. Parsa, “Bayesian model based non-intrusive speech<br />
quality evaluation,” in Proc. IEEE Int. Conf. Acous., <strong>Speech</strong>, Signal<br />
Processing, vol. 1, pp. 385–388, 2005.<br />
[20] D. Kim, “ANIQUE: An auditory model for single-ended speech quality<br />
estimation,” IEEE Trans. <strong>Speech</strong>, Audio Processing, vol. 13, pp. 821–<br />
831, 2005.<br />
[21] D. Kim and A. Tarraf, “Enhanced perceptual model for non-intrusive<br />
speech quality assessment,” in Proc. IEEE Int. Conf. Acous., <strong>Speech</strong>,<br />
Signal Processing, vol. 1, pp. 829–832, 2006.<br />
[22] ITU-T P. 563, “Single ended method for objective speech quality<br />
assessment in narrow-band telephony applications,” 2004.<br />
[23] M. Werner, T. Junge, and P. Vary, “<strong>Quality</strong> control for AMR speech<br />
channels in GSM networks,” in Proc. IEEE Int. Conf. Acous., <strong>Speech</strong>,<br />
Signal Processing, vol. 3, pp. 1076–1079, 2004.
[24] B. C. J. Moore, An Introduction to the Psychology of Hearing. London:<br />
Academic Press, 1989.<br />
[25] Z. Wang, A. Bovik, H. Sheikh, and E. Simoncelli, “Image quality<br />
assessment: From error visibility to structural similarity,” IEEE Trans.<br />
Image Process, vol. 13, pp. 600–612, 2004.<br />
[26] R. Reynolds and A. Rix, “<strong>Quality</strong> VoIP - an engineering challenge,” BT<br />
Technology Journal, vol. 19, pp. 23–32, 2001.<br />
[27] M. Schroeder and B. Atal, “Code-excited linear prediction (CELP): highquality<br />
speech at very low bit rates,” in Proc. IEEE Int. Conf. Acous.,<br />
<strong>Speech</strong>, Signal Processing, vol. 10, pp. 937–940, 1985.<br />
[28] S. Jayant and P. Noll, Digital Coding of Waveforms. Englewood Cliffs<br />
NJ: Prentice-Hall, 1984.<br />
[29] H. Knagenhjelm and W. B. Kleijn, “Spectral dynamics is more important<br />
than spectral distortion,” in Proc. IEEE Int. Conf. Acous., <strong>Speech</strong>, Signal<br />
Processing, vol. 1, pp. 732–735, 1995.<br />
[30] F. Norden and T. Eriksson, “Time evolution in LPC spectrum coding,”<br />
IEEE Trans. <strong>Speech</strong>, Audio Processing, vol. 12, pp. 290–301, 2004.<br />
[31] T. Quatieri and R. Dunn, “<strong>Speech</strong> enhancement based on auditory<br />
spectral change,” in Proc. IEEE Int. Conf. Acous., <strong>Speech</strong>, Signal<br />
Processing, vol. 1, pp. 257–260, 2002.<br />
[32] J. Beauchamp, “Synthesis by spectral amplitude and brightness matching<br />
of analized musical instrument tones,” J. Audio Eng. Soc, vol. 30,<br />
pp. 396–406, 1982.<br />
[33] S. Voran, “A simplified version of the ITU algorithm for objective<br />
measurement of speech codec quality,” in Proc. IEEE Int. Conf. Acous.,<br />
<strong>Speech</strong>, Signal Processing, vol. 1, pp. 537–540, 1998.<br />
[34] P. Devijver and J. Kittler, Pattern Recognition: A Statistical Approach.<br />
London, UK: Prentice Hall, 1982.<br />
[35] S. Stearns, “On selecting features for pattern classifiers,” in Proc. 3th<br />
Int. Conf. on Pattern Recognition, pp. 71–75, 1976.<br />
[36] P. Pudil, F. Ferri, J. Novovicova, and J. Kittler, “Floating search methods<br />
for feature selection with nonmonotonic criterion functions,” in Proc.<br />
IEEE Intl. Conf. Pattern Recognition, pp. 279–283, 1994.<br />
[37] T. Soderstrom, Discrete-time Stochastic Systems. London: Springer-<br />
Verlag, second ed., 2002.<br />
[38] A. Dempster, N. Lair, and D. Rubin, “Maximum likelihood from incomplete<br />
data via the EM algorithm,” Journal Royal Statistical Society.,<br />
vol. 39, pp. 1–38, 1977.<br />
[39] S. M. Kay, Fundamentals of Statistical Signal Processing, Estimation<br />
Theory. Prentice Hall, 1993.<br />
[40] W. B. Kleijn, P. Kroon, L. Cellario, and D. Sereno, “A 5.85 kbps CELP<br />
algorithm for cellular applications,” in Proc. IEEE Int. Conf. Acous.,<br />
<strong>Speech</strong>, Signal Processing, vol. 2, pp. 596–599, 1993.<br />
[41] R. Laroia, N. Phamdo, and N. Farvardin, “Robust and efficient quantization<br />
of speech LSP parameters using structured vector quantizers,” in<br />
Proc. IEEE Int. Conf. Acous., <strong>Speech</strong>, Signal Processing, vol. 1, pp. 641–<br />
644, 1991.<br />
[42] DARPA-TIMIT, “Acoustic-phonetic continuous speech corpus, NIST<br />
<strong>Speech</strong> Disc 1-1.1,” 1990.<br />
[43] ITU-T Rec. P. Supplement 23, “ITU-T coded-speech database,” 1998.<br />
[44] ITU-T. Rec. P.810, “Modulated Noise Reference Unit,” 1996.<br />
[45] R. Duda, P. Hart, and D. Stork, Pattern Classification. Wiley-<br />
Interscience, second ed., 2001.<br />
[46] ITU-T. Rec. G.729, “Coding of speech at 8 kbit/s using conjugatestructure<br />
algebraic-code-excited linear prediction (CS-ACELP),” 1996.<br />
9