Introduction to Cladistic Analysis - Integrative Biology - University of ...
Introduction to Cladistic Analysis - Integrative Biology - University of ...
Introduction to Cladistic Analysis - Integrative Biology - University of ...
You also want an ePaper? Increase the reach of your titles
YUMPU automatically turns print PDFs into web optimized ePapers that Google loves.
Copyright © 2009 by Department <strong>of</strong> <strong>Integrative</strong> <strong>Biology</strong>, <strong>University</strong> <strong>of</strong> California-Berkeley<br />
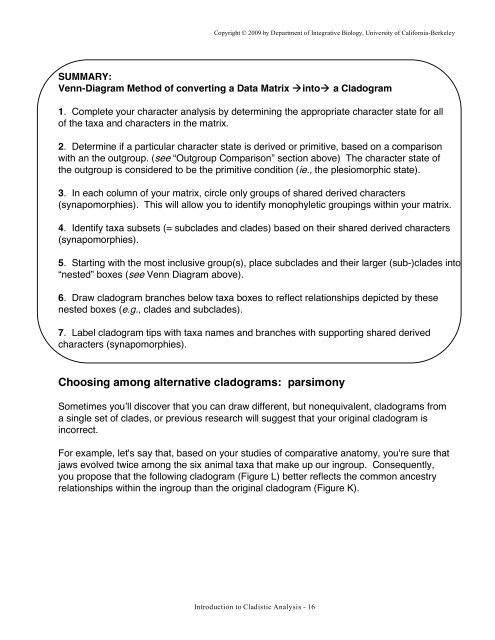
SUMMARY:<br />
Venn-Diagram Method <strong>of</strong> converting a Data Matrix in<strong>to</strong> a Cladogram<br />
1. Complete your character analysis by determining the appropriate character state for all<br />
<strong>of</strong> the taxa and characters in the matrix.<br />
2. Determine if a particular character state is derived or primitive, based on a comparison<br />
with an the outgroup. (see “Outgroup Comparison” section above) The character state <strong>of</strong><br />
the outgroup is considered <strong>to</strong> be the primitive condition (ie., the plesiomorphic state).<br />
3. In each column <strong>of</strong> your matrix, circle only groups <strong>of</strong> shared derived characters<br />
(synapomorphies). This will allow you <strong>to</strong> identify monophyletic groupings within your matrix.<br />
4. Identify taxa subsets (= subclades and clades) based on their shared derived characters<br />
(synapomorphies).<br />
5. Starting with the most inclusive group(s), place subclades and their larger (sub-)clades in<strong>to</strong><br />
“nested” boxes (see Venn Diagram above).<br />
6. Draw cladogram branches below taxa boxes <strong>to</strong> reflect relationships depicted by these<br />
nested boxes (e.g., clades and subclades).<br />
7. Label cladogram tips with taxa names and branches with supporting shared derived<br />
characters (synapomorphies).<br />
Choosing among alternative cladograms: parsimony<br />
Sometimes you’ll discover that you can draw different, but nonequivalent, cladograms from<br />
a single set <strong>of</strong> clades, or previous research will suggest that your original cladogram is<br />
incorrect.<br />
For example, let's say that, based on your studies <strong>of</strong> comparative ana<strong>to</strong>my, you're sure that<br />
jaws evolved twice among the six animal taxa that make up our ingroup. Consequently,<br />
you propose that the following cladogram (Figure L) better reflects the common ancestry<br />
relationships within the ingroup than the original cladogram (Figure K).<br />
<strong>Introduction</strong> <strong>to</strong> <strong>Cladistic</strong> <strong>Analysis</strong> - 16


