Introduction to Cladistic Analysis - Integrative Biology - University of ...
Introduction to Cladistic Analysis - Integrative Biology - University of ...
Introduction to Cladistic Analysis - Integrative Biology - University of ...

Create successful ePaper yourself
Turn your PDF publications into a flip-book with our unique Google optimized e-Paper software.
3.1 Copyright © 2009 by Department <strong>of</strong> <strong>Integrative</strong> <strong>Biology</strong>, <strong>University</strong> <strong>of</strong> California-Berkeley<br />
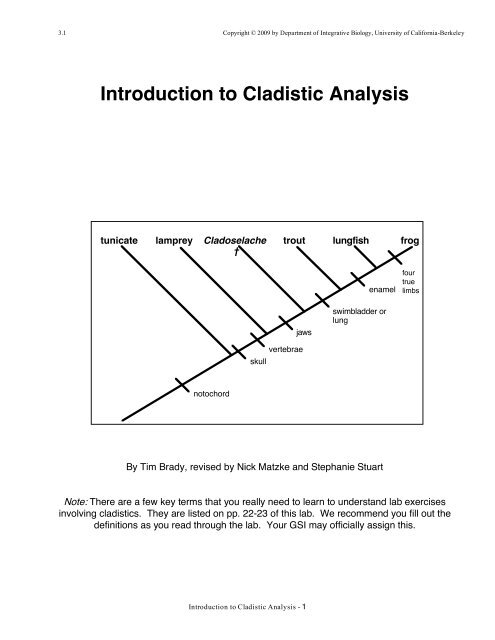
<strong>Introduction</strong> <strong>to</strong> <strong>Cladistic</strong> <strong>Analysis</strong><br />
tunicate lamprey Cladoselache<br />
†<br />
no<strong>to</strong>chord<br />
skull<br />
<strong>Introduction</strong> <strong>to</strong> <strong>Cladistic</strong> <strong>Analysis</strong> - 1<br />
trout lungfish frog<br />
vertebrae<br />
jaws<br />
enamel<br />
swimbladder or<br />
lung<br />
By Tim Brady, revised by Nick Matzke and Stephanie Stuart<br />
four<br />
true<br />
limbs<br />
Note: There are a few key terms that you really need <strong>to</strong> learn <strong>to</strong> understand lab exercises<br />
involving cladistics. They are listed on pp. 22-23 <strong>of</strong> this lab. We recommend you fill out the<br />
definitions as you read through the lab. Your GSI may <strong>of</strong>ficially assign this.<br />
1
Copyright © 2009 by Department <strong>of</strong> <strong>Integrative</strong> <strong>Biology</strong>, <strong>University</strong> <strong>of</strong> California-Berkeley<br />
CLADISTICS FOR BEGINNERS<br />
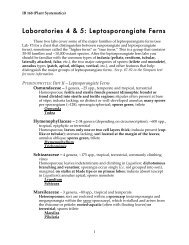
Systematics is the branch <strong>of</strong> biology concerned with the study <strong>of</strong> organic diversity. One <strong>of</strong><br />
the primary tasks <strong>of</strong> the systematist is phylogenetic reconstruction, i.e., piecing <strong>to</strong>gether the<br />
evolutionary his<strong>to</strong>ry <strong>of</strong> life on earth. If you were an animal systematist, you might look at<br />
the six taxa (singular, taxon), or named groups <strong>of</strong> organisms, pictured below (Figure A) and<br />
ask the following question:<br />
"How are these taxa related <strong>to</strong> each other?"<br />
Since you can't travel backwards in time, answering this question isn't as simple as you<br />
may think. In fact, since the appearance <strong>of</strong> Darwin's On the Origin <strong>of</strong> Species a century<br />
and a half ago, systematists have struggled <strong>to</strong> find the best way <strong>to</strong> determine the<br />
evolutionary relationships among taxa. Through the publication <strong>of</strong> his book in 1950<br />
(Grundzüge einerTheorie der phylogenetischen Systematik), a German en<strong>to</strong>mologist by the<br />
name <strong>of</strong> Willi Hennig introduced a revolutionary method for ascertaining geneologies.<br />
Nowadays, biologists refer <strong>to</strong> Hennig's unique approach as "cladistic analysis", "cladistics",<br />
or "phylogenetic systematics". Practitioners <strong>of</strong> Hennig's method are called "cladists" or<br />
"phylogenetic systematists".<br />
<strong>Introduction</strong> <strong>to</strong> <strong>Cladistic</strong> <strong>Analysis</strong> - 2
<strong>Cladistic</strong> view <strong>of</strong> evolution<br />
Copyright © 2009 by Department <strong>of</strong> <strong>Integrative</strong> <strong>Biology</strong>, <strong>University</strong> <strong>of</strong> California-Berkeley<br />
According <strong>to</strong> Hennig, evolutionary his<strong>to</strong>ry (i.e., phylogeny) consists <strong>of</strong> a series <strong>of</strong><br />
dicho<strong>to</strong>mies. Each dicho<strong>to</strong>my marks the splitting and disappearance <strong>of</strong> an ancestral<br />
species and the formation <strong>of</strong> two daughter species. This process <strong>of</strong> species creation is<br />
known as cladogenesis, or branching evolution. The fundamental product <strong>of</strong> evolution is<br />
the clade, or monophyletic group, which is made up <strong>of</strong> an ancestral species and all <strong>of</strong> its<br />
descendants.<br />
In the branching diagram below (Figure B), a single hypothetical and unnamed ancestral<br />
species participated in a speciation event at the branch point, or node, <strong>to</strong> give rise <strong>to</strong> a pair<br />
<strong>of</strong> daughter species: rainbow trout (Oncorhynchus mykiss) and cutthroat trout (O. clarki).<br />
Rainbow trout, cutthroat trout, and the ancestral species <strong>to</strong>gether compose a clade<br />
(monophyletic group).<br />
Figure B. Evolution.<br />
rainbow trout<br />
(Oncorhynchus mykiss)<br />
daughter<br />
species<br />
ancestral<br />
species<br />
<strong>Introduction</strong> <strong>to</strong> <strong>Cladistic</strong> <strong>Analysis</strong> - 3<br />
cutthroat trout<br />
(Oncorhynchus clarki)<br />
daughter<br />
species<br />
speciation<br />
event<br />
Even if the taxa at the tips <strong>of</strong> the branches are higher taxa (e.g., genera, families, orders,<br />
classes, phyla, kingdoms), instead <strong>of</strong> species, a node still represents a speciation event,<br />
because higher taxa originated as species.<br />
Depicting phylogenetic his<strong>to</strong>ry: cladograms<br />
A cladist presents her results in the form <strong>of</strong> a branching diagram called a "cladogram". All<br />
<strong>of</strong> the taxa under study are listed at the <strong>to</strong>p <strong>of</strong> a cladogram. These taxa may be living or<br />
extinct * . The cladist draws intersecting lines, or branches, beneath them <strong>to</strong> illustrate their<br />
common ancestry relationships. The ances<strong>to</strong>rs <strong>of</strong> these taxa are hypothetical and<br />
* The special symbol † signifies an extinct taxon. For example, Cladoselache † from Figure A is an extinct<br />
taxon <strong>of</strong> sharks.
Copyright © 2009 by Department <strong>of</strong> <strong>Integrative</strong> <strong>Biology</strong>, <strong>University</strong> <strong>of</strong> California-Berkeley<br />
unnamed, but any branch that connects two nodes (remember, a node represents a<br />
speciation event) corresponds <strong>to</strong> an ances<strong>to</strong>r (technically, an internodal branch may<br />
correspond <strong>to</strong> a series <strong>of</strong> ances<strong>to</strong>rs).<br />
Figure B is a very small cladogram. The following cladogram (Figure C) was constructed<br />
for the six taxa from Figure A:<br />
Figure C. A cladogram.<br />
tunicate lamprey Cladoselache † trout lungfish frog<br />
1<br />
i<br />
2<br />
Besides the six taxa <strong>of</strong> interest, this cladogram displays five speciation events (labeled i-v)<br />
and five hypothetical ances<strong>to</strong>rs (labeled 1-5).<br />
Ances<strong>to</strong>r 5 is the most recent common ances<strong>to</strong>r <strong>of</strong> lungfish and frog.<br />
Lungfish and frog are more closely related <strong>to</strong> each other than either is <strong>to</strong> any<br />
<strong>of</strong> the other four taxa under study. Ances<strong>to</strong>r 5, lungfish, and frog <strong>to</strong>gether<br />
compose a clade (monophyletic group).<br />
Similarly, Ances<strong>to</strong>r 4 is the most recent common ances<strong>to</strong>r <strong>of</strong> trout, lungfish,<br />
and frog. Trout, lungfish, and frog are more closely related <strong>to</strong> each other than<br />
either is <strong>to</strong> any <strong>of</strong> the other three taxa included in the analysis. Ances<strong>to</strong>r 4,<br />
trout, lungfish, and frog <strong>to</strong>gether compose a second clade.<br />
This cladogram contains three more clades (monophyletic groups). Can you identify them?<br />
<strong>Introduction</strong> <strong>to</strong> <strong>Cladistic</strong> <strong>Analysis</strong> - 4<br />
ii<br />
3<br />
iii<br />
Cladograms and time<br />
A cladogram provides information about the relative timing <strong>of</strong> speciation events (and, thus,<br />
the relative antiquity <strong>of</strong> ances<strong>to</strong>rs). Look again at the cladogram shown in Figure C.<br />
4<br />
iv<br />
5<br />
v
Copyright © 2009 by Department <strong>of</strong> <strong>Integrative</strong> <strong>Biology</strong>, <strong>University</strong> <strong>of</strong> California-Berkeley<br />
Speciation event i is the oldest (ances<strong>to</strong>r 1 evolved first); speciation event v is the youngest<br />
(ances<strong>to</strong>r 5 evolved last). However, because a cladogram lacks an absolute time axis, you<br />
can't tell in what year a speciation event occurred (or an ances<strong>to</strong>r evolved). Since branch<br />
length isn't equivalent <strong>to</strong> time, you can't tell speciation events.<br />
A cladogram is an hypothesis<br />
You must be cautious about interpreting a cladogram: As any cladist will tell you, a<br />
cladogram is an hypothesis, not a fact. Ideas about evolutionary his<strong>to</strong>ry change (hopefully,<br />
they get more refined) as new information becomes available.<br />
Phylogenies versus cladograms<br />
A phylogeny is a diagram that superficially resembles a cladogram. A phylogeny provides<br />
information about the evolutionary relationships among taxa. It <strong>of</strong>ten expresses the<br />
geographical distributions or morphological similarities <strong>of</strong> taxa as well. Most importantly, a<br />
phylogeny, unlike a cladogram, has an absolute time axis. In a phylogeny, the taxa under<br />
study are not necessarily listed across the <strong>to</strong>p <strong>of</strong> the diagram, as is manda<strong>to</strong>ry in a<br />
cladogram. Instead, the taxa are ordered vertically <strong>to</strong> indicate when they lived. The<br />
phylogeny on the next page. (Figure D) includes the same taxa used <strong>to</strong> build the cladogram<br />
displayed in Figure C.<br />
<strong>Introduction</strong> <strong>to</strong> <strong>Cladistic</strong> <strong>Analysis</strong> - 5
Figure D. A phylogeny.<br />
0 mya<br />
CENOZOIC<br />
65 mya<br />
MESOZOIC<br />
248 mya<br />
PALEOZOIC<br />
590 mya<br />
?<br />
?<br />
tunicate<br />
?<br />
Copyright © 2009 by Department <strong>of</strong> <strong>Integrative</strong> <strong>Biology</strong>, <strong>University</strong> <strong>of</strong> California-Berkeley<br />
lam prey<br />
Cladoselache †<br />
trout<br />
<strong>Introduction</strong> <strong>to</strong> <strong>Cladistic</strong> <strong>Analysis</strong> - 6<br />
lung fish<br />
frog<br />
The solid rectangles indicate the<br />
range <strong>of</strong> each taxon in the fossil<br />
record (s<strong>of</strong>t-bodied tunicates are<br />
rarely preserved as fossils, so the<br />
fossil range indicated for tunicate<br />
is pure conjecture). The narrow<br />
curves represent the ances<strong>to</strong>rs <strong>of</strong><br />
the labelled taxa.
Copyright © 2009 by Department <strong>of</strong> <strong>Integrative</strong> <strong>Biology</strong>, <strong>University</strong> <strong>of</strong> California-Berkeley<br />
Evidence for common ancestry: a taxon's characters<br />
Where in the world do you look for the information necessary <strong>to</strong> construct a cladogram?<br />
Well, Hennig argued that the geneological relationships within a suite <strong>of</strong> taxa can be<br />
discovered indirectly by examining their characters.<br />
Characters<br />
To begin, what is a character? A character is a feature that is an observable part or<br />
attribute <strong>of</strong> an organism. An example <strong>of</strong> a character is feet in tetrapods. Characters have<br />
different forms or appearances called character states. If the character is feet in tetrapods,<br />
then the character states can be the number <strong>of</strong> <strong>to</strong>es on the feet (1,2,3, etc.) or even the<br />
presence or absence <strong>of</strong> feet (feet are lost in snakes and other reptiles and amphibians).<br />
These character states are coded in<strong>to</strong> a matrix by assigning a number <strong>to</strong> each character<br />
state. The presence <strong>of</strong> feet can be called the 0 state. The absence <strong>of</strong> feet can be called the<br />
1 state. By looking at several organisms you will begin <strong>to</strong> see the different distributions <strong>of</strong><br />
the character states. Look at the example below.<br />
Character 1 is the presence or absence <strong>of</strong> limbs. State 1 <strong>of</strong> character 1 is the presence <strong>of</strong><br />
limbs. State 0 is the absence <strong>of</strong> limbs. Character 2 is the number <strong>of</strong> digits on each limb.<br />
State 0 is 5 digits, state 1 is 3 digits, and state 2 is 4 digits. The question mark for fish is<br />
because fish don’t have limbs with digits. Therefore you can’t know how many digits they<br />
have.<br />
The characters used <strong>to</strong> construct the cladogram must be carefully chosen. the character<br />
has <strong>to</strong> be consistent in all the members <strong>of</strong> that type <strong>of</strong> organism. In selecting the suite <strong>of</strong><br />
characters <strong>to</strong> be compared, each organism must have at least one character different from<br />
the other organisms. Table A contains a partial list <strong>of</strong> the morphological characters <strong>of</strong> the<br />
six animal taxa from Figure A ** .<br />
** Cladists routinely use morphological, molecular, and even behavioral characters in their analyses.<br />
<strong>Introduction</strong> <strong>to</strong> <strong>Cladistic</strong> <strong>Analysis</strong> - 7
Copyright © 2009 by Department <strong>of</strong> <strong>Integrative</strong> <strong>Biology</strong>, <strong>University</strong> <strong>of</strong> California-Berkeley<br />
Table A. Morphological characters <strong>of</strong> six taxa. An “x” indicates that the character is present while a “y”<br />
indicates the character is absent.<br />
deuteros<strong>to</strong>me no<strong>to</strong>chord vertebrae jaws skull swimbladder enamel four<br />
development<br />
or lung<br />
true<br />
limbs<br />
tunicate x x y y y y y y<br />
lamprey x x x y x y y y<br />
Cladoselache † x x x x x y y y<br />
trout x x x x x x y y<br />
lungfish x x x x x x x y<br />
frog x x x x x x x x<br />
Plesiomorphies and apomorphies<br />
A plesiomorphy is an "ancestral", "less specialized", or "primitive" character. An<br />
apomorphy is a "derived", "specialized", or "advanced" character. Every taxon possesses a<br />
mixture <strong>of</strong> plesiomorphies and apomorphies.<br />
At some point in time during the evolution <strong>of</strong> the taxa pictured in Figure A, vertebrae<br />
(serially arranged skeletal units that enclose the nerve cord) came in<strong>to</strong> existence.<br />
"Absence <strong>of</strong> vertebrae" is one character state. "Presence <strong>of</strong> vertebrae" is another character<br />
state. These two character states are parts <strong>of</strong> a "transformation series" (the former was<br />
transformed, or evolved, in<strong>to</strong> the latter). With reference <strong>to</strong> the six taxa shown in Figure A,<br />
the absence <strong>of</strong> vertebrae is a plesiomorphic character, and the presence <strong>of</strong> vertebrae is an<br />
apomorphic character. For these six taxa, having vertebrae represents an evolutionary<br />
advancement.<br />
Distinguishing plesiomorphies from apomorphies is tricky business. Luckily, Hennig<br />
developed a method called outgroup comparison for partitioning characters in<strong>to</strong> these two<br />
basic types.<br />
Outgroup comparison<br />
Outgroup comparison is a means <strong>of</strong> determining which character in a transformation series<br />
is a plesiomorphy and which is an apomorphy. IT IS IMPORTANT TO REMEMBER THAT<br />
THE OUTGROUP DEFINES THE CHARACTER STATE. FOR OUR PURPOSES, WE<br />
DEFINE THE OUTGROUP AS PLESIOMORPHIC. But please appreciate the selection <strong>of</strong><br />
the proper outgroup usually requires a good deal <strong>of</strong> effort.<br />
<strong>Introduction</strong> <strong>to</strong> <strong>Cladistic</strong> <strong>Analysis</strong> - 8
Copyright © 2009 by Department <strong>of</strong> <strong>Integrative</strong> <strong>Biology</strong>, <strong>University</strong> <strong>of</strong> California-Berkeley<br />
An outgroup is the most closely related taxon <strong>to</strong>, but not the ances<strong>to</strong>r <strong>of</strong>, the set <strong>of</strong> taxa<br />
under study. The latter constitutes the "ingroup". To conduct a cladistic analysis <strong>of</strong> the<br />
animals shown in Figure A, the following six taxa make up the ingroup:<br />
tunicate<br />
lamprey<br />
Cladoselache †<br />
trout<br />
lungfish<br />
frog<br />
Previous research has revealed that the closest relative <strong>of</strong> the ingroup is the sea urchin<br />
(see Figure E).<br />
Thus, the sea urchin will function as the outgroup in this cladistic analysis.<br />
The cladist assumes that the common ances<strong>to</strong>r <strong>of</strong> the ingroup and outgroup possessed<br />
only ancestral characters, and that they still are prevalent in the outgroup. Thus, any<br />
character that the outgroup displays must be a plesiomorphy, and any character that the<br />
outgroup lacks must be an apomorphy.<br />
Table B gives a list <strong>of</strong> some morphological characters possessed by the sea urchin.<br />
Table B. Morphological characters <strong>of</strong> the outgroup. An “x” indicates that the character is present while a “y”<br />
indicates the character is absent.<br />
deuteros<strong>to</strong>me<br />
development<br />
no<strong>to</strong>chord vertebrae jaws skull swimbladder<br />
or lung<br />
<strong>Introduction</strong> <strong>to</strong> <strong>Cladistic</strong> <strong>Analysis</strong> - 9<br />
enamel four<br />
true<br />
limbs<br />
sea urchin x y y y y y y y
Copyright © 2009 by Department <strong>of</strong> <strong>Integrative</strong> <strong>Biology</strong>, <strong>University</strong> <strong>of</strong> California-Berkeley<br />
By comparing the sea urchin's characters with those <strong>of</strong> the six ingroup taxa, you can revise<br />
the ingroup's data table (Table A) so as <strong>to</strong> distinguish plesiomorphies and apomorphies.<br />
See Table C.<br />
Table C. Plesiomorphies and apomorphies <strong>of</strong> six taxa. "0" indicates that the taxon possesses a<br />
plesiomorphic charcter state. “1” indicates that the taxon possesses an apomorphic character state. NOTE<br />
THAT “0” DOES NOT NECESSARILY INDICATE THE LACK OF A TRAIT AND “1” DOES NOT<br />
NECESSARILY INDICATE THE PRESENCE OF A TRAIT.<br />
deuteros<strong>to</strong>me<br />
development<br />
no<strong>to</strong>chord vertebrae jaws skull swimbladder<br />
or lung<br />
Once you've identified the apomorphies for each taxon, you're ready <strong>to</strong> assemble the taxa<br />
in<strong>to</strong> clades (monophyletic groups) on the basis <strong>of</strong> special kinds <strong>of</strong> apomorphies called<br />
"synapomorphies".<br />
Useful apomorphies: synapomorphies<br />
A synapomorphy, or "shared derived character", is an apomorphy that occurs in two or<br />
more taxa.<br />
Examination <strong>of</strong> the revised data table (Table C) indicates that, within our ingroup, six<br />
characters are synapomorphies. See Table D.<br />
Table D. Synapomorphies and the taxa that share them.<br />
Synapomorphy<br />
no<strong>to</strong>chord vertebrae jaws skull swimbladder<br />
or lung<br />
tunicate lamprey Cladoselache † lamprey trout<br />
lamprey Cladoselache † trout Cladoselache † lungfish<br />
Cladoselache † trout<br />
lungfish<br />
trout frog<br />
Taxa trout<br />
lungfish<br />
frog<br />
lungfish<br />
lungfish<br />
frog<br />
frog<br />
frog<br />
<strong>Introduction</strong> <strong>to</strong> <strong>Cladistic</strong> <strong>Analysis</strong> - 10<br />
enamel four<br />
true<br />
limbs<br />
tunicate 0 1 0 0 0 0 0 0<br />
lamprey 0 1 1 0 1 0 0 0<br />
Cladoselache † 0 1 1 1 1 0 0 0<br />
trout 0 1 1 1 1 1 0 0<br />
lungfish 0 1 1 1 1 1 1 0<br />
frog 0 1 1 1 1 1 1 1<br />
enamel<br />
lungfish<br />
frog<br />
A given synapomorphy evolved in the most recent common ances<strong>to</strong>r <strong>of</strong> the taxa that<br />
possess it, and it was inherited by each taxon from that ances<strong>to</strong>r. The beauty <strong>of</strong><br />
synapomorphies is that they point out clades (monophyletic groups) <strong>to</strong> the cladist. All <strong>of</strong> the<br />
taxa that possess a given synapomorphy, but not other taxa, belong <strong>to</strong> a clade.
Copyright © 2009 by Department <strong>of</strong> <strong>Integrative</strong> <strong>Biology</strong>, <strong>University</strong> <strong>of</strong> California-Berkeley<br />
Table D discloses that two synapomorphies (skull and vertebrae) identify the same clade.<br />
Figure F shows the same cladogram as in Figure C, but the six synapomorphies and five<br />
nested clades (shown by circles) have been added.<br />
Figure F. A cladogram showing synapomorphies and clades.<br />
tunicate lamprey Cladoselache † trout lungfish frog<br />
no<strong>to</strong>chord<br />
jaws<br />
vertebrae<br />
skull<br />
<strong>Introduction</strong> <strong>to</strong> <strong>Cladistic</strong> <strong>Analysis</strong> - 11<br />
swimbladder<br />
or lung<br />
enamel
Copyright © 2009 by Department <strong>of</strong> <strong>Integrative</strong> <strong>Biology</strong>, <strong>University</strong> <strong>of</strong> California-Berkeley<br />
Once the cladist has identified all <strong>of</strong> the clades, all she has <strong>to</strong> do is draw a cladogram that<br />
depicts how those clades fit <strong>to</strong>gether. First, though, beware <strong>of</strong> "autapomorphies"!<br />
Unhelpful apomorphies: autapomorphies<br />
An autapomorphy is an apomorphy that occurs in only one taxon.<br />
Study <strong>of</strong> the revised data table (Table C) reveals that one character is an autapomorphy<br />
within our ingroup: four true limbs, a character that only frog possesses.<br />
Figure G shows the same cladogram as in Figure C, but six synapomorphies and the single<br />
autapomorphy have been added.<br />
Figure G. A cladogram showing six synapomorphies and one autapomorphy.<br />
tunicate lamprey Cladoselache † trout lungfish frog<br />
no<strong>to</strong>chord<br />
skull<br />
vertebrae<br />
jaws<br />
<strong>Introduction</strong> <strong>to</strong> <strong>Cladistic</strong> <strong>Analysis</strong> - 12<br />
enamel<br />
swimbladder or lung<br />
four<br />
true<br />
limbs<br />
Autapomorphies demonstrate the uniqueness <strong>of</strong> taxa, but they don't help the cladist identify<br />
clades (monophyletic groups).
Drawing the cladogram<br />
Copyright © 2009 by Department <strong>of</strong> <strong>Integrative</strong> <strong>Biology</strong>, <strong>University</strong> <strong>of</strong> California-Berkeley<br />
Once you have identified the clades (monophyletic groups), you can put them <strong>to</strong>gether <strong>to</strong><br />
form a cladogram that depicts the common ancestry relationships <strong>of</strong> the taxa that compose<br />
the ingroup. Nowadays, cladists use computers <strong>to</strong> perform outgroup comparison, <strong>to</strong><br />
identify the clades, and especially, <strong>to</strong> draw the cladogram. However, the following simple<br />
procedure using an intermediate step <strong>of</strong> Venn Diagrams will let you construct a cladogram<br />
when your ingroup doesn't include <strong>to</strong>o many taxa.<br />
Venn Diagram Method <strong>of</strong> converting a Data Matrix in<strong>to</strong> a Cladogram:<br />
First, What is a Venn diagram? Venn diagrams are graphical representations <strong>of</strong> sets and<br />
subsets <strong>of</strong> data that are made by circling data points that have shared characters in nested<br />
boxes or circles. Venn diagrams are used here <strong>to</strong> group clades and subclades <strong>to</strong> show<br />
relationships. Branches can be drawn below the Venn diagram nested boxes <strong>to</strong> reflect<br />
these nested relationships in the form <strong>of</strong> a cladogram.<br />
Circle the groups implied by synapomorphies<br />
deuteros<strong>to</strong>me<br />
development<br />
no<strong>to</strong>chord vertebrae jaws skull swimbladder<br />
or lung<br />
<strong>Introduction</strong> <strong>to</strong> <strong>Cladistic</strong> <strong>Analysis</strong> - 13<br />
enamel four<br />
true<br />
limbs<br />
tunicate 0 1 0 0 0 0 0 0<br />
lamprey 0 1 1 0 1 0 0 0<br />
Cladoselache † 0 1 1 1 1 0 0 0<br />
trout 0 1 1 1 1 1 0 0<br />
lungfish 0 1 1 1 1 1 1 0<br />
frog 0 1 1 1 1 1 1 1
no<strong>to</strong>chord<br />
Copyright © 2009 by Department <strong>of</strong> <strong>Integrative</strong> <strong>Biology</strong>, <strong>University</strong> <strong>of</strong> California-Berkeley<br />
On the upper part <strong>of</strong> a piece <strong>of</strong> paper,<br />
identify taxa subsets. Starting with the most inclusive group(s),<br />
place the taxa in<strong>to</strong> nested boxes.<br />
Note the characters that support each grouping.<br />
vertebrae; skull<br />
jaws<br />
tunicate lamprey Cladoselache trout lungfish frog<br />
<strong>Introduction</strong> <strong>to</strong> <strong>Cladistic</strong> <strong>Analysis</strong> - 14<br />
swimbladder or lung<br />
enamel<br />
4-limbs<br />
Figure H. Taxa subsets in nested boxes<br />
Next, draw a cladogram below the boxes <strong>to</strong> reflect the nested relationships.<br />
tunicate lamprey Cladoselache trout lungfish frog<br />
Figure I. Cladogram implied by nested subsets <strong>of</strong> taxa
Copyright © 2009 by Department <strong>of</strong> <strong>Integrative</strong> <strong>Biology</strong>, <strong>University</strong> <strong>of</strong> California-Berkeley<br />
Draw a clean cladogram with all apomorphies and the outgroup<br />
The branching diagram that you drew below the nested boxes represents a complete<br />
cladogram <strong>of</strong> the ingroup. Nevertheless, redraw the cladogram <strong>to</strong> make it readable as in<br />
Figure J.<br />
Figure J. A set <strong>of</strong> five interconnected clades (a cladogram).<br />
tunicate lamprey Cladoselache † trout lungfish frog<br />
Add the synapomorphies, autapomorphies, and outgroup <strong>to</strong> the cladogram (see Figure K).<br />
Figure K. A cladogram with the synapomorphies, autapomorphy, and outgroup.<br />
sea urchin<br />
tunicate lamprey Cladoselache† trout lungfish frog<br />
no<strong>to</strong>chord<br />
skull<br />
vertebrae<br />
<strong>Introduction</strong> <strong>to</strong> <strong>Cladistic</strong> <strong>Analysis</strong> - 15<br />
jaws<br />
enamel<br />
swimbladder or lung<br />
four<br />
true<br />
limbs
Copyright © 2009 by Department <strong>of</strong> <strong>Integrative</strong> <strong>Biology</strong>, <strong>University</strong> <strong>of</strong> California-Berkeley<br />
SUMMARY:<br />
Venn-Diagram Method <strong>of</strong> converting a Data Matrix in<strong>to</strong> a Cladogram<br />
1. Complete your character analysis by determining the appropriate character state for all<br />
<strong>of</strong> the taxa and characters in the matrix.<br />
2. Determine if a particular character state is derived or primitive, based on a comparison<br />
with an the outgroup. (see “Outgroup Comparison” section above) The character state <strong>of</strong><br />
the outgroup is considered <strong>to</strong> be the primitive condition (ie., the plesiomorphic state).<br />
3. In each column <strong>of</strong> your matrix, circle only groups <strong>of</strong> shared derived characters<br />
(synapomorphies). This will allow you <strong>to</strong> identify monophyletic groupings within your matrix.<br />
4. Identify taxa subsets (= subclades and clades) based on their shared derived characters<br />
(synapomorphies).<br />
5. Starting with the most inclusive group(s), place subclades and their larger (sub-)clades in<strong>to</strong><br />
“nested” boxes (see Venn Diagram above).<br />
6. Draw cladogram branches below taxa boxes <strong>to</strong> reflect relationships depicted by these<br />
nested boxes (e.g., clades and subclades).<br />
7. Label cladogram tips with taxa names and branches with supporting shared derived<br />
characters (synapomorphies).<br />
Choosing among alternative cladograms: parsimony<br />
Sometimes you’ll discover that you can draw different, but nonequivalent, cladograms from<br />
a single set <strong>of</strong> clades, or previous research will suggest that your original cladogram is<br />
incorrect.<br />
For example, let's say that, based on your studies <strong>of</strong> comparative ana<strong>to</strong>my, you're sure that<br />
jaws evolved twice among the six animal taxa that make up our ingroup. Consequently,<br />
you propose that the following cladogram (Figure L) better reflects the common ancestry<br />
relationships within the ingroup than the original cladogram (Figure K).<br />
<strong>Introduction</strong> <strong>to</strong> <strong>Cladistic</strong> <strong>Analysis</strong> - 16
Figure L. Alternative, but less parsimonious<br />
cladogram.<br />
sea urchin<br />
Copyright © 2009 by Department <strong>of</strong> <strong>Integrative</strong> <strong>Biology</strong>, <strong>University</strong> <strong>of</strong> California-Berkeley<br />
tunicate lamprey Cladoselache† trout lungfish frog<br />
no<strong>to</strong>chord<br />
skull<br />
vertebrae<br />
<strong>Introduction</strong> <strong>to</strong> <strong>Cladistic</strong> <strong>Analysis</strong> - 17<br />
swimbladder<br />
or lung<br />
jaws<br />
enamel<br />
swimbladder or lung<br />
Both cladograms accurately indicate the distribution <strong>of</strong> characters among taxa. We have<br />
no way <strong>of</strong> knowing which (if either) cladogram correctly depicts evolutionary his<strong>to</strong>ry, but the<br />
Principle <strong>of</strong> Parsimony will allow us <strong>to</strong> decide which cladogram is more acceptable. Let's<br />
analyze our two candidates:<br />
Original cladogram (Figure K). This cladogram implies that seven<br />
innovations have occurred during the evolution <strong>of</strong> the ingroup: Six<br />
synapomorphies and one autapomorphy.<br />
Alternative cladogram (Figure L). This cladogram implies that nine<br />
innovations have occurred during the evolution <strong>of</strong> the ingroup: Seven<br />
synapomorphies and two autapomorphies. Jaws and swimbladder or lung<br />
each evolved at two different times.<br />
Please remember you can “flip” the branches <strong>of</strong> the cladogram and maintain the<br />
same relationsip among the organisms. Your GSI will give you several examples.<br />
The Principle <strong>of</strong> Parsimony states that the simplest explanation <strong>of</strong> the data is preferable<br />
over more complicated explanations. In cladistics it is assumed that the cladogram with the<br />
fewest branches is probably the most accurate because it suggests the fewest number <strong>of</strong><br />
evolutionary innovations. Therefore, the original cladogram (Figure K) is more acceptable.<br />
It should be treated as the best explanation <strong>of</strong> your data until a more parsimonious<br />
cladogram (and one that still accurately portrays the distribution <strong>of</strong> characters among taxa)<br />
comes along.<br />
jaws<br />
four<br />
true<br />
limbs
Copyright © 2009 by Department <strong>of</strong> <strong>Integrative</strong> <strong>Biology</strong>, <strong>University</strong> <strong>of</strong> California-Berkeley<br />
Note that in mapping the character data on<strong>to</strong> the cladogram, the most parsimonious<br />
explanation may require that you propose evolutionary reversals. A reversal is when an<br />
apomorphic or derived state evolves back in<strong>to</strong> the ancestral or plesiomorphic state. This is<br />
also referred <strong>to</strong> as an ‘evolutionary loss’ (see diagram below).<br />
<strong>Introduction</strong> <strong>to</strong> <strong>Cladistic</strong> <strong>Analysis</strong> - 18
Interpreting the cladogram<br />
Copyright © 2009 by Department <strong>of</strong> <strong>Integrative</strong> <strong>Biology</strong>, <strong>University</strong> <strong>of</strong> California-Berkeley<br />
After you have constructed your cladogram, you can discuss the phylogenetic relationships<br />
among individual taxa or among groups <strong>of</strong> taxa.<br />
Individual taxa<br />
By referring <strong>to</strong> the cladogram in Figure K, you can make statements about individual taxa<br />
like the following:<br />
"Lungfish possesses enamel, a character (synapomorphy) that evolved in the<br />
most recent common ances<strong>to</strong>r <strong>of</strong> lungfish and frog."<br />
"Lungfish is more closely related <strong>to</strong> frog than <strong>to</strong> trout, Cladoselache †,<br />
lamprey, tunicate, or sea urchin."<br />
Groups <strong>of</strong> taxa<br />
Again, by referring <strong>to</strong> the cladogram in Figure K, you can talk about the evolutionary<br />
significance <strong>of</strong> a particular group <strong>of</strong> taxa. We can recognize three kinds <strong>of</strong> groups:<br />
"monophyletic groups", "paraphyletic groups", and "polyphyletic groups".<br />
Monophyletic groups. A monophyletic group consists <strong>of</strong> an ances<strong>to</strong>r and all <strong>of</strong> its<br />
descendants. A monophyletic group is a clade. It is defined by at least one synapomorphy<br />
(all group members have the synapomorphy or synapomorphies). Figure M gives an<br />
example <strong>of</strong> a monophyletic group.<br />
Figure M. A monophyletic group (enclosed by the thick line).<br />
sea urchin<br />
tunicate lamprey Cladoselache † trout lungfish frog<br />
no<strong>to</strong>chord<br />
skull<br />
<strong>Introduction</strong> <strong>to</strong> <strong>Cladistic</strong> <strong>Analysis</strong> - 19<br />
vertebbrae<br />
jaws<br />
enamel<br />
swimbladder or lung<br />
four<br />
true<br />
limbs
Copyright © 2009 by Department <strong>of</strong> <strong>Integrative</strong> <strong>Biology</strong>, <strong>University</strong> <strong>of</strong> California-Berkeley<br />
The five animals that possess the synapomorphies vertebrae and skull belong <strong>to</strong> this<br />
monophyletic group.<br />
Paraphyletic groups. A paraphyletic group consists <strong>of</strong> an ances<strong>to</strong>r and some <strong>of</strong> its<br />
descendants. A paraphyletic group is an incomplete clade, or a "grade". It is defined by<br />
the absence <strong>of</strong> at least one character (all group members lack some particular<br />
character[s]). Figure N gives an example <strong>of</strong> a paraphyletic group.<br />
Figure N. A paraphyletic group (enclosed by the thick line).<br />
sea urchin<br />
tunicate lamprey Cladoselache † trout lungfish frog<br />
no<strong>to</strong>chord<br />
skull<br />
vertebrae<br />
<strong>Introduction</strong> <strong>to</strong> <strong>Cladistic</strong> <strong>Analysis</strong> - 20<br />
jaws<br />
enamel<br />
swimbladder or lung<br />
This group lacks one descendant (frog) <strong>of</strong> the ances<strong>to</strong>r in which vertebrae and skull<br />
evolved. This paraphyletic group includes taxa that possess vertebrae and skulls but lack<br />
four true limbs.<br />
Polyphyletic groups. A polyphyletic group includes two or more taxa, but not the common<br />
ances<strong>to</strong>r <strong>of</strong> those taxa. A polyphyletic group is defined by at least one similar character<br />
that evolved independently (by convergent or parallel evolution) in each group member.<br />
Taxa are placed in a polyphyletic group because they share some superficial similarity, not<br />
because they're closely related <strong>to</strong> one another. Figure O gives an example <strong>of</strong> a<br />
polyphyletic group.<br />
four<br />
true<br />
limbs
Copyright © 2009 by Department <strong>of</strong> <strong>Integrative</strong> <strong>Biology</strong>, <strong>University</strong> <strong>of</strong> California-Berkeley<br />
Figure O. A polyphyletic group (enclosed by the thick line).<br />
sea urchin<br />
tunicate lamprey Cladoselache † trout lungfish frog<br />
no<strong>to</strong>chord<br />
skull<br />
vertebrae<br />
<strong>Introduction</strong> <strong>to</strong> <strong>Cladistic</strong> <strong>Analysis</strong> - 21<br />
jaws<br />
enamel<br />
swimbladder or lung<br />
Tunicate and frog were put <strong>to</strong>gether in a polyphyletic group because each possesses a<br />
larva that looks like a tadpole. The larvae in these two taxa certainly evolved<br />
independently. The larval similarities do not provide evidence <strong>of</strong> a close phylogenetic<br />
relationship between tunicate and frog.<br />
Caution. When people talk about monophyletic groups, they sometimes mention the<br />
member taxa, but forget <strong>to</strong> include the ances<strong>to</strong>rs. Here's an example <strong>of</strong> a sloppy,<br />
but common, way <strong>of</strong> referring <strong>to</strong> a monophyletic group:<br />
"Lamprey, Cladoselache†, trout, lungfish, and frog compose a monophyletic<br />
group."<br />
Although this sounds like a polyphyletic group, we know that it's really monophyletic<br />
because lamprey, Cladoselache†, trout, lungfish, and frog each possesses two<br />
synapomorphies (skull and vertebrae) that evolved in their most recent common ances<strong>to</strong>r.<br />
You must rely on context <strong>to</strong> make your judgement: Were the taxa put <strong>to</strong>gether on the basis<br />
<strong>of</strong> a superficial similarity (polyphyletic group) or a synapomorphy (monophyletic group)?<br />
four<br />
true<br />
limbs
Copyright © 2009 by Department <strong>of</strong> <strong>Integrative</strong> <strong>Biology</strong>, <strong>University</strong> <strong>of</strong> California-Berkeley<br />
Key Terminology from “<strong>Introduction</strong> <strong>to</strong> <strong>Cladistic</strong>s <strong>Analysis</strong>” Reading<br />
By Nick Matzke and Stephanie Stuart<br />
The handouts involving cladistics/phylogenetics have a lot <strong>of</strong> confusing terminology. Below are<br />
the key terms. Scientists developed this terminology <strong>to</strong> make it easier <strong>to</strong> make careful distinctions,<br />
e.g. between different types <strong>of</strong> “similarity” or different types <strong>of</strong> “groups.” Therefore, the terms<br />
below have been organized by category.<br />
The definitions <strong>of</strong> a few words not in the reading have been given.<br />
Define these terms in your own words. Diagrams are encouraged.<br />
Representing relationships<br />
Cladogram –<br />
Phylogeny –<br />
Clade –<br />
Poly<strong>to</strong>my (vs. dicho<strong>to</strong>my) – A poly<strong>to</strong>my is an unresolved node, where three or more branches<br />
come <strong>to</strong>gether. A resolved node is dicho<strong>to</strong>mous, meaning it has only 2 daughter branches.<br />
Words for groups<br />
Taxon (plural taxa) vs. clade –<br />
Words for whether or not a group is phylogenetically supported:<br />
Monophyletic –<br />
Polyphyletic –<br />
Paraphyletic –<br />
Outgroup vs. ingroup –<br />
<strong>Introduction</strong> <strong>to</strong> <strong>Cladistic</strong> <strong>Analysis</strong> - 22
Copyright © 2009 by Department <strong>of</strong> <strong>Integrative</strong> <strong>Biology</strong>, <strong>University</strong> <strong>of</strong> California-Berkeley<br />
Words for character states<br />
Character state (“morph”) – a particular shape or attribute <strong>of</strong> an organism.<br />
Apomorphy –<br />
Synapomorphy –<br />
Autapomorphy –<br />
Plesiomorphy –<br />
Symplesiomorphy –<br />
Homoplasy –<br />
Reversal –<br />
Types <strong>of</strong> classification<br />
Linnaean systematics is the traditional method <strong>of</strong> classification, based on all kinds <strong>of</strong> similarity<br />
(including homoplasies and plesiomorphies). Because <strong>of</strong> this, some groups that were made in the<br />
past have turned out not <strong>to</strong> be monophyletic. Linnaean ranks (genus, family, order, class, phylum,<br />
kingdom) were used <strong>to</strong> organize groups, but there was no rigorous definition <strong>of</strong> these ranks.<br />
Phylogenetic systematics –<br />
<strong>Introduction</strong> <strong>to</strong> <strong>Cladistic</strong> <strong>Analysis</strong> - 23