Observer Handbook #1 - Voluntary Observing Ship Program - NOAA
Observer Handbook #1 - Voluntary Observing Ship Program - NOAA
Observer Handbook #1 - Voluntary Observing Ship Program - NOAA

Create successful ePaper yourself
Turn your PDF publications into a flip-book with our unique Google optimized e-Paper software.
Synoptic Code Symbols with Range of Values<br />
BBXX <strong>Ship</strong> Weather Report Indicator BBXX<br />
D....D Radio call sign Call Sign<br />
YY Day of the month 01-31<br />
GG Time of observation 00-23<br />
i w Wind indicator 3, 4<br />
L aL aL a Latitude 000-900<br />
Q c Quadrant 1, 3, 5, 7<br />
L oL oL oL o Longitude 0000-1800<br />
i R Precipitation data indicator 4<br />
i x Weather data indicator 1, 3<br />
h Cloud base height 0-9, /<br />
VV Visibility 90-99<br />
N Cloud cover 0-9, /<br />
dd Wind direction 00-36, 99<br />
ff Wind speed 00-99<br />
fff High Speed Wind Knots (099- )<br />
s n Sign of temperature 0, 1<br />
TTT Dry bulb temperature Celsius Degrees<br />
T dT dT d Dew point temperature Celsius Degrees<br />
PPPP Sea level pressure Actual Hp or Mb<br />
(omit 1 in thousandths)<br />
a 3-hour pressure tendency 0-8<br />
ppp 3-hour pressure change Hp or Mb<br />
ww Present weather 00-99<br />
W 1 Past weather (primary) 0-9<br />
W 2 Past weather (secondary) 0-9<br />
N h Lowest cloud cover 0-9, /<br />
C L Low cloud type 0-9, /<br />
C M Middle cloud type 0-9, /<br />
C H High cloud type 0-9, /<br />
D s <strong>Ship</strong>’s course 0-9<br />
V s <strong>Ship</strong>’s average speed 0-9<br />
S s Sign/type sea surface temp. 0-7<br />
T WT WT W Sea surface temp. Celsius Degrees<br />
P WP W Sea period Seconds<br />
H WH W Sea height Half Meters<br />
d W1d W1 Primary swell direction 01-36, 99<br />
d W2d W2 Secondary swell direction 01-36, 99, //<br />
P W1P W1 Primary swell period Seconds<br />
H W1H W1 Primary swell height Half Meters<br />
P W2P W2 Secondary swell period Seconds<br />
H W2H W2 Secondary swell height Half Meters<br />
I s Ice accretion cause on ship 1-5<br />
E sE s Ice accretion thickness on ship Centimeters<br />
R s Ice accretion rate on ship 0-4<br />
S w Sign/type wet bulb temp. 0-7<br />
T bT bT b Wet bulb temp. Celsius Degrees<br />
c i Sea ice concentration 0-9, /<br />
S i Sea ice development 0-9, /<br />
b i Ice of land origin 0-9, /<br />
D i Ice edge bearing 0-9, /<br />
z i Ice trend 0-9, /
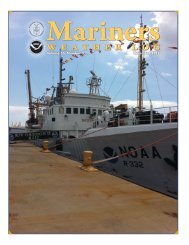
National Weather Service<br />
<strong>Observing</strong> <strong>Handbook</strong> No. 1<br />
Marine Surface Weather Observations<br />
May 2010<br />
U.S. DEPARTMENT OF COMMERCE<br />
National Oceanic and Atmospheric Administration<br />
National Weather Service<br />
National Data Buoy Center<br />
Building 1007<br />
Stennis Space Center, MS 39529-6000
Preface<br />
In writing this new edition of NWS <strong>Observing</strong> <strong>Handbook</strong> No. 1 it has been<br />
our intent to include as much useful information as possible in the available<br />
space. The compact size and design, and “field guide” format, should allow for<br />
easy handling and quick reference. We hope this simplifies your work as<br />
weather observers, and makes it easier to locate the information you need.<br />
Weather has an almost magical hold on the mariner. Every change in the<br />
weather at sea is noted with a sense of trepidation. Reporting weather not only<br />
contributes to your safety, but adds to your basic knowledge of seamanship. It<br />
is part of keeping a good lookout.<br />
For every 100 observations on land, there is only about 1 observation at sea.<br />
Without your participation in the <strong>Voluntary</strong> <strong>Observing</strong> <strong>Ship</strong> (VOS) program,<br />
there would be vast marine areas without data, making weather forecasting<br />
nearly impossible for these areas. The importance of ship reports cannot be<br />
overstated. We thank ships officers for their fine work, dedication, and<br />
commitment.<br />
Please follow the weather reporting schedule for ships as best you can (0000,<br />
0600, 1200, 1800 UTC from all areas; every 3-hours from the Great Lakes,<br />
from within 200 miles of the United States and Canadian coastlines, and from<br />
within 300 miles of named tropical storms or hurricanes). For assistance,<br />
contact a Port Meteorological Officer (PMO), who will come aboard your<br />
vessel and provide all the information you need to observe, code, and transmit<br />
weather (see page 1-2 through 1-5).<br />
NWSOH No. 1 iii May 2010
Table of Contents<br />
iii<br />
vii<br />
Preface<br />
Introduction<br />
1-1 Chapter 1: <strong>Program</strong> Description<br />
Chapter 2: <strong>Ship</strong>’s Synoptic Code and<br />
2-1 <strong>Observing</strong> Methods<br />
3-1 Chapter 3: Transmitting the Observation<br />
4-1 Chapter 4: The Weatherwise Mariner<br />
5-1 Glossary<br />
A-1 Appendix A: <strong>Observing</strong> Forms and Supplies<br />
Appendix B: Conversion Factors and<br />
B-1 Equivalents<br />
Appendix C: Interpretation of<br />
C-1 Weather Map Symbols<br />
NWSOH No. 1 v May 2010
Introduction<br />
For beginners and established observers alike, this new edition of the National Weather<br />
Service <strong>Observing</strong> <strong>Handbook</strong> No. 1 (NWSOH1) explains how to observe, how to code,<br />
and how to transmit weather observations from moving ships at sea.<br />
IMPORTANCE OF OBSERVATIONS FROM SHIPS<br />
Accomplishments in the atmospheric sciences have their roots in observations. They<br />
are a critical first step in the end-to-end forecast process. This process consists of the<br />
taking and coding of observations, the transmission and receipt of data, the processing<br />
and analysis of data (including numerical and computer modeling), followed by the<br />
preparation and issuance of forecasts and warnings.<br />
More specifically, observations are used by meteorologists to evaluate your local<br />
weather conditions, and to locate and determine the strength of weather systems such<br />
as fronts, air masses, high and low pressure systems, tropical storms, and hurricanes.<br />
Your observations are especially important in the preparation of the surface weather<br />
chart. Isobars (lines of equal barometric pressure), which are crucial for defining and<br />
delineating all weather systems, could not be drawn over marine areas without ship<br />
reports.<br />
<strong>Ship</strong>s observations are not only important for weather forecasts at sea, but also for<br />
forecasts over land areas, because marine weather systems often move inland. Notable<br />
examples include (1) North Pacific Ocean weather systems, which frequently move<br />
eastward to effect the weather over much of North America, especially during the<br />
winter season, (2) tropical storms and hurricanes, which develop over the oceans, and<br />
can cause great devastation over highly populated coastal areas, (3) weather systems<br />
over the North Atlantic Ocean, which have a great impact on the weather of Europe.<br />
Accurate marine data is also used to prepare long range forecasts of climate,<br />
temperature, and precipitation, in the monitoring of climatic change, ocean currents,<br />
and eddies, and to study the interaction of air and sea. This is important for<br />
agriculture, industrial planning, ship routing, fishing, and many other activities. Pilot<br />
charts and climatological atlases of the oceans are largely based on observations from<br />
ships. Your weather observations will also help you interpret the forecast and changes<br />
in weather that occur at your position or along your route.<br />
ELEMENTS TO BE OBSERVED<br />
<strong>Ship</strong>s taking meteorological observations should be familiar with the methods for<br />
observing or measuring the following elements:<br />
(1) Cloud height, amount, and type;<br />
NWSOH No. 1 vii May 2010
Introduction<br />
(2) Visibility;<br />
(3) Wind speed and direction;<br />
(4) Air and wet-bulb temperatures, and dew point;<br />
(5) Atmospheric pressure, tendency and its characteristic;<br />
(6) Weather - present and past;<br />
(7) Course and speed of ship;<br />
(8) Sea surface temperature;<br />
(9) Sea waves and swell - period, direction, and height;<br />
(10) Ice conditions, including icing on board ship;<br />
EQUIPMENT REQUIRED<br />
Suitable instruments for use on ships are the following:<br />
(1) Precision aneroid barometer or digital electronic barometer;<br />
(2) Dry and wet-bulb psychrometer (sling, or housed in an outdoor shelter);<br />
(3) Barograph;<br />
(4) Sea temperature thermometer, either a continuously immersed sensor<br />
(intake or hull mounted) or sea water bucket;<br />
An anemometer to measure wind force may be used as an alternative to visual wind<br />
estimates using the Beaufort scale.<br />
OBSERVING ORDER<br />
In general, instrumental observations requiring the use of a light should be made after<br />
non-instrumental ones, so that eye function in the dark is not impaired. Efforts should<br />
be made to observe elements other than pressure within the ten minutes preceding the<br />
reporting hour. Ideally, atmospheric pressure should be read at exactly the standard<br />
time.<br />
HISTORICAL NOTE<br />
Since the invention of meteorological instruments did not begin until the<br />
seventeenth century, instrumental records of the weather elements cover little more<br />
than 200 years anywhere, while for many parts of the world, the period of observation<br />
is a good deal less than 100 years. The best records are available from well-populated<br />
land areas.<br />
Notable inventions include the air thermometer (Galileo, 1592), alcohol<br />
and mercury thermometer (Fahrenheit, 1714), the mercury barometer<br />
(Torricelli, 1643), the aneroid barometer (Vidie, 1843), and the anemometer (Hooke,<br />
1667).<br />
During the eighteenth and nineteenth centuries, mariners began keeping weather and<br />
oceanographic records and logs. Knowledge of prevailing winds and ocean currents<br />
came about as a result of these records. The <strong>Voluntary</strong> <strong>Observing</strong> <strong>Ship</strong> (VOS)<br />
NWSOH No. 1 viii May 2010
Introduction<br />
<strong>Program</strong> as we know it today is rooted in the work of Mathew Fontaine Maury, head<br />
of the U.S. Navy Hydrographic Office, who organized a meeting in Brussels in 1853,<br />
attended by delegates of ten major maritime nations. The purpose of the meeting was<br />
to discuss the establishment of a uniform system for the collection of marine<br />
meteorology and oceanography data, and the use of these data for the benefit of<br />
shipping in return.<br />
The VOS program was recognized in 1948 in the International Convention For The<br />
Safety Of Life At Sea (SOLAS):<br />
The contracting governments undertake to encourage the collection of meteorological data by ships at sea<br />
and to arrange for their examination, dissemination and exchange in the manner most suitable for the<br />
purpose of aiding navigation. Administrations shall encourage the use of instruments of a high degree<br />
of accuracy, and shall facilitate the checking of such instruments upon request.<br />
HAVE YOUR INSTRUMENTS ADJUSTED AND<br />
REPORT ACCURATE DATA<br />
Always ensure that your equipment is accurate and properly adjusted. A PMO should<br />
adjust your barometer and barograph once every 3 – 6 months, and also check your<br />
psychrometer during every ship visit. Sea-water thermometers (whether hull-mounted<br />
or located in the condenser intake) should be calibrated annually, and checked every<br />
time your vessel is in the yard for service. If your vessel has an anemometer, it should<br />
be calibrated once every 6 months (U.S. PMOs do not perform this service). Make sure<br />
the anemometer is located where the ships superstructure will not interfere with the air<br />
motion.<br />
When observing and recording data, always proceed in a very careful and meticulous<br />
manner. An inaccurate observation can mislead the forecaster and result in an<br />
incorrect forecast. On the other hand, a reliable observation can hold the key to an<br />
obscure or complex meteorological condition. When recording dry and wet bulb<br />
temperatures, always take your psychrometer to the windward side of the ship. This<br />
allows contact with air fresh from the sea which has not passed over the deck prior to<br />
your measurement.<br />
Accuracy is not only important for forecasting — it is also very important for<br />
climatological purposes and for investigators who may use your observations at a later<br />
time. A few inaccurate observations can bias results and cause erroneous conclusions.<br />
A researcher has little to go by when deciding about the accuracy of a particular<br />
observation, and must depend on the competence of the observer aboard ship.<br />
TRANSMIT REPORTS WITHOUT DELAY (REAL-TIME)<br />
Always transmit your observations without delay as soon as possible after you’ve<br />
observed the data. <strong>Ship</strong> reports are used to indicate current, up-to-date conditions at<br />
your vessel (so called real-time conditions). Make your observation as close to the<br />
NWSOH No. 1 ix May 2010
Introduction<br />
reporting hour as you can. Any transmission problems or difficulties with radio stations<br />
should be reported back to your PMO, and written in the appropriate space on the<br />
back of WS Form B-81 (<strong>Ship</strong>s Weather Observations), if used.<br />
Report arrival times tend to be later at night and for Southern Hemisphere reports.<br />
Timely submission of these reports is most important.<br />
Data is most readily available from the main shipping routes in both hemispheres.<br />
There is a chronic shortage of data from coastal waters out 200 miles (for this reason,<br />
3-hourly reports are requested from U.S. and Canadian waters out 200 miles from<br />
shore). There is also a widespread shortage of data from the Southern Hemisphere<br />
and from the arctic ocean. More data is also needed from the tropics and easterly<br />
trade wind belt (5-35? N), especially during the N. Hemisphere hurricane season<br />
(May - November). From the North Atlantic and North Pacific oceans, more data is<br />
needed at 0600 and 1200 UTC (these are late night and early morning times). If you<br />
are operating from a data-sparse area, please report weather regularly.<br />
NWSOH No. 1 x May 2010
Chapter 1 — <strong>Program</strong> Description<br />
THE VOLUNTARY OBSERVING SHIP PROGRAM<br />
The <strong>Voluntary</strong> <strong>Observing</strong> <strong>Ship</strong> (VOS) program is organized for the purpose of<br />
obtaining weather and oceanographic observations from moving ships. An<br />
international program under World Meteorological Organization (WMO) auspices, the<br />
VOS has over 5000 vessels participating from 23 nations. It is part of the WMO<br />
Global <strong>Observing</strong> System of the World Weather Watch.<br />
The United States National Weather Service (NWS) VOS program is the largest in the<br />
world with over 600 vessels participating. It closely follows WMO guidelines for VOS<br />
programs. The U.S. program is supported by 11 full-time Port Meteorological Officers<br />
(PMOs) in New York, Baltimore, Norfolk, Jacksonville, Port Everglades, New Orleans,<br />
Houston, Los Angeles, Seattle, Charleston and Duluth), and 4 part-time PMOs (in<br />
Honolulu, Anchorage, Oakland, Kodiak, and Valdez). The national program office<br />
located at Stennis Space Center, MS manages the program and oversees PMO<br />
activities. <strong>Observing</strong> forms, handbooks, supplies, and operating instructions are<br />
prepared at the program office. The national office also maintains a VOS <strong>Program</strong><br />
Computerized Data Management System to record PMO ship visits, vessel mailing<br />
addresses, vessel equipment inventories, and information about vessel reports. All U.S.<br />
PMOs have direct access to this database.<br />
Both U.S. and foreign flag vessels participate in the U.S. VOS program. Any<br />
vessel willing to take and transmit observations in marine areas can join the program.<br />
The WMO establishes the ships synoptic code, and procedures and standards for the<br />
collection and dissemination of observations worldwide. The WMO also maintains<br />
information about countries and vessels participating in the program (available in<br />
WMO Publication No. 47, International List Of Selected, Supplementary, And<br />
Auxiliary <strong>Ship</strong>s).<br />
WMO SHIPS’ SYNOPTIC CODE, FM 13-X<br />
Coded messages are used for the international exchange of meteorological<br />
information. This is because code makes it practical to understand and process data,<br />
manually or by computer, for real-time use or later compilation into climatological<br />
records. The code also allows data to be transferred internationally at high speed, on<br />
special data circuits known as the Global Telecommunications System (GTS).<br />
The WMO code form Code FM 13-X is the ships’ synoptic code, used by<br />
weather reporting ships. The code form is composed of a set of symbolic letters<br />
NWSOH No. 1 1-1 May 2010
<strong>Program</strong> Description<br />
(actually groups of letters) representing meteorological elements. Examples of symbolic<br />
letter groups include Nddff snTTT etc. To report weather, the symbolic letters are<br />
transcribed into figures indicating the value or state of the elements described. Code<br />
tables are often used to specify the appropriate values of the different symbolic letters.<br />
See Chapter 2.<br />
Universal code has been called the twentieth century’s greatest improvement in the<br />
collection of meteorological data. Prior to code standardization, lack of consistency<br />
and difficulty deciphering observations posed enormous problems for the<br />
meteorologist.<br />
Code forms and specifications are determined by international agreement at WMO<br />
committee meetings, usually held in Geneva. Codes are changed occasionally to meet<br />
operational needs — the last major change was in January 1982. Some minor changes<br />
were made in November, 1994.<br />
STANDARD WEATHER REPORTING SCHEDULE FOR SHIPS<br />
The worldwide weather reporting schedule for <strong>Voluntary</strong> <strong>Observing</strong> <strong>Ship</strong>s is 4 times<br />
daily — at 0000, 0600, 1200, and 1800 UTC. These are the “main synoptic” times,<br />
when weather forecasts are prepared and, therefore, when data is needed most. Two of<br />
these times, 0000 and 1200 UTC, are most important — when the numerical weather<br />
prediction models are initialized with data and also when soundings are released from<br />
upper air stations all over the world. Reporting weather once every 3 hours when<br />
within 300 miles of a named tropical storm or hurricane is also standard practice<br />
worldwide. Storm (wind speed 48 knots or higher) or special reports for conditions not<br />
forecast, much worse than forecast, or for sudden weather changes) should be sent<br />
whenever conditions warrant.<br />
3-HOURLY WEATHER REPORTING SCHEDULE<br />
Vessels operating on the Great Lakes, and within 200 miles of the U.S. or Canadian<br />
coastlines (including the coasts of Alaska, Hawaii, and Gulf coast states), are asked to<br />
transmit their observations once every three hours — at 0000, 0300, 0600, 0900, 1200,<br />
1500, 1800, and 2100 UTC. This special schedule is maintained because of a data<br />
shortage from near-shore areas. All weather reports are voluntary — try to follow the<br />
recommended reporting schedule as best you can. Always give top priority to reports at<br />
the main synoptic hours (6- hour intervals). When shipboard routine permits, follow<br />
the 3 -hour schedule from coastal waters.<br />
PORT METEOROLOGICAL OFFICERS (PMOS)<br />
Port Meteorological Officers (PMOs) spend most of their time visiting ships in support<br />
of the VOS program. This is to encourage vessels to report weather; to instruct<br />
observers about procedures and the use of code; to provide observing supplies,<br />
NWSOH No. 1 1-2 May 2010
<strong>Program</strong> Description<br />
handbooks, and instructions; to adjust equipment; and, in some cases, to install, on<br />
loan, meteorological instrumentation. A top priority of the PMO is recruiting new<br />
vessels into the VOS program. When the PMO comes aboard your vessel, remember<br />
to ask questions about observing, coding, and reporting weather. If you’re in the VOS<br />
program, keep the PMO informed about changes to your contact information (mailing<br />
address e-mail address etc). Discuss weather forecasts, warnings, and facsimile products<br />
with the PMO — especially any specific problems you’ve had. The PMO will contact<br />
the appropriate party for investigation and corrective action. If you have any<br />
suggestions to improve the VOS program, make them known to the PMO.<br />
More information about the <strong>Voluntary</strong> <strong>Observing</strong> <strong>Ship</strong> <strong>Program</strong> and Port Meteorological<br />
Officers is available on the Worldwide Web at http://www.vos.noaa.gov.<br />
NWSOH No. 1 1-3 May 2010
LOCATIONS OF U.S. PMOS<br />
HEADQUARTERS<br />
<strong>Voluntary</strong> <strong>Observing</strong> <strong>Ship</strong> <strong>Program</strong><br />
National Data Buoy Center<br />
Building Bldg. 3203<br />
Stennis Space Center, MS 39529-6000<br />
E-mail: vos@noaa.gov<br />
ATLANTIC PORTS<br />
PMO Miami, FL<br />
National Weather Service, <strong>NOAA</strong><br />
2550 Eisenhower Blvd, Suite 312<br />
P.O. Box 165504<br />
Port Everglades, FL 33316<br />
E-mail: pmomia@noaa.gov<br />
PMO Jacksonville, FL<br />
National Weather Service, <strong>NOAA</strong><br />
13701 Fang Road<br />
Jacksonville, FL 32218-7933<br />
E-mail: pmojax@noaa.gov<br />
PMO Charleston, SC<br />
<strong>NOAA</strong> Coastal Services Center<br />
2234 South Hobson Avenue<br />
Charleston, SC 29405-2413<br />
E-mail: pmochs@noaa.gov<br />
PMO Norfolk, VA<br />
National Weather Service, <strong>NOAA</strong><br />
4034-B Geo. Wash. Mem. Hwy.<br />
Yorktown, VA 23692-2724<br />
E-mail: pmonor@noaa.gov<br />
PMO New York<br />
National Weather Service, <strong>NOAA</strong><br />
110 Main Street, Suite 201<br />
South Amboy, NJ 08879-1367<br />
E-mail: pmonyc@noaa.gov<br />
<strong>Program</strong> Description<br />
PMO Baltimore, MD<br />
National Weather Service, <strong>NOAA</strong><br />
Maritime Center I, Suite 287<br />
2200 Broening Highway<br />
Baltimore, MD 21224-6623<br />
E-mail: pmobal@noaa.gov<br />
Great Lakes Ports PMO<br />
Great Lakes National Weather Service,<br />
<strong>NOAA</strong><br />
5027 Miller Trunk Highway<br />
Duluth, MN 55811-1442<br />
E-mail: pmoglakes@noaa.gov<br />
GULF OF MEXICO PORTS<br />
PMO New Orleans, LA<br />
<strong>NOAA</strong> Fisheries<br />
PO Drawer 1207<br />
Pascagoula, MS 39568-1207<br />
E-mail: pmomsy@noaa.gov<br />
PMO Houston, TX<br />
National Weather Service, <strong>NOAA</strong><br />
Houston Area Weather Office<br />
1620 Gill Road<br />
Dickinson, TX 77539-3409<br />
E-mail: pmohou@noaa.gov<br />
Pacific Ports PMO<br />
Long Beach, CA<br />
National Weather Service, <strong>NOAA</strong><br />
501 West Ocean Blvd., Room 4480<br />
Long Beach, CA 90802-4213<br />
E-mail: pmolax@noaa.gov<br />
PMO, Oakland, CA<br />
National Weather Service, <strong>NOAA</strong><br />
1301 Clay Street, Suite 1190N<br />
Oakland, CA 94612-5217<br />
E-mail: pmooak@noaa.gov<br />
NWSOH No. 1 1-4 May 2010
<strong>Program</strong> Description<br />
PMO Seattle, WA PMO Anchorage, AK<br />
National Weather Service, <strong>NOAA</strong> National Weather Service Alaska Region<br />
7600 Sand Point Way, N.E. 222 West 7th Avenue #23<br />
BIN C15700 Anchorage, AK 99513-7575<br />
Seattle, WA 98115-6349 E-mail: pmoanc@noaa.gov<br />
E-mail: pmosea@noaa.gov<br />
PMO Honolulu, HI<br />
PMO Kodiak, AK National Weather Service Pacific Region HQ<br />
National Weather Service, <strong>NOAA</strong> Grosvenor Center, Mauka Tower<br />
600 Sandy Hook Street, Suite 1 737 Bishop Street, Suite 2200<br />
Kodiak, AK 99615-6814 Honolulu, HI 96813-3201<br />
E-mail: pmokdk@noaa.gov E-mail: pmohon@noaa.gov<br />
PMO Valdez, AK<br />
National Weather Service, <strong>NOAA</strong><br />
Box 427<br />
Valdez, AK 99686-0427<br />
E-mail: pmovdz@noaa.gov<br />
EQUIPMENT LOAN<br />
For dedicated vessels, the NWS may supply barometers, barographs, or<br />
psychrometers as a loan for use in taking weather observations. The equipment is<br />
expensive and hard to replace. A loan agreement form between the PMO and the<br />
ship will have to be filled out. If you have such equipment, and are no longer<br />
participating in the VOS program, please contact a Port Meteorological Officer. An<br />
equipment pick-up, drop-off, or delivery will be scheduled. Equipment supplies are<br />
very limited. Please help ensure that equipment is accounted for and available for new<br />
VOS program recruits.<br />
WHAT TO MAIL IN<br />
All of your observations (completed on <strong>Ship</strong>s Weather Observations WS Form<br />
B-81 or on SEAS archive disks), and, if you have a barograph, your barograms, should<br />
be mailed to your PMO when you reach port, using the postage paid envelopes. Make<br />
sure the month and year and your vessel’s call letters are clearly shown on each page of<br />
the B-81 or disk envelope. After reviewing the reports, the PMO sends them to the<br />
National Climatic Data Center (NCDC), where they are archived and used in the<br />
compilation of climatological and historical records. These records are available to the<br />
general public.<br />
NWSOH No. 1 1-5 May 2010
Chapter 2 — <strong>Ship</strong>s Synoptic Code and<br />
<strong>Observing</strong> Methods<br />
THE SHIPS SYNOPTIC CODE FM13-X<br />
Code FM-13-X-SHIP, the ships synoptic code, is comprised of 23 groups of symbolic<br />
letters representing meteorological and oceanographic elements, report identification<br />
and ship location data:<br />
BBXX D.....D YYGGi w 99L aL aL a Q cL oL oL oL o i Ri xhVV Nddff<br />
00fff 1s nTTT 2s nT dT dT d 4PPPP 5appp 7wwW 1W 2 8N hC LC MC H<br />
222D sv s 0s sT wT wT w 2P wP wH wH w 3d w1d w1d w2d w2 4P w1P w1H w1H w1<br />
5P w2P w2H w2H w2 6I sE sE sR s 8s wT bT bT b ICE c iS ib iD iz i (or plain language)<br />
THREE MAIN SECTIONS OF THE SHIPS’ SYNOPTIC CODE<br />
The code has three main sections — 0, 1, and 2. Section 0, consisting of the first 5<br />
code groups, contains the identification data (ship report identifier, ship’s call sign, date,<br />
time, location), and units of wind speed used.<br />
<strong>Ship</strong>s Synoptic Code Section 0<br />
BBXX D.....D YYGGi w 99L aL aL a Q cL oL oL oL o<br />
Section 0 is a mandatory section. Location, time, and date groups in section 0 must be<br />
included in the report. Any errors or missing data here will likely result in the report<br />
being discarded.<br />
Section 1 consists of code groups 6-14 and contains most of the meteorological data of<br />
the report (precipitation and weather data indicators, cloud base height, visibility, cloud<br />
cover, wind direction and speed, air and dew point temperatures, sea level pressure,<br />
tendency, and amount of change, present and past weather, and cloud type).<br />
<strong>Ship</strong>s Synoptic Code Section 1<br />
i Ri xhVV Nddff 00fff 1s nTTT 2s nT dT dT d<br />
4PPPP 5appp 7wwW 1W 2 8N hC LC MC H<br />
The first two groups of section 1 are also considered mandatory. Ranking of groups<br />
does not mean the other groups are less important. All 23 groups of the weather<br />
message are important and should normally be included in your report to completely<br />
describe conditions at your vessel. If you send a report with just the first seven groups,<br />
it will be accepted, but its usefulness to the meteorologist will be limited.<br />
NWSOH No. 1 2-1 May 2010
<strong>Ship</strong>s Synoptic Code and <strong>Observing</strong> Methods<br />
Section 2 consists of code groups 15-23 and contains ships movement data (ships<br />
course and speed), oceanographic data (sea surface temperature, sea period and height,<br />
primary and secondary swell direction, period, and height), and ice data (for any ice<br />
accreting on ship or on the sea surface), and the wet-bulb temperature group.<br />
<strong>Ship</strong>s Synoptic Code Section 2<br />
222Dsvs 0ssTwTwTw 2PwPwHwHw 3dw1dw1dw2dw2 4Pw1Pw1Hw1Hw1 5Pw2Pw2Hw2Hw2 6IsEsEsRs 8swTbTbTb ICE ciSibiDizi (or plain language)<br />
For all synoptic code sections, always include the maximum number of data groups<br />
consistent with observed conditions. Any elements not reported are<br />
normally coded with a slash (/). If an entire group of elements is not reported, skip the<br />
group completely (do not report a group as /////).<br />
When translating your observations into code, follow all specifications, coding<br />
instructions, and code tables very carefully. This will ensure that your coded message<br />
contains an accurate description of conditions observed at your vessel.<br />
NWSOH No. 1 2-2 May 2010
<strong>Ship</strong>s Synoptic Code and <strong>Observing</strong> Methods<br />
BBXX, <strong>Ship</strong> Report Indicator<br />
SECTION 0 — IDENTIFICATION DATA<br />
BBXX D . . . . D YYGGi w 99L aL aL a Q cL oL oL oL o<br />
SECTION 1 — METEOROLOGICAL DATA<br />
i Ri xhVV Nddff 00fff 1s nTTT 2s nT dT dT d<br />
4PPPP 5appp 7wwW 1W 2 8N hC LC MC H<br />
SECTION 2 — OCEANOGRAPHIC DATA<br />
222D sv s 0s sT wT wT w 2P wP wH wH w 3d w1d w1d w2d w2 4P w1P w1H w1H w1<br />
5P w2P w2H w2H w2 6I sE sE sR s 8s wT bT bT b ICE c iS ib iD iz i<br />
Definition: The symbolic letters BBXX identify a ship report from a sea station.<br />
How to Code: As BBXX, always included as the first group of the weather message.<br />
Remarks: All ship’s weather reports begin with the BBXX indicator. It immediately<br />
identifies the report as a ships weather report, distinguishing it from other radio<br />
messages.<br />
NWSOH No. 1 2-3 May 2010
<strong>Ship</strong>s Synoptic Code and <strong>Observing</strong> Methods<br />
D . . . . D, <strong>Ship</strong>’s Radio Call Sign<br />
SECTION 0 — IDENTIFICATION DATA<br />
BBXX D . . . . D YYGGi w 99L aL aL a Q cL oL oL oL o<br />
SECTION 1 — METEOROLOGICAL DATA<br />
i Ri xhVV Nddff 00fff 1s nTTT 2s nT dT dT d<br />
4PPPP 5appp 7wwW 1W 2 8N hC LC MC H<br />
SECTION 2 — OCEANOGRAPHIC DATA<br />
222D sv s 0s sT wT wT w 2P wP wH wH w 3d w1d w1d w2d w2 4P w1P w1H w1H w1<br />
5P w2P w2H w2H w2 6I sE sE sR s 8s wT bT bT b ICE c iS ib iD iz i<br />
Definition: <strong>Ship</strong>s call sign consisting of three or more alphanumeric characters.<br />
How to Code: Use your vessel’s actual radio call sign.<br />
Remarks: Credit for delivery of your weather report will not be made unless a call<br />
sign is provided.<br />
NWSOH No. 1 2-4 May 2010
YY, Day of the Month<br />
<strong>Ship</strong>s Synoptic Code and <strong>Observing</strong> Methods<br />
SECTION 0 — IDENTIFICATION DATA<br />
BBXX D . . . . D YYGGi w 99L aL aL a Q cL oL oL oL o<br />
SECTION 1 — METEOROLOGICAL DATA<br />
i Ri xhVV Nddff 00fff 1s nTTT 2s nT dT dT d<br />
4PPPP 5appp 7wwW 1W 2 8N hC LC MC H<br />
SECTION 2 — OCEANOGRAPHIC DATA<br />
222D sv s 0s sT wT wT w 2P wP wH wH w 3d w1d w1d w2d w2 4P w1P w1H w1H w1<br />
5P w2P w2H w2H w2 6I sE sE sR s 8s wT bT bT b ICE c iS ib iD iz i<br />
Definition: Day of the month (UTC) on which the actual observation falls.<br />
Units: Days.<br />
Method of Measurement: Determined according to Universal Time Coordinated<br />
(UTC), not by local date or time.<br />
How to Code: Always with two digits. 01 for the first day of the month, 02 for the<br />
second day, etc.<br />
Remarks: At 0000 UTC, record the day just beginning, not the day which has just<br />
ended. Forgetting to change the day at 0000 UTC is a common observer error.<br />
NWSOH No. 1 2-5 May 2010
<strong>Ship</strong>s Synoptic Code and <strong>Observing</strong> Methods<br />
GG, Actual Time of Observation to the<br />
Nearest Whole Hour<br />
SECTION 0 — IDENTIFICATION DATA<br />
BBXX D . . . . D YYGGi w 99L aL aL a Q cL oL oL oL o<br />
SECTION 1 — METEOROLOGICAL DATA<br />
i Ri xhVV Nddff 00fff 1s nTTT 2s nT dT dT d<br />
4PPPP 5appp 7wwW 1W 2 8N hC LC MC H<br />
SECTION 2 — OCEANOGRAPHIC DATA<br />
222D sv s 0s sT wT wT w 2P wP wH wH w 3d w1d w1d w2d w2 4P w1P w1H w1H w1<br />
5P w2P w2H w2H w2 6I sE sE sR s 8s wT bT bT b ICE c iS ib iD iz i<br />
Definition: The actual time of observation (UTC) rounded to the nearest whole<br />
hour UTC.<br />
Units: Hours.<br />
Method of Measurement: Determined according to Universal Time Coordinated<br />
(UTC), not by local date or time.<br />
How to Code: Always coded with two digits rounded to the nearest hour. 0550 UTC<br />
as 06, 1440 UTC as 15, 2350 UTC as 00 (not 24), etc. The range of values is 00 - 23<br />
Remarks: The actual time of observation is the time at which the barometer is read.<br />
Round off this time to the nearest hour. Take your barometer reading last, after all the<br />
other elements have been observed and coded.<br />
Note: Observations should be submitted no more than 29 minutes prior to, or 29<br />
minutes after the synoptic hour.<br />
12Z Observation Transmitted at 1129Z: Counted as 11Z observation.<br />
12Z Observation Transmitted between 1130Z and 1229Z: Counted as 12Z Observation.<br />
12Z Observation Transmitted at 1230Z: Counted as 13Z Observation.<br />
NWSOH No. 1 2-6 May 2010
<strong>Ship</strong>s Synoptic Code and <strong>Observing</strong> Methods<br />
i w, Wind Speed Indicator<br />
SECTION 0 — IDENTIFICATION DATA<br />
BBXX D . . . . D YYGGiw 99L aL aL a Q cL oL oL oL o<br />
SECTION 1 — METEOROLOGICAL DATA<br />
i Ri xhVV Nddff 00fff 1s nTTT 2s nT dT dT d<br />
4PPPP 5appp 7wwW 1W 2 8N hC LC MC H<br />
SECTION 2 — OCEANOGRAPHIC DATA<br />
222D sv s 0s sT wT wT w 2P wP wH wH w 3d w1d w1d w2d w2 4P w1P w1H w1H w1<br />
5P w2P w2H w2H w2 6I sE sE sR s 8s wT bT bT b ICE c iS ib iD iz i<br />
Definition: Indicator for source and units of wind speed. Source is how the<br />
measurement was made (either estimated or measured).<br />
Units: Knots.<br />
Method of Measurement: Wind speed is either estimated or measured with an<br />
anemometer.<br />
How to Code: U.S. VOS <strong>Program</strong> vessels report wind speed in knots. Use 3 when<br />
estimating wind speed in knots, or 4 when measuring wind speed with an anemometer<br />
in knots.<br />
Some vessels in foreign VOS programs report wind speed in meters per second. These<br />
vessels should use 0 when estimating wind speed in meters per second, or 1 when<br />
measuring wind speed with an anemometer in meters per second.<br />
Code flgs.<br />
0 Wind speed estimated in meters per second<br />
1 Wind speed obtained from anemometer in meters per second<br />
3 Wind speed estimated in knots<br />
4 Wind speed obtained from anemometer in knots<br />
Remarks: U.S. VOS program ships are requested to report wind speed in knots.<br />
Wind speed estimates are usually based on the state of the sea using the Beaufort scale.<br />
When the sea surface cannot be seen, such as on very dark nights, wind speed<br />
estimates can be based on how the wind effects shipboard objects, or on the feel of the<br />
wind (see ff , Code Section 1).<br />
NWSOH No. 1 2-7 May 2010
<strong>Ship</strong>s Synoptic Code and <strong>Observing</strong> Methods<br />
L aL aL a, Latitude in Tenths of a Degree<br />
99, Data on Position Follow<br />
SECTION 0 — IDENTIFICATION DATA<br />
BBXX D . . . . D YYGGi w 99LaLaLa Q cL oL oL oL o<br />
SECTION 1 — METEOROLOGICAL DATA<br />
i Ri xhVV Nddff 00fff 1s nTTT 2s nT dT dT d<br />
4PPPP 5appp 7wwW 1W 2 8N hC LC MC H<br />
SECTION 2 — OCEANOGRAPHIC DATA<br />
222D sv s 0s sT wT wT w 2P wP wH wH w 3d w1d w1d w2d w2 4P w1P w1H w1H w1<br />
5P w2P w2H w2H w2 6I sE sE sR s 8s wT bT bT b ICE c iS ib iD iz i<br />
Definition: <strong>Ship</strong>’s latitude, in degrees and tenths of a degree, measured in terms of<br />
degrees north or south of the equator.<br />
Units: Degrees and tenths of a degree.<br />
Method of Measurement: Determine latitude using standard shipboard methods.<br />
Tenths is obtained by dividing the number of minutes by 6, and<br />
disregarding the remainder. Ignore seconds.<br />
How to Code: Always coded with three digits, the first two digits are actual degrees,<br />
the last digit for tenths of a degree. Code 46˚ 41’ as 466 (46˚ is coded as is, 41’ divided<br />
by 6 is 6 5/6, 5/6 is disregarded); 33˚ 04’ as 330 (33˚ is coded as is, 04’ divided by 6 is<br />
4/6 which is disregarded and coded as 0 in this case); 23˚ 00’ as 230;<br />
Conversion of Minutes to Tenths of a Degree<br />
Minutes Degree<br />
00’-05’ .0<br />
06’-11’ .1<br />
12’-17’ .2<br />
18’-23’ .3<br />
24’-29’ .4<br />
30’-35’ .5<br />
36’-41’ .6<br />
42’-47’ .7<br />
48’-54’ .8<br />
54’-59’ .9<br />
Remarks: Latitude can vary from 0˚ (coded 000) to 90˚ (coded 900). Quadrant of<br />
the globe (Q c) is used to specify whether the latitude is north or south.<br />
NWSOH No. 1 2-8 May 2010
<strong>Ship</strong>s Synoptic Code and <strong>Observing</strong> Methods<br />
Q c, Quadrant of the Globe<br />
SECTION 0 — IDENTIFICATION DATA<br />
BBXX D . . . . D YYGGi w 99L aL aL a QcL oL oL oL o<br />
SECTION 1 — METEOROLOGICAL DATA<br />
i Ri xhVV Nddff 00fff 1s nTTT 2s nT dT dT d<br />
4PPPP 5appp 7wwW 1W 2 8N hC LC MC H<br />
SECTION 2 — OCEANOGRAPHIC DATA<br />
222D sv s 0s sT wT wT w 2P wP wH wH w 3d w1d w1d w2d w2 4P w1P w1H w1H w1<br />
5P w2P w2H w2H w2 6I sE sE sR s 8s wT bT bT b ICE c iS ib iD iz i<br />
Definition: Quadrant of the globe. Varies according to your position with respect to<br />
the equator (0˚ latitude) and the Greenwich Meridian (0˚ longitude).<br />
Units:<br />
Method of Measurement: Use standard shipboard methods to determine latitude<br />
and longitude. Then determine quadrant as defined below.<br />
How to Code: If you are north of the equator (north latitude), Q c is coded as 1<br />
when east of the Greenwich Meridian (east longitude), or as 7 when west of the<br />
Greenwich meridian; If you are south of the equator (south latitude), Q c is coded as 3<br />
when east of the Greenwich meridian, or as 5 when west of the Greenwich meridian.<br />
The figure for Q c shows whether the latitude is north or south, and the longitude east or<br />
west. Select the appropriate figure from this table.<br />
West Longitude East Longitude<br />
North Latitude 7 1<br />
South Latitude 5 3<br />
For positions on the equator, and on the Greenwich or 180th meridian, either of the two<br />
appropriate figures may be used.<br />
Remarks: Since Q c is needed to fully describe both latitude and longitude, it is very<br />
important to code it correctly. Be very careful to code Q c properly near quadrant<br />
boundaries, especially when your vessel crosses from one quadrant to another.<br />
NWSOH No. 1 2-9 May 2010
L oL oL oL o, Longitude<br />
<strong>Ship</strong>s Synoptic Code and <strong>Observing</strong> Methods<br />
SECTION 0 — IDENTIFICATION DATA<br />
BBXX D . . . . D YYGGi w 99L aL aL a Q cLoLoLoLo<br />
SECTION 1 — METEOROLOGICAL DATA<br />
i Ri xhVV Nddff 00fff 1s nTTT 2s nT dT dT d<br />
4PPPP 5appp 7wwW 1W 2 8N hC LC MC H<br />
SECTION 2 — OCEANOGRAPHIC DATA<br />
222D sv s 0s sT wT wT w 2P wP wH wH w 3d w1d w1d w2d w2 4P w1P w1H w1H w1<br />
5P w2P w2H w2H w2 6I sE sE sR s 8s wT bT bT b ICE c iS ib iD iz i<br />
Definition: Longitude in degrees and tenths of a degree. Measured in degrees east or<br />
west of the Greenwich Meridian. Values reverse at the international dateline.<br />
Units: Degrees and tenths of a degree.<br />
Method of Measurement: Use standard shipboard methods. Tenths are obtained<br />
by dividing the number of minutes by 6, and disregarding the<br />
remainder. Ignore seconds.<br />
How to Code: Always coded with four digits, with the leading (hundreds)<br />
figure coded as 0 or 1. The first three digits are actual degrees, the last digit for tenths<br />
of a degree. Code 142˚ 55’ as 1429 (142˚ is coded as is, 55’ divided by<br />
6 is 9, the remainder is ignored); code 60˚ 31’ as 0605 (60˚ is coded as 060,<br />
31 divided by 6 is 5, the remainder is ignored); code 9˚ 40” as 0096 (9° is coded as 009,<br />
40” is coded as 6); code 0˚ 16’ as 0002 (0° is coded as 000, 16” is coded as 2).<br />
Conversion of Minutes to Tenths of a Degree<br />
Minutes Degree<br />
00’-05’ .0<br />
06’-11’ .1<br />
12’-17’ .2<br />
18’-23’ .3<br />
24’-29’ .4<br />
30’-35’ .5<br />
36’-41’ .6<br />
42’-47’ .7<br />
48’-54’ .8<br />
54’-59’ .9<br />
Remarks: Longitude can vary from 0˚ (coded 0000 on the Greenwich Meridian) to<br />
180˚ (coded 1800 on the dateline). Quadrant of the globe (Q c)<br />
is used to specify whether the longitude is east or west.<br />
NWSOH No. 1 2-10 May 2010
<strong>Ship</strong>s Synoptic Code and <strong>Observing</strong> Methods<br />
i R, Precipitation Data Indicator<br />
SECTION 0 — IDENTIFICATION DATA<br />
BBXX D . . . . D YYGGi w 99L aL aL a Q cL oL oL oL o<br />
SECTION 1 — METEOROLOGICAL DATA<br />
iRi xhVV Nddff 00fff 1s nTTT 2s nT dT dT d<br />
4PPPP 5appp 7wwW 1W 2 8N hC LC MC H<br />
SECTION 2 — OCEANOGRAPHIC DATA<br />
222D sv s 0s sT wT wT w 2P wP wH wH w 3d w1d w1d w2d w2 4P w1P w1H w1H w1<br />
5P w2P w2H w2H w2 6I sE sE sR s 8s wT bT bT b ICE c iS ib iD iz i<br />
Definition: Indicator For Inclusion or Omission of Precipitation Data.<br />
Units:<br />
Method of Measurement:<br />
How to Code: Always coded as 4 for U.S. VOS program ships. This indicates that<br />
the precipitation group is omitted.<br />
Remarks: Precipitation measurements from moving ships are of questionable value.<br />
U.S. VOS program ships do not report precipitation amount.<br />
NWSOH No. 1 2-11 May 2010
<strong>Ship</strong>s Synoptic Code and <strong>Observing</strong> Methods<br />
i X, Weather Data Indicator<br />
SECTION 0 — IDENTIFICATION DATA<br />
BBXX D . . . . D YYGGi w 99L aL aL a Q cL oL oL oL o<br />
SECTION 1 — METEOROLOGICAL DATA<br />
i RixhVV Nddff 00fff 1s nTTT 2s nT dT dT d<br />
4PPPP 5appp 7wwW 1W 2 8N hC LC MC H<br />
SECTION 2 — OCEANOGRAPHIC DATA<br />
222D sv s 0s sT wT wT w 2P wP wH wH w 3d w1d w1d w2d w2 4P w1P w1H w1H w1<br />
5P w2P w2H w2H w2 6I sE sE sR s 8s wT bT bT b ICE c iS ib iD iz i<br />
Definition: i x is the indicator for present and past weather data group 7 wwW 1W 2.<br />
Tells whether the group is included or omitted from the weather message.<br />
Units:<br />
Method of Measurement:<br />
How to Code: Code as 1 when group 7 wwW 1W 2 is included in the weather message.<br />
Code as 3 if group 7 wwW 1W 2 is to be omitted (if present or past weather has not been<br />
observed).<br />
When weather group 7wwW 1W 2 is: Code i X as:<br />
included 1<br />
omitted (no observation, or data not available) 3<br />
Remarks: i x is usually coded as 1, because present and past weather are important<br />
information, and are normally included in the weather message. When there is no<br />
significant weather to report, you should report the kind of no significant weather<br />
there is, such as cloud development not observable (ww = 00), or cloud cover 1/2 or<br />
less throughout period (W 1 = 0). i x is coded as 3 only when present and past weather<br />
have not been observed at all (in this case group 7 wwW 1W 2 is omitted (skipped over)<br />
from the weather message. Incidentally, never transmit a slashed out group as /////;<br />
when no data is available for an entire group, it is excluded from the weather message.<br />
NWSOH No. 1 2-12 May 2010
h, Cloud Height<br />
<strong>Ship</strong>s Synoptic Code and <strong>Observing</strong> Methods<br />
SECTION 0 — IDENTIFICATION DATA<br />
BBXX D . . . . D YYGGi w 99L aL aL a Q cL oL oL oL o<br />
SECTION 1 — METEOROLOGICAL DATA<br />
i Ri xhVV Nddff 00fff 1s nTTT 2s nT dT dT d<br />
4PPPP 5appp 7wwW 1W 2 8N hC LC MC H<br />
SECTION 2 — OCEANOGRAPHIC DATA<br />
222D sv s 0s sT wT wT w 2P wP wH wH w 3d w1d w1d w2d w2 4P w1P w1H w1H w1<br />
5P w2P w2H w2H w2 6I sE sE sR s 8s wT bT bT b ICE c iS ib iD iz i<br />
Definition: Height above sea surface of the base of the lowest cloud seen.<br />
Units: Feet or meters.<br />
Method of Measurement: Visual estimate. First determine the type of the lowest<br />
cloud seen, and then refer to it’s normal height range. As a rule of thumb, for a given<br />
cloud type, heights are higher in the tropics and during the summer months.<br />
Approximate Cloud Heights<br />
Range Polar Regions Temperate Regions Tropical Regions<br />
High 3,000 to 7,600 meters<br />
(10,000 to 25,000 feet)<br />
Middle 2,000 to 4,000 meters<br />
(6,500 to 13,000 feet)<br />
Low Surface to 2,000 meters<br />
(Surface to 6,500 feet)<br />
5,000 to 13,700 meters<br />
(16,5000 to 45,000 feet)<br />
2,000 to 7,000 meters<br />
(6,500 to 23,000 feet)<br />
Surface to 2,000 meters<br />
(Surface to 6,500 feet)<br />
6,100 to 18,300 meters<br />
(20,000 to 60,000 feet)<br />
2,000 to 7,600 meters<br />
(6,500 to 25,000 feet)<br />
Surface to 2,000 meters<br />
(Surface to 6,500 feet)<br />
How to Code: Code as 0 - 7 for Cumulus, Stratus, Stratocumulus, Cumulonimbus,<br />
or Nimbostratus clouds (these clouds have bases up to 6500 feet).<br />
Code as 8 or 9 for Altostratus, Altocumulus, and Nimbostratus (these clouds have bases<br />
above 6500 feet). Code as 9 for Cirrus, Cirrostratus, and Cirrocumulus (these clouds<br />
have bases above 8200 feet). Also code as 9 when no clouds are present. Code as /<br />
when the sky is obscured by fog or snow, or when reporting at night and cloud base<br />
height cannot be determined. Code in accordance with the table on the following<br />
page.<br />
NWSOH No. 1 2-13 May 2010
<strong>Ship</strong>s Synoptic Code and <strong>Observing</strong> Methods<br />
Code for Cloud Height, h<br />
Code flgs. Height in meters Height in feet<br />
0 0 to 50 160 or less<br />
1 50 to 100 160 to 330<br />
2 100 to 200 330 to 660<br />
3 200 to 300 660 to 1000<br />
4 300 to 600 1000 to 2000<br />
5 600 to 1000 2000 to 3300<br />
6 1000 to 1500 3300 to 5000<br />
7 1500 to 2000 5000 to 6600<br />
8 2000 to 2500 6600 to 8200<br />
9 2500 or more, or no clouds 8300 or more, no clouds<br />
/ Height of base of cloud not known,such as when obscured by fog or snow<br />
Use higher code figure for heights at dividing line.<br />
Remarks: Nimbostratus usually has its base under 6500 feet, but may be higher.<br />
Discuss your height estimate with the PMO when he comes aboard ship. Weather<br />
stations on land use reflected pulses of light to measure cloud base height. You can<br />
sometimes check your estimate against a known height, such as when a cloud base<br />
intercepts a mountainous coast.<br />
For cumulus and cumulonimbus clouds only, the probable height of the base<br />
of these clouds can be determined from the difference between the dry bulb<br />
temperature and the dew point temperature (in Celsius degrees). Multiply the<br />
difference by 123 to obtain height in meters, or by 405 to obtain height in<br />
feet. Example: Dry bulb = 20°C, dew point = 10°C, the height of cumulus is<br />
(20 – 10) × 123 = 1230 meters. This rule is not valid for other cloud types, and does<br />
not apply for ragged or fracto cumulus.<br />
NWSOH No. 1 2-14 May 2010
VV, Visibility<br />
<strong>Ship</strong>s Synoptic Code and <strong>Observing</strong> Methods<br />
SECTION 0 — IDENTIFICATION DATA<br />
BBXX D . . . . D YYGGi w 99L aL aL a Q cL oL oL oL o<br />
SECTION 1 — METEOROLOGICAL DATA<br />
i Ri xhVV Nddff 00fff 1s nTTT 2s nT dT dT d<br />
4PPPP 5appp 7wwW 1W 2 8N hC LC MC H<br />
SECTION 2 — OCEANOGRAPHIC DATA<br />
222D sv s 0s sT wT wT w 2P wP wH wH w 3d w1d w1d w2d w2 4P w1P w1H w1H w1<br />
5P w2P w2H w2H w2 6I sE sE sR s 8s wT bT bT b ICE c iS ib iD iz i<br />
Definition: Visibility is the greatest distance an object can be seen and identified.<br />
Units: feet, nautical miles, meters.<br />
Method of Measurement: Usually a visual estimate. Report prevailing<br />
visibility — the maximum visibility common to one half or more of the horizon circle.<br />
When visibility is uniform in all directions, prevailing visibility and visibility are the same.<br />
When visibility is not uniform in all directions, determine prevailing visibility by dividing<br />
the horizon circle into sectors of visibility. Estimate the highest visibility common to one<br />
half or more of the horizon circle. See the following illustrations. On long ships, when<br />
the visibility is low as in dense fog, use objects of known distances onboard. <strong>Ship</strong>s<br />
radar can also be used to determine distances to objects or other ships. The horizon is<br />
a useful visibility marker. When the horizon appears sharp and clear, your height<br />
aboard ship can be used to indicate the distance to the horizon (see the distance to the<br />
horizon at sea table on the next page).<br />
How to Code: First determine prevailing visibility. Then code in accordance with<br />
the table on the following page.<br />
Remarks: On ships longer than 656 feet (200 meters), code figures 90 and 91 can be<br />
determined using the known distances to shipboard objects. On ships longer than 164<br />
feet (50 meters), code figure 90 can be determined using shipboard objects. For the<br />
higher code figures, the observer judges visibility based on the appearance of nearby<br />
ships, the horizon, or the atmosphere in general.<br />
NWSOH No. 1 2-15 May 2010
<strong>Ship</strong>s Synoptic Code and <strong>Observing</strong> Methods<br />
Code for Visibility, VV<br />
Code Visibility Visibility Code<br />
flgs. in m/km in yd./naut. mi. figs.<br />
90 less than 50 m less than 55 yd. 90<br />
91 50 but less than 200 m 55 but less than 220 yd. 91<br />
92 200 but less than 500 m 220 but less than 550 yd. 92<br />
93 500 but less than 1000 m 550 but less than 1 ⁄2 n. mi. 93<br />
94 1 but less than 2 km 1 ⁄2 but less than 1 n. mi. 94<br />
95 2 but less than 4 km 1 but less than 2 n. mi. 95<br />
96 4 but less than 10 km 2 but less than 5 n. mi. 96<br />
97 10 but less than 20 km 5 but less than 11 n. mi. 97<br />
98 20 but less than 50 km 11 but less than 27 n. mi. 98<br />
99 50 km or more 27 n. mi. or more 99<br />
The visibility ranges corresponding to various weather types are as follows:<br />
} {<br />
90 90<br />
91<br />
92<br />
Heavy snow, heavy drizzle<br />
Fog, thick haze<br />
91<br />
92<br />
93 Moderate snow, moderate drizzle 93<br />
94 94<br />
Heavy rain<br />
95 Mist, haze 95<br />
} }<br />
{<br />
96 Moderate rain 96<br />
Light snow, light drizzle<br />
97 97<br />
98 Light rain 98<br />
} 99 99<br />
Distance to the Horizon at Sea<br />
Height of eye above the Sea Surface Horizon Distance<br />
Meters Feet Kilometers Nautical Miles<br />
5 1.52 4.8 2.6<br />
10 3.05 6.9 3.7<br />
15 4.57 8.3 4.5<br />
20 6.10 9.6 5.2<br />
25 7.62 10.9 5.9<br />
30 9.14 11.9 6.4<br />
35 10.67 12.8 6.9<br />
40 12.19 13.7 7.4<br />
45 13.72 14.5 7.8<br />
50 15.24 15.4 8.3<br />
55 16.76 16.1 8.7<br />
60 18.29 16.4 9.1<br />
65 19.81 17.4 9.4<br />
70 21.34 18.2 9.8<br />
75 22.86 18.7 10.1<br />
80 24.38 19.5 10.5<br />
85 25.91 20.0 10.8<br />
90 27.43 20.6 11.1<br />
95 28.96 21.1 11.4<br />
100 30.48 21.7 11.7<br />
105 32.00 22.2 12.0<br />
110 33.53 22.8 12.3<br />
115 35.05 23.1 12.5<br />
120 36.58 23.7 12.8<br />
Distance to the horizon when viewed from various heights. When out of sight of land<br />
and other ships, the horizon is an important visibility marker .<br />
NWSOH No. 1 2-16 May 2010
<strong>Ship</strong>s Synoptic Code and <strong>Observing</strong> Methods<br />
Determining Prevailing Visibility<br />
(Prevailing visibility indicated by asteriks and shading)<br />
Prevailing visibility is the maximum visibility common to one half (180°) or more of the<br />
horizon circle.<br />
NWSOH No. 1 2-17 May 2010
N, Total Cloud Cover<br />
<strong>Ship</strong>s Synoptic Code and <strong>Observing</strong> Methods<br />
SECTION 0 — IDENTIFICATION DATA<br />
BBXX D . . . . D YYGGi w 99L aL aL a Q cL oL oL oL o<br />
SECTION 1 — METEOROLOGICAL DATA<br />
i Ri xhVV Nddff 00fff 1s nTTT 2s nT dT dT d<br />
4PPPP 5appp 7wwW 1W 2 8N hC LC MC H<br />
SECTION 2 — OCEANOGRAPHIC DATA<br />
222D sv s 0s sT wT wT w 2P wP wH wH w 3d w1d w1d w2d w2 4P w1P w1H w1H w1<br />
5P w2P w2H w2H w2 6I sE sE sR s 8s wT bT bT b ICE c iS ib iD iz i<br />
Definition: The total fraction of the sky covered by clouds of all types.<br />
Units: Eighths of the sky.<br />
Method of Measurement: Visually estimate how many eighths of the sky are<br />
covered by cloud, regardless of type. It is sometimes easier to estimate how much of<br />
the sky without clouds can be seen, i.e. if two eighths of the sky is clear, then 6 eighths<br />
is covered by cloud.<br />
How to Code: See table below.<br />
Code for Total Cloud Cover, N<br />
Code flgs. Fraction of sky covered<br />
0 Cloudless<br />
1 1 eighth or less, but not zero<br />
2 2 eighths<br />
3 3 eighths<br />
4 4 eighths<br />
5 5 eighths<br />
6 6 eighths<br />
7 7 eighths or more but not totally covered<br />
8 8 eighths, sky completely covered by clouds<br />
9 Sky obscured by fog, snow, or other meteorological<br />
phenomena<br />
/ Cloud cover indescernible for reasons other than<br />
Code fig. 9, or observation is not made<br />
Remarks: A mackeral sky (Altocumulus, stratocumulus, or cirrocumulus covering the<br />
whole sky) should be coded as N = 7, since breaks are always present in these cloud<br />
forms. When observing clouds through fog, base your estimate for N on the amount of<br />
clouds that can be seen through the fog. When a completely clear sky is observed<br />
through fog or haze, report N as 0.<br />
NWSOH No. 1 2-18 May 2010
dd, Wind Direction<br />
<strong>Ship</strong>s Synoptic Code and <strong>Observing</strong> Methods<br />
SECTION 0 — IDENTIFICATION DATA<br />
BBXX D . . . . D YYGGi w 99L aL aL a Q cL oL oL oL o<br />
SECTION 1 — METEOROLOGICAL DATA<br />
i Ri xhVV Nddff 00fff 1s nTTT 2s nT dT dT d<br />
4PPPP 5appp 7wwW 1W 2 8N hC LC MC H<br />
SECTION 2 — OCEANOGRAPHIC DATA<br />
222D sv s 0s sT wT wT w 2P wP wH wH w 3d w1d w1d w2d w2 4P w1P w1H w1H w1<br />
5P w2P w2H w2H w2 6I sE sE sR s 8s wT bT bT b ICE c iS ib iD iz i<br />
Definition: True direction, in tens of degrees, from which wind is blowing. This is a<br />
mean direction averaged over a period of ten minutes.<br />
Units: Degrees, referred to true north (0˚T).<br />
Method of Measurement: Determine true wind direction from either (1) the<br />
orientation of sea (wind) waves, or streaks of foam on the sea surface, or (2) the<br />
apparent wind direction observed aboard ship.<br />
Method (1) is easiest, because it provides true wind direction independent of the ships<br />
movement. Sight along the lines of the sea wave crests. Since true wind direction is the<br />
same as the direction from which the sea waves are coming, dd is perpendicular (90˚)<br />
to the advancing waves crests. Also, use lines of foam on the sea surface (which may<br />
appear for Force 7 or greater wind speeds). Wind blown foam streaks are parallel to the<br />
direction of the true wind.<br />
Method (2) determines true wind direction from the apparent wind (the wind<br />
experienced on board when the ship is underway). Apparent wind results from two<br />
motions — the actual motion of the air (true wind), and the motion of the ship.<br />
Apparent wind direction is best determined by facing directly into the wind on the<br />
windward side of the ship. Other good apparent wind indicators are funnel smoke, the<br />
orientation of shipboard flags or pennants, or a wind vane. Once apparent wind<br />
direction is obtained, you must remove the motion of the ship to obtain true wind. See<br />
ff for methods of determining true wind from apparent wind.<br />
How to Code: Coded on a scale from 00 to 36 (and 99 for variable), expressed in<br />
tens of degrees. Code true north as 36, east as 09, south as 18, west as 27. See the<br />
table on the following page.<br />
Code for Wind Direction, dd<br />
NWSOH No. 1 2-19 May 2010
<strong>Ship</strong>s Synoptic Code and <strong>Observing</strong> Methods<br />
Code figure Code flgure<br />
00 Calm<br />
01 5°-14° 21 205°-214°<br />
02 15°-24° 22 215°-224°<br />
03 25°-34° 23 225°-234°<br />
04 35°-44° 24 235°-244°<br />
05 45°-54° 25 245°-254°<br />
06 55°-64° 26 255°-264°<br />
07 65°-74° 27 265°-274°<br />
08 75°-84° 28 275°-284°<br />
09 85°-94° 29 285°-294°<br />
10 95°-104° 30 295°-304°<br />
11 105°-114° 31 305°-314°<br />
12 115°-124° 32 315°-324°<br />
13 125°-134° 33 325°-334°<br />
14 135°-144° 34 335°-344°<br />
15 145°-154° 35 345°-354°<br />
16 155°-164° 36 355°-004° 17 165°-174° 99 Variable, or all<br />
18 175°-184° directions.<br />
19 185°-194°<br />
20 195°-204°<br />
Remarks: Report the mean wind direction over the ten minute period immediately<br />
preceding observation time. If this time period includes an abrupt change in wind<br />
direction, only average data obtained after the change. If using apparent or relative<br />
wind direction, remember to determine true wind before reporting.<br />
NWSOH No. 1 2-20 May 2010
<strong>Ship</strong>s Synoptic Code and <strong>Observing</strong> Methods<br />
<strong>Ship</strong>board True Wind Plotting Board<br />
1. Set ship’s true course under pointer<br />
(120°).<br />
2. Mark a small dot down from the center<br />
at a distance equal to the ship’s<br />
speed (12 knots). Label this dot<br />
“T.”<br />
W<br />
T<br />
NOTE: Apparent wind direction must be related to a true direction. This is done by<br />
adding the apparent wind direction relative to the ship’ s bow to the ship’s true course<br />
(for apparent wind direction use 0° for wind coming directly from the bow , increasing<br />
clockwise to 359° 1° off the port bow). If the sum is greater than 360, subtract 360 from<br />
it.<br />
NWSOH No. 1 2-21 May 2010<br />
T<br />
T<br />
W
ff, Wind Speed<br />
<strong>Ship</strong>s Synoptic Code and <strong>Observing</strong> Methods<br />
SECTION 0 — IDENTIFICATION DATA<br />
BBXX D . . . . D YYGGi w 99L aL aL a Q cL oL oL oL o<br />
SECTION 1 — METEOROLOGICAL DATA<br />
i Ri xhVV Nddff 00fff 1s nTTT 2s nT dT dT d<br />
4PPPP 5appp 7wwW 1W 2 8N hC LC MC H<br />
SECTION 2 — OCEANOGRAPHIC DATA<br />
222D sv s 0s sT wT wT w 2P wP wH wH w 3d w1d w1d w2d w2 4P w1P w1H w1H w1<br />
5P w2P w2H w2H w2 6I sE sE sR s 8s wT bT bT b ICE c iS ib iD iz i<br />
Definition: True wind speed, measured or estimated as indicated by i w, of 98 knots or<br />
less.<br />
Units: Knots (U.S. VOS program ships).<br />
Method of Measurement: Use either (1) the appearance of the sea surface (the<br />
sea state) and the Beaufort scale, (2) an anemometer, or (3) the effects of the wind on<br />
people or objects aboard ship. Method (1) relies on the action of the wind to create sea<br />
waves, and results in a true wind estimate, so there is no need to factor out the motion<br />
of the ship. Refer to the sea state photographs and descriptions as a guide. These<br />
assume steady state conditions which implies the wind direction and speed have been<br />
relatively steady over many hours.<br />
If using method (2), make sure your anemometer is properly calibrated, and located so<br />
the ships superstructure will not interfere with air motion. An anemometer provides an<br />
apparent wind measurement. Apparent wind is the wind you experience aboard a<br />
moving ship, and is a combination of the actual air motion across the water (true wind<br />
you report as ff), and the ship’s motion. The only time there is no apparent wind aboard<br />
ship is when the vessel is moving in the same direction and with the same speed as the<br />
true wind. To remove the ship’s motion and determine true wind, you must use either a<br />
true wind plotting board, or the graphical method, both illustrated on the following<br />
pages.<br />
Method (3) also provides an apparent wind, so like method (2), requires removal of the<br />
ship’s motion to determine true wind. Use method (3) when the sea surface cannot be<br />
seen (such as on very dark nights), and when an anemometer is not available. Refer to the<br />
table for apparent wind speed indicators.<br />
How to Code: Code in actual knots. See the table on the next page. For wind of 99<br />
knots or greater, code as 99 and report wind speed using group 00fff.<br />
Remarks: When estimating wind speed using the state of the sea and Beaufort scale,<br />
continues on page 2-24<br />
NWSOH No. 1 2-22 May 2010
Code Figs.<br />
(Knots)<br />
Mean Beau-<br />
Speed fort Description<br />
<strong>Ship</strong>s Synoptic Code and <strong>Observing</strong> Methods<br />
Code for Wind Speed, ff<br />
Sea criterion when<br />
sea fully developed<br />
Probable ht. of<br />
waves in m (ft)<br />
Average Maximum<br />
00 - 00 00 0 Calm Sea like a mirror ....................... - -<br />
01 - 03 02 1 Light Air Ripples with the appearance of<br />
scales are formed, but without<br />
foam crests .......................... 0.1 ( 1 ⁄4) 0.1 ( 1 ⁄4)<br />
04 - 06 05 2 Light breeze Small wavelets, still short but<br />
more pronounced, crests have<br />
a glassy appearance and do not<br />
break ......................................... 0.2 ( 1 ⁄2) 0.3 (1)<br />
07 - 10 09 3 Gentle breeze Large wavelets, crests begin to<br />
break; foam of glassy<br />
appearance; perhaps scattered<br />
white horses .............................. 0.6 (2) 1 (3)<br />
11 - 16 13 4 Modt. breeze Small waves, becoming longer;<br />
fairly frequent white horses ....... 1 (3 1 ⁄2) 1.5 (5)<br />
17 - 21 19 5 Fresh breeze Moderate waves, taking a more<br />
pronounced long form; many<br />
white horses are formed<br />
(chance of some spray) ............ 2 (6) 2.5 (8 1 ⁄2)<br />
22 - 27 24 6 Strong breeze Large waves begin to form;<br />
white foam crests are more<br />
extensive everywhere<br />
(probably some spray) .............. 3 (9 1 ⁄2) 4 (12)<br />
28 - 33 30 7 Near gale Sea heaps up and white foam<br />
from breaking waves begins to<br />
be blown in streaks along the<br />
direction of the wind .................. 4 (13 1 ⁄2) 5.5 (19)<br />
34 - 40 37 8 Gale Moderately high waves of<br />
greater length; edges of crests<br />
begin to break into the spindrift;<br />
the foam is blown in wellmarked<br />
streaks along the<br />
direction of the wind .................. 5.5 (18) 7.5 (25)<br />
41 - 47 44 9 Strong gale High waves; dense streaks of<br />
foam along the direction of the<br />
wind; crests of waves begin to<br />
topple, tumble and roll over;<br />
spray may affect visibility .......... 7 (23) 10 (32)<br />
48 - 55 52 10 Storm Very high waves with long<br />
overhanging crests; the<br />
resulting<br />
foam, in great patches, is blown<br />
in dense white streaks along<br />
the direction of the wind; on the<br />
whole, the surface of the sea<br />
takes a white appearance;<br />
tumbling of the sea becomes<br />
heavy and shock-like; visibility<br />
affected ........................................<br />
56 - 63 60 11 Violent Storm Exceptionally high waves (small<br />
and medium-sized ships might<br />
be for a time lost to view behind<br />
the waves); the sea is<br />
completely covered with long<br />
white patches of foam lying<br />
along the direction of the wind;<br />
everywhere the edges of the<br />
wave crests are blown into froth;<br />
visibility affected<br />
64 and over – 12 Hurricane The air is filled with foam and<br />
spray; sea completely white with<br />
driving spray; visibility very<br />
seriously affected ........................<br />
9 (29) 12.5 (41)<br />
11.5 (37) 16 (52)<br />
14 (45) -<br />
Note: For wind of 99 knots or greater , use 99 for ff, and report wind speed in group 00f ff; e.g. for a wind from<br />
100° true at 125 knots, dd = 10, f f = 99, and fff = 125.<br />
NWSOH No. 1 2-23 May 2010
Apparent<br />
Speed (Knots) Indication<br />
<strong>Ship</strong>s Synoptic Code and <strong>Observing</strong> Methods<br />
Effect of Apparent Wind on <strong>Ship</strong>s<br />
Less than 1 Calm, smoke rises vertically.<br />
continued from 2-22<br />
1 - 3 Smoke drifts from funnel.<br />
4 - 6 Wind felt on face. Smoke rises at about 80°.<br />
7 - 10 Wind extends light flag and pennants. Smoke rises at about 70°.<br />
11 - 16 Wind raises dust and loose paper on deck. Smoke rises at<br />
about 50˚. No noticeable sound in the rigging. Slack halyards<br />
curve and sway. Heavy flag flaps limply.<br />
17 - 21 Wind felt strongly on face. Smoke rises at 30˚. Slack halyards<br />
whip while bending continuously to leeward. Taut halyards<br />
maintain slightly bent position. Low whistle in the rigging. Heavy<br />
flag doesn’t fully extend but flaps over entire length.<br />
22 - 27 Wind stings face in temperature below 2˚C. Slight ef fort in<br />
maintaining balance against the wind. Smoke rises at 15˚. Both<br />
slack and taut halyards whip slightly in bent position. Low<br />
moaning, rather than whistle, in the rigging. Heavy flag extends<br />
and flaps more vigorously.<br />
28 - 33 Necessary to lean slightly into the wind to maintain balance.<br />
Smoke rises at 5˚ to 10˚. Higher pitched moaning and whistling<br />
heard from rigging. Halyards still whip slightly. Heavy flag<br />
extends fully and flaps only at the end. Oilskins and loose<br />
clothing inflate and pull against the body.<br />
34 - 40 Head pushed back by the force of the wind if allowed to relax.<br />
Oilskins and loose clothing inflate and pull strongly. Halyards<br />
rigidly bent. Loud whistle from rigging. Heavy flag straight out<br />
and whipping.<br />
remember that heavy rain and floating ice have a dampening effect on the sea surface,<br />
so under these conditions, wind speed may be greater than the sea state indicates.<br />
There will always be a lag period between the wind speed increasing or decreasing and<br />
the sea wave height rising or falling, especially<br />
during a sudden change in wind speed. Wind blowing against a tide or strong current<br />
causes a greater than normal sea wave height, while wind blowing with the tide or<br />
current causes a smaller than normal sea wave height. When any<br />
of these conditions exist, an adjustment may be needed to your wind speed<br />
estimate.<br />
NWSOH No. 1 2-24 May 2010
270°<br />
Wind is blowing<br />
from this direction<br />
toward the ship<br />
<strong>Ship</strong>s Synoptic Code and <strong>Observing</strong> Methods<br />
Graphic Method for Determining the True Wind<br />
NORTH<br />
0°<br />
Direction from which true wind is blowing<br />
261°<br />
T Direction from which<br />
the apparent wind is<br />
blowing related to the<br />
R<br />
90° course T of the ship<br />
180°<br />
12 Knots<br />
22 Knots<br />
ots<br />
230°<br />
15 Kn<br />
<strong>Ship</strong>’s Course 120° (True)<br />
<strong>Ship</strong>’s speed 12 knots<br />
W<br />
120° <strong>Ship</strong>’s Course T<br />
Apparent wind direction<br />
relative to the bow 110° R<br />
Apparent wind direction<br />
relative to ship’s course 120° + 110° = 230°<br />
Apparent wind speed 15 knots<br />
1. Select a center position. Place a dot and label it “T”.<br />
2. With a vertical line through point T designated as the 0° line, draw a line for the<br />
ship’s course at 120°.<br />
3. Select a scale and draw an arc across the course line at 12 scale units (12 knots)<br />
representing the ship’s speed as shown in Figure 2.3. Mark the intersection with<br />
a dot and label it “R”. The ship’s course and speed are represented by the vector<br />
TR.<br />
4. From point R, draw a line for the apparent wind direction (from 230°) and, using<br />
the same scale, the apparent wind speed (15 knots); label this point “W”. The<br />
vector RW is the relative wind.<br />
5. Complete the triangle by drawing the line TW for the true wind as shown in the<br />
figure above. The direction is from the same direction as the label reads, TW for<br />
True Wind, from the “T”. True wind is from 261° (true), 22 knots, which is coded<br />
N2622.<br />
NWSOH No. 1 2-25 May 2010
<strong>Ship</strong>s Synoptic Code and <strong>Observing</strong> Methods<br />
BEAUFORT SCALE<br />
Beaufort Descriptive<br />
Number Term Knots Specification<br />
0 Calm 0 Sea like a mirror.<br />
Beaufort Descriptive<br />
Number Term Knots Specification<br />
1 Light Air 1-3 Ripples with the appearance of scales are formed, without foam<br />
crests.<br />
NWSOH No. 1 2-26 May 2010
<strong>Ship</strong>s Synoptic Code and <strong>Observing</strong> Methods<br />
Beaufort Descriptive<br />
Number Term Knots Specification<br />
2 Light breeze 4-6 Small wavelets, still short, but more pronounced; crests have a<br />
glassy appearance but do not break.<br />
Beaufort Descriptive<br />
Number Term Knots Specification<br />
3 Gentle 7-10 Large wavelets; crests begin to break; foam of glassy<br />
appearance; perhaps scattered white horses (white caps).<br />
NWSOH No. 1 2-27 May 2010
<strong>Ship</strong>s Synoptic Code and <strong>Observing</strong> Methods<br />
Beaufort Descriptive<br />
Number Term Knots Specification<br />
4 Moderate 11-16 Small waves, becoming longer; fairly frequent white horses.<br />
Beaufort Descriptive<br />
Number Term Knots Specification<br />
5 Fresh 17-21 Moderate waves, taking a more pronounced long form; many<br />
white horses are formed (chance of some spray).<br />
NWSOH No. 1 2-28 May 2010
<strong>Ship</strong>s Synoptic Code and <strong>Observing</strong> Methods<br />
Beaufort Descriptive<br />
Number Term Knots Specification<br />
6 Strong 22-27 Large waves begin to form; the white foam crests are more<br />
extensive everywhere (probably some spray).<br />
Beaufort Descriptive<br />
Number Term Knots Specification<br />
7 Near gale 28-33 Sea heaps up and white foam from breaking waves begins to<br />
be blown in streaks along the direction of the wind.<br />
NWSOH No. 1 2-29 May 2010
<strong>Ship</strong>s Synoptic Code and <strong>Observing</strong> Methods<br />
Beaufort Descriptive<br />
Number Term Knots Specification<br />
8 Gale 34-40 Moderately high waves of greater length; edges of crests begin<br />
to break into the spindrift; the foam is blown in well-marked<br />
streaks along the direction of the wind.<br />
Beaufort<br />
Number<br />
9<br />
Descriptive<br />
Term<br />
Strong gale<br />
Knots<br />
41-47<br />
Specification<br />
High waves; dense streaks of foam along the direction of the<br />
wind; crests of waves begin to topple, tumble, and roll over;<br />
spray may affect visibility.<br />
NWSOH No. 1 2-30 May 2010
<strong>Ship</strong>s Synoptic Code and <strong>Observing</strong> Methods<br />
Beaufort Descriptive<br />
Number Term Knots Specification<br />
10 Storm 48-55 Very high waves with long overhanging crests; the resulting<br />
foam, in great patches, is blown in dense white streaks along<br />
the direction of the wind; on the whole, the sea surface takes a<br />
white appearance; the tumbling of the sea becomes heavy and<br />
shock-like; visibility affected.<br />
Beaufort<br />
Number<br />
Descriptive<br />
Term Knots Specification<br />
11 Violent 56-63 Exceptionally high waves (small and medium-sized ships might<br />
be lost to view for a time behind the waves); the sea is<br />
completely covered with long white patches of foam lying along<br />
the direction of the wind; everywhere the edges of the wave<br />
crests are blown into froth; visibility affected.<br />
NWSOH No. 1 2-31 May 2010
<strong>Ship</strong>s Synoptic Code and <strong>Observing</strong> Methods<br />
Beaufort Descriptive<br />
Number Term Knots Specification<br />
12 Hurricane 64 and The air is filled with foam and spray; sea completely<br />
over white with driving spray; visibility very seriously affected.<br />
In enclosed waters, or when near land, with an off-shore wind, wave heights will be<br />
smaller and the waves steeper.<br />
WHEN USING THE BEAUFORT SCALE, THE VELOCITY EQUIVALENT IS<br />
AT A STANDARD HEIGHT OF 10 METERS ABOVE THE WATER SURFACE.<br />
NWSOH No. 1 2-32 May 2010
<strong>Ship</strong>s Synoptic Code and <strong>Observing</strong> Methods<br />
fff, High Speed Wind<br />
00, High Speed Wind Group Indicator<br />
SECTION 0 — IDENTIFICATION DATA<br />
BBXX D . . . . D YYGGi w 99L aL aL a Q cL oL oL oL o<br />
SECTION 1 — METEOROLOGICAL DATA<br />
i Ri xhVV Nddff 00fff 1s nTTT 2s nT dT dT d<br />
4PPPP 5appp 7wwW 1W 2 8N hC LC MC H<br />
SECTION 2 — OCEANOGRAPHIC DATA<br />
222D sv s 0s sT wT wT w 2P wP wH wH w 3d w1d w1d w2d w2 4P w1P w1H w1H w1<br />
5P w2P w2H w2H w2 6I sE sE sR s 8s wT bT bT b ICE c iS ib iD iz i<br />
Definition: High Wind Speed, measured or estimated as indicated by i w, of 99 knots<br />
or more.<br />
Units: Knots (For U.S. VOS program ships).<br />
Method of Measurement: Use the Beaufort scale, or determine apparent wind<br />
either with an anemometer or by noting effects of the wind on shipboard objects.<br />
Same as for ff, page 2-21.<br />
How to Code: In actual knots. 99 knots is coded as 099, 110 knots is coded as 110.<br />
Whenever fff is used to report a very high speed wind, ff in group Nddff is coded as<br />
99.<br />
Remarks: For wind of 98 knots or less, ff is used to report wind speed and group<br />
00fff is omitted from the weather message.<br />
NWSOH No. 1 2-33 May 2010
<strong>Ship</strong>s Synoptic Code and <strong>Observing</strong> Methods<br />
s n, Sign of Air Temperature<br />
1, Air Temperature Data Indicator<br />
SECTION 0 — IDENTIFICATION DATA<br />
BBXX D . . . . D YYGGi w 99L aL aL a Q cL oL oL oL o<br />
SECTION 1 — METEOROLOGICAL DATA<br />
i Ri xhVV Nddff 00fff 1snTTT 2s nT dT dT d<br />
4PPPP 5appp 7wwW 1W 2 8N hC LC MC H<br />
SECTION 2 — OCEANOGRAPHIC DATA<br />
222D sv s 0s sT wT wT w 2P wP wH wH w 3d w1d w1d w2d w2 4P w1P w1H w1H w1<br />
5P w2P w2H w2H w2 6I sE sE sR s 8s wT bT bT b ICE c iS ib iD iz i<br />
Definition: s n is the arithmetic sign of the air temperature.<br />
Units: Celsius degrees.<br />
Method of Measurement: Thermometer or psychrometer.<br />
How to Code:<br />
Code flgs.<br />
Code for Sign of Air Temperature, s n<br />
0 Temperature is positive or zero<br />
1 Temperature is negative<br />
Remarks: See remarks under TTT.<br />
NWSOH No. 1 2-34 May 2010
<strong>Ship</strong>s Synoptic Code and <strong>Observing</strong> Methods<br />
TTT, Air Temperature (Dry-bulb)<br />
SECTION 0 — IDENTIFICATION DATA<br />
BBXX D . . . . D YYGGi w 99L aL aL a Q cL oL oL oL o<br />
SECTION 1 — METEOROLOGICAL DATA<br />
i Ri xhVV Nddff 00fff 1s nTTT 2s nT dT dT d<br />
4PPPP 5appp 7wwW 1W 2 8N hC LC MC H<br />
SECTION 2 — OCEANOGRAPHIC DATA<br />
222D sv s 0s sT wT wT w 2P wP wH wH w 3d w1d w1d w2d w2 4P w1P w1H w1H w1<br />
5P w2P w2H w2H w2 6I sE sE sR s 8s wT bT bT b ICE c iS ib iD iz i<br />
Definition: Air temperature, in whole degrees and tenths of a degree Celsius, its sign<br />
being given by S n. It is a measure of the heat content of the air.<br />
Units: Celsius degrees.<br />
Method of Measurement: Thermometer or psychrometer. When reading the<br />
thermometer, the eye must be at the same level as the end of the mercury column.<br />
Take the reading from the windward side of the ship in a stream of air fresh from the<br />
sea, which has not been in contact with, or passed over the ship. The thermometer<br />
should be shielded from radiation, precipitation, and spray.<br />
How to Code: In actual Celsius degrees (to tenths of a degree).<br />
Examples: 12.1°C: TTT=121 and S n=0<br />
4.2°C: TTT=042 and S n=0<br />
0.8°C: TTT=008 and S n=0<br />
–0.8°C: TTT=008 and S n=1<br />
–6.2°C: TTT=062 and S n=1<br />
Remarks: If a fixed location louvered screen psychrometer is used, one must be<br />
installed on each side of the ship, so the observation can always be made from the<br />
windward side. If using a sling psychrometer stored inside, allow<br />
sufficient time for the thermometer to adjust to the outside temperature.<br />
NWSOH No. 1 2-35 May 2010
<strong>Ship</strong>s Synoptic Code and <strong>Observing</strong> Methods<br />
s n, Sign of Dew Point Temperature<br />
2, Dew Point Temperature Indicator<br />
SECTION 0 — IDENTIFICATION DATA<br />
BBXX D . . . . D YYGGi w 99L aL aL a Q cL oL oL oL o<br />
SECTION 1 — METEOROLOGICAL DATA<br />
i Ri xhVV Nddff 00fff 1s nTTT 2snT dT dT d<br />
4PPPP 5appp 7wwW 1W 2 8N hC LC MC H<br />
SECTION 2 — OCEANOGRAPHIC DATA<br />
222D sv s 0s sT wT wT w 2P wP wH wH w 3d w1d w1d w2d w2 4P w1P w1H w1H w1<br />
5P w2P w2H w2H w2 6I sE sE sR s 8s wT bT bT b ICE c iS ib iD iz i<br />
Definition: s n is the sign of the dew point temperature.<br />
Units: Celsius degrees.<br />
Method of Measurement: Psychrometer.<br />
How to Code:<br />
Code flgs.<br />
Code for Sign of Dew Point Temperature, s n<br />
0 Temperature is positive or zero<br />
1 Temperature is negative<br />
Remarks: See remarks under TTT.<br />
NWSOH No. 1 2-36 May 2010
<strong>Ship</strong>s Synoptic Code and <strong>Observing</strong> Methods<br />
T dT dT d, Dew Point Temperature<br />
SECTION 0 — IDENTIFICATION DATA<br />
BBXX D . . . . D YYGGi w 99L aL aL a Q cL oL oL oL o<br />
SECTION 1 — METEOROLOGICAL DATA<br />
i Ri xhVV Nddff 00fff 1s nTTT 2s nTdTdTd<br />
4PPPP 5appp 7wwW 1W 2 8N hC LC MC H<br />
SECTION 2 — OCEANOGRAPHIC DATA<br />
222D sv s 0s sT wT wT w 2P wP wH wH w 3d w1d w1d w2d w2 4P w1P w1H w1H w1<br />
5P w2P w2H w2H w2 6I sE sE sR s 8s wT bT bT b ICE c iS ib iD iz i<br />
Definition: Dew Point Temperature, in degrees and tenths of a degree Celsius, its sign<br />
being given by s n. This is the temperature at which condensation will occur, causing dew<br />
or frost to form. It corresponds to a relative humidity of 100%.<br />
Units: Celsius degrees.<br />
Method of Measurement: Computed from the wet and dry bulb temperatures.<br />
Using the psychrometer, determine the dry and wet bulb temperatures. There are<br />
several ways of computing dewpoint based on these values. The AMVER/SEAS and<br />
TurboWin software will automatically compute dewpoint by entering dry and wet bulb<br />
values.. If you do not use either of these applications to encode your ships weather<br />
observations, a table for computing dewpoint is available from any PMO.<br />
How to Code: In actual degrees Celsius, to the nearest tenth.<br />
Examples: 9.6°C: T dT dT d=096 and s n=0<br />
–9.2°C: T dT dT d=092 and s n=1<br />
–15.4°C: T dT dT d=154 and s n=1<br />
Remarks: The wet bulb thermometer must be read as soon as possible after<br />
ventilation or whirling has stopped.<br />
To operate the sling psychrometer: Moisten the wet bulb muslin sleeve<br />
thoroughly, on all sides, with distilled water, or the purest water available (ordinary<br />
water contains dissolved substances which deposit on the wicking as it evaporates,<br />
causing the wet bulb to read high). Change the wicking weekly, or more often if it<br />
becomes dirty or contaminated by salt spray.<br />
From the windward side of the ship, whirl the psychrometer at a rate of about 4<br />
revolutions per second for about 1 minute. Read the thermometers immediately, then<br />
whirl for another 10 seconds, and read again. If the readings are unchanged, record<br />
these as your official temperatures. If the readings are different at the second reading,<br />
continue the whirling and reading until two successive sets of readings are the same.<br />
NWSOH No. 1 2-37 May 2010
<strong>Ship</strong>s Synoptic Code and <strong>Observing</strong> Methods<br />
For temperatures below 0°C, the dew point calculation table assumes the muslin wicking<br />
is covered with a thin coating of ice. After moistening the muslin with ice cold water, you<br />
should initiate the freezing of the water by touching the muslin with a piece of ice, snow,<br />
or other cold object. This may need to be done up to a half hour before observation<br />
time, to allow enough time for the ice coating to form. Do not allow the coating of ice on<br />
the wet bulb to become too thick—this will result in an incorrect reading. If ice is<br />
building up, immerse the wet bulb in a small container of warm water to reduce the ice.<br />
NWSOH No. 1 2-38 May 2010
<strong>Ship</strong>s Synoptic Code and <strong>Observing</strong> Methods<br />
PPPP, Sea Level Pressure<br />
4, Sea Level Pressure Data Indicator<br />
SECTION 0 — IDENTIFICATION DATA<br />
BBXX D . . . . D YYGGi w 99L aL aL a Q cL oL oL oL o<br />
SECTION 1 — METEOROLOGICAL DATA<br />
i Ri xhVV Nddff 00fff 1s nTTT 2s nT dT dT d<br />
4PPPP 5appp 7wwW 1W 2 8N hC LC MC H<br />
SECTION 2 — OCEANOGRAPHIC DATA<br />
222D sv s 0s sT wT wT w 2P wP wH wH w 3d w1d w1d w2d w2 4P w1P w1H w1H w1<br />
5P w2P w2H w2H w2 6I sE sE sR s 8s wT bT bT b ICE c iS ib iD iz i<br />
Definition: PPPP is the atmospheric pressure at mean sea level, in tenths of a<br />
hectopascal (millibar), omitting the thousands digit. It represents the weight or force<br />
exerted by the air above a given point.<br />
Units: Hectopascals ((hp) which are numerically the same as millibars).<br />
Method of Measurement: Usually measured with a precision aneroid barometer,<br />
although a mercury barometer can also be used. Gently tap the face of the aneroid<br />
barometer just before measurement. To obtain an accurate reading, your eye should be<br />
level with the barometer face. The mercury in the tube of the mercury barometer will<br />
oscillate up and down. Average the high and low points of the oscillation before<br />
recording.<br />
How to Code: Report the reading in actual hectopascals, omitting the decimal point.<br />
When the sea level pressure is 1000 hp or greater, the leading 1 is omitted.<br />
Examples: 992.4 hp: PPPP = 9924<br />
1000.0 hp: PPPP = 0000<br />
1002.8 hp: PPPP = 0028<br />
1032.1 hp: PPPP = 0321<br />
Remarks: Great precision is required for the pressure measurement, and a PMO<br />
should calibrate your barometer once every three months. The PMO will attach a<br />
correction tab with a correction to sea level to be made before reporting. The<br />
barometer should be installed in a position where it is least likely to be affected by<br />
vibration, concussion, or movement of the ship (generally as close to the center of<br />
flotation as possible. The barograph should be installed with the pen arm installed<br />
athwart ship (parallel to beam), to minimize the risk of its swinging off the chart.<br />
NWSOH No. 1 2-39 May 2010
<strong>Ship</strong>s Synoptic Code and <strong>Observing</strong> Methods<br />
Correcting Station Pressure to Sea Level Pressure (hp)<br />
Height of Barometer Outside Air Temperature (°C)<br />
m ft. –20 –10 0 10 20 30<br />
1.5 5 0.2 0.2 0.2 0.2 0.2 0.2<br />
3.0 10 0.4 0.4 0.4 0.4 0.4 0.3<br />
4.6 15 0.6 0.6 0.6 0.6 0.5 0.5<br />
6.1 20 0.8 0.8 0.8 0.7 0.7 0.7<br />
7.8 25 1.0 1.0 1.0 0.9 0.9 0.9<br />
9.1 30 1.2 1.2 1.2 1.1 1.1 1.0<br />
10.7 35 1.5 1.4 1.4 1.3 1.3 1.2<br />
12.2 40 1.7 1.6 1.5 1.5 1.4 1.4<br />
13.7 45 1.9 1.8 1.7 1.7 1.6 1.6<br />
15.2 50 2.1 2.0 1.9 1.9 1.8 1.7<br />
16.8 55 2.3 2.2 2.1 2.0 2.0 1.9<br />
18.3 60 2.5 2.4 2.3 2.2 2.2 2.1<br />
19.8 65 2.7 2.6 2.5 2.4 2.3 2.3<br />
21.3 70 2.9 2.8 2.7 2.6 2.5 2.4<br />
22.9 75 3.1 2.9 2.8 2.7 2.6 2.5<br />
24.4 80 3.3 3.2 3.1 3.0 2.9 2.8<br />
25.9 85 3.5 3.4 3.3 3.2 3.1 3.0<br />
27.4 90 3.8 3.6 3.5 3.4 3.2 3.1<br />
29.0 95 4.0 3.8 3.7 3.5 3.4 3.3<br />
30.5 100 4.2 4.0 3.9 3.7 3.6 3.5<br />
32.0 105 4.4 4.2 4.1 3.9 3.8 3.7<br />
33.5 110 4.6 4.4 4.2 4.1 4.0 3.8<br />
35.1 115 4.8 4.6 4.4 4.3 4.1 4.0<br />
36.6 120 5.0 4.8 4.6 4.5 4.3 4.2<br />
38.2 125 5.2 5.0 4.8 4.7 4.5 4.3<br />
Station pressure is the actual pressure at the level of the barometer.<br />
This table should only be used if your barometer has not been adjusted to read sea<br />
level pressure, or if a PMO has not attached a correction sticker. This is normally the<br />
case for vessels of British Commonwealth countries only.<br />
Barometers aboard NWS VOS program ships are adjusted to read sea level pressure.<br />
Any correction to be applied will be indicated on the correction sticker and this table<br />
should be ignored.<br />
For Great Lakes vessels: Barometers are adjusted to read sea level pressure using the<br />
elevation of Lake Erie in the correction factor. From other Great Lakes, to obtain sea<br />
level pressure you must know the difference in elevation between Lake Erie and the<br />
lake you are on, and add or subtract a correction.<br />
From Lake Huron or Lake Michigan (both 10 feet above Lake Erie), please add .4 hp<br />
(see table above) to your pressure reading before reporting. For Lake Superior (30 feet<br />
above Lake Erie), add 1.1 hp. For Lake Ontario (325 feet below Lake Erie), subtract 12<br />
hp.<br />
NWSOH No. 1 2-40 May 2010
<strong>Ship</strong>s Synoptic Code and <strong>Observing</strong> Methods<br />
a, Three Hour Characteristic of Pressure<br />
Tendency<br />
5, Three Hour Pressure Tendency Data Indicator<br />
SECTION 0 — IDENTIFICATION DATA<br />
BBXX D . . . . D YYGGi w 99L aL aL a Q cL oL oL oL o<br />
SECTION 1 — METEOROLOGICAL DATA<br />
i Ri xhVV Nddff 00fff 1s nTTT 2s nT dT dT d<br />
4PPPP 5appp 7wwW 1W 2 8N hC LC MC H<br />
SECTION 2 — OCEANOGRAPHIC DATA<br />
222D sv s 0s sT wT wT w 2P wP wH wH w 3d w1d w1d w2d w2 4P w1P w1H w1H w1<br />
5P w2P w2H w2H w2 6I sE sE sR s 8s wT bT bT b ICE c iS ib iD iz i<br />
Definition: (a) is the characteristic of pressure tendency during the three hours<br />
preceding the time of observation. It describes how pressure has varied, e.g. increasing<br />
then decreasing, decreasing then increasing, decreasing then steady, etc.<br />
Units: Hectopascals.<br />
Method of Measurement: The barograph provides the best indication of the<br />
pressure tendency characteristic. Study the barograph trace in the three hour period<br />
preceding the time of observation. The shape of the trace determines which code<br />
figure to use.<br />
How to Code: Code according to the table on the next page.<br />
Remarks: The actual pressure change during the three hours preceding the time of<br />
observation is recorded by ppp.<br />
1. Remember that:<br />
(a) If the pressure is higher than three hours ago, there are four choices for a; 0, 1,<br />
2, and 3.<br />
(b) If the pressure is lower than three hours ago, there are also four choices for a;<br />
5, 6, 7, and 8.<br />
(c) If the pressure is exactly the same as it was three hours ago, there are three<br />
choices for a; 0, 4, and 5.<br />
2. If the trace contains minor irregularities but in general resembles one of the<br />
pictures in the code Table, disregard the minor irregularities and code the general<br />
characteristics of the trace.<br />
Examples: = 8 =3<br />
3. When the trace can apparently be represented by two characteristics, code the<br />
NWSOH No. 1 2-41 May 2010
<strong>Ship</strong>s Synoptic Code and <strong>Observing</strong> Methods<br />
characteristics which describes the last part of the trace provided this agrees with the<br />
three-hour pressure change.<br />
Examples: = 1 = 0<br />
= 3 (not 5 as the pressure is now<br />
higher than 3 hours ago).<br />
4. When the trace may apparently be represented by two characteristics and<br />
the characteristics of the last part of the trace does not agree with the 3-hour pressure<br />
change, choose the characteristics which is most descriptive of the whole 3-hour trace<br />
and which also agrees with the net 3-hour pressure change.<br />
Examples:<br />
= 5 (not 1 as the pressure is<br />
lower than 3 hours ago).<br />
= 0 (not 8 as the pressure is<br />
higher than 3 hours ago).<br />
= 0 (not 6 as the pressure is<br />
higher than 3 hours ago).<br />
5. When the trace is not steady but the 3-hour pressure change is zero, use code figure<br />
0 or 5 as appropriate for the last part of the trace (code figure 4 is only used when the<br />
trace is absolutely steady).<br />
Examples: = 5 = 0<br />
NWSOH No. 1 2-42 May 2010
<strong>Ship</strong>s Synoptic Code and <strong>Observing</strong> Methods<br />
Determining Barometric Tendency Characteristic, a<br />
NWSOH No. 1 2-43 May 2010
<strong>Ship</strong>s Synoptic Code and <strong>Observing</strong> Methods<br />
ppp, Amount of Pressure Tendency<br />
SECTION 0 — IDENTIFICATION DATA<br />
BBXX D . . . . D YYGGi w 99L aL aL a Q cL oL oL oL o<br />
SECTION 1 — METEOROLOGICAL DATA<br />
i Ri xhVV Nddff 00fff 1s nTTT 2s nT dT dT d<br />
4PPPP 5appp 7wwW 1W 2 8N hC LC MC H<br />
SECTION 2 — OCEANOGRAPHIC DATA<br />
222D sv s 0s sT wT wT w 2P wP wH wH w 3d w1d w1d w2d w2 4P w1P w1H w1H w1<br />
5P w2P w2H w2H w2 6I sE sE sR s 8s wT bT bT b ICE c iS ib iD iz i<br />
Definition: Amount of pressure tendency during the three hours preceding the time<br />
of observation, expressed in tenths of a hectopascal (millibar). This is the net pressure<br />
change during the three hour period.<br />
Units: Hectopascals.<br />
Method of Measurement: Either use the barograph trace, or read your barometer<br />
at the beginning and end of the three hour interval. Determine the difference in<br />
pressure and code according to the instructions below.<br />
How to Code: In actual hectopascals.<br />
Examples: 0.0 hp, ppp = 000<br />
0.4 hp, ppp = 004<br />
4.7 hp, ppp = 047<br />
10.2 hp, ppp = 102<br />
Remarks: If the pressure at time of observation is 1015.3 hp, and the pressure three<br />
hours earlier was 1012.9 hp, the net pressure change (amount of pressure tendency)<br />
was 2.4 hp. Code ppp as 024.<br />
NWSOH No. 1 2-44 May 2010
<strong>Ship</strong>s Synoptic Code and <strong>Observing</strong> Methods<br />
ww, Present Weather<br />
7, Present and Past Weather Data Group Indicator<br />
SECTION 0 — IDENTIFICATION DATA<br />
BBXX D . . . . D YYGGi w 99L aL aL a Q cL oL oL oL o<br />
SECTION 1 — METEOROLOGICAL DATA<br />
i Ri xhVV Nddff 00fff 1s nTTT 2s nT dT dT d<br />
4PPPP 5appp 7wwW 1W 2 8N hC LC MC H<br />
SECTION 2 — OCEANOGRAPHIC DATA<br />
222D sv s 0s sT wT wT w 2P wP wH wH w 3d w1d w1d w2d w2 4P w1P w1H w1H w1<br />
5P w2P w2H w2H w2 6I sE sE sR s 8s wT bT bT b ICE c iS ib iD iz i<br />
Definition: ww is the present weather and refers to atmospheric phenomena<br />
occurring at the time of observation, or which has occurred during the hour preceding<br />
the time of observation.<br />
Units:<br />
Method of Measurement: Visually or audibly determined. Phenomena to report<br />
include precipitation, obstructions to visibility, thunder, squalls, haze, dust, smoke, and<br />
cloud development.<br />
How to Code: Report the most severe weather condition that you observe, reading<br />
down the list from 99 (most severe) to 00 (least severe). Code in<br />
accordance with the table on the following pages. The higher coded values<br />
have priority over the lower coded values. Exception: code figure 17 has precedence<br />
over code figures 20 to 49.<br />
Remarks: There are one hundred different types of present weather to report. At sea<br />
however, phenomena such as duststorms, sandstorms, drifting or blowing snow, and<br />
dust whirls are rarely observed. Hence, about eighty-five different types of present<br />
weather are applicable to marine shipboard observations.<br />
NWSOH No. 1 2-45 May 2010
<strong>Ship</strong>s Synoptic Code and <strong>Observing</strong> Methods<br />
Codes for Present Weather, ww<br />
The weather code is arranged in priority order . Reading down the list, select the first<br />
applicable (most severe) weather condition that you observe and enter the code number for<br />
ww.<br />
59-99 PRECIPITATION AT SHIP AT TIME OF OBSERVATION<br />
95-99 THUNDERSTORM AT TIME OF OBSERVATION<br />
99 Heavy thunderstorm with hail*<br />
98 Thunderstorm with duststorm or sandstorm<br />
97 Heavy thunderstorm with rain and/or snow, but no hail*<br />
96 Slight or moderate thunderstorm with hail*<br />
95 Slight or moderate thunderstorm with rain and/or snow , but no hail*<br />
* Includes hail, ice pellets or snow pellets<br />
94-91 THUNDERSTORM DURING THE PAST HOUR BUT NOT AT<br />
THE TIME OF OBSERVATION<br />
Note: Use code 29 if there is no precip. at time of observation.<br />
94 Moderate or heavy snow, or rain and Thunderstorm<br />
snow mixed, or hail*<br />
in past hour<br />
93 Slight snow, or rain and snow mixed, or hail*<br />
92 Moderate or heavy rain<br />
91 Slight rain<br />
* Includes hail, ice pellets or snow pellets<br />
85-90 SOLID PRECIPITATION IN SHOWERS<br />
Slight Moderate or heavy<br />
89 Shower of hail*, no thunder 90<br />
87 Shower of snow pellets or ice pellets† 88<br />
85 Shower of snow 86<br />
†With or without rain, or rain and snow mixed<br />
*Includes hail, ice pellets or snow pellets<br />
80-84 RAIN SHOWERS<br />
84 Shower of rain and snow mixed, moderate or heavy<br />
83 Shower of rain and snow mixed, slight<br />
82 Violent rain shower<br />
81 Moderate or heavy rain shower<br />
80 Slight rain shower<br />
NWSOH No. 1 2-46 May 2010
<strong>Ship</strong>s Synoptic Code and <strong>Observing</strong> Methods<br />
70-79 SOLID PRECIPITATION NOT FALLING AS SHOWERS<br />
79 Ice pellets<br />
78 Isolated star-like snow crystals (with or without fog)<br />
77 Snow grains (with or without fog)<br />
76 Diamond dust (with or without fog)<br />
Intermittent Continuous<br />
74 Heavy snow in flakes 75<br />
72 Moderate snow in flakes 73<br />
70 Slight snow in flakes 71<br />
60-69 RAIN (NOT FALLING AS SHOWERS)<br />
Slight Moderate or heavy<br />
68 Rain or drizzle with snow 69<br />
66 Freezing rain 67<br />
Intermittent Continuous<br />
64 Heavy rain 65<br />
62 Moderate rain 63<br />
60 Slight rain 61<br />
50-59 DRIZZLE<br />
Slight Moderate or heavy<br />
58 Drizzle and rain mixed 59<br />
56 Freezing drizzle 57<br />
Intermittent Continuous<br />
54 Heavy drizzle 55<br />
52 Moderate drizzle 53<br />
50 Slight drizzle 51<br />
00-49 NO PRECIPITATION AT SHIP AT TIME OF OBSERVATION<br />
NWSOH No. 1 2-47 May 2010
<strong>Ship</strong>s Synoptic Code and <strong>Observing</strong> Methods<br />
40-49 FOG AT THE TIME OF OBSERVATION<br />
(Visibility in fog is less than 1 ⁄2 naut. mi.)<br />
Sky visible Sky invisible<br />
48 Fog, depositing rime 49<br />
46 Fog, has begun or thickened in past hour 47<br />
44 Fog, no change in past hour 45<br />
42 Fog, has become thinner in past hour 43<br />
41 Fog in patches*<br />
40 Fog at a distance but not at ship in past hour*<br />
*Visibility may be greater than 1 ⁄2 naut. mi.<br />
30-39 (Not likely to be used in ship reports)<br />
Slight or moderate Heavy<br />
38 Blowing snow, high (above eye level) 39<br />
36 Drifting snow, low (below eye level 37<br />
32 Duststorm or sandstorm, increasing 35<br />
31 Duststorm or sandstorm, unchanging 34<br />
30 Duststorm or sandstorm, decreasing 33<br />
20-29 PHENOMENA IN PAST HOUR BUT NOT AT TIME OF OBS.<br />
29 Thunderstorm, with or without precipitation<br />
28 Fog (in past hour but not at time of obs.)<br />
27 Shower(s) of hail*, or of hail* and rain mixed<br />
26 Shower(s) of snow, or of rain and snow mixed<br />
25 Shower(s) of rain<br />
24 Freezing drizzle or freezing rain<br />
23 Rain and snow mixed, or ice pellets<br />
22 Snow<br />
21 Rain (not freezing)<br />
20 Drizzle (not freezing) or snow grains<br />
*Includes hail, ice pellets or snow pellets.<br />
18-19 SQUALLS, FUNNEL CLOUDS<br />
19 Funnel cloud(s) seen in past hour or at time of observation<br />
18 Squalls (no. precip.) in past hour or at time of observation<br />
17 Thunder at time of observation, no precipitation at ship*<br />
*Code figure 17 has precedence over code figures 20-49.<br />
NWSOH No. 1 2-48 May 2010
<strong>Ship</strong>s Synoptic Code and <strong>Observing</strong> Methods<br />
13-16 PHENOMENA WITHIN SIGHT BUT NOT AT SHIP<br />
16 Precip. within 3 naut. mi. — reaching surface<br />
15 Precip. beyond 3 naut. mi. — reaching surface<br />
14 Precipitation in sight, not reaching surface<br />
13 Lightning visible, no thunder heard<br />
10-12 MIST AND SHALLOW FOG<br />
12 Shallow fog - more or less continuous<br />
11 Shallow fog in patches<br />
10 Mist (Visibility 1 ⁄2 Nautical mi. or more)<br />
04-09 HAZE, DUST, SAND OR SMOKE<br />
09 Duststorm or sandstorm within sight<br />
08 Dust whirls in past hour (NOT FOR MARINE USE)<br />
07 Blowing spray at the ship<br />
06 Widespread dust suspended in the air<br />
05 Dry haze<br />
04 Visibility reduced by smoke<br />
Code figs.<br />
00-03 CHANGE OF SKY DURING PAST HOUR<br />
03 Clouds generally forming or developing<br />
02 State of the sky on the whole unchanged<br />
01 Clouds dissolving or becoming less developed<br />
00 Cloud development not observable<br />
Definitions for Present Weather<br />
SScchheedduulleedd TTiimmee ooff OObbsseerrvvaattiioonn is the time at which the observation should be<br />
completed and ready for transmission. These times are the four main synoptic hours of<br />
0000, 0600, 1200, and 1800 UTC, or the intermediate synoptic hours of 0300, 0900,<br />
1500, and 2100 UTC.<br />
AAtt tthhee TTiimmee ooff OObbsseerrvvaattiioonn means at the scheduled time of observation, or in the case<br />
of code figures 20 through 29, during the 60 minutes prior to the scheduled time. If it is<br />
necessary to make an observation an hour earlier than the scheduled time (say at 1 100<br />
instead of 1200), then “at the time of observation” means 1 100.<br />
NOTE: For the purpose of reporting a thunderstorm, “at the time of observation” includes<br />
the 15 minutes prior to the scheduled time of observation.<br />
DDuurriinngg tthhee PPaasstt HHoouurr means during the period starting 60 minutes before the scheduled<br />
time of observation.<br />
NOTE: For purposes of reporting a thunderstorm, code figure 29, the “past hour” is from<br />
1 hour and 15 minutes ago to 15 minutes ago.<br />
NWSOH No. 1 2-49 May 2010
<strong>Ship</strong>s Synoptic Code and <strong>Observing</strong> Methods<br />
WWiitthhiinn SSiigghhtt oorr AAtt AA DDiissttaannccee means that although precipitation, etc., is not occurring<br />
at the ship, it can be seen from the ship or platform.<br />
PPrreecciippiittaattiioonn<br />
RRaaiinn.. Precipitation of liquid water particles, either in the form of drops larger than 0.5 mm<br />
(0.02 inch) or smaller drops which, in contrast to drizzle, are widely separated.<br />
FFrreeeezziinngg RRaaiinn.. Rain which freezes upon impact with the ground or a ship.<br />
DDrriizzzzllee.. Fairly uniform precipitation composed exclusively of fine drops (diameter less<br />
than 0.5 mm or 0.02 inch) very close together. Drizzle appears to float while following air<br />
currents, although unlike fog droplets, it falls to the ground. Drizzle drops are too small to<br />
appreciably disturb still water puddles.<br />
FFrreeeezziinngg DDrriizzzzllee.. Drizzle which freezes upon impact with the ground or a ship.<br />
SSnnooww.. Precipitation of ice crystals, mostly branched in the form of six-pointed stars. At<br />
temperatures higher than about - 5˚C (23˚F), the crystals are generally clustered to form<br />
snowflakes.<br />
SSnnooww PPeelllleettss.. Precipitation of white, opaque grains of ice. The grains are round or<br />
sometimes conical. Diameters range from about 2 to 5 mm (0.08 to 0.2 inch). Snow pellets<br />
are brittle and easily crushed; when they fall on hard surfaces, they bounce and often break<br />
up.<br />
SSnnooww GGrraaiinnss.. Precipitation of very small, white, opaque grains of ice similar in structure<br />
to snow crystals. When the grains hit a hard surface, they do not bounce or shatter. They<br />
usually fall in small quantities, mostly from stratus, and never as showers.<br />
IIccee PPeelllleettss.. Precipitation of transparent or translucent pellets of ice, which are round or<br />
irregular, rarely conical, and which have a diameter of 5 mm (0.2 inch), or less. The<br />
pellets usually rebound when striking hard surfaces and make a sound on impact. There<br />
are two main types:<br />
a. Hard grains of ice consisting of frozen raindrops, or largely melted and refrozen<br />
snowflakes (formerly sleet). This type falls as continuous or intermittent precipitation.<br />
b. Pellets of snow encased in a thin layer of ice which has formed from the freezing,<br />
either of droplets intercepted by the pellets, or of water resulting from the partial<br />
melting of the pellets. This type falls as showers.<br />
HHaaiill.. Precipitation of small balls or other pieces of ice (hail stones) falling separately or<br />
frozen together in irregular lumps. Hailstones consist of alternate opaque and clear layers<br />
of ice in most cases. Hail is normally associated with thunderstorms and surface<br />
temperatures above freezing.<br />
IIccee PPrriissmmss ((IIccee CCrryyssttaallss)).. A fall of unbranched snow crystals in the form of needles, columns,<br />
or plates. They are often so tiny that they seem to be suspended in the air. They may fall from<br />
a cloud or from clear air . The crystals are visible mainly when they glitter in the sunshine or<br />
other bright light (diamond dust); they may then produce a luminous pillar or other optical<br />
phenomena. This hydrometeor (rarely more than the lightest precipitation), which is frequent<br />
in polar regions, occurs only at very low temperatures in stable air masses.<br />
CChhaarraacctteerr ooff PPrreecciippiittaattiioonn..<br />
CCoonnttiinnuuoouuss.. Intensity changes gradually, if at all.<br />
IInntteerrmmiitttteenntt.. Intensity changes gradually, if at all, but precipitation stops and starts at<br />
least once within the hour preceding the observation.<br />
SShhoowweerr.. Precipitation changes intensity or starts and stops abruptly. Showers fall from<br />
cumuliform clouds.<br />
NWSOH No. 1 2-50 May 2010
EEssttiimmaattiinngg tthhee IInntteennssiittyy ooff RRaaiinn<br />
<strong>Ship</strong>s Synoptic Code and <strong>Observing</strong> Methods<br />
LLiigghhtt.. Scattered drops that do not completely wet an exposed surface, regardless of<br />
duration, to a condition where individual drops are easily seen; slight spray is<br />
observed over the decks; puddles form slowly; sound on roofs ranges from slow<br />
pattering to gentle swishing; steady small streams may flow in scuppers and deck<br />
drains.<br />
MMooddeerraattee.. Individual drops are not clearly identifiable; spray is observable just above<br />
deck and other hard surfaces; puddles form rapidly; sound on roofs ranges from<br />
swishing to gentle roar.<br />
HHeeaavvyy.. Rain seemingly falls in sheets; individual drops are not identifiable; heavy<br />
spray to height of several inches is observed over hard surfaces; visibility is greatly<br />
reduced; sound on roofs resembles roll of drums or distant roar .<br />
IInntteennssiittyy ooff DDrriizzzzllee oorr SSnnooww wwiitthh VViissiibbiilliittyy<br />
LLiigghhtt.. Visibility 1 Km (1/2 n. mile) or more.<br />
MMooddeerraattee.. Visibility less than 1 Km (1/2 n. mile) but not less than 1/2 Km<br />
(1/4 n. mile).<br />
HHeeaavvyy.. Visibility less than 1/2 Km (1/4 n. mile).<br />
EEssttiimmaattiinngg tthhee IInntteennssiittyy ooff HHaaiill aanndd IIccee PPeelllleettss<br />
LLiigghhtt.. Few stones or pellets falling with little, if any , accumulation.<br />
MMooddeerraattee.. Slow accumulation.<br />
HHeeaavvyy.. Rapid accumulation.<br />
DDrriiffttiinngg SSnnooww aanndd BBlloowwiinngg SSnnooww.. Snow particles raised from the ground by a<br />
strong, turbulent wind. Observed when ship is in or near ice, not over open sea.<br />
a. DDrriiffttiinngg SSnnooww.. Snow particles raised by the wind to small heights above the<br />
ground. Visibility is not reduced below 12 Km (6.5 n. miles) at eye level, although<br />
obstructions below this level may be veiled or hidden by the particles moving<br />
nearly horizontal to the ground.<br />
b. BBlloowwiinngg SSnnooww.. Snow particles raised and stirred violently by the wind to<br />
moderate or great heights. Visibility is poor, 12 Km (6.5 n. miles) or less, and the<br />
sky may become obscured when the particles are raised to great heights.<br />
TThhuunnddeerrssttoorrmmss<br />
TThhuunnddeerrssttoorrmm ((CCooddee 9999--9955)).. A local storm produced by a cumulonimbus cloud. It is<br />
always accompanied by lightning and thunder , usually with strong gusts of wind, heavy<br />
rain, and sometimes with hail.<br />
LLiigghhttnniinngg.. A flash of light from a sudden electrical discharge which takes place from or<br />
inside a cloud, from high structures on the ground, or from mountains.<br />
IInntteennssiittyy ooff TThhuunnddeerrssttoorrmm.. The intensity of a thunderstorm is based on the following<br />
characteristics observed within the previous 15 minutes:<br />
a. Thunderstorm, wind gusts less than 50 knots, and hail, if any , less than 20 mm<br />
(3/4 inch) in diameter.<br />
b. Severe thunderstorm, wind gusts of 50 knots or greater, or hail 20 mm (3/4 inch)<br />
or greater in diameter.<br />
NWSOH No. 1 2-51 May 2010
<strong>Ship</strong>s Synoptic Code and <strong>Observing</strong> Methods<br />
BBeeggiinnnniinngg ooff TThhuunnddeerrssttoorrmm.. A thunderstorm is considered to begin at a station when:<br />
a. Thunder is heard, or<br />
b. Overhead lightning or hail is observed, but the local noise level might prevent<br />
hearing thunder.<br />
EEnnddiinngg ooff TThhuunnddeerrssttoorrmm.. A thunderstorm is considered to have ended 15 minutes after<br />
the last occurrence of thunder.<br />
FFoogg aanndd SShhaallllooww FFoogg.. A visible aggregate of minute water particles (droplets) which are<br />
based at the earth’s surface. The difference between a cloud and fog is that a cloud has<br />
a base above the surface.<br />
a. Fog (code 40-49) reduces horizontal visibility (to less than 1/2 n. mile) and verticle<br />
visibility, and may extend over a sizable area. Fog is reported when the depth of<br />
the phenomena is greater than approximately 10 meters (33 feet) at sea.<br />
b. Shallow fog has little vertical extent, normally less than 10 meters (33 feet), and<br />
reduces visibility horizontally , but to a lesser extent vertically . The stars may<br />
often be seen by night and the sun by day . This is a local phenomena usually<br />
formed by radiational cooling of the air. It is often patchy, forming first over cooler<br />
surface water areas.<br />
c. When fog is present and the occurrence does not clearly fit the definition of<br />
shallow fog, the phenomenon will be reported as fog. If visibility is greater than<br />
1/2 n. mile, it is mist, code 10.<br />
IIccee FFoogg.. A suspension of numerous minute ice crystals in the air , based at the earth’ s<br />
surface, which reduces horizontal visibility . Unlike fog, ice fog does not produce rime or<br />
glaze on cold exposed objects. Temperatures are usually at or below approximately<br />
–30˚C (–22˚F) when ice fog forms. However , a mixture of liquid and ice fog occasionally<br />
forms at temperatures below freezing. This condition may persist for a few hours as the<br />
fog changes to ice fog and dissipates due to a drying of the air , even though temperatures<br />
continue to fall. Optical ef fects similar to those associated with ice prisms are observed<br />
in ice fog (diamond dust, etc.).<br />
Temperature-dew point differences may approach 4˚C (8˚F) or more.<br />
SSpprraayy aanndd BBlloowwiinngg SSpprraayy..<br />
a. Spray. Water droplets torn by the wind from the crests of waves and carried up<br />
a short distance into the air.<br />
b. Blowing Spray. Spray raised in such quantities as to reduce the visibility at eye<br />
level (6 feet on shore, 10 meters (33 feet) at sea) to 12 Km (6.5 n. miles) or less.<br />
DDeeww.. A deposit of water drops on objects at or near the surface produced by<br />
condensation of water vapor from the surrounding clear air .<br />
WWhhiittee DDeeww.. A deposit of white, frozen dew drops. White dew forms as liquid dew , then<br />
freezes.<br />
HHooaarr FFrroosstt.. A deposit of ice having a crystalline appearance, generally assuming the<br />
form of scales, needles, or fans. It is formed when water vapor is deposited on surfaces<br />
whose temperatures are at or below freezing, as compared to white dew, which is formed<br />
before freezing occurs.<br />
RRiimmee.. A deposit of ice, produced by fog at temperatures below freezing. It is composed<br />
of grains separated by air, sometimes adorned with crystalline branches.<br />
NWSOH No. 1 2-52 May 2010
<strong>Ship</strong>s Synoptic Code and <strong>Observing</strong> Methods<br />
GGllaazzee ((CClleeaarr IIccee)).. A coating of ice, generally clear and smooth, but with some air pockets.<br />
It is formed on exposed objects at temperatures below or slightly above the freezing<br />
temperature by the freezing of super-cooled drizzle, rain drops, or spray. Glaze is denser,<br />
harder, and more transparent than either rime or hoar frost.<br />
TToorrnnaaddoo.. A violent, rotating column of air , forming a pendant, usually from a<br />
cumulonimbus cloud over land and touching the ground. It nearly always starts as a<br />
funnel cloud and is accompanied by a loud roaring noise.<br />
FFuunnnneell CClloouudd.. A violent, rotating column of air which does not touch the ground, usually<br />
a pendant from a cumulonimbus cloud.<br />
WWaatteerrssppoouutt.. If a funnel cloud forms over the water and touches the water surface, it is<br />
called a waterspout.<br />
LLiitthhoommeetteeoorrss.. A lithometeor is a meteor consisting of a visible concentration of mostly<br />
solid, dry particles. The particles are more or less suspended in the air or lifted from the<br />
ground by wind. The more common lithometeors are defined below.<br />
HHaazzee.. A suspension in the air of extremely small, dry particles invisible to the naked eye<br />
and sufficiently numerous to give the air an opalescent appearance. This phenomenon<br />
resembles a uniform veil that subdues all colors. Dark objects viewed through this veil<br />
tend to have a bluish tinge while bright objects, such as the sun or distant lights, tend to<br />
have a dirty yellow or reddish hue.<br />
When haze is present and the sun is well above the horizon, its light may have a peculiar<br />
silvery tinge. Haze particles may be composed of a variety of substances; e.g., dust, salt,<br />
residue from distant fires or volcanoes, pollen, etc., which generally are well dif fused<br />
through the atmosphere.<br />
DDuusstt.. Fine particles suspended in the air by a duststorm or sandstorm that may have<br />
occurred at some distance from the ship. Dust gives a tan or gray tinge to distant objects.<br />
The sun’s disk is pale and colorless, or has a yellow tinge.<br />
SSmmookkee.. A suspension in the air of small particles produced by combustion. This<br />
phenomenon may be present either near the earth’ s surface or in the free atmosphere.<br />
When viewed through smoke, the disk of the sun at sunrise and sunset appears very red.<br />
The disk may have an orange tinge when the sun is above the horizon. Evenly distributed<br />
smoke from distant sources generally has a light grayish or bluish appearance. A<br />
transition to haze may occur when smoke particles have traveled great distances; for<br />
example, 25 to 100 miles or more, and when the larger particles have settled and the<br />
remaining particles have become widely scattered through the atmosphere.<br />
BBlloowwiinngg DDuusstt.. Dust raised by the wind to moderate heights above the ground and<br />
restricting horizontal visibility to less than 12 Km (6.5 n. miles).<br />
a. DDuussttssttoorrmm.. Same as blowing dust, except visibility is reduced to less than 1 Km<br />
(1/2 nautical mile) but not less than 1/2 Km (1/4 n. mile).<br />
b. SSeevveerree DDuussttssttoorrmm.. Same as blowing dust, except visibility is reduced to less<br />
than 1/2 Km (1/4 n. mile).<br />
BBlloowwiinngg SSaanndd.. Sand raised by the wind to moderate heights above the ground, reducing<br />
horizontal visibility to less than 12 Km (6.5 n. miles).<br />
a. SSaannddssttoorrmm.. Same as blowing sand, except horizontal visibility is reduced to less<br />
than 1 Km (1/2 n. mile) but not less than 1/2 Km (1/4 n. mile).<br />
b. SSeevveerree SSaannddssttoorrmm.. Same as blowing sand, except horizontal visibility is<br />
reduced to less than 1/2 Km (1/4 n. mile).<br />
NWSOH No. 1 2-53 May 2010
W 1W 2, Past Weather<br />
<strong>Ship</strong>s Synoptic Code and <strong>Observing</strong> Methods<br />
SECTION 0 — IDENTIFICATION DATA<br />
BBXX D . . . . D YYGGi w 99L aL aL a Q cL oL oL oL o<br />
SECTION 1 — METEOROLOGICAL DATA<br />
i Ri xhVV Nddff 00fff 1s nTTT 2s nT dT dT d<br />
4PPPP 5appp 7wwW1W2 8N hC LC MC H<br />
SECTION 2 — OCEANOGRAPHIC DATA<br />
222D sv s 0s sT wT wT w 2P wP wH wH w 3d w1d w1d w2d w2 4P w1P w1H w1H w1<br />
5P w2P w2H w2H w2 6I sE sE sR s 8s wT bT bT b ICE c iS ib iD iz i<br />
Definition: The types of weather since the previous main synoptic hour (0000, 0600,<br />
1200, 1800 UTC), usually different from that being reported by ww. Thus, for an<br />
observation made at 1200 UTC, the past weather period began six hours ago at 0600<br />
UTC. For an observation made at an intermediate time, say 2100 UTC, the past<br />
weather period began three hours ago at 1800 UTC.<br />
Units:<br />
Method of Measurement: Visually or audibly determined.<br />
How to Code: If two or more different types of reportable weather have occurred,<br />
use W 1 for the highest code figure, and W 2 for the second highest code figure. If the<br />
past weather has been continuous and unchanging since the last main synoptic hour,<br />
W 1 and W 2 are coded the same. W 1 is always greater than or equal to W 2.<br />
Code Figures<br />
Code for Past Weather, W 1W 2<br />
9 Thunderstorm(s) with or without precipitation<br />
8 Shower(s)<br />
7 Snow, or rain and snow mixed<br />
6 Rain<br />
5 Drizzle<br />
4 Fog, ice fog, or thick haze (visibility was less than 1 ⁄2 nautical mile)<br />
3 Sandstorm, duststorm, or blowing snow<br />
2 Cloud cover more than 1 ⁄2 throughout period<br />
1 Cloud cover more than 1 ⁄2 for part of period, and 1 ⁄2 or less for<br />
another part of period<br />
0 Cloud cover 1 ⁄2 or less throughout period<br />
NWSOH No. 1 2-54 May 2010
Remarks: Some examples:<br />
<strong>Ship</strong>s Synoptic Code and <strong>Observing</strong> Methods<br />
(1) It has been raining during the entire period since the last main synoptic hour. Code<br />
W1W2 as 66.<br />
(2) During the past six hours thunder was heard (code figure 9), and up until about one<br />
hour ago there were showers (code figure 8). Code W1W2 as 98.<br />
(3) It has been cloudy since the previous main synoptic hour (code figure 2). It rained<br />
for about an hour (code figure 6). There was some fog (code figure 4) and there were<br />
some showers (code figure 8). CodeW1W2 as 86.<br />
NWSOH No. 1 2-55 May 2010
<strong>Ship</strong>s Synoptic Code and <strong>Observing</strong> Methods<br />
N h, Amount of C L or C M Cloud Present<br />
8, Cloud Data Indicator<br />
SECTION 0 — IDENTIFICATION DATA<br />
BBXX D . . . . D YYGGi w 99L aL aL a Q cL oL oL oL o<br />
SECTION 1 — METEOROLOGICAL DATA<br />
i Ri xhVV Nddff 00fff 1s nTTT 2s nT dT dT d<br />
4PPPP 5appp 7wwW 1W 2 8NhC LC MC H<br />
SECTION 2 — OCEANOGRAPHIC DATA<br />
222D sv s 0s sT wT wT w 2P wP wH wH w 3d w1d w1d w2d w2 4P w1P w1H w1H w1<br />
5P w2P w2H w2H w2 6I sE sE sR s 8s wT bT bT b ICE c iS ib iD iz i<br />
Definition: N h is the amount of all the C L cloud present or, if no C L cloud is<br />
present, the amount of all the C M cloud present.<br />
Units: Fraction of the sky in eighths.<br />
Method of Measurement: Visual observation.<br />
How to Code:<br />
Code Figures<br />
Code for Amount of C L or C M Cloud Present, N h<br />
0 No C L or C M clouds present<br />
1 1 eighth or less, but not zero<br />
2 2 eighths<br />
3 3 eighths<br />
4 4 eighths<br />
5 5 eighths<br />
6 6 eighths<br />
7 7 eighths or more but not totally covered<br />
8 8 eighths; sky totally covered<br />
9 Sky obscured by fog, snow, or other meteorological phenomena<br />
/ Cloud cover indiscernible for reasons other than code figure 9,<br />
or observation not made<br />
Remarks: If the cloud can be seen through the fog, estimate cloud amount as well as<br />
circumstances permit. If the sun, moon, or stars can be seen through the fog and there<br />
is no evidence of cloud above the fog, use code figure 0 for N h.<br />
NWSOH No. 1 2-56 May 2010
C L, Low Cloud Type<br />
<strong>Ship</strong>s Synoptic Code and <strong>Observing</strong> Methods<br />
SECTION 0 — IDENTIFICATION DATA<br />
BBXX D . . . . D YYGGi w 99L aL aL a Q cL oL oL oL o<br />
SECTION 1 — METEOROLOGICAL DATA<br />
i Ri xhVV Nddff 00fff 1s nTTT 2s nT dT dT d<br />
4PPPP 5appp 7wwW 1W 2 8N hCLC MC H<br />
SECTION 2 — OCEANOGRAPHIC DATA<br />
222D sv s 0s sT wT wT w 2P wP wH wH w 3d w1d w1d w2d w2 4P w1P w1H w1H w1<br />
5P w2P w2H w2H w2 6I sE sE sR s 8s wT bT bT b ICE c iS ib iD iz i<br />
Definition: Clouds of type Stratocumulus, Stratus, Cumulus and Cumulonimbus.<br />
Stratocumulus (Sc) – Gray or whitish patch, sheet, or layer of cloud which almost<br />
always has dark parts, composed of tesselations, rounded<br />
masses, rolls, etc., which are nonfibrous, and which may or<br />
may not be merged; most of the regularly arranged small<br />
elements have an apparent width of more than 5 degrees.<br />
Stratus (St) – Generally grey cloud layer with a fairly uniform base,<br />
which may give drizzle, ice prisms, or snow grains. When the<br />
sun is visible through the cloud, its outline is clearly<br />
discernible. Stratus generally does not produce halo<br />
phenomena.<br />
Cumulus (Cu) – Detached clouds, generally dense and with sharp outlines,<br />
developing vertically in the form of rising mounds, domes, or<br />
towers, of which the bulging upper part often resembles a<br />
cauliflower. The sunlit parts are mostly<br />
brilliant white; their base is relatively dark and nearly<br />
horizontal.<br />
Cumulonimbus (Cb) – Heavy, dense cloud, with considerable vertical extent, in the<br />
form of a mountain, or huge towers. At least part of its<br />
upper portion is usually smooth, fibrous, or striated, and<br />
nearly always flattened; this part often spreads out in the<br />
shape of an anvil or vast plume.<br />
Units:<br />
Method of Measurement: Visual observation. Use the NWS cloud poster, cloud<br />
brochure, or other suitable cloud atlas which relate cloud photographs<br />
to cloud definitions, descriptions, and specifications. It is best to keep a close,<br />
continuous watch on the development of clouds.<br />
NWSOH No. 1 2-57 May 2010
How to Code:<br />
Code Figures<br />
<strong>Ship</strong>s Synoptic Code and <strong>Observing</strong> Methods<br />
Code for Low Cloud Type, C L<br />
9 Cb with a clearly fibrous top, often anvil-shaped; with or without<br />
other Cb, or Cu, Sc, St or ragged Cu or St of bad weather.<br />
3 Cb the tops of which, at least partially, lack sharp outlines, but are<br />
clearly not fibrous or anvil-shaped; Cu, Sc or St may also be<br />
present.<br />
4 Sc formed by the spreading out of Cu; Cu may also be present.<br />
8 Cu and Sc not formed by the spreading out of Cu; the bases of<br />
the Cu and Sc at different levels.<br />
2 Cu of moderate or strong vertical extent, generally with protuberances<br />
in the form of domes or towers, with or without other Cu or<br />
Sc, all having their bases at same level.<br />
Codes 1, 5, 6 and 7 are of equal priority . Choose the cloud type that is predominant.<br />
1 Cu with little vertical extent and seemingly flattened, and/or ragged<br />
Cu other than of bad weather.<br />
5 Sc not formed by the spreading out of Cu.<br />
6 St in a more or less continuous layer, and/or in ragged shreds; but<br />
no ragged St of bad weather.<br />
7 Ragged St and/or ragged Cu, both of bad weather, usually below<br />
As or Ns.<br />
0 No Sc, St, Cu or Cb clouds present.<br />
/ Sc, St, Cu and Cb invisible owing to darkness, fog, blowing dust or<br />
sand, or other similar phenomena.<br />
Remarks: If more than one type of C L is present, the order of priority for reporting<br />
(from highest to lowest priority) is C L = 9, 3, 4, 8, 2. These are<br />
followed in priority by C L = 1, 5, 6, 7, all of equal priority (if two or more of<br />
this second category are present, report the type which covers the greatest<br />
part of the sky).<br />
NWSOH No. 1 2-58 May 2010
<strong>Ship</strong>s Synoptic Code and <strong>Observing</strong> Methods<br />
C L = 1<br />
Cumulus with little<br />
vertical extent.<br />
C L = 2<br />
Cumulus with<br />
moderate or greater<br />
vertical extent.<br />
C L = 3<br />
Cumulonimbus, tops<br />
not fibrous, outline<br />
not completely sharp,<br />
no anvil.<br />
NWSOH No. 1 2-59 May 2010
<strong>Ship</strong>s Synoptic Code and <strong>Observing</strong> Methods<br />
C L = 4<br />
Stratocumulus from<br />
the spreading<br />
cumulus.<br />
C L = 5<br />
Stratocumulus not<br />
formed from<br />
spreading cumulus.<br />
C L = 6<br />
Stratus in a sheet or<br />
layer.<br />
NWSOH No. 1 2-60 May 2010
<strong>Ship</strong>s Synoptic Code and <strong>Observing</strong> Methods<br />
C L = 7<br />
Stratus fractus and/or<br />
cumulus fractus of<br />
bad weather.<br />
C L = 8<br />
Cumulus and<br />
stratocumulus (not<br />
spreading cumulus),<br />
bases at different<br />
levels.<br />
C L = 9<br />
Cumulonimbus with<br />
fibrous top, often with<br />
an anvil.<br />
NWSOH No. 1 2-61 May 2010
<strong>Ship</strong>s Synoptic Code and <strong>Observing</strong> Methods<br />
C M, Middle Cloud Type<br />
SECTION 0 — IDENTIFICATION DATA<br />
BBXX D . . . . D YYGGi w 99L aL aL a Q cL oL oL oL o<br />
SECTION 1 — METEOROLOGICAL DATA<br />
i Ri xhVV Nddff 00fff 1s nTTT 2s nT dT dT d<br />
4PPPP 5appp 7wwW 1W 2 8N hC LCMC H<br />
SECTION 2 — OCEANOGRAPHIC DATA<br />
222D sv s 0s sT wT wT w 2P wP wH wH w 3d w1d w1d w2d w2 4P w1P w1H w1H w1<br />
5P w2P w2H w2H w2 6I sE sE sR s 8s wT bT bT b ICE c iS ib iD iz i<br />
Definition: Clouds of type Altocumulus, Altostratus and Nimbostratus.<br />
Altocumulus (Ac) – White or gray patch, sheet, or layer of cloud, generally with<br />
shading, composed of laminae, rounded masses, rolls, etc,<br />
which are sometimes partly fibrous or diffuse, and which may<br />
or may not be merged; most of the regularly arranged small<br />
elements usually have an apparent width between one and five<br />
degrees.<br />
Altostratus (As) – Grayish or bluish sheet or layer of striated, fibrous, or uniform<br />
appearance, totally or partly covering the sky, and having parts<br />
thin enough to reveal the sun at least vaguely, as through<br />
ground glass. Does not show halo phenomena.<br />
Nimbostratus (Ns) –Heavy cloud layer, often dark, the appearance of which is<br />
rendered diffuse by falling rain or snow, which in most cases<br />
reaches the ground. It is thick enough to blot out the sun or<br />
moon.<br />
Units:<br />
Method of Measurement: Visual observation.<br />
How to Code: Code in accordance with the table on the following page.<br />
Remarks: If more than one code figure for C M is applicable at the same time, the<br />
priority order is C M = 9,8,7,6,5,4,3,2,1,/.<br />
NWSOH No. 1 2-62 May 2010
Code Figures<br />
<strong>Ship</strong>s Synoptic Code and <strong>Observing</strong> Methods<br />
Code for Middle Cloud Type, C M<br />
9 Ac of a chaotic sky, generally at several levels.<br />
8 Ac with sproutings like small towers or battlements, or Ac having<br />
the appearance cumulus-shaped tufts.<br />
7 Either: (a) Ac in two or more layers, opaque in places, not increasing.<br />
(b) Opaque layer of Ac, not increasing. (c) Ac together with As or Ns.<br />
6 Ac resulting from the spreading out of Cu (or Cb).<br />
5 Ac, semi-transparent; in bands or Ac in one or more layers, progressively<br />
invading the sky; these Ac clouds generally thicken as a whole.<br />
4 Patches (often almond or fish-shaped) of Ac, mostly semi-transparent;<br />
clouds occur at one or more levels and continually change<br />
in appearance.<br />
3 Ac, mostly semi-transparent; cloud elements change only slowly<br />
and are all at a single level..<br />
2 Either As, most of which is sufficiently dense to hide the sun or<br />
moon; or Nimbostratus.<br />
1 Ac, mostly semi-transparent, through which the sun or moon may<br />
be weakly visible, as through ground glass.<br />
0 No Ac, As or Ns clouds present<br />
/ Ac, As, and Ns invisible owing to darkness, or because of an over<br />
cast layer of C L cloud.<br />
NWSOH No. 1 2-63 May 2010
<strong>Ship</strong>s Synoptic Code and <strong>Observing</strong> Methods<br />
C M = 1<br />
Altostratus, semitransparent,<br />
sun or<br />
moon dimly visible.<br />
C M = 2<br />
Altostratus, dense<br />
enough to hide sun<br />
or moon, or<br />
nimbostratus.<br />
C M = 3<br />
Altocumulus, semitransparent,<br />
cloud<br />
elements change<br />
slowly, one level.<br />
NWSOH No. 1 2-64 May 2010
<strong>Ship</strong>s Synoptic Code and <strong>Observing</strong> Methods<br />
C M = 4<br />
Altocumulus patches<br />
semi-transparent,<br />
multilevel, cloud<br />
elements changing.<br />
Also altocumulus<br />
lenticular.<br />
C M = 5<br />
Altocumulus, one or<br />
more bands or layers,<br />
expanding, thickening.<br />
C M = 6<br />
Altocumulus from the<br />
spreading of cumulus<br />
or cumulonimbus.<br />
NWSOH No. 1 2-65 May 2010
<strong>Ship</strong>s Synoptic Code and <strong>Observing</strong> Methods<br />
C M = 7<br />
Altocumulus, one or<br />
more layers, mainly<br />
opaque, not<br />
expanding, or<br />
altocumulus with<br />
altostratus or<br />
nimbostratus.<br />
C M = 8<br />
Altocumulus with<br />
tower like sproutings.<br />
C M = 9<br />
Altocumulus of a<br />
chaotic sky, usually<br />
with heavy broken<br />
cloud sheets at<br />
different levels.<br />
NWSOH No. 1 2-66 May 2010
C H, High Cloud Type<br />
<strong>Ship</strong>s Synoptic Code and <strong>Observing</strong> Methods<br />
SECTION 0 — IDENTIFICATION DATA<br />
BBXX D . . . . D YYGGi w 99L aL aL a Q cL oL oL oL o<br />
SECTION 1 — METEOROLOGICAL DATA<br />
i Ri xhVV Nddff 00fff 1s nTTT 2s nT dT dT d<br />
4PPPP 5appp 7wwW 1W 2 8N hC LC MCH<br />
SECTION 2 — OCEANOGRAPHIC DATA<br />
222D sv s 0s sT wT wT w 2P wP wH wH w 3d w1d w1d w2d w2 4P w1P w1H w1H w1<br />
5P w2P w2H w2H w2 6I sE sE sR s 8s wT bT bT b ICE c iS ib iD iz i<br />
Definition: Clouds of type Cirrus, Cirrocumulus, Cirrostratus.<br />
Cirrus (Ci) – Detached clouds in the form of delicate white filaments or<br />
white or mostly white patches or narrow bands. These clouds<br />
have a fibrous appearance (hairlike), or a silky sheen, or both.<br />
Cirrocumulus (Cc) –Thin white patch, sheet, or layer of cloud without shading,<br />
composed of very small elements in the form of grains, ripples,<br />
etc., merged or separate, and more or less regularly arranged;<br />
most of the elements have an apparent width of less than one<br />
degree.<br />
Cirrostratus (Cs) – Transparent, whitish cloud veil of fibrous (hairlike) or smooth<br />
appearance, totally or partly covering the sky, and generally<br />
producing halo phenomena.<br />
Units:<br />
Method of Measurement: Visual observation.<br />
How to Code: Code in accordance with the table on the following page.<br />
Remarks: If more than one code figure for C H is applicable at the same time, the<br />
priority order is C H = 9,7,8,6,5,4,3,1,2,/.<br />
NWSOH No. 1 2-67 May 2010
Code Figures<br />
<strong>Ship</strong>s Synoptic Code and <strong>Observing</strong> Methods<br />
Code for High Cloud Type, C H<br />
9 Cc alone, or Cc with Ci and/or Cs, but the Cc is predominant.<br />
7 Veil of Cs covering the whole sky.<br />
8 Cs not increasing and not covering the whole sky.<br />
6 Ci (often in converging bands) and Cs, or Cs alone; in either case<br />
spreading over the sky and generally thickening, the continuous<br />
veil extends more than 45° above the horizon, but does not cover<br />
the whole sky.<br />
5 Same as code 6 above, except that the continuous veil does not<br />
reach 45° above the horizon.<br />
4 Ci in the form of hooks and/or filaments, progressively invading the<br />
sky; they generally become thicker as a whole.<br />
3 Dense Ci, often anvil-shaped, being the remains of the upper parts<br />
of a Cb.<br />
1 Ci in the form of filaments, strands or hooks, not progressively<br />
invading the sky.<br />
2 Either: (a) Dense Ci in patches or tangled sheaves, not increasing,<br />
which sometimes seem to be the remains of the upper part of a Cb.<br />
(b) Ci with sproutings like small turrets or battlements, or Ci having<br />
the appearance of cumulus-shaped tufts.<br />
0 No Ci, Cc or Cs clouds present.<br />
/ Ci, Cc and Cs invisible owing to darkness, or because of a continuous<br />
layer of lower clouds.<br />
NWSOH No. 1 2-68 May 2010
<strong>Ship</strong>s Synoptic Code and <strong>Observing</strong> Methods<br />
C H = 1<br />
Cirrus filaments,<br />
strands, hooks, not<br />
expanding.<br />
C H = 2<br />
Dense cirrus in<br />
patches or sheaves,<br />
not increasing, or<br />
cirrus like cumuliform<br />
tufts.<br />
C H = 3<br />
Dense cirrus, often<br />
the anvil remaining<br />
from cumulonimbus.<br />
NWSOH No. 1 2-69 May 2010
<strong>Ship</strong>s Synoptic Code and <strong>Observing</strong> Methods<br />
C H = 4<br />
Cirrus hooks or<br />
filaments, increasing,<br />
becoming denser.<br />
C H = 5<br />
Cirrus bands<br />
and/or cirrostratus,<br />
increasing, growing<br />
denser, veil below 45°.<br />
C H = 6<br />
Cirrus bands<br />
and/or cirrostratus,<br />
increasing, growing<br />
denser, veil abive 45°.<br />
NWSOH No. 1 2-70 May 2010
<strong>Ship</strong>s Synoptic Code and <strong>Observing</strong> Methods<br />
C H = 7<br />
Cirrostratus covering<br />
whole sky.<br />
C H = 8<br />
Cirrostratus, not<br />
increasing, not<br />
covering whole sky.<br />
C H = 9<br />
Cirrocumulus alone,<br />
and/or cirrus and<br />
cirrostratus.<br />
NWSOH No. 1 2-71 May 2010
<strong>Ship</strong>s Synoptic Code and <strong>Observing</strong> Methods<br />
Cloud types.<br />
NWSOH No. 1 2-72 May 2010
<strong>Ship</strong>s Synoptic Code and <strong>Observing</strong> Methods<br />
D s, <strong>Ship</strong>’s True Course<br />
222, Section 2 Indicator<br />
SECTION 0 — IDENTIFICATION DATA<br />
BBXX D . . . . D YYGGi w 99L aL aL a Q cL oL oL oL o<br />
SECTION 1 — METEOROLOGICAL DATA<br />
i Ri xhVV Nddff 00fff 1s nTTT 2s nT dT dT d<br />
4PPPP 5appp 7wwW 1W 2 8N hC LC MC H<br />
SECTION 2 — OCEANOGRAPHIC DATA<br />
222Dsv s 0s sT wT wT w 2P wP wH wH w 3d w1d w1d w2d w2 4P w1P w1H w1H w1<br />
5P w2P w2H w2H w2 6I sE sE sR s 8s wT bT bT b ICE c iS ib iD iz i<br />
Definition: D s is the true ship’s course made good during the three hours<br />
preceeding the time of observation.<br />
Units: Compass directions.<br />
Method of Measurement: If the ships course has been constant during the three<br />
hours preceeding the time of observation, then D s is the actual course at the time of<br />
observation. However, if the ship has altered course in the previous three hours, D s will<br />
probably differ from the course at the time of observation. See the diagram on the<br />
next page.<br />
How to Code:<br />
Code for <strong>Ship</strong>’s True Course, D s<br />
Code Figures True Direction<br />
0 <strong>Ship</strong> hove to<br />
1 NE<br />
2 E<br />
3 SE<br />
4 S<br />
5 SW<br />
6 W<br />
7 NW<br />
8 N<br />
9 Unknown<br />
/ Not reported<br />
Remarks: From the code table, select the true direction that is closest to ships course<br />
made good.<br />
NWSOH No. 1 2-73 May 2010
<strong>Ship</strong>s Synoptic Code and <strong>Observing</strong> Methods<br />
Determination of ship’s course made good.<br />
Position<br />
of ship<br />
at 1500Z<br />
(Course 130°)<br />
NORTH<br />
0°<br />
Position of<br />
ship at 1800Z<br />
Course made good (Course 060°)<br />
1500 - 1800 is<br />
084°<br />
270° 90°<br />
<strong>Ship</strong>’s Track<br />
In this example, the ship has altered course during the past three hours, so course made<br />
good (084°) differs from the actual course at the time of observation (060°). 084° is<br />
approximately eastward, so D s is coded as 2.<br />
NWSOH No. 1 2-74 May 2010
<strong>Ship</strong>s Synoptic Code and <strong>Observing</strong> Methods<br />
v s, <strong>Ship</strong>’s Average Speed<br />
SECTION 0 — IDENTIFICATION DATA<br />
BBXX D . . . . D YYGGi w 99L aL aL a Q cL oL oL oL o<br />
SECTION 1 — METEOROLOGICAL DATA<br />
i Ri xhVV Nddff 00fff 1s nTTT 2s nT dT dT d<br />
4PPPP 5appp 7wwW 1W 2 8N hC LC MC H<br />
SECTION 2 — OCEANOGRAPHIC DATA<br />
222D svs 0s sT wT wT w 2P wP wH wH w 3d w1d w1d w2d w2 4P w1P w1H w1H w1<br />
5P w2P w2H w2H w2 6I sE sE sR s 8s wT bT bT b ICE c iS ib iD iz i<br />
Definition: <strong>Ship</strong>’s average speed made good during the three hours preceeding the<br />
time of observation.<br />
Units: Knots.<br />
Method of Measurement: Find the distance in nautical miles, between the ships<br />
position at the time of observation and its position three hours previously. Obtain V s<br />
by dividing this distance by three. v s is the same as the ships speed at observation time<br />
only if the ships course and speed have not changed during the three hour period.<br />
How to Code:<br />
Code for <strong>Ship</strong>’s Average Speed, v s<br />
Code Figures True Direction<br />
0 0 knot<br />
1 1 to 5 knots<br />
2 6 to 10 knots<br />
3 11 to 15 knots<br />
4 16 to 20 knots<br />
5 21 to 25 knots<br />
6 26 to 30 knots<br />
7 31 to 35 knots<br />
8 36 to 40 knots<br />
9 Over 40 knots<br />
/ Not reported<br />
Remarks: If your vessel has changed course during the three hour period, remember<br />
to determine the distance made good of the ship during the three hour period, and divide<br />
this by three. In this case, distance made good is less than the actual distance the ship<br />
has travelled.<br />
NWSOH No. 1 2-75 May 2010
<strong>Ship</strong>s Synoptic Code and <strong>Observing</strong> Methods<br />
s s, Sign and Type of Sea Surface<br />
Temperature Measurement<br />
0, Sea Surface Data Indicator<br />
SECTION 0 — IDENTIFICATION DATA<br />
BBXX D . . . . D YYGGi w 99L aL aL a Q cL oL oL oL o<br />
SECTION 1 — METEOROLOGICAL DATA<br />
i Ri xhVV Nddff 00fff 1s nTTT 2s nT dT dT d<br />
4PPPP 5appp 7wwW 1W 2 8N hC LC MC H<br />
SECTION 2 — OCEANOGRAPHIC DATA<br />
222D sv s 0ssT wT wT w 2P wP wH wH w 3d w1d w1d w2d w2 4P w1P w1H w1H w1<br />
5P w2P w2H w2H w2 6I sE sE sR s 8s wT bT bT b ICE c iS ib iD iz i<br />
Definition: s s is the sign of the sea surface temperature (SST), and also indicates how<br />
the SST was measured.<br />
Units: Celsius degrees.<br />
Method of Measurement: Engine room intake thermometer, hull mounted<br />
contact sensor thermometer, bucket thermometer.<br />
How to Code:<br />
Code Figures<br />
Code for Sign and Type of Sea Surface Temperature, s s<br />
0 positive or zero intake measurement<br />
1 negative intake measurement<br />
2 positive or zero bucket measurement<br />
3 negative bucket measurement<br />
4 positive or zero hull contact sensor<br />
5 negative hull contact sensor<br />
6 positive or zero neither intake, bucket or hull<br />
7 negative neither intake, bucket or hull<br />
Remarks: Select the appropriate code figure according to the sign of the sea surface<br />
temperature and method of measurement.<br />
NWSOH No. 1 2-76 May 2010
<strong>Ship</strong>s Synoptic Code and <strong>Observing</strong> Methods<br />
T WT WT W, Sea Surface Temperature<br />
SECTION 0 — IDENTIFICATION DATA<br />
BBXX D . . . . D YYGGi w 99L aL aL a Q cL oL oL oL o<br />
SECTION 1 — METEOROLOGICAL DATA<br />
i Ri xhVV Nddff 00fff 1s nTTT 2s nT dT dT d<br />
4PPPP 5appp 7wwW 1W 2 8N hC LC MC H<br />
SECTION 2 — OCEANOGRAPHIC DATA<br />
222D sv s 0s sTwTwTw 2P wP wH wH w 3d w1d w1d w2d w2 4P w1P w1H w1H w1<br />
5P w2P w2H w2H w2 6I sE sE sR s 8s wT bT bT b ICE c iS ib iD iz i<br />
Definition: Sea surface water temperature, in tenths of a degree Celsius, its sign<br />
being given by s s. The temperature to be observed is that of the sea surface<br />
representative of conditions in the near-surface mixing layer underlying the ocean skin.<br />
Units: Celsius degrees.<br />
Method of Measurement: Engine room intake thermometer, hull mounted<br />
contact sensor thermometer, bucket thermometer.<br />
How to Code: In actual degrees Celsius as shown below.<br />
Examples: 8.4°C: T wT wT w = 084 s s = 0 (intake thermometer)<br />
0.4°C: T wT wT w = 004 s s = 0 (intake thermometer)<br />
–0.7°C: T wT wT w = 007 s s = 1 (intake thermometer)<br />
–1.5°C: T wT wT w = 015 s s = 1 (intake thermometer)<br />
Remarks: It is important to have your sea water thermometer checked and<br />
calibrated regularly. The engine room intake thermometer should be checked every<br />
time your vessel goes into the yard for service, and replaced whenever necessary.<br />
NWSOH No. 1 2-77 May 2010
<strong>Ship</strong>s Synoptic Code and <strong>Observing</strong> Methods<br />
P WP W, Period of Wind Waves<br />
2, Wind Wave Data Indicator<br />
SECTION 0 — IDENTIFICATION DATA<br />
BBXX D . . . . D YYGGi w 99L aL aL a Q cL oL oL oL o<br />
SECTION 1 — METEOROLOGICAL DATA<br />
i Ri xhVV Nddff 00fff 1s nTTT 2s nT dT dT d<br />
4PPPP 5appp 7wwW 1W 2 8N hC LC MC H<br />
SECTION 2 — OCEANOGRAPHIC DATA<br />
222D sv s 0s sT wT wT w 2PwPwH wH w 3d w1d w1d w2d w2 4P w1P w1H w1H w1<br />
5P w2P w2H w2H w2 6I sE sE sR s 8s wT bT bT b ICE c iS ib iD iz i<br />
Definition: P wP w is the period of wind waves in seconds. Wave period is the time<br />
between the passage of two successive wave crests (or successive troughs) past a fixed<br />
point.<br />
Units: Seconds.<br />
Method of Measurement: Count seconds, preferably with a watch or stopwatch.<br />
Note a small object (such as a piece of wood thrown overboard), a piece of seaweed,<br />
patch of foam, or a bird floating on the water. Start counting when the object reaches<br />
the crest of the first well formed wave. As the crest passes, the object will pass into the<br />
trough, then to the next crest, etc. Divide the total elapsed time by the number of<br />
crests passing under the object to obtain the period.<br />
How to Code: Coded directly in seconds. Thus, if the sea wave period is 8<br />
seconds, P wP w is coded as 08.<br />
Remarks: For measuring mean period of a wave system, only consider the higher<br />
waves in the center of each group of well formed waves. Any flat, or badly formed<br />
waves are omitted from the record.<br />
Characteristics of a Simple Wave<br />
NWSOH No. 1 2-78 May 2010
<strong>Ship</strong>s Synoptic Code and <strong>Observing</strong> Methods<br />
H WH W, Height of Wind Waves<br />
SECTION 0 — IDENTIFICATION DATA<br />
BBXX D . . . . D YYGGi w 99L aL aL a Q cL oL oL oL o<br />
SECTION 1 — METEOROLOGICAL DATA<br />
i Ri xhVV Nddff 00fff 1s nTTT 2s nT dT dT d<br />
4PPPP 5appp 7wwW 1W 2 8N hC LC MC H<br />
SECTION 2 — OCEANOGRAPHIC DATA<br />
222D sv s 0s sT wT wT w 2P wP wHwHw 3d w1d w1d w2d w2 4P w1P w1H w1H w1<br />
5P w2P w2H w2H w2 6I sE sE sR s 8s wT bT bT b ICE c iS ib iD iz i<br />
Definition: The vertical distance between trough and crest for wind waves in units of<br />
0.5 meter.<br />
Units: Half meters.<br />
Method of Measurement: Visual estimate. It is best for the observer to locate on<br />
the side of the ship from which the waves are coming. On very dark nights or in dense<br />
fog, estimate the wave height based on the last clear sighting, and whether wind speed<br />
or ships motion have changed.<br />
How to Code: The code is in units of half meters e.g. code figure 08 is 8 half meters<br />
= 4 meters = 13 feet:<br />
Code for Height of Waves, HWHW Code Height Code Height Code Height<br />
figs. in ft. figs. in ft. figs. in ft.<br />
( 1 ⁄2 m) ( 1 ⁄2 m) ( 1 ⁄2 m)<br />
00 Less than 1 10 16 or 17 20 32 to 33<br />
01 1 or 2 11 18 21 34 or 35<br />
02 3 or 4 12 19 or 20 22 36<br />
03 5 13 21 or 22 23 37 or 38<br />
04 6 or 7 14 23 24 39 or 40<br />
05 8 or 9 15 24 or 25 25 41<br />
06 10 16 26 or 27 26 42 or 43<br />
07 11 or 12 17 28 27 44 or 45<br />
08 13 18 29 or 30 // Not<br />
09 14 or 15 19 31 determined<br />
To obtain the code figures for heights over 45 feet, multiply the height in feet by 0.6 and<br />
round off the result to the nearest whole number .<br />
Remarks: As with wave period, consider only the larger well-formed waves near the<br />
center of the wave group. Estimate the average height of these larger waves, and<br />
disregard the lesser waves. There is a tendency to underestimate wave height if you are<br />
fifty feet or more above the sea surface. Your visual estimate may be more accurate<br />
from a lower deck.<br />
NWSOH No. 1 2-79 May 2010
<strong>Ship</strong>s Synoptic Code and <strong>Observing</strong> Methods<br />
d W1d W1, Direction of Primary Swell Waves<br />
3, Direction of Swell Waves Data Indicator<br />
SECTION 0 — IDENTIFICATION DATA<br />
BBXX D . . . . D YYGGi w 99L aL aL a Q cL oL oL oL o<br />
SECTION 1 — METEOROLOGICAL DATA<br />
i Ri xhVV Nddff 00fff 1s nTTT 2s nT dT dT d<br />
4PPPP 5appp 7wwW 1W 2 8N hC LC MC H<br />
SECTION 2 — OCEANOGRAPHIC DATA<br />
222D sv s 0s sT wT wT w 2P wP wH wH w 3dw1dw1d w2d w2 4P w1P w1H w1H w1<br />
5P w2P w2H w2H w2 6I sE sE sR s 8s wT bT bT b ICE c iS ib iD iz i<br />
Definition: True direction, in tens of degrees, from which primary swell waves are<br />
coming. Use swell wave height to distinguish primary from secondary swell — the<br />
primary or predominant swell system is the one having the higher swell waves. Swell<br />
are waves that have travelled into your area of observation after being generated by<br />
wind in other areas.<br />
Units: Degrees.<br />
Method of Measurement: Visual estimate. Sight along the swell wave crests of the<br />
primary swell. The direction the swell waves are coming from will be 90° to the<br />
crestline.<br />
NWSOH No. 1 2-80 May 2010
<strong>Ship</strong>s Synoptic Code and <strong>Observing</strong> Methods<br />
How to Code: Use the same code table as for dd, wind direction<br />
Code for Direction of Primary Swell, d W1d W1<br />
Code figure Code flgure<br />
01 5°-14° 21 205°-214°<br />
02 15°-24° 22 215°-224°<br />
03 25°-34° 23 225°-234°<br />
04 35°-44° 24 235°-244°<br />
05 45°-54° 25 245°-254°<br />
06 55°-64° 26 255°-264°<br />
07 65°-74° 27 265°-274°<br />
08 75°-84° 28 275°-284°<br />
09 85°-94° 29 285°-294°<br />
10 95°-104° 30 295°-304°<br />
11 105°-114° 31 305°-314°<br />
12 115°-124° 32 315°-324°<br />
13 125°-134° 33 325°-334°<br />
14 135°-144° 34 335°-344°<br />
15 145°-154° 35 345°-354°<br />
16 155°-164° 36 355°-004° 17 165°-174° 99 Variable, or all<br />
18 175°-184° directions.<br />
19 185°-194°<br />
20 195°-204°<br />
Remarks: If there is no swell, or if the swell cannot be distinguished, omit the swell<br />
groups (3d W1d W1d W2d W2, 4P W1P W1H W1H W1, 5P W2P W2H W2H W2) from the weather<br />
message.<br />
NWSOH No. 1 2-81 May 2010
<strong>Ship</strong>s Synoptic Code and <strong>Observing</strong> Methods<br />
Diagram showing development of wind waves in a storm area and evolution of<br />
wind waves into swell as the waves travel out of the wave-generating area.<br />
Direction<br />
of<br />
waveadvance<br />
Swell<br />
Sea<br />
Fetch<br />
Limits of storm<br />
Average<br />
wind<br />
direction<br />
Wave-generating<br />
area<br />
To distinguish wind waves from swell, remember that wind waves are generated by<br />
the wind blowing at the time of observation, or in the recent past, in your local area.<br />
Swell waves have travelled into your area of observation, after having been<br />
generated by winds in other areas (sometimes thousands of miles away). As wind<br />
waves move out from under the wind that produces them and become swell, their<br />
character changes. The crests become lower and more rounded, and they move in<br />
trains of similar period and height. Swell is more symmetrical and uniform than sea,<br />
and will have a longer period.<br />
NWSOH No. 1 2-82 May 2010
<strong>Ship</strong>s Synoptic Code and <strong>Observing</strong> Methods<br />
d W2d W2, Direction of Secondary Swell Waves<br />
SECTION 0 — IDENTIFICATION DATA<br />
BBXX D . . . . D YYGGi w 99L aL aL a Q cL oL oL oL o<br />
SECTION 1 — METEOROLOGICAL DATA<br />
i Ri xhVV Nddff 00fff 1s nTTT 2s nT dT dT d<br />
4PPPP 5appp 7wwW 1W 2 8N hC LC MC H<br />
SECTION 2 — OCEANOGRAPHIC DATA<br />
222D sv s 0s sT wT wT w 2P wP wH wH w 3d w1d w1dw2dw2 4P w1P w1H w1H w1<br />
5P w2P w2H w2H w2 6I sE sE sR s 8s wT bT bT b ICE c iS ib iD iz i<br />
Definition: True direction, in tens of degrees, from which secondary swell waves are<br />
coming. The secondary swell system has lower waves than the primary swell and<br />
usually comes from a different direction.<br />
Units: Degrees.<br />
Method of Measurement: Visual estimate. Sight along the secondary swell wave<br />
crests. The wave direction will be 90° to the crestline.<br />
How to Code: Use the same code table as for dd, wind direction<br />
Code for Direction of Secondary Swell, d W2d W2<br />
Code figure Code flgure<br />
01 5°-14° 21 205°-214°<br />
02 15°-24° 22 215°-224°<br />
03 25°-34° 23 225°-234°<br />
04 35°-44° 24 235°-244°<br />
05 45°-54° 25 245°-254°<br />
06 55°-64° 26 255°-264°<br />
07 65°-74° 27 265°-274°<br />
08 75°-84° 28 275°-284°<br />
09 85°-94° 29 285°-294°<br />
10 95°-104° 30 295°-304°<br />
11 105°-114° 31 305°-314°<br />
12 115°-124° 32 315°-324°<br />
13 125°-134° 33 325°-334°<br />
14 135°-144° 34 335°-344°<br />
15 145°-154° 35 345°-354°<br />
16 155°-164° 36 355°-004° 17 165°-174° 99 Variable, or all<br />
18 175°-184° directions.<br />
19 185°-194°<br />
20 195°-204°<br />
Remarks: If only one swell system is observed, use slants (//) for the secondary<br />
swell.<br />
NWSOH No. 1 2-83 May 2010
<strong>Ship</strong>s Synoptic Code and <strong>Observing</strong> Methods<br />
P W1P W1, Primary Swell Wave Period<br />
4, Data Indicator for Period and Height of<br />
Primary Swell Waves<br />
SECTION 0 — IDENTIFICATION DATA<br />
BBXX D . . . . D YYGGi w 99L aL aL a Q cL oL oL oL o<br />
SECTION 1 — METEOROLOGICAL DATA<br />
i Ri xhVV Nddff 00fff 1s nTTT 2s nT dT dT d<br />
4PPPP 5appp 7wwW 1W 2 8N hC LC MC H<br />
SECTION 2 — OCEANOGRAPHIC DATA<br />
222D sv s 0s sT wT wT w 2P wP wH wH w 3d w1d w1d w2d w2 4Pw1Pw1H w1H w1<br />
5P w2P w2H w2H w2 6I sE sE sR s 8s wT bT bT b ICE c iS ib iD iz i<br />
Definition: Period of primary swell waves, in seconds. Period is the time it takes two<br />
successive swell wave crests to pass a fixed point.<br />
Units: Seconds.<br />
Method of Measurement: Same as for wind wave period. Count the seconds,<br />
preferably with a watch or stopwatch. Note a small object, a peice of seaweed, patch of<br />
foam, even a bird floating on the water. Start counting when the object reaches the<br />
crest of the first well-formed swell wave. Note the time the object reaches the next<br />
crest, and the crest after that. Record the average period for several of the larger, well<br />
formed swell waves.<br />
How to Code: Coded directly in seconds. Thus, if the period of the primary swell<br />
waves is 12 seconds, P w1P w1 is coded as 12. If the period is 7 seconds, P w1P w1 is coded<br />
as 07.<br />
Remarks: When the swell wavelength is close to the width of the ship, period can be<br />
estimated by counting the seconds it takes the ship to “ride the swell”, i.e., go from<br />
crest to trough and back to crest. This method is especially useful if the swell is coming<br />
from abeam the ship (port to starboard or the reverse).<br />
NWSOH No. 1 2-84 May 2010
<strong>Ship</strong>s Synoptic Code and <strong>Observing</strong> Methods<br />
H W1H W1, Height of Primary Swell Waves<br />
SECTION 0 — IDENTIFICATION DATA<br />
BBXX D . . . . D YYGGi w 99L aL aL a Q cL oL oL oL o<br />
SECTION 1 — METEOROLOGICAL DATA<br />
i Ri xhVV Nddff 00fff 1s nTTT 2s nT dT dT d<br />
4PPPP 5appp 7wwW 1W 2 8N hC LC MC H<br />
SECTION 2 — OCEANOGRAPHIC DATA<br />
222D sv s 0s sT wT wT w 2P wP wH wH w 3d w1d w1d w2d w2 4P w1P w1Hw1Hw1<br />
5P w2P w2H w2H w2 6I sE sE sR s 8s wT bT bT b ICE c iS ib iD iz i<br />
Definition: Height of primary swell waves, in units of 0.5 meter. Swell wave height is<br />
the vertical distance between trough and crest. The primary swell<br />
system has higher waves than the secondary swell.<br />
Units: Half meters.<br />
Method of Measurement: Visual estimate. It is best for the observer to locate on the<br />
side of the ship from which the waves are coming. It may help to move up or down in the<br />
ship (by changing levels or deck) to obtain the best possible view. On very dark nights, or in<br />
dense fog, estimate the height of the swell waves based on the last clear sighting, and<br />
whether swell waves have since changed based on the wind speed or ship’s motion. On<br />
bright moonlit nights, swell waves can often be observed.<br />
How to Code: The code is in units of half meters. Thus, code figure 10 is 10 half<br />
meters = 5 meters = 16-17 feet.<br />
Code for Height of Primary Swell Waves, H W1H W1<br />
Code Height Code Height Code Height<br />
figs. in ft. figs. in ft. figs. in ft.<br />
( 1 ⁄2 m) ( 1 ⁄2 m) ( 1 ⁄2 m)<br />
00 Less than 1 10 16 or 17 20 32 to 33<br />
01 1 or 2 11 18 21 34 or 35<br />
02 3 or 4 12 19 or 20 22 36<br />
03 5 13 21 or 22 23 37 or 38<br />
04 6 or 7 14 23 24 39 or 40<br />
05 8 or 9 15 24 or 25 25 41<br />
06 10 16 26 or 27 26 42 or 43<br />
07 11 or 12 17 28 27 44 or 45<br />
08 13 18 29 or 30 // Not<br />
09 14 or 15 19 31 determined<br />
To obtain the code figures for heights over 45 feet, multiply the height in feet by 0.6 and<br />
round off the result to the nearest whole number .<br />
Remarks: When determining swell wave characteristics, always select the larger, well<br />
formed swell waves of the wave system being observed. These are referred to as the<br />
“significant” swell waves.<br />
NWSOH No. 1 2-85 May 2010
<strong>Ship</strong>s Synoptic Code and <strong>Observing</strong> Methods<br />
P W2P W2, Period of Secondary Swell Waves<br />
5, Data Indicator for Period and Height of Secondary<br />
Swell Waves<br />
SECTION 0 — IDENTIFICATION DATA<br />
BBXX D . . . . D YYGGi w 99L aL aL a Q cL oL oL oL o<br />
SECTION 1 — METEOROLOGICAL DATA<br />
i Ri xhVV Nddff 00fff 1s nTTT 2s nT dT dT d<br />
4PPPP 5appp 7wwW 1W 2 8N hC LC MC H<br />
SECTION 2 — OCEANOGRAPHIC DATA<br />
222D sv s 0s sT wT wT w 2P wP wH wH w 3d w1d w1d w2d w2 4P w1P w1H w1H w1<br />
5Pw2Pw2H w2H w2 6I sE sE sR s 8s wT bT bT b ICE c iS ib iD iz i<br />
Definition: Period of secondary swell waves, in seconds.<br />
Units: Seconds.<br />
Method of Measurement: Same as for wind wave period. Count the seconds,<br />
preferably with a watch or stopwatch. Note a small object, a peice of seaweed, patch of<br />
foam, even a bird floating on the water. Start counting when the object reaches the<br />
crest of the first well-formed swell wave. Note the time the object reaches the next<br />
crest, and the crest after that. Record the average period for several of the larger, well<br />
formed swell waves.<br />
How to Code: Coded directly in seconds. Thus, if the period of the primary swell<br />
waves is 12 seconds, P w2P w2 is coded as 12. If the period is 7 seconds, P w2P w2 is coded<br />
as 07.<br />
Remarks: When the swell wavelength is close to the width of the ship, period can be<br />
estimated by counting the seconds it takes the ship to “ride the swell”, i.e., go from<br />
crest to trough and back to crest. This method is especially useful<br />
if the swell is coming from abeam the ship (port to starboard or the reverse).<br />
NWSOH No. 1 2-86 May 2010
<strong>Ship</strong>s Synoptic Code and <strong>Observing</strong> Methods<br />
H W2H W2, Height of Secondary Swell Waves<br />
SECTION 0 — IDENTIFICATION DATA<br />
BBXX D . . . . D YYGGi w 99L aL aL a Q cL oL oL oL o<br />
SECTION 1 — METEOROLOGICAL DATA<br />
i Ri xhVV Nddff 00fff 1s nTTT 2s nT dT dT d<br />
4PPPP 5appp 7wwW 1W 2 8N hC LC MC H<br />
SECTION 2 — OCEANOGRAPHIC DATA<br />
222D sv s 0s sT wT wT w 2P wP wH wH w 3d w1d w1d w2d w2 4P w1P w1H w1H w1<br />
5P w2P w2Hw2Hw2 6I sE sE sR s 8s wT bT bT b ICE c iS ib iD iz i<br />
Definition: Height of secondary swell waves, in units of 0.5 meter. The secondary<br />
swell system has lower waves than the primary swell.<br />
Units: Half meters.<br />
Method of Measurement: Visual estimate. It is best for the observer to locate on the<br />
side of the ship from which the swell waves are coming. It may help to move up or down<br />
in the ship (by changing levels or deck) to obtain the best possible view. On very dark<br />
nights, or in dense fog, estimate the height of the swell waves based on the last clear<br />
sighting, and whether swell waves have since changed based on the wind speed or ship’s<br />
motion. On bright moonlit nights, swell waves can often be observed.<br />
How to Code: The code is in units of half meters. Thus, code figure 10 is 10 half<br />
meters = 5 meters = 16-17 feet.<br />
Code for Height of Secondary Swell Waves, H W2H W2<br />
Code Height Code Height Code Height<br />
figs. in ft. figs. in ft. figs. in ft.<br />
( 1 ⁄2 m) ( 1 ⁄2 m) ( 1 ⁄2 m)<br />
00 Less than 1 10 16 or 17 20 32 to 33<br />
01 1 or 2 11 18 21 34 or 35<br />
02 3 or 4 12 19 or 20 22 36<br />
03 5 13 21 or 22 23 37 or 38<br />
04 6 or 7 14 23 24 39 or 40<br />
05 8 or 9 15 24 or 25 25 41<br />
06 10 16 26 or 27 26 42 or 43<br />
07 11 or 12 17 28 27 44 or 45<br />
08 13 18 29 or 30 // Not<br />
09 14 or 15 19 31 determined<br />
To obtain the code figures for heights over 45 feet, multiply the height in feet by 0.6 and<br />
round off the result to the nearest whole number .<br />
Remarks: When determining swell wave characteristics, always select the larger, well<br />
formed swell waves. These are referred to as the “significant” swell waves.<br />
NWSOH No. 1 2-87 May 2010
<strong>Ship</strong>s Synoptic Code and <strong>Observing</strong> Methods<br />
I s, Cause of Ice Accretion on <strong>Ship</strong><br />
6, Data Indicator for Ice Accretion<br />
SECTION 0 — IDENTIFICATION DATA<br />
BBXX D . . . . D YYGGi w 99L aL aL a Q cL oL oL oL o<br />
SECTION 1 — METEOROLOGICAL DATA<br />
i Ri xhVV Nddff 00fff 1s nTTT 2s nT dT dT d<br />
4PPPP 5appp 7wwW 1W 2 8N hC LC MC H<br />
SECTION 2 — OCEANOGRAPHIC DATA<br />
222D sv s 0s sT wT wT w 2P wP wH wH w 3d w1d w1d w2d w2 4P w1P w1H w1H w1<br />
5P w2P w2H w2H w2 6IsE sE sR s 8s wT bT bT b ICE c iS ib iD iz i<br />
Definition: I s is the cause of ice accretion on ship. Ice accretion refers to a deposition<br />
of a coating of ice on the ships superstructure or exposed surfaces, from freezing<br />
precipitation, ocean spray, supercooled fog, or cloud droplets.<br />
Units:<br />
Method of Measurement: Visual.<br />
How to Code:<br />
Code Figures<br />
1 Icing from ocean spray<br />
2 Icing from fog<br />
3 Icing from spray and fog<br />
4 Icing from rain<br />
5 Icing from spray and rain<br />
Code for Ice Accretion, I s<br />
Remarks: An accumulation of freezing rain, drizzle, sea spray, or fog (rime ice) can<br />
be hazardous, especially to smaller vessels. Ice can cause radio or radar failures, due to<br />
the icing of aerials. Ice can also cause difficulty in unloading cargo in port if<br />
containers and their lashings are frozen to the deck. By reporting this information, you<br />
alert the forecasters to this condition, enabling them to broadcast reliable warnings<br />
when a danger is foreseen.<br />
NWSOH No. 1 2-88 May 2010
<strong>Ship</strong>s Synoptic Code and <strong>Observing</strong> Methods<br />
E sE s, Thickness of Ice Accretion on <strong>Ship</strong>s<br />
SECTION 0 — IDENTIFICATION DATA<br />
BBXX D . . . . D YYGGi w 99L aL aL a Q cL oL oL oL o<br />
SECTION 1 — METEOROLOGICAL DATA<br />
i Ri xhVV Nddff 00fff 1s nTTT 2s nT dT dT d<br />
4PPPP 5appp 7wwW 1W 2 8N hC LC MC H<br />
SECTION 2 — OCEANOGRAPHIC DATA<br />
222D sv s 0s sT wT wT w 2P wP wH wH w 3d w1d w1d w2d w2 4P w1P w1H w1H w1<br />
5P w2P w2H w2H w2 6I sEsEsR s 8s wT bT bT b ICE c iS ib iD iz i<br />
Definition: Thickness of ice accretion on ships, in centimeters. Record the<br />
maximum thickness observed.<br />
Units: Centimeters.<br />
Method of Measurement: Visual estimate or measured with tape measure or<br />
ruler.<br />
How to Code: The code is direct reading in centimeters.<br />
Code for Thickness of Ice Accretion, E sE s<br />
Code Code Code<br />
figs. figs. figs.<br />
(cm) Inches (cm) Inches (cm) Inches<br />
00 Less than 1 ⁄4 08 3 or 3 1 ⁄4 16 6 1 ⁄4<br />
01 1 ⁄4 or 1 ⁄2 09 3 1 ⁄2 17 6 1 ⁄2 or 6 3 ⁄4<br />
02 3 ⁄4 10 3 3 ⁄4 or 4 18 7 or 7 1 ⁄4<br />
03 1 to 1 1 ⁄4 11 4 1 ⁄4 or 4 1 ⁄2 19 7 1 ⁄2<br />
04 1 1 ⁄2 or 1 3 ⁄4 12 4 3 ⁄4 20 7 3 ⁄4 or 8<br />
05 2 13 5 or 5 1 ⁄4 21 8 1 ⁄4<br />
06 2 1 ⁄4 or 2 1 ⁄2 14 5 1 ⁄2 22 8 1 ⁄2 or 8 3 ⁄4<br />
07 2 3 ⁄4 15 5 3 ⁄4 or 6 23 9 or 9 1 ⁄4<br />
Remarks: Report the actual thickness of the ice in centimeters. If the thickness is 30<br />
cm, code E sE s as 30.<br />
NWSOH No. 1 2-89 May 2010
<strong>Ship</strong>s Synoptic Code and <strong>Observing</strong> Methods<br />
R s, Rate of Ice Accretion on <strong>Ship</strong>s<br />
SECTION 0 — IDENTIFICATION DATA<br />
BBXX D . . . . D YYGGi w 99L aL aL a Q cL oL oL oL o<br />
SECTION 1 — METEOROLOGICAL DATA<br />
i Ri xhVV Nddff 00fff 1s nTTT 2s nT dT dT d<br />
4PPPP 5appp 7wwW 1W 2 8N hC LC MC H<br />
SECTION 2 — OCEANOGRAPHIC DATA<br />
222D sv s 0s sT wT wT w 2P wP wH wH w 3d w1d w1d w2d w2 4P w1P w1H w1H w1<br />
5P w2P w2H w2H w2 6I sE sE sRs 8s wT bT bT b ICE c iS ib iD iz i<br />
Definition: Rate of ice accretion on ships.<br />
Units:<br />
Method of Measurement: Visual estimate.<br />
How to Code:<br />
Code Figures<br />
Remarks:<br />
Code for Rate of Ice Accretion, R s<br />
0 Ice not building up<br />
1 Ice building up slowly<br />
2 Ice building up rapidly<br />
3 Ice melting or breaking up slowly<br />
4 Ice melting or breaking up rapidly<br />
NWSOH No. 1 2-90 May 2010
<strong>Ship</strong>s Synoptic Code and <strong>Observing</strong> Methods<br />
s w, Sign and Method of Determining Wet<br />
Bulb Temperature<br />
8, Data Indicator for Wet Bulb Temperature<br />
SECTION 0 — IDENTIFICATION DATA<br />
BBXX D . . . . D YYGGi w 99L aL aL a Q cL oL oL oL o<br />
SECTION 1 — METEOROLOGICAL DATA<br />
i Ri xhVV Nddff 00fff 1s nTTT 2s nT dT dT d<br />
4PPPP 5appp 7wwW 1W 2 8N hC LC MC H<br />
SECTION 2 — OCEANOGRAPHIC DATA<br />
222D sv s 0s sT wT wT w 2P wP wH wH w 3d w1d w1d w2d w2 4P w1P w1H w1H w1<br />
5P w2P w2H w2H w2 6I sE sE sR s 8swT bT bT b ICE c iS ib iD iz i<br />
Definition: Arithmetic sign and how the wet bulb temperature was determined.<br />
Units: Celsius degrees.<br />
Method of Measurement: Psychrometer, either a hand-held sling or an outdoor<br />
unit housed in a shelter.<br />
How to Code:<br />
Code Figures<br />
Code for Sign and Type of Wet Bulb Temperature, S w<br />
0 Positive or zero measured<br />
1 Negative measured<br />
2 Iced bulb measured<br />
3-4 Not used<br />
5 Positive or zero computed<br />
6 Negative computed<br />
7 Iced bulb computed<br />
Remarks: Psychrometers must be exposed in a stream of air, fresh from the sea,<br />
which has not been in contact with, or passed over the ship, and should be adequetely<br />
shielded from radiation, precipitation, and spray. Take your measurement from the<br />
windward side of the ship. If using psychrometers housed in an outdoor shelter, one<br />
should be installed on each side of the ship.<br />
NWSOH No. 1 2-91 May 2010
<strong>Ship</strong>s Synoptic Code and <strong>Observing</strong> Methods<br />
T bT bT b, Wet Bulb Temperature<br />
SECTION 0 — IDENTIFICATION DATA<br />
BBXX D . . . . D YYGGi w 99L aL aL a Q cL oL oL oL o<br />
SECTION 1 — METEOROLOGICAL DATA<br />
i Ri xhVV Nddff 00fff 1s nTTT 2s nT dT dT d<br />
4PPPP 5appp 7wwW 1W 2 8N hC LC MC H<br />
SECTION 2 — OCEANOGRAPHIC DATA<br />
222D sv s 0s sT wT wT w 2P wP wH wH w 3d w1d w1d w2d w2 4P w1P w1H w1H w1<br />
5P w2P w2H w2H w2 6I sE sE sR s 8s wTbTbTb ICE c iS ib iD iz i<br />
Definition: Wet Bulb temperature, in degrees Celsius and tenths.<br />
Units: Celsius degrees.<br />
Method of Measurement: Psychrometer. The thermometers must be read as soon<br />
as possible after ventilation or whirling has stopped. Moisten the wet bulb muslin sleeve<br />
thoroughly, on all sides, with distilled water, or the purest water available (ordinary<br />
water contains dissolved substances which deposit on the wicking as it evaporates,<br />
causing the wet bulb to read to high). Change the wicking weekly, or more often if it<br />
becomes dirty or contaminated by salt spray.<br />
If using a sling, from the windward side of the ship, whirl the sling psychrometer at a<br />
rate of about 4 revolutions per second for about 1 minute. Read the thermometers<br />
immediately, then whirl for another 10 seconds, and read again. If the readings are<br />
unchanged, record these as your official temperatures. If the readings are different at<br />
the second reading, continue the whirling and reading until two successive sets of<br />
readings are the same. If using psychrometers in outdoor shelters, install one on each<br />
side of the vessel, and read from the windward side.<br />
For temperatures below 0°C, the muslin wicking should be covered with a thin coating<br />
of ice. After moistening the muslin with ice cold water, you should initiate the freezing<br />
of the water by touching the muslin with a piece of ice, snow, or other cold object.<br />
This may need to be done up to a half hour before observation time, to allow enough<br />
time for the ice coating to form. Do not allow the coating of ice on the wet bulb to<br />
become too thick — this will result in an incorrect reading. If ice is building up,<br />
immerse the wet bulb in a small container of warm water to reduce the ice.<br />
How to Code: The code is direct reading in Celsius degrees.<br />
Examples: 11.6°C measured: T bT bT b = 116 and s w = 0<br />
3.2°C measured: T bT bT b = 032 and s w = 0<br />
–4.8°C computed: T bT bT b = 048 and s w = 6<br />
NWSOH No. 1 2-92 May 2010
<strong>Ship</strong>s Synoptic Code and <strong>Observing</strong> Methods<br />
Remarks: If possible, shield the psychrometer from precipitation and spray, and from<br />
the direct rays of the sun by whirling in the shade. When reading a thermometer, make<br />
sure your eye is level with the end of the mercury column.<br />
The wet bulb thermometer works on the principle that water evaporating from the<br />
muslin wicking absorbs (removes) heat from the thermometer bulb and mercury.<br />
Whirling therefore lowers the temperature of the wet bulb thermometer. The<br />
difference between the readings of the dry and wet bulb thermometers is called the<br />
depression of the wet bulb.<br />
When the air is very dry, containing little moisture, evaporation will be rapid, and the<br />
depression of the wet bulb will be quite large. If the air is very moist, evaporation from<br />
the muslin will be slight, and the depression of the wet bulb will be small. At sea, the<br />
depression is seldom more than 6°C.<br />
MUSLIN<br />
WICKING<br />
A sling psychrometer.<br />
NWSOH No. 1 2-93 May 2010
<strong>Ship</strong>s Synoptic Code and <strong>Observing</strong> Methods<br />
c i, Concentration or Arrangement of Sea Ice<br />
ICE, Indicator for Sea Ice Concentration<br />
SECTION 0 — IDENTIFICATION DATA<br />
BBXX D . . . . D YYGGi w 99L aL aL a Q cL oL oL oL o<br />
SECTION 1 — METEOROLOGICAL DATA<br />
i Ri xhVV Nddff 00fff 1s nTTT 2s nT dT dT d<br />
4PPPP 5appp 7wwW 1W 2 8N hC LC MC H<br />
SECTION 2 — OCEANOGRAPHIC DATA<br />
222D sv s 0s sT wT wT w 2P wP wH wH w 3d w1d w1d w2d w2 4P w1P w1H w1H w1<br />
5P w2P w2H w2H w2 6I sE sE sR s 8s wT bT bT b ICE ciS ib iD iz i<br />
Definition: Concentration or arrangement of sea ice<br />
Units:<br />
Method of Measurement: Visual determination.<br />
How to Code: Code in accordance with the table on the following page.<br />
Remarks: Choose the coding which describes the condition which is of the most<br />
navigational significance.<br />
LLeeaadd:: Any ffrraaccttuurree or pass-way through sea ice which is navigable by surface vessels.<br />
PPaacckk iiccee: Term used in a wide sense to include any area of sseeaa iiccee, other than ffaasstt<br />
iiccee, no matter what form it takes or how it is disposed.<br />
SSeeaa iiccee: Any formed ice found at sea which has originated from freezing of sea water .<br />
Code Figures<br />
Pack Ice Coverage<br />
Open Water
Code Figures<br />
<strong>Ship</strong>s Synoptic Code and <strong>Observing</strong> Methods<br />
Code for Concentration or Arrangement of Sea Ice, c i<br />
0 No sea ice in sight<br />
1 <strong>Ship</strong> in open lead more than 1<br />
nautical mile wide, or ship in fast<br />
ice with boundary beyond limit of<br />
visibility<br />
2 Sea ice present in concentrations<br />
less than 3 ⁄10 ( 3 ⁄8); open water or<br />
very open pack ice<br />
4 6 3 6 3 ⁄10 to ⁄10 ( ⁄8 to less than ⁄8); open<br />
pack ice<br />
7 8 6 7 4 ⁄10 to ⁄10 ( ⁄8 to less than ⁄8); close<br />
pack ice<br />
9 10 7 5 ⁄10 or more, but not ⁄10 ( ⁄8 to less<br />
than 8 ⁄8); very close pack ice<br />
6 Strips and patches of pack ice<br />
with open water between<br />
7 Strips and patches of close or<br />
very close pack ice with areas of<br />
lesser concentration between<br />
8 Fast ice with open water, very<br />
open or open pack ice to seaward<br />
of the ice boundary<br />
9 Fast ice with close or very close<br />
pack ice to seaward of the ice<br />
boundary<br />
/ Unable to report, because of<br />
darkness, lack of visibility, or<br />
because ship is more than<br />
1<br />
⁄2 nautical mile away from the<br />
ice edge.<br />
Sea ice<br />
concentratio<br />
n is uniform<br />
in the<br />
observation<br />
area<br />
Sea ice<br />
concentratio<br />
n is not<br />
uniform in<br />
the observation<br />
area<br />
<strong>Ship</strong> in ice<br />
or within 1/2<br />
nautical<br />
mile of the<br />
ice edge<br />
NWSOH No. 1 2-95 May 2010
<strong>Ship</strong>s Synoptic Code and <strong>Observing</strong> Methods<br />
S i, Sea Ice Stage of Development<br />
SECTION 0 — IDENTIFICATION DATA<br />
BBXX D . . . . D YYGGi w 99L aL aL a Q cL oL oL oL o<br />
SECTION 1 — METEOROLOGICAL DATA<br />
i Ri xhVV Nddff 00fff 1s nTTT 2s nT dT dT d<br />
4PPPP 5appp 7wwW 1W 2 8N hC LC MC H<br />
SECTION 2 — OCEANOGRAPHIC DATA<br />
222D sv s 0s sT wT wT w 2P wP wH wH w 3d w1d w1d w2d w2 4P w1P w1H w1H w1<br />
5P w2P w2H w2H w2 6I sE sE sR s 8s wT bT bT b ICE c iSib iD iz i<br />
Definition: Stage of Development of Sea ice<br />
Units:<br />
Method of Measurement: Visual determination<br />
How to Code:<br />
Code Figures<br />
Code for Stage of Development of Sea Ice, S i<br />
0 New ice only (frazil ice, grease ice, slush ice, shuga)<br />
1 Nilas or ice rind, less than 10 cm thick<br />
2 Young ice (grey ice, grey-white ice), 10-30 cm thick<br />
3 Predominantly new and/or young ice with some first year ice<br />
4 Predominantly thin first-year ice with some new and/or young ice<br />
5 All thin first-year ice (30-70 cm thick)<br />
6 Predominantly medium first-year ice (70-120 cm thick) and thick<br />
first-year ice (more than 120 cm thick) with some thinner (younger)<br />
first-year ice<br />
7 All medium and thick first-year ice<br />
8 Predominantly medium and thick first-year ice with some old ice<br />
(usually more than 2 meters thick)<br />
9 Predominantly old ice<br />
/ Unable to report, because of darkness, lack of visibility , or because<br />
only ice of land origin is visible, or because ship is more than<br />
1 ⁄2 nautical mile away from ice edge<br />
Remarks: The code figures represent a series of increasing navigational difficulties<br />
for any concentration of sea ice.<br />
NWSOH No. 1 2-96 May 2010
i, Ice of Land Origin<br />
<strong>Ship</strong>s Synoptic Code and <strong>Observing</strong> Methods<br />
SECTION 0 — IDENTIFICATION DATA<br />
BBXX D . . . . D YYGGi w 99L aL aL a Q cL oL oL oL o<br />
SECTION 1 — METEOROLOGICAL DATA<br />
i Ri xhVV Nddff 00fff 1s nTTT 2s nT dT dT d<br />
4PPPP 5appp 7wwW 1W 2 8N hC LC MC H<br />
SECTION 2 — OCEANOGRAPHIC DATA<br />
222D sv s 0s sT wT wT w 2P wP wH wH w 3d w1d w1d w2d w2 4P w1P w1H w1H w1<br />
5P w2P w2H w2H w2 6I sE sE sR s 8s wT bT bT b ICE c iS ibiD iz i<br />
Definition: Ice of land origin<br />
Units:<br />
Method of Measurement: Visual determination.<br />
How to Code:<br />
Code Figures<br />
Code for Ice of Land Origin, b i<br />
0 No ice of land origin<br />
1 1-5 icebergs, no growlers or bergy bits<br />
2 6-10 icebergs, no growlers or bergy bits<br />
3 11-20 icebergs, no growlers or bergy bits<br />
4 Up to and including 10 growlers and bergy bits - no icebergs<br />
5 More than 10 growlers and bergy bits - no icebergs<br />
6 1-5 icebergs with growlers and bergy bits<br />
7 6-10 icebergs with growlers and bergy bits<br />
8 11-20 icebergs with growlers and bergy bits<br />
9 More than 20 icebergs with growlers and bergy bits - a major hazard<br />
to navigation<br />
/ Unable to report, because of darkness, lack of visibility , or because<br />
only sea ice is visible<br />
Remarks: If only ice of land origin is present, the ice group is coded as 0/b i/0; e.g.<br />
0/2/0 would mean 6-10 icebergs in sight, but no sea ice.<br />
NWSOH No. 1 2-97 May 2010
<strong>Ship</strong>s Synoptic Code and <strong>Observing</strong> Methods<br />
D i, Bearing of Principal Ice Edge<br />
SECTION 0 — IDENTIFICATION DATA<br />
BBXX D . . . . D YYGGi w 99L aL aL a Q cL oL oL oL o<br />
SECTION 1 — METEOROLOGICAL DATA<br />
i Ri xhVV Nddff 00fff 1s nTTT 2s nT dT dT d<br />
4PPPP 5appp 7wwW 1W 2 8N hC LC MC H<br />
SECTION 2 — OCEANOGRAPHIC DATA<br />
222D sv s 0s sT wT wT w 2P wP wH wH w 3d w1d w1d w2d w2 4P w1P w1H w1H w1<br />
5P w2P w2H w2H w2 6I sE sE sR s 8s wT bT bT b ICE c iS ib iDiz i<br />
Definition: True bearing of principal sea ice edge.<br />
Units:<br />
Method of Measurement: Visual determination<br />
How to Code:<br />
Code Figures<br />
Code for True Bearing of Principal Ice Edge, D i<br />
0 <strong>Ship</strong> in shore or flaw lead<br />
1 Principal ice edge towards NE<br />
2 Principal ice edge towards E<br />
3 Principal ice edge towards SE<br />
4 Principal ice edge towards S<br />
5 Principal ice edge towards SW<br />
6 Principal ice edge towards W<br />
7 Principal ice edge towards NW<br />
8 Principal ice edge towards N<br />
9 Not determined (ship in ice)<br />
/ Unable to report, because of darkness, lack of visibility , or because<br />
only ice of land origin is visible<br />
Remarks: The bearing of the principal ice edge reported should be to the closest<br />
part of that edge.<br />
NWSOH No. 1 2-98 May 2010
<strong>Ship</strong>s Synoptic Code and <strong>Observing</strong> Methods<br />
z i, Present Sea Ice Situation and<br />
Three Hour Trend<br />
SECTION 0 — IDENTIFICATION DATA<br />
BBXX D . . . . D YYGGi w 99L aL aL a Q cL oL oL oL o<br />
SECTION 1 — METEOROLOGICAL DATA<br />
i Ri xhVV Nddff 00fff 1s nTTT 2s nT dT dT d<br />
4PPPP 5appp 7wwW 1W 2 8N hC LC MC H<br />
SECTION 2 — OCEANOGRAPHIC DATA<br />
222D sv s 0s sT wT wT w 2P wP wH wH w 3d w1d w1d w2d w2 4P w1P w1H w1H w1<br />
5P w2P w2H w2H w2 6I sE sE sR s 8s wT bT bT b ICE c iS ib iD izi<br />
Definition: Present sea ice situation and trend of conditions over preceeding three<br />
hours<br />
Units:<br />
Method of Measurement: Visual determination.<br />
How to Code:<br />
Code Figures<br />
4<br />
5<br />
6<br />
7<br />
8<br />
9<br />
Code for Present Ice Situation and Three Hour Trend, z i<br />
0 <strong>Ship</strong> in open water with floating ice in sight<br />
1 <strong>Ship</strong> in easily penetrable ice; conditions improving<br />
2 <strong>Ship</strong> in easily penetrable ice; conditions not changing<br />
3 <strong>Ship</strong> in easily penetrable ice; conditions worsening<br />
<strong>Ship</strong> in ice difficult to penetrate; conditions improving<br />
<strong>Ship</strong> in ice difficult to penetrate; conditions not changing<br />
/<br />
Ice forming and floes freezing together <strong>Ship</strong> in<br />
Ice under slight pressure<br />
Ice under moderate or severe pressure<br />
<strong>Ship</strong> beset<br />
Unable to report, because of darkness,<br />
lack of visibility<br />
ice difficult to<br />
penetrate and<br />
conditions<br />
worsening<br />
<strong>Ship</strong><br />
in ice<br />
Remarks: Code figures 6-9 represents worsening ice conditions difficult for the ship<br />
to penetrate.<br />
NWSOH No. 1 2-99 May 2010
<strong>Ship</strong>s Synoptic Code and <strong>Observing</strong> Methods<br />
Ice Term Definitions<br />
AAnncchhoorr--iiccee: Submerged ice attached or anchored to the bottom, irrespective of the<br />
nature of its formation.<br />
BBeerrggyy BBiitt:: A large piece of floating ggllaacciieerr iiccee, generally showing less than 5 m above<br />
sea level but more than 1 m and normally about 100-300 m 2<br />
in area.<br />
BBeesseett: Situation of a vessel surrounded by ice and unable to move.<br />
BBrraasshh iiccee: Accumulations of ffllooaattiinngg iiccee made up of fragments not more than 2 m<br />
across, the wreckage of other forms of ice.<br />
CCaallvviinngg: The breaking away of a mass of ice from an iiccee wwaallll, iccee ffrroonntt, or iicceebbeerrgg.<br />
CClloossee ppaacckk iiccee: PPaacckk iiccee in which the concentration is 7/10 to 8/10 (6/8 to less than<br />
7/8), composed of ffllooeess mostly in contact.<br />
CCoommppaacctteedd iiccee eeddggee: Close, clear-cut iiccee eeddggee compacted by wind or current; usually<br />
on the windward side of an area of ppaacckk iiccee.<br />
CCoommppaacctt ppaacckk iiccee: PPaacckk iiccee in which the concentration is 10/10 (8/8) and no water is<br />
visible.<br />
CCoonncceennttrraattiioonn: The ratio expressed in tenths or oktas describing the mean areal<br />
density of ice in a given area.<br />
CCoonnssoolliiddaatteedd ppaacckk iiccee: PPaacckk iiccee in which the concentration is 10/10 (8/8) and the<br />
ffllooeess are frozen together.<br />
DDaarrkk nniillaass: NNiillaass which is under 5 cm in thickness and is very dark in color .<br />
DDiiffffuussee iiccee eeddggee: Poorly defined iiccee eeddggee limiting an area of dispersed ice; usually on<br />
the leeward side of an area of ppaacckk iiccee.<br />
FFaasstt iiccee: SSeeaa iiccee which forms and remains fast along the coast, where it is attached to<br />
the shore, to an iiccee wwaallll, to an iiccee ffrroonntt, between shoals or grounded iicceebbeerrggss. Vertical<br />
fluctuation may be observed during changes of sea level. FFaasstt iiccee may be formed in situ<br />
from sea water or by freezing of pack ice of any age to the shore, and it may extend a<br />
few meters or several hundred kilometers from the coast. Fast ice may be more than<br />
one year old and may then be prefixed with the appropriate age category (old, secondyear,<br />
or multi-year). If it is thicker than about 2 m above sea level it is called iiccee sshheellff.<br />
FFiinnggeerr rraaffttiinngg: Type of rraaffttiinngg whereby interlocking thrusts are formed, each ffllooee<br />
thrusting ‘fingers’ alternately over and under the other. Common in nniillaass and ggrreeyy iiccee.<br />
FFiirrsstt--yyeeaarr iiccee: SSeeaa iiccee of not more than one winter ’s growth, developing from yyoouunngg<br />
iiccee: thickness 30 cm- 2 m. May be subdivided into tthhiinn ffiirrsstt--yyeeaarr iiccee//wwhhiittee iiccee,<br />
mmeeddiiuumm ffiirrsstt--yyeeaarr iiccee, and tthhiicckk ffiirrsstt--yyeeaarr iiccee.<br />
FFllaaww LLeeaadd: A passage-way between ppaacckk iiccee and ffaasstt iiccee which is navigable by<br />
surface vessels.<br />
FFllooaattiinngg iiccee: Any form of ice found floating in water . The principal kinds of floating ice<br />
are llaakkee iiccee, rriivveerr iiccee, and sseeaa iiccee, which forms by the freezing of water at the surface,<br />
and ggllaacciieerr iiccee (iiccee ooff llaanndd oorriiggiinn) formed on land or in an iiccee sshheellff. The concept<br />
includes ice that is stranded or grounded.<br />
NWSOH No. 1 2-100 May 2010
<strong>Ship</strong>s Synoptic Code and <strong>Observing</strong> Methods<br />
FFllooee: Any relatively flat piece of sseeaa iiccee 20 m or more across. Floes are sub-divided<br />
according to horizontal extent as follows:<br />
Giant: Over 5.4 n. mile across<br />
Vast: 1.1-5.4 n. mile across<br />
Big: 500-2000 m across<br />
Medium: 100-500 m across<br />
Small: 20-100 m across<br />
FFllooeebbeerrgg: A massive piece of sea ice composed of a hummock, or a group of<br />
hummocks, frozen together and separated from any ice surroundings. It may float up to<br />
5 m above sea level.<br />
FFrraaccttuurree: Any break or rupture through vveerryy cclloossee ppaacckk iiccee, ccoommppaacctt ppaacckk iiccee,<br />
ccoonnssoolliiddaatteedd ppaacckk iiccee, ffaasstt iiccee, or a single ffllooee resulting from deformation processes.<br />
Fractures may contain bbrraasshh iiccee and/or be covered with nniillaass and/or yyoouunngg iiccee.<br />
Length may vary from a few meters to many nautical miles.<br />
FFrraazziill iiccee: Fine spicules or plates of ice, suspended in water .<br />
GGllaacciieerr: A mass of snow and ice continuously moving from higher to lower ground or , if<br />
afloat, continuously spreading. The principal forms of glaciers are: inland ice sheets, iiccee<br />
sshheellvveess, iiccee ssttrreeaammss, ice caps, ice piedmonts, cirque glaciers and various types of<br />
mountain (valley) glaciers.<br />
GGllaacciieerr bbeerrgg: An irregularly shaped icceebbeerrgg.<br />
GGllaacciieerr iiccee: Ice in, or originating from, a ggllaacciieerr, whether on land or floating on the sea<br />
as iicceebbeerrggss, bbeerrggyy bbiittss, or ggrroowwlleerrss.<br />
GGrreeaassee iiccee: A later stage of freezing than ffrraazziill iiccee when the crystals have coagulated<br />
to form a soupy layer on the surface. Grease ice reflects little light, giving the sea a matt<br />
appearance.<br />
GGrreeyy iiccee: YYoouunngg iiccee 10-15 cm thick. Less elastic than nniillaass and breaks on swell.<br />
Usually rraaffttss under pressure.<br />
GGrreeyy--wwhhiittee iiccee: YYoouunngg iiccee 15-30 cm thick. Under pressure likely to ridge than to raft.<br />
GGrroowwlleerr:: Smaller piece of ice than a bbeerrggyy bbiitt or ffllooeebbeerrgg, often transparent but<br />
appearing green or almost black in color, extending less than 1 m above the sea surface<br />
and normally occupying an area of about 20m 2 .<br />
HHuummmmoocckk: A hillock of broken ice which has been forced upwards by pressure. May be<br />
fresh or weathered. The submerged volume of broken ice under the hummock, forced<br />
downwards, is termed a bummock.<br />
IIcceebbeerrgg: A massive piece of ice greatly varying in shape, more than 5 m above sea<br />
level, which has broken away from a ggllaacciieerr, and which may be afloat or aground.<br />
Icebergs may be described as tabular, domed-shaped, sloping, pinnacled, weathered or<br />
ggllaacciieerr bbeerrggss.<br />
IIccee bboouunnddaarryy: The demarcation at any given time between ffaasstt iiccee and ppaacckk iiccee or<br />
between areas of ppaacckk iiccee of different concentrations (ccff.. iiccee eeddggee).<br />
IIccee eeddggee: The demarcation at any given time between the open sea and sseeaa iiccee of any<br />
kind, whether fast or drifting. It may be termed ccoommppaacctteedd or ddiiffffuusseedd (cf. ice boundary).<br />
IIccee ffrroonntt: The vertical cliff forming the seaward face of an iiccee sshheellff or other floating<br />
glacier varying in height from 2 to 50 m or more above sea level (cf. ice wall).<br />
NWSOH No. 1 2-101 May 2010
<strong>Ship</strong>s Synoptic Code and <strong>Observing</strong> Methods<br />
IIccee ooff llaanndd oorriiggiinn: Ice formed on land or in an iiccee sshheellff, found floating in water. The<br />
concept includes ice that is stranded or grounded.<br />
IIccee ppaattcchh: An area of ppaacckk iiccee less than 5.4 n. mile across.<br />
IIccee rriinndd: A brittle shiny crust of ice formed on a quiet surface by direct freezing or from<br />
ggrreeaassee iiccee, usually in water or low salinity. Thickness to about 5 cm. Easily broken by<br />
wind or swell, commonly breaking in rectangular pieces.<br />
IIccee sshheellff: A floating ice sheet of considerable thickness showing 2-50 m or more above<br />
sea level, attached to the coast. Usually of great horizontal extent and with a level or<br />
gently undulating surface. Nourished by annual snow accumulation and often also by the<br />
seaward extension of land ggllaacciieerrss. Limited areas may be ground. The seaward edge is<br />
termed an iiccee ffrroonntt..<br />
IIccee ssttrreeaamm: Part of an inland ice sheet in which the ice flows more rapidly and not<br />
necessarily in the same direction as the surrounding ice. The margins are sometimes<br />
clearly marked by a change in direction of the surface slope but may be indistinct.<br />
IIccee uunnddeerr pprreessssuurree: Ice in which deformation processes are actively occurring and<br />
hence a potential impediment or danger to shipping.<br />
IIccee wwaallll:: An ice cliff forming the seaward margin of a ggllaacciieerr which is not afloat. An ice<br />
wall is aground, the rock basement being at or below sea level (cf. iiccee ffrroonntt).<br />
LLaakkee iiccee: Ice formed on a lake, regardless of observed location.<br />
LLeeaadd:: Any ffrraaccttuurree or pass-way through sea ice which is navigable by surface vessels.<br />
LLiigghhtt nniillaass: NNiillaass which is more than 5 cm in thickness and rather lighter in color than<br />
dark nilas.<br />
MMeeddiiuumm ffiirrsstt--yyeeaarr iiccee: FFiirrsstt--yyeeaarr iiccee 70-120 cm thick.<br />
MMuullttii--yyeeaarr iiccee: OOlldd iiccee up to 3 m or more thick which has survived at least two<br />
summer’s melt. HHuummmmoocckkss even smoother than in sseeccoonndd--yyeeaarr iiccee, and the ice is<br />
almost salt-free. Color, where bare, is usually blue. Melt pattern consists of large interconnecting<br />
irregular ppuuddddlleess and a well-developed drainage system.<br />
NNeeww iiccee: A general term for recently formed ice which includes ffrraazziill iiccee, ggrreeaassee iiccee,<br />
sslluusshh, and sshhuuggaa. These types of ice are composed of ice crystals which are only<br />
weakly frozen together (if at all) and have a definite form only while they are afloat.<br />
NNiillaass: A thin elastic crust of ice, easily bending on waves and swell and under pressure,<br />
thrusting in a pattern of interlocking ‘fingers’ (ffiinnggeerrss rraaffttiinngg). Has a matt surface and is<br />
up to 10 cm in thickness. May be subdivided into ddaarrkk nniillaass and lliigghhtt nniillaass..<br />
OOlldd iiccee: SSeeaa iiccee which has survived at least one summer ’s melt. Most topographic<br />
features are smoother than ffiirrsstt--yyeeaarr iiccee. May be subdivided into sseeccoonndd--yyeeaarr and<br />
mmuullttii--yyeeaarr iiccee.<br />
OOppeenn ppaacckk iiccee: PPaacckk iiccee in which the ice concentration is 4/10 to 6/10 (3/8 to less than<br />
6/8), with many lleeaaddss and ppoollyynnyyaass, and the ffllooeess are generally not in contact with one<br />
another.<br />
OOppeenn wwaatteerr: A large area freely navigable water in which sseeaa iiccee is present in<br />
concentrations less than 1/10 (1/8). There may be iiccee ooff llaanndd oorriiggiinn present, although<br />
the total concentration of all ice shall not exceed 1/10 (1/8).<br />
NWSOH No. 1 2-102 May 2010
<strong>Ship</strong>s Synoptic Code and <strong>Observing</strong> Methods<br />
PPaacckk iiccee: Term used in a wide sense to include any area of sseeaa iiccee, other than ffaasstt<br />
iiccee, no matter what form it takes or how it is disposed.<br />
PPoollyynnyyaa: Any non-linear shaped opening in ice. Polynyas may contain bbrraasshh iiccee and/or<br />
be covered with nneeww iiccee, nniillaass or yyoouunngg iiccee; submariners refer to these as skylights.<br />
Sometimes the polynya is limited on one side by the coast and is called a shore polynya,<br />
or by fast ice and is called a flaw polynya. If it recurs in the same position every year , it<br />
is called a recurring polynya.<br />
PPuuddddllee: An accumulation on ice of melt-water, mainly due to melting snow, but in the<br />
more advanced stages also to the melting of ice. Initial stage consists of patches of<br />
melted snow.<br />
RRaaffttiinngg: Pressure process whereby one piece of ice overrides another . Most common<br />
in nneeww and yyoouunngg iiccee. (cf. ffiinnggeerr rraaffttiinngg).<br />
RRiiddggiinngg: The pressure process in which sea ice is forced into ridges, i.e. a line or wall<br />
of broken ice forced up by pressure.<br />
RRiivveerr iiccee: Ice formed on a river, regardless of observed location.<br />
SSeeaa iiccee: Any formed ice found at sea which has originated from freezing of sea water .<br />
SSeeccoonndd--yyeeaarr iiccee: OOlldd iiccee which has survived only one summer ’s melt. Because it<br />
thicker and less dense than ffiirrsstt--yyeeaarr iiccee, it stands higher out of the water . In contrast to<br />
mmuullttii--yyeeaarr iiccee, summer melting produces a regular pattern of numerous small puddles.<br />
Bare patches and ppuuddddlleess are usually greenish-blue.<br />
SShhuuggaa: An accumulation of spongy white ice lumps, a few centimeters across; they are<br />
formed from ggrreeaassee iiccee or sslluusshh and sometimes from aanncchhoorr--iiccee rising to the surface.<br />
SSlluusshh: Snow which is saturated and mixed with water on land or ice surfaces, or as a<br />
viscous floating mass in water after a heavy snowfall.<br />
SSttrriipp: Long narrow area of ppaacckk iiccee about 0.5 n. mile or less in width, usually<br />
composed of small fragments detached from the main mass of ice, and run together<br />
under the influence of wind, swell, or current.<br />
TTaabbuullaarr bbeerrgg: A flat-topped iicceebbeerrgg. Most tabular bergs form by ccaallvviinngg from an iccee<br />
sshheellff and snow horizontal banding.<br />
TThhiicckk ffiirrsstt--yyeeaarr iiccee: FFiirrsstt--yyeeaarr iiccee over 120 cm thick.<br />
TThhiinn ffiirrsstt--yyeeaarr iiccee//wwhhiittee iiccee: FFiirrsstt--yyeeaarr iiccee 30-70 cm thick.<br />
VVeerryy cclloossee ppaacckk iiccee: PPaacckk iiccee in which the concentration is 9/10 to less than 10/10<br />
(7/8 to less than 8/8).<br />
VVeerryy ooppeenn ppaacckk iiccee: PPaacckk iiccee in which the concentration is 1/10 to 3/10 (1/8 to less<br />
than 3/8) and water preponderates over ice.<br />
YYoouunngg iiccee: Ice in the transition stage between nniillaass and ffiirrsstt--yyeeaarr iiccee, 10-30 cm in<br />
thickness. May be subdivided into ggrreeyy iiccee and ggrreeyy--wwhhiittee iiccee.<br />
NWSOH No. 1 2-103 May 2010
Chapter 3 — Transmitting the Observation<br />
IMPORTANCE OF TIMELY TRANSMISSION<br />
Your weather observations are used by meteorologists preparing weather forecasts for<br />
coastal, offshore, and high seas areas. They are essential to the production of weather<br />
charts and analyses for marine areas. It is very important that observations be<br />
transmitted quickly. It is best to transmit reports within moments after the observation<br />
has been taken — on or within a very short time after the reporting hour. This<br />
generally ensures that the report will arrive in time for use by the marine forecaster. If<br />
ship operations prevent transmission at or near the reporting hour, send the report as<br />
soon as you can, but no later than 3 hours after the time of observation.<br />
STATIONS ACCEPTING VOS WEATHER OBSERVATIONS<br />
Weather observations sent by ships participating in the VOS program are sent at no<br />
cost to the ship except as noted.<br />
The stations listed accept weather observations which enter an automated system at<br />
National Weather Service headquarters. This system is not intended for other types of<br />
messages. To communicate with NWS personnel, see phone numbers and e-mail<br />
addresses at the beginning of this manual.<br />
NWSOH No. 1 3-1 May 2010
Transmitting the Observation<br />
INMARSAT<br />
INMARSAT “B”<br />
Follow the instructions with your INMARSAT terminal for sending a telex message.<br />
Use Special Access Code 41 (except when using the AMVER/SEAS software in<br />
compressed binary format with INMARSAT “C” units), and do not request a<br />
confirmation when sending. No cost is involved with this transmission.<br />
Below is a typical procedure for using an INMARSAT “B” terminal.<br />
1. Select appropriate Land Earth Station Identity (LES-ID).<br />
*See table below.<br />
2. Select routine priority.<br />
3. Select duplex telex channel.<br />
4. Initiate the call. Wait for the GA+ signal.<br />
5. Select the dial code for meteorological reports, 41+.<br />
6. Upon receipt of our answerback, NWS OBS MHTS, transmit the weather<br />
message starting with BBXX and the ship’ s call sign. The message must<br />
be ended with 5 periods. Do not send any preamble.<br />
GA+<br />
41+<br />
NWS OBS MHTS<br />
BBXX WLXX 29003 99131 70808 41998 60909 10250 2021/<br />
4011/52003 71611 85264 22234 00261 20201 31100 40803.....<br />
The 5 periods indicate the end of the message, and must be included after<br />
each report. Do not request a confirmation.<br />
INMARSAT “C”<br />
All major INMARSAT “C” terminals have the ability to transmit the encoded weather<br />
observation (BBXX) with the Special Access Code 41. No cost is involved with this<br />
transmission. Do not request a confirmation when sending. The detailed instructions<br />
necessary to setup and address the Code 41 message and transmission instruction<br />
according to the different manufactures are listed on our Website at<br />
http://www.vos.noaa.gov in the VOS <strong>Ship</strong> Resource Page.<br />
* Land-Earth Station Identity (LES-ID) of U.S. Inmarsat Stations Accepting<br />
<strong>Ship</strong>s Weather (BBXX) and Oceanographic (JJYY) Reports<br />
Operator Service Station ID<br />
VIZADA<br />
VIZADA<br />
VIZADA<br />
B<br />
C<br />
C (AMVER/SEAS)<br />
AOR-W AOR-E IOR POR<br />
004<br />
004<br />
004<br />
004<br />
104<br />
104<br />
004<br />
304<br />
304<br />
004<br />
204<br />
204<br />
NWSOH No. 1 3-2 May 2010
Transmitting the Observation<br />
Some common mistakes include (1) failure to end the message with 5 periods when<br />
using INMARSAT “B”, (2) failure to include BBXX in the message preamble, (3)<br />
incorrectly coding the Date, Time, Latitude, Longitude, or quadrant of the globe, (4)<br />
requesting a confirmation (which increases cost to NWS).<br />
Using AMVER/SEAS Software<br />
The National Oceanic and Atmospheric Administration (<strong>NOAA</strong>) and the U.<br />
S. Coast Guard (USCG) have created software to assist Volunteer <strong>Observing</strong><br />
<strong>Ship</strong>s (VOS) in submitting weather reports to worldwide weather networks, and to<br />
participate in the Automated Mutual (assistance) Vessel Rescue (AMVER)<br />
system. The VOS program (SEAS) allows commercial ships around the world to return<br />
marine weather observations to the National Weather Service (at no charge to the<br />
vessel). The AMVER system allows ships to report their intended track so in the event<br />
of an emergency all available resources can be focused on aiding ship(s) in distress.<br />
The U.S. Coast Guard and <strong>NOAA</strong> pay all transmission costs, provided<br />
messages are sent to the INMARSAT C address specified in this user’s guide.<br />
Weather observations should be reported at 0000, 0600, 1200, and 1800 UTC.<br />
<strong>Ship</strong>s are also encouraged to submit reports at 0300, 0900, 1500 and 2100 UTC.<br />
Each weather observation is also processed as a position report then sent to the<br />
Coast Guard AMVER Center.<br />
A typical voyage utilizing the AMVER/SEAS~MET program would require the<br />
submission of an AMVER Sail Plan before departure, submission of Weather<br />
Observations four times per day and the submission of an Arrival Report. The U. S.<br />
Coast Guard updates their database with the position information from these reports,<br />
which allows them to identify vessels in the vicinity of a ship(s) in distress.<br />
<strong>Ship</strong>s that follow the same routes repeatedly have an additional benefit since Sail Plans<br />
can be stored in the computer system, recalled later to change the date and time of<br />
departure, rather than creating a new plan each time.<br />
Note: To obtain the AMVER/SEAS~Met software program contact a U.S.<br />
PMO listed at the beginning of this handbook. Visit our Website at<br />
http://www.vos.noaa.gov and click on AMVER/SEAS software on the left<br />
side of the page for more information.<br />
Common errors when using the AMVER/SEAS~Met software<br />
• Sending the compressed binary message via the Special Access Code 41.<br />
• Sending a plain text message via the AMVER/SEAS address.<br />
• Only VIZADA can accept the AMVER/SEAS messages in binary format.<br />
• Do not attempt to view the file with the Text Editor. (This will added unwanted<br />
characters to the message and corrupt the file)<br />
• Do not send from the Text Editor.<br />
• Send with the CONFIRMATION request turned OFF.<br />
NWSOH No. 1 3-3 May 2010
Transmitting the Observation<br />
Instructions for sending weather observations using Standard C and<br />
Code 41 (no charge to ship):<br />
JRC (JAPANESE RADIO COMPANY)<br />
STANDARD “C”<br />
********************************** IMPORTANT **********************************<br />
1. It is necessary to setup an address for the AMVER/SEAS message in the Standard C software.<br />
The SETUP procedure provided below is a one-time process to be completed on initial<br />
installation.<br />
2. The TRANSMISSION instructions provided below are to be followed each time a message is<br />
transmitted.<br />
3. These instructions may vary slightly, depending on the software version and hardware.<br />
*************************************************************************************<br />
SETUP AND TRANSMISSION PROCEDURES<br />
1. At the MAIN MENU select TRANSMIT. Select SPECIAL ACCESS NETWORK and Press<br />
.<br />
o The SPECIAL ACCESS NETWORK window appears. Press . Type in the<br />
word SEAS and Press .<br />
o Ensure FILE NAME: A:\MET.BIN (Or Other Appropriate File) By using A:\ you are<br />
telling the program to read the file on the diskette and not the text in editor .<br />
o Arrow down to LAND EARTH STATION and Press . Type in your<br />
LES/CES CODE corresponding to your ships location and press <br />
o AOR (W) Southbury 004<br />
o AOR (E) Southbury 104<br />
o POR Santa Paula 204<br />
o IOR Eik (Oslo) 304<br />
******************** No other stations can relay the messages ***********************<br />
o Ensure POSITION: OFF<br />
o Arrow down to CHARACTER CODE . Use the Arrow key to Highlight<br />
DATA. (Ensure this is completed, because you are transmitting a Binary<br />
message)<br />
o Arrow down to DELIVERY CONFIRMATION and Press . Use the Arrow<br />
Key to highlight OFF and Press .<br />
2. Press F1 (This will SEND THE MESSAGE).<br />
NOTE: The following are the FILE NAME for each particular message.<br />
—Meteorological Observation MET.BIN<br />
—Sail Plan SP.BIN<br />
—Arrival Report FR.BIN<br />
—Deviation Report DR.BIN<br />
—Administrative Report ADMIN.BIN<br />
NWSOH No. 1 3-4 May 2010
CODE 41<br />
Transmitting the Observation<br />
********************************** IMPORTANT **********************************<br />
1. It is necessary to set up an address for the Code 41 message in the Standard C software. The<br />
SETUP procedure provided below is a one-time process to be completed on initial installation.<br />
2. The TRANSMISSION instructions provided below are to be followed each time a message is<br />
transmitted.<br />
3. These instructions may vary slightly, depending on the software version and hardware.<br />
*************************************************************************************<br />
SETUP PROCEDURES<br />
1. At the MAIN MENU highlight EDIT and Press . A small window will appear in the<br />
middle of the Main Menu Screen. Select EDIT ASCII FILE and Press .<br />
2. A small window appears which is called EDIT ASCII FILE. At the cursor enter a file name:<br />
“WEATHER OBS” and Press .<br />
3. The next screen will allow you to EDIT a message. Type in your Meteorological Observation in<br />
the proper format. (BBXX). Press F9 (This SAVES the information). Press ESC (Go back to Main<br />
Menu).<br />
TRANSMISSION PROCEDURES<br />
1. At the MAIN MENU select TRANSMIT. Select SPECIAL ACCESS NETWORK. and Press<br />
.<br />
o The SPECIAL ACCESS NETWORK window appears. Press . Type in the<br />
number “41” and Press .<br />
o Arrow down to LAND EARTH STATION and Press . Type in your<br />
LES/CES ID and Press . (Your LES/CES ID will be determined by your<br />
location in relation to the FOOT PRINT of the satellite.)<br />
o Arrow down to DELIVERY CONFIRMATION and Press . Use the Arrow<br />
Key to highlight OFF and Press .<br />
2. Press F1 (This will SEND THE MESSAGE).<br />
o When completing the Next Observation go to EDIT the ASCII FILE and EDIT the<br />
previous Observation BBXX and SAVE the FILE and SEND the message through<br />
the SPECIAL ACCESS NETWORK.<br />
THRANE AND THRANE<br />
STANDARD “C”<br />
********************************** IMPORTANT **********************************<br />
1. It is necessary to setup an address for the AMVER/SEAS message in the Standard C software.<br />
The SETUP procedure provided below is a one-time process to be completed on initial<br />
installation.<br />
2. The TRANSMISSION instructions provided below are to be followed each time a message is<br />
transmitted.<br />
3. These instructions may vary slightly, depending on the software version and hardware.<br />
*************************************************************************************<br />
NWSOH No. 1 3-5 May 2010
Transmitting the Observation<br />
SETUP PROCEDURES<br />
1. At the MAIN MENU highlight APPLICATION option and Press . Select ADDRESS BOOK and<br />
Press . Select NEW in Address Book and Press .<br />
2. At the EDIT ADDRESS section type in NEW NAME of file. (Example name: AMVER/SEAS and<br />
Press <br />
o There is a DOT in front of the TELEX [ (.) Telex] located on the right side of the<br />
screen. Move the DOT to SPECIAL by using the Arrow key. Once the SPECIAL is<br />
Highlighted, press the SPACE BAR. (This will place the DOT in the SPECIAL<br />
Address)<br />
o The terminal defaults to 7 Bit for all services, use the space bar to select 8-BIT.<br />
Press <br />
o At the Bottom of the screen a Box will appear to enter the SPECIAL ACCESS<br />
CODE. Type in the word SEAS in this field and Press .<br />
o Tab to “OK”. Press . (The Address is now saved)<br />
o Press ESC twice to reach the Main Menu.<br />
SETUP AND TRANSMISSION PROCEDURES<br />
1. At the MAIN MENU highlight TRANSMIT and Press . Press the space bar to open<br />
the Address book with the address created during setup.<br />
2. Highlight AMVER/SEAS address file and Press <br />
3. The cursor should be on the Land Station field. Press the space bar to view the station list.<br />
Highlight the correct CES/LES and Press to accept.<br />
4. AOR (W) Southbury 004<br />
5. AOR (E) Southbury 104<br />
6. POR Santa Paula 204<br />
7. IOR Eik (Oslo) 304<br />
******************** No other stations can relay the messages ***********************<br />
8. Tab the cursor to the “TEXT IN EDITOR” field which will be marked with an “X”. Press the<br />
space bar to remove the “X” and the word “FILE” will appear.<br />
9. Highlight the FILE option and press the space bar to display a list of files located on the<br />
diskette. Highlight the appropriate file name and press .<br />
10. Highlight the REQUEST CONFIRMATION option and press the space bar to remove the “X”.<br />
Move the cursor to SEND and press .<br />
NOTE: The following are the FILE NAME for each particular message.<br />
CODE 41<br />
—Meteorological Observation MET.BIN<br />
—Sail Plan SP.BIN<br />
—Arrival Report FR.BIN<br />
—Deviation Report DR.BIN<br />
—Administrative Report ADMIN.BIN<br />
********************************** IMPORTANT **********************************<br />
1. It is necessary to setup an address for the Code 41 message in the Standard C software. The<br />
SETUP procedure provided below is a one-time process to be completed on initial installation.<br />
2. The TRANSMISSION instructions provided below are to be followed each time a message is<br />
transmitted.<br />
3. These instructions may vary slightly, depending on the software version and hardware.<br />
*************************************************************************************<br />
NWSOH No. 1 3-6 May 2010
Transmitting the Observation<br />
SETUP PROCEDURES<br />
1. At the MAIN MENU highlight APPLICATION option and Press . Select ADDRESS<br />
BOOK and Press . Select NEW in Address Book and Press .<br />
2. At the EDIT ADDRESS section type in NEW NAME of file. (Example name: WEATHER OBS)<br />
and Press .<br />
o There is a DOT in front of the TELEX [ () Telex] located on the right side of the<br />
screen.<br />
o Move the DOT to SPECIAL by using the Arrow key. Once the SPECIAL is<br />
Highlighted Press the SPACE BAR. (This will place the DOT in the SPECIAL<br />
Address)<br />
o At the Bottom of the screen a Box will appear to enter the SPECIAL ACCESS<br />
CODE. Enter the number 41 and Press
Transmitting the Observation<br />
2. Select NO.9 (CONFIGURATION) and Press . Select NO.1 (STATION LIST) and<br />
press . Arrow down to a blank file number at the end of the list and Press<br />
.<br />
3. A window appears asking for: Use when line is highlighted to type in information and<br />
press to accept typed in data. Use arrow keys to get to next line.<br />
o Station Name: Enter—-AMVER/SEAS<br />
o Arrow down to DESTINATION TYPE: Select SPEC<br />
o Arrow down to STATION ID: Enter in the word SEAS. Leave the Prefix and Country<br />
Code Blank.<br />
o Arrow down to REMARKS: Enter AMVER/SEAS,/B> and press .<br />
4. Press ESC until you return to the FURUNO MAIN MENU.<br />
1. Insert the diskette with the BINARY message that was generated with the AMVER/SEAS<br />
program.<br />
2. Press F3 (TRANSMIT). Select NO. 1 (TRANSMIT MSG) and Press . The Transmit<br />
Message window appears.<br />
o Arrow DOWN to MESSAGE FILE and Press . This will allow you to see<br />
the files stored on the diskette. Select the APPROPRIATE FILE message and<br />
Press .<br />
o Arrow DOWN to STATION NAME and Press . Select STATION<br />
AMVER/SEAS and Press .<br />
o Arrow DOWN to CES/LES ID and Press . Select the proper LES/CES<br />
and Press . AOR (W) Southbury 004, AOR (E) Southbury 104, POR<br />
Santa Paula 204 and IOR Eik (Oslo) 304.<br />
o Arrow DOWN to OPTION and Press . Arrow down to CONFIRMATION<br />
and select OFF and Press . Arrow down to CODE and Press<br />
. Select the word DATA and Press . (Ensure DATA is<br />
selected, because the AMVER/SEAS message is sent as a BINAR Y message.)<br />
o Press . Arrow DOWN to TRANSMIT and Press . A small SEND START<br />
window appears and SELECT YES and Press . The message is now<br />
being sent through the satellite.<br />
3. To see the Status of the Message being sent Press F6 (LOGS).<br />
NOTE: The following are the FILE NAME for each particular message.<br />
CODE 41<br />
—Meteorological Observation MET.BIN<br />
—Sail Plan SP.BIN<br />
—Arrival Report FR.BIN<br />
—Deviation Report DR.BIN<br />
—Administrative Report ADMIN.BIN<br />
********************************** IMPORTANT **********************************<br />
1. It is necessary to setup an address for the Code 41 message in the Standard C software. The<br />
SETUP procedure provided below is a one-time process to be completed on initial installation.<br />
2. The TRANSMISSION instructions provided below are to be followed each time a message is<br />
transmitted.<br />
3. These instructions may vary slightly, depending on the software version and hardware.<br />
*************************************************************************************<br />
SETUP PROCEDURES<br />
1. At the NORMAL STANDBY Position Press F1 (FILE). A small window will appear and Highlight<br />
No. 1: New (ALT-N) and Press .<br />
NWSOH No. 1 3-8 May 2010
Transmitting the Observation<br />
o A larger window appears. At the cursor type in your Meteorological Observation in<br />
the proper format. (BBXX) Press F1 (SAVES MESSAGES).<br />
o A small window appears. Arrow down to 5: (SAVE ALT-S) and Press .<br />
o A small window appears in the upper left corner titled SAVE FILE NAME. Enter a<br />
Name on the file such as “WEATHER OBS” and Press (SAVED<br />
MESSAGE).<br />
TRANSMISSION PROCEDURES<br />
1. Press F3 (SEND/REC): A small window appears in upper left corner. Highlight No.1 (SEND)<br />
and Press .<br />
o Another window appears to the right of TITLE TO SEND MESSAGE. Highlight<br />
No. 1 (SEND MESSAGE) and Press .<br />
2. The SEND MESSAGE window appears.<br />
o Arrow down to DESTINATION TYPE and Highlight “SPEC”.<br />
o Arrow down to STATION ID and Type in “41”.<br />
o Arrow down to CES ID and type in the LES/CES ID. (Your LES/CES ID will be<br />
determined by location in relation to the FOOT PRINT of the satellite.)<br />
o Arrow down to CONFIRMATION and select OFF and Press .<br />
3. A small window appears titled SEND START. Highlight YES and Press .<br />
o At the bottom of the screen it will say: MESSAGE IS ENTERED IN SENDING<br />
BUFFER.<br />
o A window will appear saying: SUCCESSFUL SENDING MESSAGE.<br />
o The lower left corner of the screen will show the STATUS of the message.<br />
4. When completing the Next Observation go to FILE and to OPEN and Press .<br />
Highlight the last WEATHER OBS message and Press . EDIT the last message and<br />
TRANSMIT the message.<br />
*Note*: If your vessel has a Trimble unit please send an e-mail to U.S. VOS or any PMO<br />
requesting the procedures and we will provide them for you.<br />
To keep pace with increasingly widespread use of e-mail in today’ s commercial shipping industry<br />
the U.S. VOS program has developed a means for ships to transmit weather observations via email.<br />
The ship will incur the nominal cost when utilizing this method. The procedures are outlined<br />
below.<br />
SENDING SHIP OBSERVATIONS VIA E-MAIL<br />
1. Take an observation using the AMVER/SEAS 2000 software.<br />
o Place a diskette (1.44mb or 720 kb) in the A: drive of the computer.<br />
2. After entering the observation data, select QUICKFORM.<br />
o At the top of the QUICKFORM, select TRANSMIT from the left hand screen and<br />
arrow down to SAVE ASCII.<br />
3. The SAVE AS dialog box is brought up. At the SAVE IN dialog line, use the down arrow and<br />
change location to “Floppy Disk, (A:)”.<br />
o Select SAVE on lower right hand side of the dialog box. (This clears the box and<br />
saves an Ascii text version of the observations to the diskette.)<br />
4. Select CANCEL to close the “Quickform”. It will ask you: “Do you want to cancel and lose<br />
all data”. Select YES. (Note: The data is always archived on the hard drive, regardless.)<br />
5. Using My Computer, open the A: drive. There should be a notepad file on the diskette called<br />
MET or MET.TXT. Open it by double clicking on the icon. The synoptic observation will appear<br />
like this:<br />
BBXX WCY6777 15124 99559 71459<br />
41496 82324 10075 20048<br />
40123 57031 76162 86827<br />
22262 00042 20302 32433 40806<br />
51003 6//// 80062 ICE /////<br />
NWSOH No. 1 3-9 May 2010
Transmitting the Observation<br />
6. HIGHLIGHT the complete message. Using the right mouse button, select COPY.<br />
(Note: Close the notepad window and select “Yes” to save the changes to the observation.)<br />
7. Open your e-mail account and start an e-mail message.<br />
o Using the right mouse button PASTE the observation inside the e-mail message.<br />
(Include the entire weather message including the letters BBXX at the start of the<br />
message)<br />
o You MUST include an equal sign (=) to the end of the observation. This is to allow<br />
the computers to know that the transmission has ended. Your final observation<br />
message should look like this:<br />
BBXX WCY6777 15124 99559 71459<br />
41496 82324 10075 20048<br />
40123 57031 76162 86827<br />
22262 00042 20302 32433 40806<br />
51003 6//// 80062 ICE /////=<br />
DO NOT SEND AS AN ATTACHMENT TO THE E-MAIL. THE<br />
OBSERVATION MUST BE SENT WITHIN THE BODY OF THE E-MAIL.<br />
7. SEND THE E-MAIL TO: shipobs@noaa.gov<br />
GREAT LAKES REGION PROCEDURES<br />
Email observations using address above<br />
24/7 NDBC Call Center phone,(800-990-6433)<br />
Web page entry tool – DMAWDS address connection<br />
http://erh.noaa.gov/dmawds/vos.html<br />
* For web access through DMAWDS, contact the Great Lakes Port Meteorological Officer at<br />
PMOGlakes@noaa.gov, or 815-922-9757.<br />
ALASKA REGION PROCEDURES<br />
NWS Alaska Offices to contact to relay marine weather observations for<br />
transmission<br />
National Weather Service Annette Island Office<br />
(907) 886-3241 VHF Channel 16 HF Radio Channel 4125 kHz<br />
National Weather Service Barrow Office<br />
(907) 852-3101 VHF Channel 16 HF Radio Channel 4125 kHz<br />
National Weather Service Bethel Office<br />
(907) 543-2236 VHF Channel 16<br />
National Weather Service Cold Bay Office<br />
(907) 532-2448 VHF Channel 16 HF Radio Channel 4125 kHz<br />
NWSOH No. 1 3-10 May 2010
Transmitting the Observation<br />
National Weather Service King Salmon Office<br />
(907) 246-3303 VHF Channel 16 HF Radio Channel 4125 kHz<br />
National Weather Service Kodiak Office<br />
(907) 487-2102 VHF Channel 16 HF Radio Channel 4125 kHz<br />
National Weather Service Kotzebue Office<br />
(907) 442-3231 VHF Channel 16<br />
National Weather Service Nome Office<br />
(907) 443-2321 VHF Channel 16 HF Radio Channel 4125 kHz<br />
National Weather Service St. Paul Island Office<br />
(907) 546-2215 VHF Channel 9<br />
National Weather Service Valdez Office<br />
(907) 784-3322 VHF Channel 16 Wireless Matrix Satellite Phone Number 9999<br />
National Weather Service Yakutat Office<br />
(907) 784-3322 VHF Channel 16 HF Radio Channel 4125 kHz<br />
Wireless Matrix Satellite Phone Number 9998<br />
Email observations using address above<br />
Website to submit marine observation (MAROBS) is:<br />
http://pajk.arh.noaa.gov/marine/marob.htm<br />
Kodiak Alaska Weather Radiofacsimile Station NOJ Continuous Broadcast<br />
Frequencies:<br />
2054, 4298, 8459, 12412.5 kHz<br />
NWSOH No. 1 3-11 May 2010
Chapter 4 — The Weatherwise Mariner<br />
A man who is not afraid of the sea will soon be drowned, for he’ll be going<br />
out on a day he shouldn’t. But we do be afraid of the sea, and we do only be<br />
drowned now and again.<br />
From The Arran Islands by J. M. Synge<br />
Nothing affects the mariner as completely as does the weather. Anticipating changes to<br />
both weather and sea conditions can be of critical importance. To forecast what lies<br />
ahead you should capitalize on every available lead to future weather. This includes (1)<br />
understanding your own observations, and how to interprete them, (2) heeding<br />
professionally prepared weather forecasts and storm warnings, (3) studying marine<br />
weather and climatological summaries or atlases, and (4) making use of weather charts<br />
and analyses available via radiofacsimile.<br />
SHIPBOARD OBSERVATIONS AS A GUIDE TO<br />
FUTURE WEATHER CONDITIONS<br />
Your observations are dependable guides in determining future weather conditions.<br />
The following factors should be considered when making a forecast:<br />
Pressure and pressure changes<br />
Pressure changes, or a lack thereof, are very significant weather indicators. The<br />
approach of a low pressure or frontal system, tropical depression, storm, or hurricane<br />
is heralded by falling pressure. A steady, persistent drop in pressure normally indicates<br />
that foul weather is on the way. Be particularly wary of a rapid or sudden pressure fall<br />
of considerable magnitude. A steady and persistent rise in pressure is indicative of a<br />
period of settled or stable weather. Steep pressure rises and falls are often accompanied<br />
by strong wind. The passage of a front is often marked by a fall and subsequent<br />
steadying of pressure, or a fall followed by a rise in pressure. High pressures<br />
accompanied by slow pressure changes usually indicate a location within or near the<br />
center of a large high pressure area.<br />
Wind<br />
Wind shifts are very meaningful, and usually foretell a change in the weather. If, during<br />
stormy conditions, the wind shifts from the east, southeast, or northeast, to the west,<br />
northwest, or north (in the northern hemisphere), the weather should soon begin to<br />
clear. During fair weather, if the wind shifts from the west, southwest, or northwest, to<br />
the east, northeast, or southeast, (in northern hemisphere middle latitudes), a<br />
deterioration in weather conditions is likely (especially with a falling barometer). In<br />
general (but not always), fair weather comes with a wind from the southwest, west, or<br />
northwest, and unsettled weather is usually associated with wind from the east,<br />
southeast, or northeast (all wind directions are reversed for the southern hemisphere).<br />
NWSOH No. 1 4-1 May 2010
Warm air<br />
The Weatherwise Mariner<br />
Clouds and the state of the sky<br />
Clouds are very important indicators of existing weather conditions, and also provide<br />
early clues to impending changes. Of particular significance is the sequence or<br />
progression of cloud formations observed over several hours or more. In advance of<br />
storms (including mid latitude cyclones or low pressure areas, tropical depressions,<br />
storms, or hurricanes), a typical cloud progression would be (1) high cirrus clouds<br />
several hundred miles or more in advance of the storm center, (2) if the storm is<br />
moving closer, cirrus will thicken to become cirrostratus, and then, when the storm is<br />
only a few hundred miles away, the darker altostratus, (3) If the altostratus develop into<br />
stratocumulus, or especially nimbostratus, the storm is getting closer, rain will begin to<br />
fall and wind speed should increase. The duration and intensity of storms can vary<br />
greatly; by using cloud sequences together with other indicators such as pressure and<br />
wind direction, you will obtain a good idea of what conditions to expect.<br />
35,000 ft<br />
Vertical section of clouds ahead of a low. If a warm front is present,<br />
it will lie along the dashed lines.<br />
10,000 ft<br />
stratus or stratocumulus<br />
nimbostratus<br />
altostratus<br />
200-400 miles<br />
altostratus<br />
rain stratus<br />
cirrostratus<br />
Cumiliform clouds should also be closely watched. Cumulus with sharp or hard edged<br />
cauliflower-like tops are still growing and rising vertically. Cumulus with indistinct or<br />
fluffy tops have probably stopped rising and should not pose any threat. Sometimes<br />
cumulus is seen to develop strongly to start with, then flatten out into a layer. This<br />
indicates the cloud has advanced into a temperature inversion asociated with a high<br />
pressure area.<br />
If cumulus is observed to extend vertically and grow into cumulonimbus, a<br />
thunderstorm with possible lightning and strong, gusty winds may be near. When a<br />
thunderstorm enters your area, pressure may rise. This results from the downdraft of<br />
air just ahead of heavy precipitation. The downdraft may also cause the air<br />
temperature to drop.<br />
Fair weather cumulus with little vertical extent are good weather clouds. They indicate<br />
some instablilty close to the surface, but stable, dry conditions at higher levels. High icy<br />
cirrus clouds are also indicative of fair weather (if precipitation or storms are near,<br />
these clouds would not be visible).<br />
It has been found that halos around the sun or moon are followed by rain about 65%<br />
of the time. Halos occur as a result of refraction of light through the ice crystals of<br />
cirrus<br />
Cold air<br />
stratocumulus cumulus<br />
NWSOH No. 1 4-2 May 2010
The Weatherwise Mariner<br />
cirrostratus clouds. As already indicated, cirrostratus is often the first sign of an<br />
approaching storm or warm front. In the middle latitudes of the northern hemisphere,<br />
a halo with northeast, east, or southeast wind, and falling barometer, can be a fairly<br />
reliable indicator of inclement weather to follow.<br />
Temperature and humidity<br />
There is a good possibility of fog formation whenever the wet bulb depression is slight,<br />
or when dew point temperature is close to the wet bulb temperature. The fall in nighttime<br />
temperature should be watched — if the wet bulb depression narrows, there is a<br />
greater likelihood of fog formation.<br />
Also, an increasing dew point temperature or a narrowing of the wet bulb depression<br />
may indicate the approach of a front or storm system with inclement weather. On the<br />
other hand, a low dew point temperature and large wet bulb depression indicate very<br />
dry conditions associated with high pressure areas, good visibility, and generally settled<br />
weather conditions.<br />
Sea and swell<br />
The arrival or absence of swell provides a clear distinction between the advance of a<br />
local thunderstorm and an approaching well developed storm center. A threatening sky<br />
with increasing and thickening clouds, but without any swell, cannot be part of a large<br />
storm system, so any bad weather will probably be short lived. However, increasing<br />
swell from the direction of advance of the storm clouds would suggest an approaching<br />
storm with a large area of strong winds. The appearance of a heavy, rolling swell often<br />
indicates the approach of a tropical storm. Such swell are the remains of huge,<br />
decayed waves generated by the storm, but which travel faster than the storm.<br />
The presence of swell for a long time without any significant change in weather<br />
conditions is difficult to interprete. A storm system may be approaching, but very<br />
slowly, or it may have already passed by.<br />
WEATHER FORECASTS AND STORM WARNINGS<br />
Always take advantage of professionally prepared weather forecasts and storm<br />
warnings, either from the NWS or from privately operated companies. Professional<br />
forecasters obtain vast amounts of data from worldwide sources, which allows them to<br />
locate and closely follow the movement of weather systems. Forecasters use numerical<br />
models which provide detailed forecast guidance out 72 hours or more from run time,<br />
and which also provide useful data out 144 hours (6 days) or more.<br />
MARINE CLIMATOLOGICAL SUMMARIES OR ATLASES<br />
Climatological atlases generally provide information based on conditions averaged over<br />
long periods of time, and provide an indication of the range in weather and sea<br />
conditions to be expected in a particular area. The National Geospatial-Intelligence<br />
Agency prepares marine climatological atlases for the worlds oceans, which contain<br />
much meteorological and oceanographic information. Included is information about<br />
prevailing winds, currents, atmospheric pressure, the movement of ice, etc. See<br />
http://www.nga.mil/NGAPortal/MSI.portal.<br />
NWSOH No. 1 4-3 May 2010
The Weatherwise Mariner<br />
USING WEATHER CHARTS AND ANALYSES<br />
The weather charts received via radiofacsimile provide a wealth of information allowing<br />
you to do your own forecasting. Perhaps the most useful chart is the surface analysis,<br />
which indicates the locations of Highs, lows, fronts, tropical storms, and also contains<br />
plotted surface reports, including ship reports. Your PMO can answer questions about<br />
using the surface and upper air weather analyses.<br />
WEATHER LORE, JINGLES AND PROVERBS<br />
Weather forecasting and supporting data acquisition programs (such as the VOS<br />
program) are a recent human advancement. Until the development of modern<br />
meteorology within the last hundred years, people relied on their own observations and<br />
experience to make weather predictions. It was known that certain atmospheric<br />
conditions were likely to produce certain kinds of weather, and this knowledge was<br />
often put into verses or proverbs. Some of the more accurate of the old sayings are<br />
shown below. All wind and compass directions are for the northern hemisphere<br />
(especially middle latitudes), and would reverse for the southern hemisphere.<br />
Beware the bolts from north or west<br />
In south or east the bolts be best<br />
Fairly reliable in the northern hemisphere middle latitudes, where weather generally<br />
moves from west to east. Lightning to the north or west could mean a thunderstorm<br />
coming towards you.<br />
Rainbow to windward foul fall the day<br />
Rainbow to leeward, rain runs away<br />
A windward rainbow indicates rain upwind, so it may begin raining soon. A rainbow<br />
behind the wind or to leeward implies the rain has probably past.<br />
If wooly fleece deck the heavenly way<br />
Be sure no rain will mar the day<br />
or<br />
If fleecy white clouds cover the heavenly way<br />
no rain should mar your plans that day<br />
Wooly fleece or fleecy white clouds refer to cumulus clouds with little vertical<br />
development (fair weather cumulus). This is sound folklore (as long as the clouds<br />
remain flat and do not grow vertically later on).<br />
Mountains in the morning<br />
Fountains in the evening<br />
The mountains refer to high, billowing cumulus clouds, indicative of instability and<br />
possible development of cumulonimbus clouds and a late afternoon or evening<br />
thunderstorm.<br />
NWSOH No. 1 4-4 May 2010
When a halo rings the moon or sun<br />
Rains approaching on the run<br />
The Weatherwise Mariner<br />
As already indicated, a halo around the sun or moon is followed by inclement weather<br />
about 65% of the time.<br />
Short notice, soon to pass<br />
Long notice, long will last<br />
or<br />
Long foretold—long last<br />
Short notice—soon past<br />
The approach of a major storm system with bad weather lasting several hours or more<br />
is revealed well in advance — by cloud formations, changing wind direction, falling<br />
atmospheric pressure, the arrival of swell, etc. However, a short lived bad weather<br />
event, such as a local thunderstorm, might only be revealed a short while ahead of<br />
time, such as from cumulus growing into cumulonimbus. This is, therefore, a fairly<br />
accurate jingle.<br />
Seagull, seagull, get out on T’sand<br />
We’ll never have good weather with thee on the land<br />
During fair weather, gulls scavenge at the waters edge or offshore. During stormy<br />
weather, they often fly inland and scavenge at waste dumps. However, they usually<br />
don’t do this until after the storm has arrived!<br />
When the glass falls low<br />
Look out for a blow<br />
or<br />
When the wind backs, and the weather glass falls,<br />
Then be on your guard against gales and squalls<br />
Sound advice, because as already indicated, a steady, persistent fall in atmospheric<br />
pressure is often a good indication of foul weather to come. This is<br />
particularly true with a windshift from the west to the east, northeast or southeast.<br />
Red sky at night, sailors delight<br />
Red sky in the morning, sailors take warning<br />
This is probably the most famous of all weather sayings, and is true more often than<br />
not. A red sky at sunset or early evening indicates clouds to the east, with clearing on<br />
the western horizon allowing the setting sun to be seen. Unsettled weather or<br />
stormyness may have passed or be moving out. A red sky in the morning indicates<br />
clouds to the west as the sun is rising, which may advance eastward and bring bad<br />
weather with them.<br />
NWSOH No. 1 4-5 May 2010
When the wind before the rain<br />
Let your topsails draw again<br />
When the rain before the wind<br />
Topsail sheets and halyards mind<br />
The Weatherwise Mariner<br />
A small, weak, frontal system will have a narrow band of associated rain, and wind<br />
may be more conspicuous than rain. Stronger fronts and intense depressions are<br />
surrounded by bad weather for considerable distances, and precipitation should<br />
preceed the strongest wind.<br />
Mackeral skys and mares tails<br />
Make lofty ships carry low sails<br />
The mackeral sky is composed of cirrus and cirrocumulus clouds (which resemble scale<br />
patterns on a mackerals back). The mares tails refer to trails of ice crystals blown in<br />
streaks from cirrus clouds. These clouds may appear ahead of an approaching storm<br />
or frontal system, and can indicate strong winds aloft. If the cirrus and/or<br />
cirrocumulus thicken to cirrostratus, altostratus, and then nimbostratus, stormy<br />
conditions may be on the way. Strong winds require less sail for navigation in a rough<br />
sea.<br />
Sound traveling far and wide<br />
A stormy day will betide<br />
Low, dense, rainy, stratus and nimbostratus clouds trap sounds by preventing them<br />
from escaping into the atmosphere above. Voices or noise may appear louder and<br />
travel further when these clouds are present.<br />
Frost or dew in the morning light<br />
Shows no rain before the night<br />
The formation of frost or dew requires night time cooling which usually occurs only on<br />
very clear, calm nights. Such a night is usually followed by fair, sunny daytime weather,<br />
so inclement weather would be unlikely. However, a weather system moving very<br />
rapidly could arrive during the day, thus interfering with this proverb.<br />
First rise after low<br />
Portends a stronger blow<br />
The strongest, gustiest wind often does not occur until the barometer reaches it’s lowest<br />
value and begins to rise. This is especially true in intense, well developed storm<br />
systems. Pressure gradients behind the low center can be very strong, giving rise to<br />
dangerous, unpredictable gales.<br />
NWSOH No. 1 4-6 May 2010
Glossary<br />
3-hour observation Observations taken at 3-hourly intervals, such as 0300, 0600, 0900,<br />
UTC, etc.<br />
6-hour observation Observations taken a 6-hourly intervals, such as 0000, 0600, 1200, 1800<br />
UTC. These are also known as the main synoptic times.<br />
Alto- Cloud prefix meaning middle level.<br />
Altocumulus White or gray patch, sheet, or layer of cloud, generally with shading,<br />
composed of rounded masses, rolls, etc., sometimes partly fibrous,<br />
which may or may not be merged. Mainly composed of water droplets.<br />
Altostratus Grayish or bluish sheet or layer of striated, fibrous, or uniform<br />
appearance, having parts thin enough to see the sun, as through ground<br />
glass.<br />
Anemometer An instrument for measuring wind speed and direction. Typically, 3 or 4<br />
rotating cups measure speed and a vane indicates direction.<br />
Atmospheric pressure The pressure exerted by the atmosphere at a given point. <strong>Ship</strong>s report<br />
pressure at sea level.<br />
Bar Unit of pressure equal to 1,000,000 dynes per square centimeter, or 1000<br />
millibars.<br />
Barogram A record of pressure produced by a barograph.<br />
Barograph A recording barometer.<br />
Barometer An instrument that measures atmospheric pressure. The aneroid barometer<br />
is the standard instrument aboard ship.<br />
Barometric pressure The atmospheric pressure value indicated by the barometer.<br />
Barometric tendency See pressure tendency.<br />
Beaufort wind scale A numerical scale of wind force originally designed by Admiral Francis<br />
Beaufort in the early 19th century. Today, it consists of ranges of wind<br />
speed with appropriate descriptions of sea state.<br />
Bergy bit A piece of ice which has broken away from an iceberg, extending 1-5<br />
meters above the sea surface and 100-300 square meters in area. Can<br />
also be the remains of a melting iceberg.<br />
Celsius temperature Same as Centigrade temperature scale where the boiling point is 100<br />
degrees and the freezing point is 0 degrees.<br />
Cirro- Cloud prefix meaning high level.<br />
Cirrocumulus Thin white patch, sheet, or layer of cloud without shading, composed of<br />
very small elements in the form of ripples, grains, etc.<br />
Cirrostratus Transparent, whitish cloud veil of fibrous (hairlike) or smooth<br />
appearance, often producing a halo.<br />
Cirrus Clouds of ice crystals in the form of delicate white filaments, or white or<br />
mostly white patches or narrow bands, with a fibrous appearance or silky<br />
sheen.<br />
NWSOH No. 1 5-1 May 2010
Cloud A visible aggregate of minute water droplets or ice crystals in the<br />
atmosphere.<br />
Cloud height The height of the base of a cloud or cloud layer above the sea surface.<br />
Cloud layer A grouping of clouds whose bases are at approximately the same level.<br />
Cloud type A cloud form which is identified as distinct according to the World<br />
Meteorological Organization International Cloud Atlas.<br />
Condensation The physical process by which a vapor becomes a liquid or a solid.<br />
Crest The highest part of a wave.<br />
Cumulonimbus Heavy, dense cloud, with considerable vertical extent, in the form of a<br />
mountain or huge tower. Part of upper portion usually, but not always,<br />
smooth or fibrous.<br />
Cumulus Detached clouds, generally dense and with sharp outlines, developing<br />
vertically in the form of rising mounds, domes, or towers, of which the<br />
bulging upper part often resembles a cauliflower. The sunlit parts are<br />
brilliant white; bases can be dark and nearly horizontal.<br />
Dew point The temperature to which the air must be cooled in order for saturation<br />
to occur.<br />
Drizzle Fairly uniform precipitation composed exclusively of fine drops, very<br />
close together. Diameter less than 0.02 inch or 0.5 millimeter.<br />
Evaporation The process of change from liquid water to water vapor.<br />
Fog A suspension of very small water droplets in the air, reducing horizontal<br />
visibility.<br />
Fracto- Cloud prefix meaning torn, ragged, or scattered appearance due to strong<br />
winds.<br />
Freak Wave A wave of great height and steepness, much higher than other waves in<br />
the prevailing sea or swell system.<br />
Freezing Rain Rain that freezes on impact and forms a glaze on the ground and exposed<br />
objects.<br />
Growler Similiar to a bergy bit, but smaller, extending less than 1 meter above the<br />
sea surface and occupying an area of 20 square meters or less.<br />
Gust Sudden brief wind speed increase followed by lull or slackening.<br />
Hail Precipitation in the form of small balls or irregular pieces of ice.<br />
Haze A suspension of very small, dry (non-liquid) particles in the air, such as<br />
dust, sea salt, or soot. Results in diminished visibility. Distinguished<br />
from fog by its dryness.<br />
Hectopascal A unit of measure of atmospheric pressure equal to 100 newtons per<br />
square meter. It is the numerical equivalant of a millibar.<br />
Horizon The distant line along which the sea surface, or the earth, and the sky<br />
appear to meet. It is the actual lower boundary of the observed sky or the<br />
upper outline of terrestrial objects.<br />
Hygrometer Instrument to measure humidity. The wet- and dry-bulb sling<br />
psychrometer is a type of hygrometer.<br />
Iceberg A piece of a glacier which has broken off and is floating in the sea.<br />
NWSOH No. 1 5-2 May 2010
Ice pellets Pellets or small pieces of ice, with a diameter of 5 millimeters or less,<br />
which bounce on impact.<br />
Icing Accumulation of ice on the ship’s superstructure, from freezing<br />
precipitation, ocean spray, supercooled fog, or cloud droplets.<br />
Intermediate synoptic times The times of 0300, 0900, 1500, and 2100 UTC.<br />
Knot One nautical mile per hour or approximately .5 meters per second.<br />
Land Ice Any ice of land origin, from the freezing of fresh water or the compacting<br />
of snow, such as an iceberg.<br />
Lenticular A type of cloud formed in the ascending portion of an airstream, which<br />
remains stationary while the air blows through it.<br />
Main synoptic times The times of 0000, 0600, 1200, and 1800 UTC. Also known as the<br />
standard synoptic times.<br />
Millibar One one-thousandth of a bar. Numerically the same as a hectopascal. The<br />
weight of an average column of air at sea level is 1016 millibars.<br />
Nautical mile 1852 meters, or 6080.2 feet.<br />
Nimbostratus Gray cloud layer, often dark, thick enough to block out the sun, which<br />
appears diffuse by falling precipitation.<br />
Obscured sky The condition when the entire sky is hidden by surface-based obscuring<br />
phenomena.<br />
Okta Used for the measurement of total cloud cover. One okta of cloud cover is<br />
the equivalent of 1/8 of the sky covered with cloud.<br />
Period See wave period.<br />
PMO Port meteorological officer.<br />
Precipitation All types of condensed water vapor, whether liquid, freezing, or frozen,<br />
which fall out of the atmosphere to the earth’s surface.<br />
Pressure See atmospheric pressure.<br />
Pressure change The net difference between the pressure at the beginning and ending of a<br />
specified interval of time.<br />
Pressure characteristic The indication of how the pressure has been changing during the 3-hour<br />
period preceding an observation; i.e. decreasing then increasing, same<br />
pressure, or lower than 3-hours ago.<br />
Pressure tendency The character and amount of atmospheric pressure change during the 3hour<br />
period preceding an observation.<br />
Psychrometer An instrument for measuring the moisture content of the air by use of a<br />
wet- “and” dry- bulb thermometer; a type of hygrometer.<br />
Rain Liquid precipitation that remains in the liquid state upon impact with the<br />
ground or other exposed objects.<br />
Remarks Plain language data added after the last group of the weather message to<br />
report significant information not provided for in the main body of the<br />
report.<br />
Ripple A small wavelet which forms at wind speeds of 1-3 knots.<br />
Saturation The stage where the water content of the atmosphere reaches the<br />
maximum possible under the existing environmental conditions.<br />
NWSOH No. 1 5-3 May 2010
Sea Locally generated waves produced by the wind, and described by their<br />
period and height.<br />
Sea ice Ice formed from the freezing of the sea surface.<br />
Sea-level pressure The atmospheric pressure at mean sea level, either directly measured, or<br />
empirically determined from the observed station pressure.<br />
Sleet Raindrops that have passed through a freezing layer of air and frozen or<br />
partially frozen. Same as ice pellets.<br />
Sling psychrometer A type of hygrometer with two thermometers, which is whirled to<br />
determine air and wet bulb temperatures. The bulb of one is kept moist<br />
by a piece of wet muslin.<br />
Snow Precipitation of ice crystals, mostly branched in star shapes.<br />
Snow grains Very small, white, opaque grains of ice, with a diameter of less than 1<br />
millimeter. Frozen drizzle.<br />
Snow pellets White, opaque grains of ice, with a diameter of 2-5 millimeters.<br />
Special observation An unscheduled or special observation taken to report significant<br />
changes in one or more of the observed elements since the last recorded<br />
observation.<br />
Squall A sudden increase in wind speed of at least 15 knots which is sustained<br />
at 20 knots or more for at least 1 minute.<br />
Standard barometer A barometer of very high accuracy used to calibrate other barometers.<br />
NWS PMOs use hand- held standard digital barometers to calibrate<br />
shipboard barometers.<br />
Standard synoptic times The times of 0000, 0600, 1200, and 1800 UTC. Also known as the main<br />
synoptic times.<br />
Station pressure The atmospheric pressure at barometer height, normally on the bridge.<br />
Barometers aboard NWS <strong>Voluntary</strong> <strong>Observing</strong> <strong>Ship</strong>s are calibrated, when<br />
possible, to read sea-level pressure.<br />
Storm Sustained wind of 48-55 knots (defined by the WMO as Beaufort<br />
Force 10).<br />
Strato- Cloud prefix referring to cloud sheets or layers.<br />
Stratocumulus Gray or whitish patch, sheet, or layer of cloud, almost always with dark<br />
parts, with non- fibrous rounded masses or rolls, which may or may not<br />
be merged.<br />
Stratus Generally gray cloud layer with a fairly uniform base, which may produce<br />
drizzle or snow grains.<br />
Surface observation Surface weather observations taken in accordance with World<br />
Meteorological Organization regulations, containing those weather<br />
elements most important for forecasting and later use.<br />
Swell Ocean waves which have travelled beyond the generating area. They have<br />
longer periods and are more regular than seas.<br />
Synoptic code Rules and procedures established by the World Meteorological<br />
Organization for encoding weather observations.<br />
Temperature A measure of the hotness or coldness of the air as measured by a<br />
suitable instrument, using a defined temperature scale.<br />
NWSOH No. 1 5-4 May 2010
Trough The lowest part of a wave.<br />
True direction Direction measured in degrees clockwise from true north, where north is<br />
0 degrees.<br />
Variable wind A condition when the wind direction fluctuates by 60 ˚ or more during the<br />
period of observation and the wind speed is greater than 10 knots.<br />
Visibility The greatest horizontal distance at which selected objects can be seen<br />
and identified.<br />
Visibility reference Selected objects at known distances used to determine visibility.<br />
<strong>Voluntary</strong> <strong>Observing</strong> <strong>Program</strong> of the WMO and NWS to manage weather reporting<br />
<strong>Ship</strong> (VOS) program by ships at sea and on the Great Lakes.<br />
Water vapor The gaseous form of water.<br />
Wave height Distance from trough to crest, averaged for the better formed waves in the<br />
center of the wave group.<br />
Wave length Distance from trough to trough or crest to crest for adjacent waves.<br />
Wave period Time, in seconds, for the passage of successive wave crests. Normally<br />
computed as an average value for several waves.<br />
Weather The individual and combined atmospheric phenomena used to describe<br />
the local atmospheric conditions at the time of observation.<br />
Whitecap The breaking crest of a wave, usually white and frothy.<br />
Wind The horizontal motion of the air past a given point.<br />
Wind character The measure of the variability of the wind speed in terms of gusts and<br />
squalls.<br />
Wind direction The true direction from which the wind is blowing at a given location.<br />
Wind shift A change in the average wind direction of 45˚ or more which takes place<br />
in less than 15 minutes with wind speeds greater than 10 knots.<br />
Wind speed The rate at which the air is moving horizontally past a given point.<br />
Vessels usually estimate wind speed by relating the state of the sea to the<br />
Beaufort Scale of wind force.<br />
NWSOH No. 1 5-5 May 2010
Appendix A<br />
<strong>Observing</strong> Forms and Supplies<br />
BOOKLETS AND MANUALS<br />
NWS <strong>Observing</strong> <strong>Handbook</strong> No. 1<br />
World Wide Marine Radiofacsimile Broadcast Schedules<br />
Guide to Sea State, Wind and Clouds<br />
OBSERVING FORMS<br />
<strong>Ship</strong>’s Weather Observations<br />
Barogram<br />
WEATHER MAP BASES<br />
N. Atlantic–U.S. Intercoastal<br />
N. Pacific–U.S. Intercoastal<br />
S. Atlantic–U.S. Intercoastal<br />
S. Pacific–Indian Ocean<br />
WALL CHARTS<br />
Sea State Poster<br />
Cloud Poster<br />
Explanation of the Daily Weather Map<br />
BROCHURE<br />
PMO/VOS <strong>Program</strong><br />
Guide to Sea State, Wind and Clouds<br />
NWSOH No. 1 A-1 May 2010
Appendix B<br />
Conversion Factors and Equivalents<br />
LENGTH<br />
1 foot = .3048 meters<br />
1 centimeter = 10 millimeters = .394 inches = .01 meters<br />
1 meter = 100 centimeters = 3.2808 feet = 39.37 inches = 1.09 yards = .547 fathoms<br />
1 kilometer = 1000 meters = 3280.8 feet = .54 nautical miles = .621 statute miles<br />
1 degree latitude = 111.1 kilometers<br />
1 statute mile = 1.6093 kilometers<br />
SPEED<br />
1 knot (nautical mile/hour) = 1.15 statute miles/hour = .51 meters/sec<br />
1 meter/sec = 2.24 statute miles/hour = 1.94 knots<br />
1 centimeter/second = 1.97 feet per minute<br />
TEMPERATURE<br />
Degrees Celsius = Degrees Centigrade<br />
Celsius = 5/9(Fahrenheit - 32)<br />
or<br />
Celsius = (Fahrenheit - 32)/1.8<br />
Fahrenheit = 1.8(Celsius) + 32<br />
or<br />
Fahrenheit = 1.8(Celsius + 40) - 40<br />
PRESSURE<br />
1 millimeter mercury = .03937 inches = 1.3332 millibars<br />
1 inch mercury = 25.4 millimeters = 33.8640 millibars<br />
1 millibar = .02953 inches = .75006 millimeters<br />
millibars = inches x 33.865<br />
inches = millibars/33.864<br />
Standard Atmosphere: vertical pressure change is .037 millibars/foot<br />
(.1214 millibars/meter)<br />
AREA<br />
1 square centimeter = .155 square inches<br />
1 square meter = 10.8 square feet<br />
1 square kilometer = .386 square statute miles = .292 square nautical miles<br />
NWSOH No. 1 B-1 May 2010
FAHRENHEIT/CELSIUS CONVERSION TABLE<br />
°F.<br />
0.0<br />
°C.<br />
0.1<br />
°C.<br />
Fahrenheit to Celsius Temperatures<br />
0.2<br />
°C.<br />
0.3<br />
°C.<br />
0.4<br />
°C.<br />
+110 +43.3 +43.4 +43.4 +43.6 +43.6 +43.6 +43.7 +43.7 +43.8 +43.8<br />
109 42.8 42.8 42.9 42.9 43.0 43.1 43.1 43.2 43.2 43.3<br />
108 42.2 42.3 42.3 42.4 42.4 42.5 42.6 42.6 42.7 42.7<br />
107 41.7 41.7 41.8 41.8 41.9 41.9 42.0 42.1 42.1 42.2<br />
106 41.1 41.2 41.2 41.3 41.3 41.4 41.4 41.5 41.6 41.6<br />
+105 +40.6 +40.6 +40.7 +40.7 +40.8 +40.8 +40.9 +40.9 +41.0 +41.1<br />
104 40.0 40.1 40.1 40.2 40.2 40.3 40.3 40.4 40.4 40.5<br />
103 39.4 39.5 39.6 39.6 39.7 39.7 39.8 39.8 39.9 39.9<br />
102 38.9 38.9 39.0 39.1 39.1 39.2 39.2 39.3 39.3 39.4<br />
101 38.3 38.4 38.4 38.5 38.6 38.6 38.7 38.7 38.8 38.8<br />
+100 +37.8 +37.8 +37.9 +37.9 +38.0 +38.1 +38.1 +38.2 +38.2 +38.3<br />
99 37.2 37.3 37.3 37.4 37.4 37.5 37.6 37.6 37.7 37.7<br />
98 36.7 36.7 36.8 36.8 36.9 36.9 37.0 37.1 37.1 37.2<br />
97 36.1 36.2 36.2 36.3 36.3 36.4 36.4 36.5 36.6 36.6<br />
96 35.6 35.6 35.7 35.7 35.8 35.8 35.9 35.9 36.0 36.1<br />
+95 +35.0 +35.1 +35.1 +35.2 +35.2 +35.3 +35.3 +35.4 +35.4 +35.5<br />
94 34.4 34.5 34.6 34.6 34.7 34.7 34.8 34.8 34.9 34.9<br />
93 33.9 33.9 34.0 34.1 34.1 34.2 34.2 34.3 34.3 34.4<br />
92 33.3 33.4 33.4 33.5 33.6 33.6 33.7 33.7 33.8 33.8<br />
91 32.8 32.8 32.9 32.9 33.0 33.1 33.1 33.2 33.2 33.3<br />
+90 +32.2 +32.3 +32.3 +32.4 +32.4 +32.5 +32.6 +32.6 +32.7 +32.7<br />
89 31.7 31.7 31.8 31.8 31.9 31.9 32.0 32.1 32.1 32.2<br />
88 31.1 31.2 31.2 31.3 31.3 31.4 31.4 31.5 31.6 31.6<br />
87 30.6 30.6 30.7 30.7 30.8 30.8 30.9 30.9 31.0 31.1<br />
86 30.0 30.1 30.1 30.2 30.2 30.3 30.3 30.4 30.4 30.5<br />
+85 +29.4 +29.5 +29.6 +29.6 +29.7 +29.7 +29.8 +29.8 +29.9 +29.9<br />
84 28.9 28.9 29.0 29.1 29.1 29.2 29.2 29.3 29.3 29.4<br />
83 28.3 28.4 28.4 28.5 28.6 28.6 28.7 28.7 28.8 28.8<br />
82 27.8 27.8 27.9 27.9 28.0 28.1 28.1 28.2 28.2 28.3<br />
81 27.2 27.3 27.3 27.4 27.4 27.5 27.6 27.6 27.7 27.7<br />
+80 +26.7 +26.7 +26.8 +26.8 +26.9 +26.9 +27.0 +27.1 +27.1 +27.2<br />
79 26.1 26.2 26.2 26.3 26.3 26.4 26.4 26.5 26.6 26.6<br />
78 25.6 25.6 25.7 25.7 25.8 25.8 25.9 25.9 26.0 26.1<br />
77 25.0 25.1 25.1 25.2 25.2 25.3 25.3 25.4 25.4 25.5<br />
76 24.4 24.5 24.6 24.6 24.7 24.7 24.8 24.8 24.9 24.9<br />
+75 +23.9 +23.9 +24.0 +24.1 +24.1 +24.2 +24.2 +24.3 +24.3 +24.4<br />
74 23.3 23.4 23.4 23.5 23.6 23.6 23.7 23.7 23.8 23.8<br />
73 22.8 22.8 22.9 22.9 23.0 23.1 23.1 23.2 23.3 23.3<br />
72 22.2 22.3 22.3 22.4 22.4 22.5 22.6 22.6 22.7 22.7<br />
71 21.7 21.7 21.8 21.8 21.9 21.9 22.0 22.1 22.1 22.2<br />
+70 +21.1 +21.2 +21.2 +21.3 +21.3 +21.4 +21.4 +21.5 +21.6 +21.6<br />
69 20.6 20.6 20.7 20.7 20.8 20.8 20.9 20.9 21.0 21.1<br />
68 20.0 20.1 20.1 20.2 20.2 20.3 20.3 20.4 20.4 20.5<br />
67 19.4 19.5 19.6 19.6 19.7 19.7 19.8 19.8 19.8 19.9<br />
66 18.9 18.9 19.0 19.1 19.1 19.2 19.2 19.3 19.3 19.4<br />
+65 +18.3 +18.4 +18.4 +18.5 +18.6 +18.6 +18.7 +18.7 +18.8 +18.8<br />
64 17.8 17.8 17.9 17.9 18.0 18.1 18.1 18.2 18.2 18.3<br />
63 17.2 17.3 17.3 17.4 17.4 17.5 17.6 17.6 17.7 17.7<br />
62 16.7 16.7 16.8 16.8 16.9 16.9 17.0 17.1 17.1 17.2<br />
61 16.1 16.2 16.2 16.3 16.3 16.4 16.4 16.5 16.6 16.6<br />
NWSOH No. 1 B-2 May 2010<br />
0.5<br />
°C.<br />
0.6<br />
°C.<br />
0.7<br />
°C.<br />
0.8<br />
°C.<br />
0.9<br />
°C.
FAHRENHEIT/CELSIUS CONVERSION TABLE (CONTINUED)<br />
°F.<br />
0.0<br />
°C.<br />
0.1<br />
°C.<br />
Fahrenheit to Celsius Temperatures<br />
0.2<br />
°C.<br />
0.3<br />
°C.<br />
0.4<br />
°C.<br />
+60 +15.6 +15.6 +15.7 +15.7 +15.8 +15.8 +15.8 +15.9 +16.0 +16.1<br />
59 15.0 15.1 15.1 15.2 15.2 15.3 15.3 15.4 15.4 15.5<br />
58 14.4 14.5 14.6 14.6 14.7 14.7 14.8 14.8 14.9 14.9<br />
57 13.9 13.9 14.0 14.1 14.1 14.2 14.2 14.3 14.3 14.4<br />
56 13.3 13.4 13.4 13.5 13.6 13.6 13.7 13.7 13.8 13.8<br />
+55 +12.8 +12.8 +12.9 +12.9 +13.0 +13.1 +13.1 +13.2 +13.2 +13.3<br />
54 12.2 12.3 12.3 12.4 12.4 12.5 12.6 12.6 12.7 12.7<br />
53 11.7 11.7 11.8 11.8 11.9 11.9 12.0 12.1 12.1 12.2<br />
52 11.1 11.2 11.2 11.3 11.3 11.4 11.4 11.5 11.6 11.6<br />
51 10.6 10.6 10.7 10.7 10.8 10.8 10.9 10.9 11.0 11.1<br />
+50 +10.0 +10.1 +10.1 +10.2 +10.2 +10.3 +10.3 +10.4 +10.4 +10.5<br />
49 9.4 9.5 9.6 9.6 9.7 9.7 9.8 9.8 9.9 9.9<br />
48 8.9 8.9 9.0 9.1 9.1 9.2 9.2 9.3 9.3 9.4<br />
47 8.3 8.4 8.4 8.5 8.6 8.6 8.7 8.7 8.8 8.8<br />
46 7.8 7.8 7.9 7.9 8.0 8.1 8.1 8.2 8.2 8.3<br />
+45 +7.2 +7.3 +7.3 +7.4 +7.4 +7.5 +7.6 +7.6 +7.7 +7.7<br />
44 6.7 6.7 6.8 6.8 6.9 6.9 7.0 7.1 7.1 7.2<br />
43 6.1 6.2 6.2 6.3 6.3 6.4 6.4 6.5 6.6 6.6<br />
42 5.6 5.6 5.7 5.7 5.8 5.8 5.9 5.9 6.0 6.1<br />
41 5.0 5.1 5.1 5.2 5.2 5.3 5.3 5.4 5.4 5.5<br />
+40 +4.4 +4.5 +4.6 +4.6 +4.7 +4.7 +4.8 +4.8 +4.9 +4.9<br />
39 3.9 3.9 4.0 4.1 4.1 4.2 4.2 4.3 4.3 4.4<br />
38 3.3 3.4 3.4 3.5 3.6 3.6 3.7 3.7 3.8 3.8<br />
37 2.8 2.8 2.9 2.9 3.0 3.1 3.1 3.2 3.2 3.3<br />
36. 2.2 2.3 2.3 2.4 2.4 2.5 2.6 21.6 2.7 2.7<br />
+35 +1.7 +1.7 +1.8 +1.8 +1.9 +1.9 +2.0 +2.1 +2.1 +2.2<br />
34 +1.1 +1.2 +1.2 +1.3 +1.3 +1.4 +1.4 +1.5 +1.6 +1.6<br />
33 +0.6 +0.6 +0.7 +0.7 +0.8 +0.8 +0.9 +0.9 +1.0 +1.1<br />
32 0.0 +0.1 +0.1 +0.2 +0.2 +0.3 +0.3 +0.4 +0.4 +0.5<br />
31 -0.6 -0.5 -0.4 -0.4 -0.3 -0.3 -0.2 -0.2 -0.1 -0.1<br />
+30 -1.1 -1.1 -1.0 -0.9 -0.9 -0.8 -0.8 -0.7 -0.7 -0.6<br />
29 -1.7 -1.6 -1.6 -1.5 -1.4 -1.4 -1.3 -1.3 -1.2 -1.2<br />
28 -2.2 -2.2 -2.1 -2.1 -2.0 -1.9 -1.9 -1.8 -1.8 -1.7<br />
27 -2.8 -2.7 -2.7 -2.6 -2.6 -2.5 -2.4 -2.4 -2.3 -2.3<br />
26 -3.3 -3.3 -3.2 -3.2 -3.1 -3.1 -3.0 -2.9 -2.9 -2.8<br />
+25 -3.9 -3.8 -3.8 -3.7 -3.7 -3.6 -3.6 -3.5 -3.4 -3.4<br />
24 -4.4 -4.4 -4.3 -4.3 -4.2 -4.2 -4.1 -4.1 -4.0 -3.9<br />
23 -5.0 -4.9 -4.9 -4.8 -4.8 -4.7 -4.7 -4.6 -4.6 -4.5<br />
22 -5.6 -5.5 -5.4 -5.4 -5.3 -5.3 -5.2 -5.2 -5.1 -5.1<br />
21 -6.1 -6.1 -6.0 -5.9 -5.9 -5.8 -5.8 -5.7 -5.7 -5.6<br />
+20 -6.7 -6.6 -6.6 -6.5 -6.4 -6.4 -6.3 -6.3 -6.2 -6.2<br />
19 -7.2 -7.2 -7.1 -7.1 -7.0 -6.9 6.9 -6.8 -6.8 -6.7<br />
18 -7.8 -7.7 -7.7 -7.6 -7.6 -7.5 -7.4 -7.4 -7.3 -7.3<br />
17 -8.3 -8.3 -8.2 -8.2 -8.1 -8.1 -8.0 -7.9 -7.9 -7.8<br />
16 -8.9 -8.8 -8.8 -8.7 -8.7 -8.6 -8.6 -8.5 -8.4 -8.4<br />
+15 -9.4 -9.4 -9.3 -9.3 -9.2 -9.2 -9.1 -9.1 -9.0 -9.0<br />
14 -10.0 -9.9 -9.9 -9.8 -9.8 -9.7 -9.7 -9.6 -9.6 -9.5<br />
13 -10.6 -10.5 -10.4 -10.4 -10.3 -10.3 -10.2 -10.2 -10.1 -10.1<br />
12 -11.1 -11.1 -11.0 -10.9 -10.9 -10.8 -10.8 -10.7 -10.7 -10.6<br />
11 -11.7 -11.6 -11.6 -11.5 -11.4 -11.4 -11.3 -11.3 -11.2 -11.2<br />
NWSOH No. 1 B-3 May 2010<br />
0.5<br />
°C.<br />
0.6<br />
°C.<br />
0.7<br />
°C.<br />
0.8<br />
°C.<br />
0.9<br />
°C.
Appendix C<br />
Interpretation of Weather Map Symbols<br />
CODE FIGURES AND SYMBOLS<br />
Present Weather ww, Cloud Types C LC MC H, Past Weather W 1W 2, Sky Cover N, Pressure Characteristic a.<br />
SYMBOLS FOR FRONTS, ISOBARS, ETC.<br />
SAMPLE WIND PLOT<br />
NWSOH No. 1 C-1 May 2010
PLOTTING SHIP REPORTS<br />
MIDDLE AND HIGH CLOUD TYPE (C m, C h)<br />
(N) TOTAL<br />
AMOUNT OF CLOUDS<br />
SHIP’S COURSE AND AVERAGE SPEED (Dsvs) (TTT) TEMPERATURE (Celsius)<br />
2 BAROMETRIC PRESSURE (Millibars and tenths) (PPP)<br />
27<br />
137<br />
(VV) VISIBILITY AND (WW) PRESENT WEATHER 3 HOUR PRESSURE TENDENCY AND PRESSURE CHANGE (appp)<br />
96<br />
20<br />
(TdTdTd) DEW POINT TEMPERATURE SEA WAVES INDICATOR, PERIOD (Secs.), HEIGHT (Half Meters)<br />
24<br />
20604<br />
VESSEL CALL SIGN<br />
(2PwPwHwHw) CALL<br />
181008<br />
(TwTwTw) SEA SURFACE TEMPERATURE PRIMARY SWELL (Direction, Period, Height) (d<br />
21<br />
241504<br />
w1dw1Pw1Pw1Hw1Hw1) (ddff) WIND DIRECTION AND SPEED SECONDARY SWELL (Direction, Period, Height) (dw2dw2Pw2Pw2Hw2Hw2) Low Cloud Type (C L)<br />
SSAAMMPPLLEE MMEESSSSAAGGEE DDEECCOODDEEDD::<br />
Visibility 2 miles; Wind from 230°, 25 knots; 27°C, Dew Point Temperature 24°C, Sea Level Pressure<br />
1013.7 millibars, Pressure falling, then rising. Net 3 Hour pressure change minus 2 millibars, Present<br />
Weather—rain showers, Past W eather—showers and drizzle, Fraction of sky cover by C L cloud 3<br />
eighths, CL cloud cumulus, CW cloud altocumulus, CH cloud cirrus, <strong>Ship</strong>s course South, average speed<br />
8 knots, Sea Surface Temperature 21°C, Sea Waves Period 6 seconds, height 2 meters (1 half meters),<br />
Primary Swell from 180° (South), period 10 seconds, height 4 meters, Secondary Swell running from<br />
240°, period 15 seconds, height 2 meters, total cloud amount 4 eighths.<br />
NWSOH No. 1 C-2 May 2010
NOTES<br />
_______________________________________________________________________<br />
_______________________________________________________________________<br />
_______________________________________________________________________<br />
_______________________________________________________________________<br />
_______________________________________________________________________<br />
_______________________________________________________________________<br />
_______________________________________________________________________<br />
_______________________________________________________________________<br />
_______________________________________________________________________<br />
_______________________________________________________________________<br />
_______________________________________________________________________<br />
_______________________________________________________________________<br />
_______________________________________________________________________<br />
_______________________________________________________________________<br />
_______________________________________________________________________<br />
_______________________________________________________________________<br />
_______________________________________________________________________<br />
_______________________________________________________________________<br />
_______________________________________________________________________<br />
_______________________________________________________________________<br />
_______________________________________________________________________<br />
_______________________________________________________________________<br />
_______________________________________________________________________
Weather observations from ships at sea are<br />
treasured by meteorologists as invaluable in the<br />
preparation of marine weather forecasts and<br />
storm warnings. They are also of critical<br />
importance in identifying and tracking weather<br />
systems in their worldwide movement.<br />
This completely redesigned handbook has been<br />
prepared to help you observe, code, and report<br />
weather — as easily, quickly, and accurately as<br />
possible.<br />
The National Weather Service thanks ships<br />
officers for their enormous effort and dedication<br />
as weather observers in the <strong>Voluntary</strong> <strong>Observing</strong><br />
<strong>Ship</strong> <strong>Program</strong>.<br />
Only YOU know the weather at your position.<br />
Please report it at 00, 06, 12, and 18 UTC to the<br />
National Weather Service.