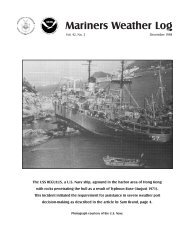
Mariners Weather Log - Voluntary Observing Ship Program - NOAA
Mariners Weather Log - Voluntary Observing Ship Program - NOAA
Mariners Weather Log - Voluntary Observing Ship Program - NOAA

Create successful ePaper yourself
Turn your PDF publications into a flip-book with our unique Google optimized e-Paper software.
<strong>Mariners</strong> <strong>Weather</strong> <strong>Log</strong><br />
Vol. 46, No. 1 Spring/Summer 2002<br />
Additional Observations of a Seventeenth Century Seafarer:<br />
William Dampier<br />
(see page 16)<br />
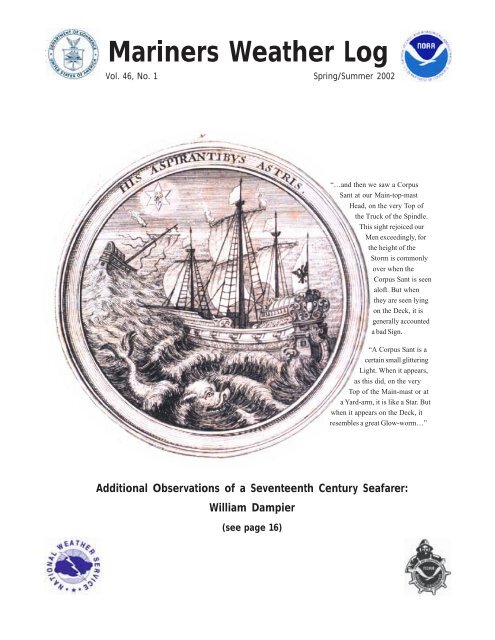
“…and then we saw a Corpus<br />
Sant at our Main-top-mast<br />
Head, on the very Top of<br />
the Truck of the Spindle.<br />
This sight rejoiced our<br />
Men exceedingly, for<br />
the height of the<br />
Storm is commonly<br />
over when the<br />
Corpus Sant is seen<br />
aloft. But when<br />
they are seen lying<br />
on the Deck, it is<br />
generally accounted<br />
a bad Sign.<br />
“A Corpus Sant is a<br />
certain small glittering<br />
Light. When it appears,<br />
as this did, on the very<br />
Top of the Main-mast or at<br />
a Yard-arm, it is like a Star. But<br />
when it appears on the Deck, it<br />
resembles a great Glow-worm…”
2 <strong>Mariners</strong> <strong>Weather</strong> <strong>Log</strong><br />
<strong>Mariners</strong> <strong>Weather</strong> <strong>Log</strong><br />
U.S. DEPARTMENT OF COMMERCE<br />
Donald L. Evans, Secretary<br />
National Oceanic and<br />
Atmospheric Administration<br />
Conrad C. Lautenbacher, Jr., Administrator<br />
National <strong>Weather</strong> Service<br />
John J. Kelly, Jr.,<br />
Assistant Administrator for <strong>Weather</strong> Services<br />
Editorial Supervisor<br />
Robert A. Luke<br />
Editor<br />
Bernadette T. Duet<br />
Layout/Design<br />
Bernadette Duet<br />
Stuart Hayes<br />
Patti Geistfeld<br />
Articles, photographs, and letters should be sent<br />
to:<br />
Mr. Robert A. Luke, Editorial Supervisor<br />
<strong>Mariners</strong> <strong>Weather</strong> <strong>Log</strong><br />
NDBC (W/OPS 52)<br />
Bldg 1100, Room 353D<br />
Stennis Space Center, MS 39529-6000<br />
Phone: (228) 688-1457 Fax: (228) 668-3153<br />
E-mail: robert.luke@noaa.gov<br />
<strong>Mariners</strong> <strong>Weather</strong> <strong>Log</strong><br />
From the Editorial Supervisor<br />
Welcome to Spring. The birds are singing,<br />
flowers are blooming, and the sun’s<br />
warmth is re-energizing the earth. So I<br />
happen to look at the world from a northern hemispheric<br />
perspective - sorry to my friends in the South. It is just that<br />
I get all excited as the warm weather of spring returns. Of<br />
course, living in southern Mississippi, it only lasts a few<br />
weeks until the sweltering heat and humidity of the deep<br />
south returns. When you add the fire ants, the<br />
overabundance of mosquitoes, and the intense, springtime<br />
thunderstorms, you wonder why anyone would want to<br />
live here at all.<br />
Actually, I believe that being out at sea is the best you can<br />
ask for in life. You get the warmth of the sun and the wind<br />
in your face to make you feel free and alive as you travel<br />
all around this beautiful orb that we call home.<br />
As the seasons change, so does life. There will be good<br />
times as well as bad, and it is up to us as to how we read<br />
the clouds and weather our storms.<br />
In this issue, we have changed our issue date to reflect the<br />
seasons. We also say farewell to one of our own, Jim<br />
Nelson, our Houston PMO, who has retired and found his<br />
snug harbor. We get a valuable history lesson about the<br />
Edmund Fitzgerald that can keep us safe in the future,<br />
and to reflect upon the past, the British Met Office<br />
donated an interesting article about the escapades and<br />
observations of a seventeenth century seafarer named<br />
William Dampier.<br />
So, no matter on what bearing life has you traveling today,<br />
find a leeward shelter for awhile and enjoy our latest<br />
offering of the <strong>Mariners</strong> <strong>Weather</strong> <strong>Log</strong>. – Luke<br />
Some Important Web Page Addresses<br />
<strong>NOAA</strong> http://www.noaa.gov<br />
National <strong>Weather</strong> Service http://www.nws.noaa.gov<br />
National Data Buoy Center http://www.ndbc.noaa.gov<br />
AMVER <strong>Program</strong> http://www.amver.com<br />
VOS <strong>Program</strong> http://www.vos.noaa.gov<br />
SEAS <strong>Program</strong> http://seas.nos.noaa.gov/seas/<br />
<strong>Mariners</strong> <strong>Weather</strong> <strong>Log</strong> http://www.nws.noaa.gov/om/<br />
mwl/mwl.htm<br />
Marine Dissemination http://www.nws.noaa.gov/om/<br />
marine/home.htm<br />
U.S. Coast Guard http://www.navcen.uscg.gov/<br />
Navigation Center marcomms/<br />
See these Web pages for further links.
Table of Contents<br />
<strong>Mariners</strong> <strong>Weather</strong> <strong>Log</strong><br />
Edmund Fitzgerald Remembered .................................................................................................................. 4<br />
<strong>Ship</strong>wreck - George Stone ........................................................................................................................... 11<br />
The Beatrice Hurricane ...............................................................................................................................12<br />
Houston PMO Retires .................................................................................................................................14<br />
Seventeenth Century Seafarer, William Dampier .......................................................................................16<br />
Marine Prediction Center Sets Sail on First Alliance ...................................................................................23<br />
VOS Climate Project ...................................................................................................................................24<br />
Attention <strong>Ship</strong> Owners, <strong>Ship</strong> Operators and Navigation Officers - We Need Obs<br />
South African <strong>Weather</strong> Service ..................................................................................................................37<br />
New Great Lakes <strong>Weather</strong> Station .............................................................................................................79<br />
Departments:<br />
Marine <strong>Weather</strong> Review<br />
North Atlantic, Sept.– Dec. 2001 ...................................................................................................38<br />
North Pacific, Sept. - Dec. 2001 ....................................................................................................51<br />
Tropical Atlantic and Tropical East Pacific, Sept. - Dec. 2001 .....................................................62<br />
Coastal Forecast Office News ....................................................................................................................80<br />
Alaskan Waters: Collecting <strong>Ship</strong>s Observations .............................................................................80<br />
Awards ...........................................................................................................................................83<br />
VOS <strong>Program</strong> ..............................................................................................................................................86<br />
VOS New Recruits ........................................................................................................................86<br />
VOS Awards ..................................................................................................................................87<br />
Meteorological Services<br />
Observations ...................................................................................................................................92<br />
Spring/Summer 2002 3
Great Lakes Storm November 9-11,1998:<br />
Edmund Fitzgerald Remembered<br />
Kirk Lombardy<br />
Marine Forecaster<br />
NWS, Cleveland, Ohio<br />
4 <strong>Mariners</strong> <strong>Weather</strong> <strong>Log</strong><br />
Edmund Fitzgerald<br />
The author wishes to express his respect toward the Captains and crews of the Great Lakes shipping<br />
industry. The issue of the great tragedy of the Edmund Fitzgerald would rather be kept solemn by<br />
many. The intent of this article is to show how the interaction between the National <strong>Weather</strong> Service<br />
and marine interests has progressed in the last 24 years.<br />
On 10 November 1975, the<br />
most notorious Great<br />
Lakes shipping disaster<br />
occurred. The SS Edmund<br />
Fitzgerald sank and it’s crew of<br />
29 men perished in the deep<br />
waters of Lake Superior during<br />
an intense storm which had<br />
developed over the central United<br />
States and made a bee-line for<br />
the western Great Lakes.<br />
Twenty-three years later, a case<br />
of deja vu settled in on the<br />
anniversary of the SS Edmund<br />
Fitzgerald. From 9 - 11<br />
November 1998, a storm of equal<br />
proportions developed over the<br />
same area as the Fitzgerald<br />
storm and followed a similar path<br />
toward the western Great Lakes.<br />
However, this time there was an<br />
improved forecast, warning, and<br />
dissemination system in place.<br />
Final Voyage of the SS<br />
Edmund Fitzgerald<br />
On 9 November 1975,<br />
Fitzgerald began loading at<br />
Burlington Northern Railroad<br />
Dock No. 1, in Superior, WI. The<br />
ship’s final voyage would carry<br />
taconite; destined for Detroit, MI<br />
(Figure 1).<br />
Fitzgerald departed at full speed<br />
of approximately 14 Knots (16<br />
mph). Two hours into the voyage,<br />
the ship arrived at a point near<br />
Two Harbors, MN. The SS<br />
Arthur M. Anderson, owned by<br />
the United States Steel Corp.,<br />
bound for Gary, IN proceeded<br />
eastward on a similar course as<br />
Fitzgerald. The two ships were<br />
approximately 10 to 20 miles apart.<br />
Routine weather reports, via radio,<br />
were made at 0600 UTC (0100<br />
EST) and 1200 UTC (0700 EST)<br />
by the Fitzgerald on 10<br />
November. At 1220 UTC (0720<br />
EST), a normal radio report was<br />
made to the company office. The<br />
report indicated the estimated time<br />
of arrival was indefinite due to<br />
weather.<br />
Fitzgerald headed northeast<br />
away from the recommended<br />
shipping lanes along the south<br />
shore of Lake Superior. (Strong<br />
northeast storm force winds<br />
caused extremely high waves at<br />
the end of the fetch on the south<br />
shore of the lake).<br />
Fitzgerald’s new course passed<br />
approximately half way between<br />
Isle Royal and the Keewanaw<br />
Peninsula. At this point, the ship<br />
turned eastward to parallel the<br />
northern shore of Lake Superior<br />
and then southeast-ward along the<br />
eastern shore. Fitzgerald reached<br />
a point approximately 11 miles<br />
Northwest of Michipicoten Island<br />
at 1800 UTC (1300 EST),<br />
10 November. The ship passed to<br />
the West of Michipicoten West<br />
End Light. At this point,<br />
Fitzgerald changed course to<br />
pass north and east of Caribou<br />
Island on a southeast heading<br />
toward Whitefish Bay, MI.<br />
The SS Edmund Fitzgerald sank<br />
near the International Boundary<br />
Line some time after 0015 UTC<br />
(1915 EST). Her final coordinates<br />
were 46°59.9’N, 85°06.6’W.
SS Edmund Fitzgerald<br />
Encountered <strong>Weather</strong><br />
The storm of historical proportions<br />
developed over the Oklahoma<br />
Panhandle on 8 November, and by<br />
1200 UTC (0700 EST), on 9<br />
November, this strengthening<br />
storm was located over southern<br />
Kansas (Figure 2).<br />
The track at this time was to the<br />
northeast with a minimum<br />
barometric pressure of 29.53" of<br />
Hg. On 9 November at 1200 UTC<br />
(0700 EST), National <strong>Weather</strong><br />
Service (NWS) forecast maps for<br />
surface conditions out to 36-hours<br />
predicted that the storm would<br />
track in a northeast direction and<br />
pass just south of Lake Superior<br />
by 0000 UTC on 11 November<br />
(1900 EST 10 November).<br />
The NWS made several revisions<br />
to the forecasts by gradually<br />
increasing the wind speed and<br />
wave heights.<br />
Edmund Fitzgerald<br />
Gale warnings were issued in early<br />
forecasts on 9 November for the<br />
eastern portions of Lake Superior.<br />
Successive forecasts indicated<br />
winds would increase from the<br />
east-northeast at 25 to 37 knots<br />
during the night of 9 November.<br />
Since the low was forecast to pass<br />
south of Lake Superior, winds<br />
were expected to gradually shift<br />
around to the north and then<br />
northwest.<br />
Gale warnings were upgraded to<br />
storm warnings at 0700 UTC<br />
(0200 EST) on 10 November.<br />
Later forecast revisions called for<br />
winds to increase to 35 to 50 knots<br />
from the northeast and then<br />
diminish slightly to 28 to 38 Knots<br />
from the northwest on Tuesday,<br />
11 November. Waves were<br />
forecast to build to 8 to 16 feet by<br />
Monday afternoon.<br />
A cold front extended about 20<br />
miles west of Caribou Island,<br />
Ontario and was moving at a<br />
speed of 20 to 25 knots toward the<br />
east. Earlier forecasts projected<br />
the low to pass just south of Lake<br />
Superior. The forecasters noticed<br />
the low would pass slightly further<br />
north over the eastern end of<br />
Lake Superior and forecasts had<br />
to be revised.<br />
Based on the latest position and<br />
forecast track of the storm, the<br />
forecasters knew the wind speed<br />
was under forecast. A revision to<br />
the forecast was made at 2139<br />
UTC (1639 EST) on 10<br />
November. The wind was<br />
increased to 38 to 52 knots from<br />
Spring/Summer 2002 5
the northwest. Gusts to 60 knots<br />
were also expected.<br />
The early forecasts for this event<br />
indicated an increase in wind<br />
speed as the storm moved<br />
northeast. However, the forecasts<br />
considerably under estimated the<br />
strength of the storm and its<br />
motion.<br />
Each forecast revision had<br />
stronger forecast winds than the<br />
previous forecast. This was likely<br />
a result of limited forecast<br />
guidance and a reaction, by the<br />
forecasters, to the deepening<br />
storm.<br />
Another difficult situation the<br />
forecasters encountered was how<br />
6 <strong>Mariners</strong> <strong>Weather</strong> <strong>Log</strong><br />
to handle the changing wind<br />
directions and speeds as the low<br />
moved over the lake. The ultimate<br />
goal is to convey a clear and<br />
concise forecast. However, this<br />
storm did not prove to be easy to<br />
describe the forecast wind<br />
conditions.<br />
<strong>Ship</strong>s that were built in the 1970s<br />
were thought to be invincible and<br />
that they could handle rough seas.<br />
The improving technology allowed<br />
engineers to design larger ships.<br />
According to the Port<br />
Meteorological Officer stationed<br />
in Cleveland, Ohio, the larger and<br />
stronger ships gave crews a false<br />
sense of security. Crews and the<br />
shipping industry took the risk and<br />
Edmund Fitzgerald<br />
battled the strong winds and rough<br />
seas the Great Lakes had to offer.<br />
The combination of a complex<br />
forecast, the need to frequently<br />
update the forecasts, and the<br />
unknown risks encountered by the<br />
ship’s crew contributed to the<br />
demise of the Edmund Fitzgerald.<br />
The effects of the storm finally<br />
abated by 0600 UTC (0100 EST)<br />
on 11 November.<br />
The final track of the storm was<br />
just north of the forecast track on<br />
9 November. The storm moved<br />
from the northeast corner of<br />
Kansas on 9 November to east<br />
central Iowa, central Wisconsin on<br />
10 November, Marquette,<br />
Michigan, west of Michipicoten<br />
Island on Lake Superior, White<br />
River, Ont., southern tip of James<br />
Bay, and finally to eastern Hudson<br />
Bay on 11 November. The lowest<br />
recorded pressure of the storm<br />
was 28.95" Hg.<br />
The SS Edmund Fitzgerald<br />
encountered winds and seas that<br />
were forecast by the NWS. The<br />
following are some actual weather<br />
observations that were reported by<br />
the crew of the Fitzgerald: At<br />
0600 UTC (0100 EST) on 10<br />
November, the ship was about 20<br />
miles due south of Isle Royal and<br />
reporting winds from the northeast<br />
at 52 knots and waves of 10 feet.<br />
Then, six hours later, Fitzgerald<br />
reported she was about 35 miles<br />
north of Copper Harbor, MI, and<br />
reported winds from the northeast<br />
at 35 knots and waves of 10 feet.
This was the final weather report<br />
sent by Fitzgerald.<br />
The nearby vessel SS Arthur M.<br />
Anderson was in the vicinity of<br />
the Fitzgerald when the weather<br />
observations were reported. The<br />
Anderson substantiated<br />
Fitzgerald’s weather observations<br />
at 0600 UTC (0100 EST) and<br />
1200 UTC (0700 EST) on<br />
10 November.<br />
Further west (approximately 15<br />
miles southwest of the<br />
Anderson), a Canadian motor<br />
vessel Simcoe reported winds<br />
from the west at 44 knots and<br />
waves 7 feet at 1800 UTC (1300<br />
EST) on 10 November. An<br />
automated weather sensing unit at<br />
Stannard Rock was reporting<br />
winds from the west-northwest at<br />
50 knots, gusting to 59 knots. At<br />
0000 UTC on 11 November (1900<br />
EST 10 November), Stannard<br />
Rock was reporting westnorthwest<br />
winds at 40 knots,<br />
gusting to 65 knots.<br />
Great Lakes Storm - November<br />
9-11, 1998<br />
Storm Track and History<br />
A major storm system developed<br />
over the Four Corners region of<br />
the United States on 8 November<br />
1998 and moved rapidly east to the<br />
Oklahoma Panhandle (Figure 3).<br />
By 1500 UTC (1000 EST) on 9<br />
November 1998, the storm had<br />
deepened to a central pressure of<br />
29.47" Hg. Further deepening was<br />
Edmund Fitzgerald<br />
Figure 3 - The storm track of the Great Lakes Storm,<br />
November 9-11, 1998.<br />
expected to occur during the next<br />
36 hours. The storm began to track<br />
northeast through Kansas,<br />
southeast Nebraska, central Iowa,<br />
southeast Minnesota, to northern<br />
Wisconsin where the central<br />
pressure dropped to 28.51" Hg at<br />
approximately 2100 UTC (1600<br />
EST) on 10 November. This is the<br />
lowest recorded pressure of the<br />
storm and fell well below the<br />
minimum pressure of the Edmund<br />
Fitzgerald storm (28.95" Hg).<br />
Gale warnings were issued at 1500<br />
UTC (1000 EST) on 9 November<br />
for Lake Superior. East-southeast<br />
winds to 30 knots were forecast<br />
for the early portions of Monday<br />
night but were forecast to increase<br />
to gale strength to 35 knots late at<br />
night. Waves were forecast to<br />
build to 6 to 8 feet overnight.<br />
Winds were expected to shift to<br />
east-northeast and increase to 45<br />
knot gales on Tuesday while<br />
waves were forecast to continue<br />
to build to 8 to 12 feet during the<br />
day.<br />
Storm warnings were issued at<br />
2100 UTC (1600 EST) on 9<br />
November for the eastern two<br />
thirds of Lake Superior as winds<br />
were forecast to reach storm<br />
force of 50 knots on Tuesday.<br />
Waves were forecast to continue<br />
to build to 7 to 12 feet Tuesday<br />
and to 12 to 20 feet Tuesday night.<br />
The highest waves were forecast<br />
for the eastern two thirds of Lake<br />
Superior.<br />
Storm warnings were issued for<br />
the rest of Lake Superior by 0900<br />
UTC (0400 AM EST). Storm<br />
force winds were forecast to<br />
Spring/Summer 2002 7
increase to 60 knots from the<br />
west-northwest on Wednesday<br />
with waves of 12 to 20 feet across<br />
the lake.<br />
The forecasts that were issued by<br />
the NWS were consistent<br />
throughout the entire event. No<br />
major changes in the forecast<br />
were made when a new forecast<br />
was issued.<br />
Overall, the forecasts for Lake<br />
Superior were accurate and gave<br />
the Captains and crews nearly 40<br />
hours of lead time to prepare for<br />
the arrival of the storm and to<br />
move their vessels to safe harbor.<br />
As previously mentioned, the<br />
highest wind speeds were not<br />
expected to occur on Lake<br />
Superior until Wednesday, 11<br />
November. Observations from<br />
various reporting stations indicated<br />
sustained winds on the lake were<br />
above 50 knots with gusts over 60<br />
knots. The highest recorded wave<br />
height was 15 feet on Lake<br />
Superior. Waves were likely higher<br />
in locations where reporting sites<br />
were not available; especially on<br />
the down wind end of the lake<br />
where the greatest fetch occurred.<br />
More about the observations on<br />
Lake Superior and the rest of the<br />
Great Lakes will be discussed later<br />
in the Wind and Wave Reports<br />
section of this report.<br />
The final track of the storm was<br />
across extreme western Lake<br />
Superior to northern Lake Superior<br />
and then on to James Bay and the<br />
Hudson Bay by 1500 UTC (1000<br />
EST) on 11 November 1998. The<br />
8 <strong>Mariners</strong> <strong>Weather</strong> <strong>Log</strong><br />
Edmund Fitzgerald<br />
storm’s central pressure<br />
maintained a steady state<br />
averaging about 28.70" Hg as it<br />
moved from Lake Superior to the<br />
Hudson Bay. This storm followed<br />
a similar track as the Edmund<br />
Fitzgerald storm. Seas and winds<br />
were higher and stronger<br />
respectively, as reported by ships<br />
and buoys in the more recent<br />
storm than the historical storm.<br />
This is likely the result of an<br />
increase in the number of buoys<br />
and reporting stations on the Great<br />
Lakes.<br />
A commercial shipping company<br />
called the NWS Office in<br />
Cleveland, Ohio to report that the<br />
storm was being compared to the<br />
Fitzgerald storm. Captains of the<br />
large vessels heeded warnings and<br />
dropped anchors during the storm<br />
in safe harbor. They were not<br />
about to take any chances with the<br />
storm.<br />
National <strong>Weather</strong> Service<br />
Statements and Bulletins<br />
The National <strong>Weather</strong> Service<br />
Forecast Office in Cleveland, Ohio<br />
is responsible for issuing storm<br />
outlooks for the entire Great Lakes<br />
as part of the marine enhancement<br />
program.<br />
NWS Cleveland issued a storm<br />
outlook for the entire Great Lakes<br />
at 0530 UTC (0030 EST) on 9<br />
November 1998. The first Storm<br />
Bulletin was issued at 1730 UTC<br />
(1230 EST) on 10 November and<br />
bulletins continued through 2200<br />
UTC (1700 EST) on 11 November<br />
when all Storm Warnings for the<br />
Great Lakes were downgraded to<br />
Gale Warnings. A total of 10<br />
reports were issued at three hour<br />
intervals.<br />
Wind and Wave Reports<br />
The highest wind gust reported on<br />
all of the lakes was from a ship<br />
anchored about 4 miles off of<br />
Sandusky Breakwater on Lake<br />
Erie; which is on the south shore of<br />
the lake. At 2050 UTC (1550<br />
EST), on 10 November, the ship<br />
reported a wind gust to 98 knots<br />
(113 mph) from the westsouthwest<br />
and waves of five feet.<br />
The low wave height of 5 feet was<br />
due to lack of fetch across the<br />
water. The highest waves occur at<br />
the downwind end of the lake.<br />
The maximum sustained wind<br />
speeds and gusts that occurred on<br />
each of the lakes as reported by<br />
various stationary observational<br />
points are as follows:<br />
Lake Superior - northwest at 52<br />
knots with gusts to 63 knots;<br />
Lake Michigan - southwest at 41<br />
knots gusts to 54 knots;<br />
Lake Huron - south at 23 knots<br />
with gusts to 51 knots;<br />
Lake Erie - southwest at 25 knots<br />
with gusts to 64 knots; and<br />
Lake Ontario - southeast at 49<br />
knots with gusts to 64 knots.<br />
The highest waves reported on<br />
each of the lakes were as follows:<br />
Lake Superior - 15 feet<br />
Lake Michigan - 20 feet<br />
Lake Huron - 14 feet
Lake Erie - 20 feet<br />
Lake Ontario - 13 feet<br />
Higher waves likely occurred at<br />
locations without reporting sites.<br />
Today, ship Captains and crews<br />
heed warnings issued by the<br />
National <strong>Weather</strong> Service to<br />
protect not only their lives but their<br />
expensive ships and cargo.<br />
Captains will drop the ship’s<br />
anchor in sheltered areas such as<br />
behind islands and in navigable<br />
rivers for protection.<br />
Storm Event Problems<br />
Strong southwest winds forced<br />
shallow water away from Saginaw<br />
Bay and the basin on the west end<br />
of Lake Erie. This caused<br />
dangerously low water levels to<br />
occur and put vessels either in the<br />
basin or planning on navigating in<br />
the basin at risk. Tug boats that<br />
remained in the basin bottomed out<br />
due to low water levels.<br />
Another vessel, the Wolverine, hit<br />
bottom at the Bay City Work<br />
Dock. The United States Coast<br />
Guard had to assist the vessel and<br />
no serious damage to the ship<br />
resulted.<br />
Two duck hunters were reported<br />
missing on Saginaw Bay on<br />
Tuesday (10 November). The<br />
winds were so strong that the<br />
Coast Guard could not search for<br />
them until Wednesday morning.<br />
The duck hunters’ boat ended up<br />
being caught on some rocks off of<br />
Sebewaing (Huron County). One<br />
Edmund Fitzgerald<br />
of the duck hunters managed to<br />
walk to shore early Wednesday<br />
morning and the other duck hunter<br />
was lifted off the rocks by a<br />
Coast Guard helicopter later that<br />
morning. Both hunters were<br />
unharmed.<br />
Thanks to improved forecasts,<br />
warnings, and dissemination, no<br />
lives were lost during this major<br />
Great Lakes Storm.<br />
Improved National <strong>Weather</strong><br />
Service Warning and Forecast<br />
Systems<br />
The National <strong>Weather</strong> Service<br />
has made great strides over the<br />
last 20 years in the development<br />
of forecast and warning tools.<br />
Faster and more powerful<br />
computers allow forecasters to<br />
look at developing storms in great<br />
detail. This is a major step<br />
forward compared to the days of<br />
the Fitzgerald. Forecasters of<br />
the time relied on hand analyzed<br />
weather maps and crude, by<br />
today’s standards, satellite and<br />
radar weather information. The<br />
hand analyzed charts consisted of<br />
a surface map taken from routine<br />
weather observations at airports<br />
across the United States and<br />
Canada. The upper air maps were<br />
plotted using upper air soundings<br />
from weather balloons launched<br />
twice-a-day at 0000 UTC and<br />
1200 UTC. All of this information<br />
was fed into computers to<br />
generate weather forecast maps<br />
for the next few days.<br />
The computer models of the ‘70s<br />
produced limited forecast data.<br />
Most forecasts were created by<br />
comparing the hand analyzed<br />
charts to the forecast maps. Wind<br />
speed and wave forecasts on the<br />
Great Lakes were difficult to<br />
make due to limited observation<br />
data. Frequently, the forecasts had<br />
to be updated based on ship and<br />
shore reports across the Great<br />
Lakes.<br />
Communication systems of the<br />
‘70s were limited to the technology<br />
of the time. Data transmission was<br />
very slow and forecasts had to be<br />
delivered from one place to<br />
another on paper rather than<br />
electronically. <strong>Ship</strong> to shore radios<br />
were the only means ship Captains<br />
had to receive the latest forecasts.<br />
The NWS used a Di-Fax system<br />
to receive weather forecast maps<br />
and noisy teletype machines to<br />
transmit and receive text data.<br />
The NWS has undergone a major<br />
transformation over the last 10<br />
years. A modernization plan was<br />
developed during the ‘80s to<br />
improve the warning and forecast<br />
systems in the NWS.<br />
Next Generation Geostationary<br />
Operational Environmental<br />
Satellites (GOES - Next) have<br />
been launched during the ‘90s to<br />
improve coverage across North<br />
America. Satellites, already in<br />
place, were beyond their usable<br />
life and were in jeopardy of failing.<br />
The GOES satellites of the ‘90s<br />
allow forecasters to see rapid scan<br />
animation loops of clouds and<br />
Spring/Summer 2002 9
moisture in great detail during<br />
significant storm events.<br />
NWS Doppler radars have the<br />
ability to detect both precipitation<br />
and air movements inside of a<br />
storm and determine the wind<br />
direction and speed. This feature<br />
was not available with the radars<br />
of the ‘70s.<br />
State-of-the-art computer systems<br />
called Advanced <strong>Weather</strong><br />
Interactive Processing Systems<br />
(AWIPS) has been deployed in<br />
the NWS across the country. The<br />
AWIPS displays numerous data<br />
fields on two large computer<br />
monitors. The forecaster is able to<br />
overlay satellite data over surface<br />
weather observations while<br />
looking at Doppler radar data on<br />
the other monitor. The imagery<br />
can be animated and updated<br />
automatically. This is especially<br />
useful when looking at radar and<br />
satellite data. A third monitor is<br />
used to edit text documents, such<br />
as: marine forecasts, marine<br />
weather statements, or special<br />
marine warnings and storm<br />
warnings.<br />
A network of buoys has also been<br />
deployed on the Great Lakes to<br />
report wind and wave conditions<br />
to the forecaster.<br />
10 <strong>Mariners</strong> <strong>Weather</strong> <strong>Log</strong><br />
Computer generated weather<br />
forecast models have improved<br />
over the last 20 years and have<br />
replaced outdated models. The<br />
computer models provide detailed<br />
forecast parameters that display<br />
wind speed and direction,<br />
temperature, relative humidity,<br />
cloud levels, the location and<br />
forecast track of storm systems,<br />
and wave height forecasts. As<br />
computing power increases,<br />
smaller scale phenomena in the<br />
atmosphere such as lake effect<br />
precipitation and lake breezes are<br />
being simulated with greater<br />
precision.<br />
A denser network of land surface<br />
weather observations from<br />
Automated Surface Observation<br />
Systems (ASOS) and marine<br />
weather observations such as<br />
buoys and ship reports, also aids<br />
in providing more data for detailed<br />
forecasts.<br />
The result will be improved<br />
weather forecasts because small<br />
scale changes in the atmosphere<br />
will be detected earlier and with<br />
greater precision.<br />
The NWS will continue to strive<br />
for improved forecast, warning,<br />
and dissemination systems to<br />
ensure the safety of marine<br />
interests.<br />
Edmund Fitzgerald<br />
Acknowledgments<br />
My gratitude to Daron Boyce -<br />
former Senior Marine<br />
Forecaster and George Smith -<br />
Port Meteorological Officer,<br />
from the National <strong>Weather</strong><br />
Service Office in Cleveland,<br />
Ohio for their expertise in the<br />
historical perspective of the<br />
events leading to the Edmund<br />
Fitzgerald incident.<br />
My thanks also to Gary Carter -<br />
former Chief of Scientific<br />
Services Division at the<br />
National <strong>Weather</strong> Service<br />
Eastern Region Headquarters<br />
and Robert LaPlante - Science<br />
Operations Officer for the<br />
National <strong>Weather</strong> Service Office<br />
Cleveland, OH who contributed<br />
input, comments, and<br />
suggestions to this report.<br />
References<br />
Merzlock, P., 1998: A report on the<br />
Great Lakes storm of<br />
November 9-11, 1998.<br />
Marine Casualty Report - SS<br />
Edmund Fitzgerald; Sinking in<br />
Lake Superior on 10 November<br />
1975 with Loss of Life, 1977,<br />
Department of Transportation -<br />
United States Coast Guard, p. 18-<br />
32.
SHIPWRECK - George Stone<br />
By Skip Gillham<br />
The George Stone was a<br />
typical wooden Great<br />
Lakes freighter of the<br />
latter part of the 19th century.<br />
The 282-foot, 6-inch long bulk<br />
carrier was built by F.W. Wheeler<br />
& Co. and launched at West Bay<br />
City, MI on June 20, 1893.<br />
The 1,841 gross ton vessel went to<br />
work in the Bradley fleet and<br />
hauled cargoes such as iron ore,<br />
coal and grain. It is shown in a<br />
photo (on right) from the collection<br />
of the Milwaukee Public Library.<br />
George Stone was in a collision<br />
that sank the schooner S.H.<br />
Kimball on May 8, 1895. The<br />
Kimball went down in Lake<br />
Huron off Point aux Barques.<br />
Later, in 1898, the George Stone<br />
was one of 67 ships locked in the<br />
ice that had to be freed by an<br />
icebreaker from Detroit.<br />
On October 13, 1909, the George<br />
Stone was carrying 2,800 tons of<br />
coal loaded at Ashtabula, OH for<br />
delivery to Racine, WI. A<br />
southwest gale caught the sixteenyear-old<br />
steamer in the Pelee<br />
Passage on Lake Erie, and it ran<br />
aground on Grubb Reef. A<br />
kerosene lamp in the pilothouse<br />
overturned, and the structure<br />
caught fire.<br />
Attempts to get help were<br />
fruitless. The wooden lifeboat<br />
smashed against the hull and<br />
broke up after launching. The<br />
Captain was one of eight men<br />
who then tried to take the steel<br />
lifeboat ashore, but it overturned<br />
before reaching land. Two sailors<br />
made it, but the Master was lost<br />
as he waded the final few yards.<br />
He was overwhelmed by the<br />
undertow and swept away. His<br />
body was found the next spring<br />
near Conneaut, OH on the other<br />
side of the lake.<br />
Conditions on the George Stone<br />
were deteriorating. Water poured<br />
into the hull through the seams,<br />
and the pumps became clogged<br />
with coal dust and shut down.<br />
<strong>Ship</strong>wreck - George Stone<br />
George Stone<br />
Fortunately, the steamer F.M.<br />
Osborne spotted the distressed<br />
vessel and was able to get into<br />
position to remove the ten sailors<br />
who had remained on board.<br />
Before long the George Stone<br />
began to break apart and was a<br />
total loss.<br />
But the ordeal was not over. The<br />
George Stone had been<br />
operating with a non-union crew,<br />
and they had been pelted with<br />
stones leaving Ashtabula. Even<br />
the survivors received a rude<br />
welcome arriving at Detroit.<br />
They were met by a mob before<br />
authorities intervened and<br />
secured their safety.<br />
Spring/Summer 2002 11
The Beatrice Hurricane: 15 September 1903<br />
Capt. E.L. Sherrill<br />
Norfolk, Virginia<br />
The menhaden fishing<br />
steamer Beatrice was one<br />
of the casualties of the<br />
hurricane that hit the mid-Atlantic<br />
coastline on 15 September 1903.<br />
This purse-seiner, owned by the<br />
Atlantic Fisheries Company, was<br />
caught by the storm when<br />
returning to their factory at Cape<br />
Charles, VA. She had been built in<br />
1878 by Robert Palmer and Sons,<br />
at Noank, CT, and had been<br />
lengthened from 105 feet to 135<br />
feet in 1900. She was powered by<br />
a 170 hp reciprocating steam<br />
engine, but, like most purse seiners<br />
of her day, also carried a suit of<br />
sails. To take advantage of fair<br />
winds, she could set a jib, main,<br />
and from a mast stepped on her<br />
after deckhouse, a small mizzen.<br />
The hurricane that was to prove<br />
fatal to the Beatrice and other<br />
vessels struck Florida on 12<br />
September, crossing the state from<br />
SE to NW. News, as well as<br />
weather forecasts, traveled more<br />
slowly in those days, and it was not<br />
until three days later that the<br />
Virginian-Pilot newspaper in<br />
Norfolk carried a full report of the<br />
damage it had caused. The<br />
headlines on 15 September<br />
declared, “Florida swept by storm<br />
that carries death and destruction<br />
in its path.” Further down the page<br />
was noted, “Southern storm<br />
12 <strong>Mariners</strong> <strong>Weather</strong> <strong>Log</strong><br />
expected to be here today.” By<br />
then, however, it was too late to<br />
give any warning to the Beatrice,<br />
or any of the other craft then at<br />
sea.<br />
The Beatrice, commanded by<br />
Capt. William Leland of Irvington,<br />
VA, had left the dock the previous<br />
Sunday night. Along with the fleets<br />
from the other fish factories on<br />
Chesapeake Bay and the<br />
Delmarva Peninsula, she would<br />
cruise the coastal waters until<br />
menhaden were spotted from the<br />
crow’s nest. They found large<br />
schools, or “places” of them, just<br />
beginning their annual southward<br />
migration, off the mouth of<br />
Delaware Bay. By Tuesday<br />
afternoon, the Beatrice had a full<br />
load and was heading back down<br />
the beach for Cape Charles.<br />
Following about 6 nmi behind her<br />
was the Atlantic, another steamer<br />
from the Atlantic Fisheries Co.,<br />
and further astern was the Alden<br />
S. Swan, from a factory at<br />
Harborton.<br />
At around 2100, when off the<br />
Blackfish Banks and almost<br />
abreast of Assateague Lighthouse,<br />
the Beatrice ran into the<br />
hurricane. Exactly what her<br />
captain did to try and weather the<br />
storm will never be known, but we<br />
know what was done by the<br />
The Beatrice Hurricane<br />
Atlantic, and can conclude that<br />
on the Beatrice they were doing<br />
much the same. The Atlantic,<br />
caught by the sudden blast of wind<br />
and a swiftly rising sea, tried to set<br />
her jib to hold her head up to it.<br />
This did not work (in any case it<br />
was too bad a night to keep any<br />
canvas aloft), and her engine -<br />
even at 350 hp - was not powerful<br />
enough to keep her driving into the<br />
seas. She was shipping water over<br />
her decks and clear over her<br />
pilothouse, but somehow they<br />
managed to get her anchor<br />
overboard. That held her until the<br />
hurricane passed, and she was<br />
able to get on her way again. The<br />
Atlantic had suffered heavy<br />
damage, and had lost her seine<br />
boats, net, and pieces of her rails.<br />
The Alden S. Swan, when the<br />
storm struck, turned and beat her<br />
way back up the beach, finally<br />
gaining shelter at Delaware<br />
Breakwater. The Atlantic, badly<br />
battered, returned to Cape Charles<br />
and got her fish out. She then put<br />
back out to sea to search for the<br />
Beatrice, which had still not<br />
arrived. After searching all day<br />
without any sight of the Beatrice<br />
or the Swan, she put in to Norfolk<br />
for repairs. By this time, the<br />
Virginian-Pilot was reporting that<br />
both of these boats were missing<br />
and presumed lost.
The Alden S. Swan made it<br />
safely to Delaware Breakwater<br />
and was reported there on<br />
19 September. The Beatrice’s<br />
fate was to remain a mystery, at<br />
least for eleven days. On<br />
26 September, her stern section,<br />
including her engine room and<br />
after deckhouse, washed ashore<br />
at Caffeys Inlet Life Saving<br />
Station, just above Duck, N.C. It<br />
had drifted 105 nmi from where<br />
she had last been seen off the<br />
Blackfish Banks. The same day,<br />
her bow and the forward part of<br />
her hull were reported ashore<br />
near Virginia Beach. No trace<br />
was ever found of the 28 souls<br />
who had been her crew.<br />
Steamer Beatrice<br />
Why had the Beatrice foundered,<br />
when her two consorts, the<br />
Atlantic and the Swan, had safely<br />
weathered the storm? The answer<br />
may lie in the way she had been<br />
rebuilt, three years previous. She<br />
had been lengthened 20 feet and<br />
had her main deck raised 2 feet.<br />
This may have aggravated a weak<br />
spot at her midships section where<br />
her fish hold was located -<br />
menhaden steamers tend to load<br />
and unload rapidly, which puts on a<br />
lot of hogging and sagging<br />
stresses. From her wreck having<br />
been found split into two sections,<br />
it would seem that her hull had<br />
failed in this area.<br />
The Beatrice Hurricane<br />
Life still had to go on, however,<br />
and in the days following the<br />
hurricane, the fleet was back out<br />
on the fishing grounds. There is no<br />
record that any monument was<br />
built for the Beatrice or any<br />
memorial service ever held for her<br />
crew. Her memory was preserved<br />
only by the expression of old<br />
timers in the industry, who, when<br />
caught in a blow offshore, with<br />
night coming on and safe harbor a<br />
long ways ahead, would say, “This<br />
is as bad as the night the Beatrice<br />
was lost.”<br />
Editor’s note:<br />
Captain Sherrill is correct that<br />
the Beatrice was lost at sea due<br />
to a hurricane. Although the<br />
climatological records are a bit<br />
fuzzy, there were actually two<br />
storms off the Atlantic seaboard<br />
during September 1903.<br />
The hurricane that struck<br />
Florida had already crossed<br />
over Florida and was inland<br />
over the AL-GA border and in a<br />
weak tropical storm status by the<br />
September 15.<br />
The second hurricane was east<br />
of the VA Capes on the 15th with<br />
peak intensity of sustained<br />
winds of 70 - 85 kt. - Luke<br />
Spring/Summer 2002 13
HOUSTON PORT METEOROLOGICAL<br />
OFFICER, JIM NELSON, RETIRES<br />
By Robert Luke<br />
VOS <strong>Program</strong> Lead<br />
Jim Nelson, the Houston,<br />
Texas Port Meteorological<br />
Officer (PMO) retired<br />
from Government service on<br />
March 29, 2002.<br />
Jim Nelson began his official<br />
government career 47 years ago<br />
when he joined the “wooden ships<br />
and iron men” of the U.S. Navy.<br />
Actually, he had been serving in<br />
this nomadic life for years, for he<br />
had salt in his blood from the day<br />
he was born – his father was a<br />
Navy Chief.<br />
After basic training, Jim was sent<br />
to Oklahoma for additional military<br />
bearing, and it was there that Jim<br />
encountered his first tornado and<br />
gained an interest in weather. Jim<br />
took orders to the Navy <strong>Weather</strong><br />
School in Lakehurst, NJ. Upon<br />
graduating, Jim saw duty at many<br />
commands like the USS Antietam<br />
(CVA/CVS-36), Naval Air Station<br />
Quonset Point, RI, USS Willis A.<br />
Lee (DL-5), and the USS<br />
Courtney (DE-1015). It was<br />
aboard the Courtney that Jim<br />
learned to navigate, shoot the Sun<br />
and Stars and use LORAN “B”.<br />
While serving on the USS<br />
Otterstetter (DER-335), Jim<br />
encountered another rare and<br />
treacherous weather phenomena.<br />
14 <strong>Mariners</strong> <strong>Weather</strong> <strong>Log</strong><br />
Jim Nelson, 1955<br />
The Otterstetter was caught up<br />
in what history calls the Ash<br />
Wednesday storm that hit the<br />
European coast. On that day in<br />
1960, this storm caused<br />
considerable damage in Holland.<br />
The Otterstetter ended up<br />
breaking her back in that storm, so<br />
Jim cross decked yet again to the<br />
USS Edisto (AGB-2), just in time<br />
to make the “exotic” port calls of<br />
Thule, Greenland, and Antarctica.<br />
In the rest of Jim’s illustrious<br />
naval career, he was assigned to<br />
the USS Independence (CVA-<br />
62), and Fleet <strong>Weather</strong> Centrals in<br />
Norfolk, VA and Rota, Spain.<br />
When Jim was assigned as an<br />
Instructor back in Lakehurst<br />
where he taught aviation and<br />
Houston PMO Jim Nelson Retires<br />
Jim Nelson, today<br />
synoptic surface observations,<br />
meteorology, plotting and upper<br />
air, he finally got a chance to pay<br />
the Navy back for all the fun he<br />
had been given in past years.<br />
Jim finally hung up his anchors in<br />
1974 while serving in Charleston,<br />
SC.<br />
Not one for sitting still, Jim started<br />
his second career right away and<br />
began working for <strong>NOAA</strong> at the<br />
National Climatic Center (later<br />
renamed National Climatic Data<br />
Center) in Asheville, NC. Jim was<br />
responsible for checking surface<br />
and upper air observations for<br />
quality and correctness.<br />
Nine years later the moving itch<br />
finally won, and Jim transferred to<br />
Galveston, TX as a radar operator.<br />
In 1987, he assumed the duties as<br />
PMO in the Houston and<br />
Galveston region. Jim has been<br />
instrumental in the excellence of<br />
the VOS program and has been a<br />
benchmark to the kind of
ambassadorship and shipmate that<br />
the waterfront knows and<br />
respects.<br />
Jim has been married to the former<br />
Elizabeth (Betty) A. Jensen of<br />
Waltham MA for the last 41 years,<br />
and together they have 4 children<br />
and 4 grandchildren. Jim and Betty<br />
live in League City, TX and don’t<br />
have any plans to move to some<br />
retirement village in Florida.<br />
Instead, Jim plans to spend most of<br />
his time working in his yard and<br />
aggravating his wife.<br />
VOS participants keep a close eye on the weather<br />
and notice cloud formations as indications of<br />
weather activity. This series of cloud photos taken<br />
at L41-13N Long 68-00W southeast of<br />
Frenchmans Bay was provided by Jack McAdam,<br />
Master of <strong>NOAA</strong> ship Delaware.<br />
When asked to comment about his<br />
retirement, Jim’s only words were,<br />
“YES!! I made it!!”<br />
On behalf of the VOS program,<br />
we wish, Jim and Betty, Fair<br />
winds and following seas.<br />
Houston PMO Jim Nelson Retires<br />
Spring/Summer 2002 15
“Additional Observations”of a Seventeenth Century Seafarer:<br />
William Dampier<br />
Marine meteorological<br />
logbooks submitted to<br />
the Met Office contain<br />
a wealth of information.Of course,<br />
of primary interest to the meteorologist<br />
and the climatologist are<br />
the weather observations they<br />
contain, but the ‘Additional<br />
Observations’ of meteorological<br />
phenomena and marine fauna and<br />
flora have similar significance for<br />
those whose interests lie within<br />
the variety of subjects in these<br />
areas.<br />
In this latter category, there is little<br />
now reported by shipborne<br />
observers that has not been seen<br />
before—waterspouts,<br />
bioluminescence, birds, fish,<br />
storms, whales, dolphins, to name<br />
but a few topics — that can be<br />
commented upon or identified by<br />
specialists, with a high degree of<br />
confidence.To aid such analyses,<br />
today’s specialist can call upon the<br />
collective knowledge of<br />
yesteryear, drawing upon the<br />
observations, research and<br />
findings of the past.<br />
However, when the unusual does<br />
occur, whether it be (in the case<br />
of natural history) a ‘common’<br />
species apparently no longer<br />
present in a previously favoured<br />
area, or perhaps a ‘rarity’ seen in<br />
abundance, a large amount of<br />
interest can be generated, and<br />
16 <strong>Mariners</strong> <strong>Weather</strong> <strong>Log</strong><br />
specialists will want to account for<br />
the anomaly, or reach a conclusion<br />
about the identity of a species.<br />
William Dampier<br />
William Dampier<br />
Imagine, then, a time when the far<br />
corners of the globe were still<br />
being discovered; when new lands<br />
were claimed and mapped in the<br />
name of sovereignty (and fought<br />
over for years afterwards); when<br />
the locations of sea areas and land<br />
masses had still to be fully understood;<br />
when seafarers had only a<br />
rudimentary knowledge of meteorology;<br />
and when there was only<br />
minimal collective knowledge upon<br />
which to draw when faced with<br />
unidentified phenomena and<br />
wildlife in far-flung places.<br />
Welcome to the mid-seventeenth<br />
century — and enter one William<br />
Dampier. Born around 1651 in<br />
Somerset, he was apprenticed as a<br />
boy to a ship’s master in<br />
Weymouth, and throughout an<br />
eventful life during which he was<br />
by turns at first a trader, a plantation<br />
manager in Jamaica, and then<br />
a log-cutter in Mexico, he found<br />
his greatest adventure sailing (as a<br />
private individual) with English<br />
buccaneers. Travelling with them<br />
provided food and shelter of sorts<br />
and also a convenient means by<br />
which to satisfy his inclinations to<br />
see the world and, between 1679<br />
and 1691 he managed, unintentionally,<br />
and by a rather tortuous route<br />
to circumnavigate the globe.<br />
Dampier’s intention was, basically,<br />
to describe everything he came<br />
across in his travels — had there<br />
been a tourism industry in his day,<br />
then his observations would<br />
probably have been the equivalent<br />
of the detailed travel guides<br />
available today. In the rest of this<br />
article, we unashamedly dip into<br />
Dampier’s journals to reveal some<br />
of the accounts from his own<br />
Additional Observations.<br />
‘Red lobsters’<br />
In mid-November 1683, the<br />
buccaneers sailed from the “Coast<br />
of Guinea” heading for he Straits<br />
of Magellan via the Sibbel de<br />
Wards [Falkland Islands] where<br />
they would look for fresh water;<br />
Dampier found “nothing worthy<br />
remark” until 28 January 1684<br />
when, 10 days out from the<br />
islands, he noted some flying-fish.<br />
After that, he says:<br />
“January 28, we made the<br />
Sibbel de Wards, which are 3<br />
islands lying in the lat. of 51d.<br />
25m. South, and 57d. 28m.<br />
West Longitude from the<br />
Lizard in England, by my<br />
account.
“The Day that we made<br />
these islands, we saw great<br />
shoals of small lobsters which<br />
coloured the Sea red in spots<br />
for a Mile in compass, and we<br />
drew some of them out of the<br />
Sea in our Water-buckets.<br />
They were no bigger than the<br />
top of a Man’s little finger, yet<br />
all their Claws, both great and<br />
In 1696 a marine fish catalogue was published in which was<br />
illustrated many fish and other marine species known at the time.<br />
Whether or not the illustrations were based upon whole or parts of<br />
physical specimens, first-hand accounts or just hearsay is not known,<br />
but these three examples serve to illustrate that the age of sea<br />
monsters was still very much alive.<br />
In (a) is an apparent represntation of a Dorado, frequently reported by<br />
modern shipborne observers.<br />
(a)<br />
(<strong>NOAA</strong> Central Library)<br />
A Hammerhead shark seems to be shown in (b) although this example<br />
has been given a defined neck for some reason’ a tell-tale ‘seam’<br />
around the neck almost suggests that the artist was presented with<br />
only part of the shark, and was therefore forced to invent the<br />
remainder of the body!<br />
(b)<br />
(<strong>NOAA</strong> Central Library)<br />
In (c) the reader is best left to juge what the artist is trying to show -<br />
fish, bird or mammal?<br />
(c)<br />
(<strong>NOAA</strong> Central Library)<br />
<strong>NOAA</strong> library<br />
William Dampier<br />
small, were like a Lobster. I<br />
never saw any of this sort of<br />
Fish naturally red but here. For<br />
ours on the English Coast,<br />
which are naturally black, are<br />
not red till they are boiled. Nor<br />
did I anywhere else meet with<br />
any Fish of the Lobster-shape<br />
so small as these, except for<br />
maybe Shrimps or Prawns.”<br />
Dampier seems to have been at a<br />
loss to further identify these<br />
creatures. However, if he had had<br />
prior knowledge of the richness of<br />
life found in the cold waters of the<br />
South Atlantic Ocean, he might have<br />
been able to identify his ‘red<br />
lobsters’ as possibly either the squat<br />
lobster (Munida subrugosa) or a<br />
closely related species, or else the<br />
late larval stage of crabs. Around<br />
the Falkland Islands the adult squat<br />
lobsters have claws, swim and form<br />
swarms. The crabs in late larval<br />
stage also swim, have claws and<br />
swarm but their abdomens do not<br />
fold underneath as they do in the<br />
adult form.<br />
On the character of the Pacific<br />
Ocean<br />
In April 1684, his ship was sailing<br />
up the western coast of South<br />
America, and Dampier recorded<br />
his thoughts about the conditions<br />
found in the South Pacific Ocean:<br />
“Our passage now lay along the<br />
Pacifick Sea, properly so called.<br />
For though it is usual with our<br />
Map-makers to give that Name to<br />
this whole Ocean, calling it Mare<br />
Australe, Mare del Zur or Mare<br />
Pacificum, in my Opinion, the<br />
Name of the Pacifick Sea ought<br />
not to be extended from South to<br />
Spring/Summer 2002 17
North farther than from 30 to<br />
about 4 Deg. South Latitude, and<br />
from the American Shore Westward<br />
indefinitely. For with respect<br />
to my observation, I have been in<br />
these parts 250 Leagues or more<br />
from Land, and still had the Sea<br />
very quiet from Winds. For in all<br />
this Tract of Water of which I<br />
have spoken, there are no dark<br />
rainy Clouds, though often a thick<br />
Horizon, so as to hinder and<br />
Observation of the Sun with the<br />
Quadrant. And in the Morning<br />
there is frequently hazy <strong>Weather</strong>,<br />
and thick Mists, but scarce able to<br />
wet one. Nor are there in this Sea<br />
any Winds but the Trade Wind,<br />
noTempests, no Tornadoes or<br />
Hurricanes (though North of the<br />
Equator, they are met with in this<br />
Ocean as well as in the Atlantick),<br />
yet the Sea itself, at the new and<br />
full of the Moon, runs with high,<br />
large, long Surges, which never<br />
break out at Sea, and so are safe<br />
enough, except for where they fall<br />
in and break upon the Shore and<br />
make it a bad landing.”<br />
The Galapagos Islands<br />
The following month the buccaneers,<br />
having captured four ships,<br />
diverted their course towards the<br />
Galapagos Islands in order to avoid<br />
trouble with the authorities in<br />
Trujillo (Peru), and Dampier’s ship<br />
plus one other “anchored on the<br />
East-side of one of the Easternmost<br />
Islands, a Mile from the<br />
shore, in sixteen Fathoms Water,<br />
clean, white, hard Sand”. He<br />
believed, however, that the English<br />
hydrographers had not charted the<br />
islands’ location accurately, for he<br />
commented:<br />
18 <strong>Mariners</strong> <strong>Weather</strong> <strong>Log</strong><br />
“The Gallapagos Islands are a<br />
great number of uninhabited<br />
Islands, lying under and on both<br />
sides of the Equator. The Easternmost<br />
of them are about 110<br />
leagues from the Main. They are<br />
laid down in the Longitude of 181,<br />
reaching to the Westward as far<br />
as 176, therefore their Longitude<br />
from England Westward is about<br />
68 degrees. But I believe our<br />
Hydrographers do not place them<br />
far enough to the Westward. The<br />
Spaniards who first discovered<br />
them, and in whose draughts alone<br />
they are laid down, report them to<br />
be a great number stretching<br />
North-West from the Line, as far<br />
as 5 degrees N., but we saw no<br />
more than 14 or 15. Some of them<br />
are 7 or 8 Leagues long, and 3 or 4<br />
broad.”<br />
He noted that the islands were not<br />
excessively hot even though they<br />
lay almost on the Equator, and also<br />
observed a continual fresh seabreeze<br />
all day. Perhaps he was<br />
unwittingly aware of the effects of<br />
the yet undiscovered Peru (or<br />
Humboldt) Current that brings cold<br />
Antarctic waters northwards along<br />
the length of South America to<br />
wash close to the Galapagos<br />
Islands before becoming part of<br />
the South Equatorial Current.<br />
Local effects of strong solar<br />
heating<br />
William Dampier<br />
Dampier also made observations<br />
of meteorological phenomena<br />
although he probably did not<br />
understand the physics behind<br />
them. While off the Pacific coast<br />
of Nicaragua in early August 1685,<br />
the buccaneers in an attempt on<br />
the port that then served Leon, had<br />
left their ships manned by skeleton<br />
crews, and Dampier accompanied<br />
520 men as they attempted to<br />
paddle 31 large canoes to the<br />
harbour “about eight Leagues from<br />
shore” [in this case one league is<br />
taken to be the old English measurement<br />
equivalent to approximately<br />
2.2 km]. He says:<br />
“We had fair <strong>Weather</strong> and little<br />
wind till two o’clock in the Afternoon,<br />
then we had a Tornado from<br />
the shore, with much Thunder,<br />
Lightning, Rain and such a gust of<br />
Wind that we were all likely to be<br />
foundered. In this extremity we<br />
put right before the Wind, every<br />
Canoe’s Crew making what shift<br />
they could to avoid the threatening<br />
danger…The fierceness of the<br />
Wind continued about half an hour<br />
and abated by degrees, and as the<br />
Wind died away, so the fury of the<br />
Sea abated. For in all hot countries,<br />
as I have observed, the Sea<br />
is soon raised by the Wind and as<br />
soon down again when the Wind is<br />
gone. Therefore there is a Proverb<br />
among Seamen: Up Wind, Up Sea,<br />
Down Wind, Down Sea.”<br />
Even though the sea was like a<br />
millpond by the evening, the<br />
canoes could not make land before<br />
darkness, and so they stayed<br />
offshore, being about 10 km away<br />
by daylight. Intending to stay<br />
offshore until darkness once more,<br />
the buccaneers sat out the daylight<br />
hours in the tropical heat, but<br />
during the afternoon they were hit<br />
by another tornado more fierce<br />
than the one experienced during<br />
the previous afternoon.<br />
In both cases the term ‘tornado’ is<br />
taken to mean a sudden localised<br />
thunderstorm rather than either the<br />
land-based phenomenon that bears
the name today, or tropical<br />
revolving storms. The cause might<br />
well have been intense solar<br />
heating and consequent convection<br />
which is a common<br />
trigger for the formation of<br />
thunderstorms around the<br />
time of maximum temperatures,<br />
particularly in the<br />
tropics. Had Dampier been<br />
able to carry a thermometer<br />
with him in his travels, he<br />
might have worked out for<br />
himself the connection<br />
between strong solar<br />
heating and the incidence of<br />
local storms, and perhaps<br />
the buccaneers might have<br />
thought twice before committing<br />
themselves to their longdistance<br />
paddle. However, they<br />
did literally live to fight another<br />
day.<br />
Orographic cloud<br />
As with the aforementioned<br />
events that Dampier obviously<br />
could not fully explain, he met<br />
with a similar puzzle when he<br />
noted what we know as<br />
orographic clouds. Whilst the ship<br />
in which he travelled was in the<br />
North Pacific Ocean in May 1686<br />
searching for the island of Guam<br />
in order to find much-needed food<br />
and water, hopes of a landfall<br />
were raised when some light rain<br />
was experienced, and he noted<br />
that “… the Clouds settling in the<br />
West were an apparent token that<br />
we were not far from Land.” He<br />
had watched how low clouds<br />
particularly seem to move quite<br />
rapidly, but that sometimes clouds<br />
seen at the horizon do not move or<br />
change very much and could be<br />
associated with land. The<br />
phenomenon was evidently of<br />
interest to him because he also<br />
comments “I have often taken<br />
notice of it, especially if it is high<br />
(R.A. Ketchington)<br />
Land, for then you shall have the<br />
Clouds hang about it without any<br />
visible Motion.”<br />
A typhoon, bioluminescence<br />
and corposants<br />
William Dampier<br />
In June 1687, Dampier and his<br />
‘companions’ arrived at the “Island<br />
Prata” [Dongshaondao, South<br />
China Sea] where they stayed for<br />
about five weeks. Although having<br />
little understanding of meteorology<br />
as a science, Dampier and the<br />
seamen of his day must have made<br />
use of a collective knowledge<br />
relating to the occurrence of<br />
particular natural phenomena and<br />
their association with subsequent<br />
meteorological events, and could<br />
act accordingly. At the beginning of<br />
July, Dampier had noted that the<br />
wind “had been whiffling about<br />
from one part of the Compass to<br />
another for two or three Days, and<br />
sometimes it would be quite calm”;<br />
as such behaviour was often a<br />
warning of a ‘tempest’, the ship<br />
was put to sea as a precaution.<br />
Sure enough, two days later the<br />
storm arrived. Dampier’s journal<br />
reads:<br />
“But the day ensuing,<br />
which was the 4th Day of<br />
July, about Four o’clock in<br />
the Afternoon, the Wind<br />
came to the N. and<br />
freshened upon us. The<br />
Sky looked very black in<br />
that quarter, and the black<br />
Clouds began to rise apace<br />
and move towards us,<br />
having hung all the<br />
Morning on the Horizon.<br />
This made us take in our<br />
Top-sails, and the Wind still<br />
increasing, about Nine o’clock<br />
we reefed our Main-sail and<br />
Fore-sail. At Ten o’clock we<br />
furled our Fore-sail, keeping under<br />
a Main-sail and Mizzen. At<br />
Eleven o’clock we furled our<br />
Main-sail and ballasted [steadied]<br />
our Mizzen, at which time it began<br />
to rain, and by Twelve o’clock at<br />
Night it blew exceeding hard, and<br />
the Rain poured down as through<br />
a Sieve. It thundered and<br />
lightened prodigiously, and the Sea<br />
seemed all of a Fire about us, for<br />
every Sea that broke sparkled like<br />
Lightning. The violent Wind raised<br />
the Sea presently to a great<br />
height, and it ran very short and<br />
began to break in on our Deck.”<br />
He then describes how the seas<br />
“struck away the Rails of our<br />
Head, and our Sheet-Anchor …<br />
was violently washed off, and<br />
was likely to have struck a Hole<br />
in our Bow, as it lay beating<br />
against it.” The ship had to be<br />
manoeuvred before the wind so<br />
that the anchor could be retrieved,<br />
but conditions were then too<br />
Spring/Summer 2002 19
dangerous to turn back into it for<br />
fear of foundering, so the ship<br />
continued “scudding right before<br />
Wind and Sea, from Two till Seven<br />
o’clock in the Morning [of 5<br />
July]…”<br />
The wind decreased so the ship<br />
was turned once more into the<br />
wind and sailed with only a mizzen,<br />
it then moderated further and a flat<br />
calm of two hours followed, but the<br />
storm blew up from the south-west<br />
accompanied by very heavy rain,<br />
and Dampier’s ship was again<br />
forced to run before the wind<br />
under bare poles until the evening.<br />
The whole account appears to<br />
indicate a close encounter with an<br />
intense tropical depression, or even<br />
a typhoon.<br />
During the morning (apparently<br />
some time after four o’clock) the<br />
rain and thunder had abated, and<br />
then St Elmos’s fire had been seen.<br />
This phenomenon seems to have<br />
been associated with either good<br />
‘omens’ or bad depending upon its<br />
location about the ship.<br />
The journal reads:<br />
“…and then we saw a Corpus<br />
Sant at our Main-top-mast Head,<br />
on the very Top of the Truck of the<br />
Spindle. This sight rejoiced ourMen<br />
exceedingly, for the height of the<br />
Storm is commonly over when the<br />
Corpus Sant is seen aloft. But<br />
when they are seen lying on the<br />
Deck, it is generally accounted a<br />
bad Sign.<br />
“A Corpus Sant is a certain small<br />
glittering Light. When it appears,<br />
as this did, on the very Top of the<br />
Main-mast or at a Yard-arm, it is<br />
20 <strong>Mariners</strong> <strong>Weather</strong> <strong>Log</strong><br />
William Dampier<br />
like a Star. But when it appears on<br />
the Deck, it resembles a great<br />
Glow-worm… I have heard some<br />
ignorant Seamen discoursing how<br />
they have seen them creep, or, as<br />
they say, travel about in the<br />
Scuppers, telling many dismal<br />
Stories that happened at such<br />
times. But I never saw any one<br />
stir out of the place where it was<br />
first fixed, except upon Deck,<br />
where every Sea washes it about.<br />
Nor did I ever see any except<br />
when we have had hard Rain as<br />
well as Wind, and I therefore<br />
believe it is some Jelly: … ”<br />
The illustration shows a<br />
shipwreck, storm and corposants<br />
(from Meteorologia<br />
philospohico-politica, Franz<br />
Weiner (1661–1708) <strong>NOAA</strong><br />
Central Library) and corposants<br />
can be seen on yard-arms. There<br />
seem to be two sources or<br />
varieties of the phenomenon in<br />
Dampier’s account, but perhaps<br />
only one of them (that associated<br />
with the mast and yard-arms) is<br />
really the static electrical type.<br />
The form that is mentioned as<br />
being washed around the deck or<br />
in the scuppers might have been<br />
an organism(s) such as jellyfish<br />
which have often been reported<br />
displaying luminescence by<br />
modern seafarers, or perhaps a<br />
pyrosoma (a hollow cylindrical<br />
colony of individual organisms<br />
swimming as a single entity, and<br />
brightly luminescent). If such were<br />
washed on board in heavy seas,<br />
they would no doubt continue to<br />
show this light as they were tossed<br />
about on their way back to the<br />
scuppers, or else whilst sliding<br />
about on a wet deck. In darkness<br />
their true animal form would not<br />
(<strong>NOAA</strong> Central Library)
e seen and it is supposed that<br />
they could have been interpreted<br />
as corposants (“Glow-worm”) on<br />
deck. In the first part of<br />
Dampier’s observation, the seas<br />
that were “all of a Fire” and that<br />
“sparkled like Lightning” might<br />
well have been a manifestation of<br />
bioluminescence too, probably<br />
caused by dinoflagellates at the<br />
surface.<br />
A waterspout<br />
Waterspouts were no doubt as<br />
frequent an occurrence in the<br />
seventeenth century as they are<br />
in the twenty-first, and modern<br />
seafarers will find much that is<br />
familiar in Dampier’s<br />
observation of this phenomenon,<br />
in the Celebes Sea on 30<br />
November,1687.<br />
“A Spout is a small ragged piece<br />
of Cloud hanging down<br />
seemingly about a Yard from the<br />
blackest part of it. Commonly it<br />
hangs down sloping, or<br />
sometimes appears with a small<br />
bending or elbow in the middle. I<br />
never saw any hang<br />
perpendicularly down. It is small<br />
at the lower end, seemingly no<br />
bigger than one’s Arm, but still<br />
fuller towards the Cloud from<br />
where it proceeds. When the<br />
Surface of the Sea begins to work,<br />
you shall see the Water for about<br />
100 Paces in Circumference foam<br />
and move gently round till the<br />
whirling Motion increases. And<br />
then it flies upwards in a Pillar<br />
about 100 Paces in Compass at<br />
the bottom, but lessening gradually<br />
upwards to the smallness of the<br />
spout itself, until it reaches the<br />
lower end of the Spout, through<br />
which the rising Seawater seems<br />
to be conveyed into the Clouds.<br />
This visibly appears by the Cloud’s<br />
increasing in bulk and blackness.<br />
Then you shall presently see the<br />
Cloud drive along, although before,<br />
it seemed to be without any<br />
Motion. The Spout keeps the same<br />
Course as the Cloud, and still<br />
sucking up Water as it goes along,<br />
they make a Wind as they go.<br />
Thus it continues for the space of<br />
(R. J. Fletcher)<br />
William Dampier<br />
half an Hour, more or less, until<br />
the sucking is spent. Then,<br />
breaking off, all the Water which<br />
was below the Spout, or pendulous<br />
piece of Cloud, falls down again<br />
into the Sea, making a great Noise<br />
with its fall, and a clashing Motion<br />
in the Sea.”<br />
Waterspouts are not a significant<br />
problem for modern seafarers, and<br />
are often reported upon in ships’<br />
meteorological logbooks as an<br />
interesting diversion, but they were<br />
considered a threat to sailing ships,<br />
and Dampier’s like others, was<br />
kept at a great a distance as<br />
possible from them. Not without<br />
reason apparently, for he knew (or<br />
had been told) of an event where a<br />
ship had received what might be<br />
called a ‘direct hit’ from a waterspout<br />
and had lost not only its<br />
bowsprit but the foremast and<br />
mizzen mast too. One method<br />
by which it was thought<br />
possible to weaken a waterspout<br />
that could not be avoided<br />
by a ship was to fire deck guns<br />
into it. However, Dampier is<br />
dismissive of such efforts —<br />
“But I never heard that it<br />
proved to be of any Benefit”.<br />
The halo<br />
Optical phenomena can be<br />
seen approximately one day in<br />
three if the observer is keen<br />
enough not to look towards the<br />
sun or moon alone and is<br />
suitably placed to cast an eye<br />
around other parts of the sky.<br />
Nevertheless, haloes remain<br />
the most frequently reported<br />
examples of phenomena caused<br />
by the passage of light through ice<br />
crystals in cirriform clouds. Cirrus<br />
cloud invading the sky is often the<br />
first sign of an approaching<br />
depression, and so in Dampier’s<br />
day it is understandable that the<br />
halo was seen as a precursor to<br />
bad weather. Strangely, more<br />
importance was placed on the<br />
appearance of a solar halo than of<br />
one around the moon.<br />
Spring/Summer 2002 21
On 18 May 1688, Dampier and his<br />
consorts were navigating from the<br />
Nicobar Islands towards Sumatra.<br />
In his journal he wrote of the halo:<br />
“It was indifferent clear till Noon<br />
and we thought to have had an<br />
Observation, but we were<br />
hindered by the Clouds that<br />
covered the Face of the Sun when<br />
it came on the Meridian. We also<br />
then had a very ill Presage, by a<br />
great Circle about the Sun five or<br />
six times the Diameter of it, which<br />
seldom appears without storms of<br />
Wind or much Rain ensuing. Such<br />
Circles about the Moon are more<br />
frequent but of less import. We<br />
commonly take great notice of<br />
those that are about the Sun,<br />
observing if there is any breach in<br />
the Circle, and in what Quarter the<br />
Breach is. From there we<br />
commonly find the greatest Stress<br />
of the Wind will come. I must<br />
confess that I was a little anxious<br />
at the Sight of this Circle, and<br />
wished heartily that we were near<br />
some Land.”<br />
A violent storm indeed followed,<br />
and it was bad enough for<br />
Dampier to believe that his end<br />
was imminent. He did survive,<br />
however, but no doubt he continued<br />
to regard the appearance of a<br />
solar halo with considerable<br />
apprehension.<br />
22 <strong>Mariners</strong> <strong>Weather</strong> <strong>Log</strong><br />
Epilogue<br />
Unknown to Dampier at the time<br />
of the search for Guam, in May<br />
1686, the vessel had narrowly<br />
avoided a mutiny — or worse.<br />
The ship had been at sea for about<br />
two months and supplies were so<br />
low that the daily ration for each<br />
man was 10 spoons of boiled<br />
maize, and there was enough left<br />
for only three more days. He was<br />
to learn later that had the island<br />
not been found, then the crew had<br />
decided to kill the captain when<br />
the food had run out, and eat him<br />
followed by everybody who had<br />
sanctioned the voyage to the<br />
original destination of the<br />
Philippines.<br />
Such a grisly end would have<br />
deprived later generations of his<br />
valuable contributions. As it<br />
happened, he eventually returned<br />
to England in 1691, and died in<br />
London in 1715 at the age of 63.<br />
Acknowledgements<br />
William Dampier<br />
With thanks to Dr Frank Evans<br />
(Dove Marine Observatory) and<br />
Professor Peter Herring<br />
(Southampton Oceanography<br />
Centre) for their help and advice<br />
with ‘Red Lobsters’ and ‘A<br />
typhoon (?), bioluminescence and<br />
corposants’.<br />
References<br />
Dampier, W.,:A New Voyage<br />
Round the World: The Journal of<br />
an English Bucanneer. (First<br />
published in1697, latest reprint by<br />
hummingbird press, 1998.).<br />
Horsman, P. V., 1985: The<br />
Seafarer’s Guide to Marine Life.<br />
United States National Oceanic &<br />
Atmospheric Administration<br />
(<strong>NOAA</strong>).Website:<br />
www.photolib.noaa.gov/library.<br />
Editors Note:<br />
WOW! what an adventure...This<br />
great story was written for and<br />
first published in the October<br />
2001 issue of the UK Met<br />
Office’s Marine Observer. Who<br />
would have imagined that by<br />
sailing the seven seas in search<br />
of adventure and a few pieces of<br />
eight, your name would be listed<br />
in the annals of science for your<br />
great exploration and<br />
discoveries. -- Luke
Awareness can be as<br />
important as prevention<br />
when navigating a vessel<br />
through a storm, and the best<br />
method of awareness is through<br />
education and knowledge.<br />
The National Centers for<br />
Environmental Prediction’s<br />
(NCEP) Marine Prediction Center<br />
(MPC) and the Maritime Institute<br />
of Technology and Graduate<br />
Studies (MITAGS) have teamed<br />
up to embark on a maiden voyage<br />
to provide marine weather<br />
forecast instruction – using<br />
National <strong>Weather</strong> Service (NWS)<br />
official products – and to work<br />
together on projects of mutual<br />
interest designed for professional<br />
mariners. Also, MPC will work<br />
with MITAGS to identify and<br />
raise the standards of training on<br />
weather related courses for<br />
advanced maritime safety.<br />
MITAGS is a non-profit<br />
continuing education center for<br />
professional mariners that<br />
provides training to civilian and<br />
military mariners from around the<br />
globe.<br />
This agreement marks the first<br />
organizational partnership for<br />
MPC and adheres to two NCEP<br />
strategic goals – to exercise<br />
global leadership and to forge<br />
stronger bonds with NWS<br />
partners and users. “This is a<br />
major step in realizing MPC’s<br />
vision to be the mariners weather<br />
lifeline,” said Dr. James Hoke,<br />
director of the MPC. “Working<br />
with MITAGS offers a great<br />
opportunity for MPC to be in<br />
direct contact with our primary<br />
users to get feedback and ideas<br />
on how to keep MPC their first<br />
choice for marine weather<br />
information.”<br />
Glen Paine, Executive Director of<br />
MITAGS, stated that “This<br />
partnership allows us to<br />
reemphasize the mariner’s need<br />
for accurate and timely weather<br />
information and the requirement<br />
for the skills to apply that<br />
information. As we have seen in<br />
the past, weather information<br />
correctly applied greatly reduces<br />
the impact adverse weather can<br />
have on a crew and its vessel.<br />
We at MITAGS look forward to<br />
our interaction with the National<br />
<strong>Weather</strong> Service.”<br />
The MPC is one of nine NCEP<br />
centers located in Camp Springs,<br />
MD. MPC issues forecasts and<br />
warnings for regional, offshore<br />
MPC Sets Sail on First Alliance<br />
Marine Prediction Center Sets Sail on First Alliance<br />
Pictured on left:<br />
MPC Chief of<br />
Operations David<br />
Feit; MPC Deputy<br />
Director Kevin<br />
McCarthy; MPC<br />
Director James<br />
Hoke; MITAGS<br />
Executive Director<br />
Glen Pain; and<br />
MITAGS Director<br />
of Training, Walt<br />
Megonicgal.<br />
and high sea areas of the Atlantic<br />
and Pacific Oceans. Operating<br />
seven days a week, 24 hours a<br />
day, the MPC forecasts and<br />
analyzes sea conditions such as<br />
wind, wave, fog and ice accretion<br />
and issues sea surface<br />
temperature products. The center<br />
also produces marine forecasts in<br />
response to emergency situations<br />
identified by <strong>NOAA</strong>, the NWS<br />
Regional Offices, the Federal<br />
Emergency Management Agency<br />
and the U.S. Coast Guard Search<br />
and Rescue. MPC works closely<br />
with the Tropical Prediction<br />
Center and the <strong>Weather</strong> Forecast<br />
Offices in Anchorage and<br />
Honolulu to provided<br />
comprehensive coverage of the<br />
Atlantic and Pacific Oceans as<br />
well as the Gulf of Mexico.<br />
For more information about<br />
MITAGS, MPC or NCEP visit<br />
the World Wide Web sites:<br />
www.mitags.org,<br />
www.mpc.ncep.noaa.gov, and<br />
www.ncep.noaa.gov,<br />
respectively.<br />
Spring/Summer 2002 23
The VOS Climate Project<br />
UK Met. Office<br />
Introduction<br />
Final preparations for the <strong>Voluntary</strong><br />
<strong>Observing</strong> <strong>Ship</strong>s (VOS)<br />
Climate Project are now complete,<br />
and initial recruitment of participating<br />
ships has begun.<br />
The following article provides an<br />
overview of the objectives of the<br />
project, its status, and how it is<br />
intended to operate.<br />
Background<br />
The project is a natural extension<br />
of the earlier <strong>Voluntary</strong> Special<br />
<strong>Observing</strong> <strong>Program</strong>me for the<br />
North Atlantic (VSOP –NA) 1 ,<br />
which demonstrated that the<br />
quality of observed measurements<br />
depends significantly upon the<br />
types of instruments used, their<br />
exposures, and the observing<br />
practices of shipboard personnel.<br />
It made a number of substantive<br />
recommendations in these areas<br />
aimed at providing ship observations<br />
of a quality appropriate to<br />
global climate studies.<br />
Objectives<br />
Whilst VOS observations continue<br />
to be an essential ingredient for<br />
numerical weather prediction,<br />
there is a growing need for higher<br />
quality data from the observing<br />
fleet. Specifically, recent trends,<br />
such as the increasing availability<br />
of data from satellite sensors and<br />
24 <strong>Mariners</strong> <strong>Weather</strong> <strong>Log</strong><br />
VOS Climate Project<br />
the increased concern with regard<br />
to climate analysis and prediction,<br />
are making further demands on the<br />
quality of ship observations.<br />
The project aims to provide a highquality<br />
subset of marine meteorological<br />
data, available in both real<br />
time and in delayed mode, which<br />
can be used for:<br />
·Satellite ground truth verification<br />
An important role for accurate<br />
VOS data is the detection of<br />
biases in remotely sensed satellite<br />
data due to instrument calibration<br />
changes or changing atmospheric<br />
transmission conditions. <strong>Ship</strong> and<br />
buoy observations can, for example,<br />
be used to detect and<br />
correct biases in satellite data<br />
caused by varying atmospheric<br />
aerosol loading due to volcanic<br />
eruptions. Without such real time<br />
bias corrections, errors can occur<br />
in satellite-derived data. Consequently,<br />
for satellite verification<br />
purposes, there is an established<br />
need for a dataset of accurate ship<br />
observations with known error<br />
characteristics.<br />
Climate Change Studies<br />
Data from observing ships are<br />
increasingly being used for climate<br />
change studies, e.g., to quantify<br />
global changes of sea-surface and<br />
marine air temperature. However,<br />
the detection of climate trends is<br />
only practicable if, as far as is<br />
possible, observational biases<br />
owing to the changing methods of<br />
observation are corrected. Sea<br />
temperature data, for example,<br />
have different bias errors, depending<br />
on whether temperatures were<br />
obtained using wooden, rubber or<br />
canvas buckets, or using engine<br />
room intake thermometers. It is<br />
therefore important to clearly<br />
document the observing practices<br />
that are being used on board ships.<br />
Climate Research and Climate<br />
Prediction<br />
Increasingly, coupled numerical<br />
models of the atmosphere and<br />
ocean are being used for climate<br />
research and climate change<br />
prediction. The simulated air-sea<br />
fluxes of heat, water and momentum<br />
must therefore be shown to<br />
be realistic if there is to be confidence<br />
in model predictions.<br />
Accordingly, model predictions of<br />
near surface meteorological<br />
variables (air temperature, humidity,<br />
sea-surface temperature<br />
(SST), etc.) need to be verified<br />
against high-quality in situ observations<br />
from buoys and specially<br />
selected voluntary observing ships.<br />
In addition to the above, the<br />
project will provide a reference<br />
data set that can be used to assess
the quality of data received from<br />
the rest of the voluntary observing<br />
fleet.<br />
<strong>Ship</strong> selection and recruitment<br />
<strong>Ship</strong> recruitment is a critical<br />
component of the project, and it is<br />
hoped that the ships selected will<br />
provide more or less global coverage<br />
in both space and time. To this<br />
end, ships which make frequent<br />
and regular ocean crossings, as<br />
well as ships sailing in the southern<br />
ocean, Antarctic supply vessels<br />
and research ships, have been<br />
identified as potential recruits.<br />
Where feasible it has also been<br />
decided that ships engaged in the<br />
<strong>Ship</strong> of Opportunity <strong>Program</strong>me<br />
and the Automated <strong>Ship</strong>board<br />
Aerological <strong>Program</strong>me should be<br />
recruited.<br />
A relatively small target of ~200<br />
ships has been set for recruitment<br />
to the project, and provisional lists<br />
of participating ships have been<br />
prepared by Australia, Canada,<br />
France, Germany, India, Japan,<br />
Poland, UK and USA. Several<br />
other countries are also potential<br />
project participants, and it is<br />
anticipated that the target number<br />
of ships should be achieved.<br />
The UK is aiming to recruit<br />
approximately 30 observing ships<br />
to the project, with emphasis being<br />
given to those ships which routinely<br />
return to the UK, have a<br />
good observing record, and are<br />
preferably fitted with hull sensors<br />
and the Royal Netherlands Meteorological<br />
Institute’s TurboWin<br />
software. The selected vessels will<br />
be drawn from those operating<br />
both on world-wide and near<br />
continental voyages and will<br />
include some research vessels<br />
providing observations in data<br />
sparse areas. Figure 1 shows the<br />
extent of coverage expected from<br />
UK voluntary observing ships,<br />
whilst Figure 2 indicates the<br />
projected global coverage.<br />
These preliminary maps showing<br />
the potential route coverage of the<br />
proposed project ships have been<br />
prepared by Southampton Oceanography<br />
Centre, who have been<br />
actively involved in setting up the<br />
project. Such maps will assist in<br />
planning national recruitment and<br />
will also allow the selective<br />
targeting of obvious data sparse<br />
areas as recruitment proceeds.<br />
Data Assembly Centre<br />
Data collected during the project<br />
will undergo quality control (QC)<br />
and be archived<br />
by a Data Assembly Centre<br />
VOS Climate Project<br />
Figure 1 - Extent of coverage anticipated from UK voluntary observing ships<br />
participating in the VOS Climate Project. (Courtesy of Southampton<br />
Oceanography Centre.)<br />
(DAC). The National Climatic<br />
Data Center, <strong>NOAA</strong>, USA, has<br />
agreed to perform this role which<br />
requires them to merge the realtime<br />
observation reports with the<br />
delayed mode reports, eliminate<br />
any duplicates, and compile a<br />
complete project data set which<br />
will be available to users.<br />
The DAC will also create and<br />
maintain a relational database so<br />
that the information on instrument<br />
types, exposure and observing<br />
practice can be automatically<br />
associated with each observation.<br />
The database will also be freely<br />
accessible to registered users.<br />
Real Time Monitoring Centre<br />
The project will require real time<br />
monitoring of the observational<br />
data and comparison with model<br />
fields. To this end, the Met Office<br />
(which already undertakes such<br />
monitoring of ship observations on<br />
a routine basis), has agreed to act<br />
Spring/Summer 2002 25
Figure 2 – Project global coverage of ships taking part in the VOS Climate<br />
Project [(drawn from raw reports from the Global Telecommunication System<br />
(GTS) using data from November 1999 to October 2000), downloaded<br />
from http://www.cdc.noaa.gov/ncep_obs/]<br />
as Real Time Monitoring Centre<br />
(RTMC) for the project.<br />
Priority will be given to the following<br />
six parameters: wind direction<br />
and speed; sea level pressure; seasurface<br />
temperature; air temperature;<br />
and humidity. The Met Office<br />
will monitor these variables for all<br />
project ships and forward the<br />
resultant statistics to the DAC for<br />
inclusion on a dedicated project<br />
Web site.<br />
Statistics on the ‘fit ’of the observed<br />
variables to the numerical<br />
weather prediction Global Model’s<br />
background forecasts will be used<br />
to produce lists of ‘suspect’ ships,<br />
i.e., ships will be flagged as<br />
suspect if the mean and standard<br />
deviations of their observationminus-background<br />
(o-b) values<br />
meet certain agreed criteria. Lists<br />
of flagged ships will be forwarded<br />
by the RTMC to the DAC each<br />
month, and to participating countries<br />
on a weekly and monthly<br />
26 <strong>Mariners</strong> <strong>Weather</strong> <strong>Log</strong><br />
VOS Climate Project<br />
basis. As ships’call signs are<br />
subject to change when there are<br />
changes in registry, it will be<br />
necessary for the RTMC to<br />
regularly check call signs to ensure<br />
the correct ships are being monitored.<br />
Any project ships identified as<br />
having submitted suspect observations<br />
will be followed up by the<br />
Port Met. Officer networks as<br />
quickly as possible, and the results<br />
of any corrective action taken<br />
thereafter notified to the DAC.<br />
In addition to the monitoring<br />
function, the RTMC will extract<br />
the six observed variables for each<br />
project ship received in real time<br />
from the Global Telecommunication<br />
System (GTS) and associate<br />
them with the co-located model<br />
field values. The resultant data<br />
sets will then be transferred on a<br />
regular basis to the Data Assembly<br />
Centre.<br />
Instruments<br />
Although relevant, the quality of<br />
ships observing instruments has<br />
less effect upon the quality of data<br />
than their use and exposure. It will<br />
therefore be essential for the<br />
project to ensure that observing<br />
instruments, their physical exposure,<br />
and the associated observing<br />
practices confirm to high standards<br />
and that up-to-date instrument<br />
records are maintained and<br />
catalogued.<br />
Ideally, it is recommended that<br />
ships taking part in the project<br />
should have the following instrumentation<br />
and facilities:<br />
• Accurate and well-exposed<br />
thermometers with precision to<br />
0.1 °C;<br />
• Sea surface temperature measuring<br />
instruments from hull<br />
contact sensors;<br />
• Permanently-mounted, wellexposed<br />
anemometers to 0.1 m s<br />
-1 precision;<br />
• Precision marine barometers to<br />
0.1 hPa precision, preferably<br />
connected to a static head; and<br />
• Electronic logbook facility, to<br />
include true wind computation,<br />
QC checks and updated encoding<br />
in the revised code forms<br />
required by the project.<br />
It is recognized, however, that<br />
common instrumentation is unlikely<br />
to be achieved. For instance, UK<br />
observing ships traditionally
estimate the wind speed and<br />
direction from the sea state and<br />
are not provided with calibrated<br />
anemometers.<br />
Regular checks upon the serviceability<br />
and calibration of instruments<br />
by Port Met. Officers will<br />
be essential to the project, e.g.,<br />
calibration of temperature sensors<br />
can be performed using a water<br />
bath, and it is possible to calibrate<br />
some types of wind speed sensor<br />
by mechanically rotating the<br />
propeller.<br />
Inter-comparison of instruments is<br />
a difficult and time-consuming<br />
task; it is possible to compare<br />
typical samples of each type or<br />
source of manufacture, but often<br />
variations between members of<br />
the same type are greater than<br />
between different instruments.<br />
This problem will be addressed by<br />
inter-comparison of the observations<br />
of the VOS climate subset<br />
with large-scale model fields, or<br />
with neighbouring ships at sea. At<br />
a later stage in the project development,<br />
it is expected that consideration<br />
will be given to enhancing<br />
or upgrading participating ship<br />
instrumentation as necessary, in<br />
line with VSOP –NA recommendations.<br />
Metadata<br />
To achieve the accuracy required<br />
by the project, it will be essential to<br />
have comprehensive information<br />
about the type and location of<br />
meteorological instruments. This<br />
will include information of the date<br />
of any changes to instruments and<br />
details of their exposures sup-<br />
ported by digital imagery. Details<br />
of such ‘metadata ’ will be stored<br />
in a master index of ships which<br />
will be developed as a supplement<br />
to, but separate from, the main<br />
WMO ship catalogue (International<br />
List of <strong>Voluntary</strong> <strong>Observing</strong><br />
<strong>Ship</strong>s WMO –No.47.) The catalogue<br />
will be continuously updated<br />
and made available through the<br />
Data Assembly Centre. It will<br />
contain details of the instrument<br />
locations for each ship in an<br />
agreed format, together with<br />
details of the results of inspections<br />
performed by Port Met. Officers.<br />
Port Met. Officer involvement<br />
VOS Climate Project<br />
The Port Met. Officer networks of<br />
participating countries will be<br />
essential for the project’s success,<br />
as close liaison with ships’ masters,<br />
observing officers and ship<br />
owners will be needed. PMOs will,<br />
in the first instance, visit individual<br />
ships to explain the project to<br />
observers and to assess their likely<br />
commitment to the project. They<br />
will also record details of the<br />
exposure of the observing instruments,<br />
noting any permanent<br />
structural features which might<br />
affect the observation, e.g., water<br />
outfalls, airflow obstructions, airconditioning<br />
vents, etc., and the<br />
relevant ship specifications. In<br />
addition to detailed written descriptions,<br />
the location of instruments<br />
will be marked on simple arrangement<br />
drawings and supported by<br />
photographs in digital format.<br />
Final selection of ships will take<br />
note of existing instrumentation<br />
and exposure, past performance,<br />
and the general impression gained<br />
by the Port Met. Officers. Difficulties<br />
may arise where a ship is<br />
well equipped for one parameter<br />
but not another, e.g., no anemometer,<br />
but mounting a hull sensor for<br />
sea-surface temperature. The<br />
value of the ship’s contribution will<br />
be assessed in terms of the<br />
importance of the parameters<br />
which are acceptable.<br />
The information obtained by<br />
PMOs for selected ships will be<br />
forwarded to the Data Assembly<br />
Centre for compilation of the<br />
metadata catalogue. PMOs will<br />
also explain the use of new coding<br />
requirements and new logbooks<br />
(electronic or hard copy) being<br />
developed for the project. Later<br />
visits will be needed to check that<br />
instrument exposure has not<br />
changed and to discuss any<br />
problems with observers. These<br />
observer ‘contact’visits will be<br />
extremely important in maintaining<br />
the interest of the observers and<br />
the impetus of the project.<br />
<strong>Ship</strong> survey and inspection forms<br />
Special ship recruitment and<br />
inspection report forms are being<br />
designed for the project and will be<br />
made available in French, Russian<br />
and Spanish versions. The forms,<br />
together with associated instructions,<br />
will be downloadable from<br />
the new project Web site and will<br />
be suitable for use in both hard<br />
copy and electronic format.<br />
Immediately following recruitment<br />
to the project, Port Met. Officers<br />
will complete the initial ship survey<br />
report form. Each recruiting<br />
country’s PMOs will conduct<br />
Spring/Summer 2002 27
follow-up ship inspection visits<br />
when project ships are visiting<br />
their home ports, as far as possible<br />
on a quarterly basis (the current<br />
UK practice). Some ships not on<br />
regular trades may also need to be<br />
inspected by their participating (i.e.<br />
non-recruiting) countries, and care<br />
will be needed to ensure there is<br />
no duplication of inspections. In<br />
order to establish a complete<br />
metadata and inspection history for<br />
each ship, the completed inspection<br />
reports will be submitted to the<br />
DAC via e-mail.<br />
Observation codes<br />
To ensure that the project provides<br />
timely and complete information<br />
and that no reports from participating<br />
ships are lost, data will be<br />
submitted in both real time and<br />
delayed mode. Although real time<br />
observations will continue to be<br />
transmitted in the <strong>Ship</strong>s’ International<br />
Meteorological Code (FM13<br />
–XI), the delayed mode observations<br />
will be augmented by additional<br />
code groups. These extra<br />
codes are essential to the success<br />
of the project and comprise details<br />
specific to each ship. (Refer to<br />
<strong>Ship</strong> Parameters chart).<br />
28 <strong>Mariners</strong> <strong>Weather</strong> <strong>Log</strong><br />
Originally, the intention had been to<br />
require these additional code<br />
groups in both real time and<br />
delayed mode. However, proposals<br />
to modify the ship code were not<br />
supported by WMO because of<br />
their long-term ambition to phase<br />
out the use of such alphanumeric<br />
codes in favour of new tabledriven<br />
codes (e.g. BUFR 2 and<br />
CREX 3 codes).<br />
Recognizing that it would be<br />
impractical to re-train observers to<br />
use complex new code forms in<br />
time for the start of the project, it<br />
was decided that the additional<br />
code groups were not absolutely<br />
essential in real time, provided that<br />
the expected delay in the non-real<br />
time data delivery did not exceed 6<br />
–12 months.<br />
To enable the international exchange<br />
of the extended observation<br />
reports in delayed mode, a<br />
revised version of the International<br />
Maritime Meteorological Tape<br />
Code (IMMT) has also been<br />
developed for the project.<br />
Paper and electronic logbooks<br />
Observations will be recorded for<br />
delayed mode submission using<br />
VOS Climate Project<br />
either hard copy or electronic<br />
logbooks. In order to collect and<br />
process the additional delayed<br />
mode observation data in hard<br />
copy format it will be necessary to<br />
either implement new logbooks (or<br />
logsheets), or to modify existing<br />
ones. Similarly, new versions of<br />
electronic logbook software<br />
programs (e.g. TurboWin, SEAS<br />
2000 etc.) are being developed to<br />
incorporate the additional delayed<br />
mode data. The logbooks (or<br />
logsheets) will need to be collected<br />
on a regular basis by Port<br />
Met.Officers, who will also<br />
download the electronic log files.<br />
The use of software programs<br />
such as TurboWin will greatly<br />
simplify the collection of delayed<br />
mode data required by the project,<br />
as they will electronically record<br />
the observations in the revised<br />
IMMT format at source. This<br />
avoids the need for observations to<br />
be manually digitised following<br />
receipt at participating national<br />
meteorological services, which is<br />
presently the case for paper<br />
logbooks. For that reason, it is<br />
hoped to equip the majority of UK<br />
ships participating in the project<br />
with such software, either loaded<br />
into dedicated ‘notebook’ computers<br />
or, if acceptable, loaded into<br />
one of the ships’ computers.<br />
Data Transmission<br />
Observational and instrumentation<br />
data submitted by project ships will<br />
be subjected to various procedures<br />
and relayed via a number of<br />
centres before it eventually<br />
reaches the Data Assembly<br />
Center. A simplified flow diagram
showing the data will be routed is<br />
given in Figure 3.<br />
The national meteorological<br />
services participating in the project<br />
will apply minimum QC procedures<br />
to the digitised observations<br />
in the revised IMMT format. The<br />
digital data sets will then be<br />
forwarded to the two Global<br />
Collecting Centres (GCCs) for the<br />
WMO Marine Climatological<br />
Summaries Scheme (located in<br />
Hamburg in Germany and in<br />
Bracknell in the UK). The GCCs<br />
will thereafter apply their normal<br />
QC and related procedures and<br />
forward the data to the Data<br />
Assembly Centre in IMMT format<br />
(using an appropriate medium, or<br />
via the Internet) with a minimum<br />
delay.<br />
The Met Office, in its capacity as<br />
the RTMC, will also transfer<br />
datasets of the real time reports<br />
and associated model field values<br />
to the Data Assembly Centre. As<br />
this data will be transmitted in<br />
BUFR code (which is now regarded<br />
as the preferred standard<br />
for the international distribution of<br />
weather data) decoding software<br />
will be needed in order that the<br />
DAC can merge the received real<br />
time and delayed mode reports and<br />
compile a complete project data<br />
set.<br />
Project promotion literature<br />
and logo<br />
Draft literature to promote the<br />
project, and an associated logo for<br />
the project have been developed.<br />
The logo will, in due course,<br />
appear on a plaque that will be<br />
VOS Climate Project<br />
Figure 3 - Simplified flow diagram showing the<br />
routeing of data for the VOS Climate Project.<br />
presented to participating ships.<br />
The promotional literature will<br />
include a small explanatory<br />
brochure that will be made<br />
available to participating shipping<br />
companies and officers, and will<br />
be available in multi-lingual<br />
format. As the project unfolds,<br />
observers will inevitably have<br />
questions about why the additional<br />
observations are needed and<br />
about how they will be used. The<br />
brochure will therefore address<br />
these points, and a copy of the<br />
brochure is included at the end of<br />
this article.<br />
Project Web Site<br />
The primary means of information<br />
exchange for the project will be<br />
via a dedicated Web site which<br />
will be both developed and maintained<br />
by the DAC, with contribu-<br />
Spring/Summer 2002 29
tions to be made by both participants<br />
and users. Information to be<br />
made available through the Web<br />
site will include:<br />
• metadata catalogue of participating<br />
ships;<br />
• regular project update reports;<br />
• monitoring and data application<br />
results;<br />
• project newsletter for participating<br />
ships;<br />
• data catalogues;<br />
• links to other relevant Web<br />
sites;<br />
• project focal points and other<br />
relevant contact details;<br />
• the project document and other<br />
publications; and<br />
• any other information relevant<br />
to the project.<br />
Access to the ship metadata<br />
catalogue will be via the ship<br />
name, call sign or IMO number,<br />
which will then allow selection of<br />
any required subsets of ships’<br />
instruments, etc. This catalogue<br />
will also allow access to ship<br />
status reports, with links to the<br />
observational data and monitoring<br />
reports.<br />
The project data (observations,<br />
metadata, real time monitoring<br />
data and the additional observational<br />
data) will also have a direct<br />
access through the Web site for<br />
ftp download. Similarly, ship<br />
survey and inspection forms<br />
(including instructions for their<br />
completion) will be available from<br />
the Web site for download. Some<br />
password protection to guard<br />
against abuse and to safeguard<br />
potentially sensitive information is<br />
anticipated.<br />
30 <strong>Mariners</strong> <strong>Weather</strong> <strong>Log</strong><br />
Project newsletter<br />
A project newsletter is also<br />
considered to be an essential<br />
component of the project, providing<br />
a means of informing and<br />
communicating with participating<br />
ships as well as among meteorological<br />
services, data centres,<br />
users and other participants. It is<br />
hoped that it will help to maintain<br />
interest and enthusiasm among<br />
observers, regularly informing<br />
them of the status of the project in<br />
general, and of their own specific<br />
contributions.<br />
The newsletter will contain<br />
information, reports and statistics<br />
on participating ships together with<br />
information drawn from all participants,<br />
including the Port Met.<br />
Officers, participating ship operators,<br />
the RTMC, the DAC and the<br />
ships’ crews themselves whenever<br />
possible. It will be issued biannually<br />
and edited by the WMO<br />
Secretariat. It will be made<br />
available on the project Web site in<br />
a suitable format to allow downloading<br />
by participating operators<br />
for printing and distribution to<br />
ships.<br />
The future benefits<br />
VOS Climate Project<br />
The potential benefits of the<br />
project are clear. For the shipping<br />
industry, it will encourage the<br />
development of new marine<br />
meteorological systems, which will<br />
result in improved marine weather<br />
forecasts and real time weather<br />
information for operational purposes.<br />
Moreover, the improved<br />
quality of ship observational data<br />
will help us to better understand<br />
the large-scale weather changes<br />
associated with climate change.<br />
The success of this ambitious<br />
project will therefore depend<br />
upon the close involvement and<br />
co-operation of the national<br />
meteorological services, the Port<br />
Met. Officer networks and, of<br />
course, the ships’ voluntary<br />
observers. It will require careful<br />
management if it is to achieve the<br />
aim of developing into a longterm,<br />
operational programme.<br />
References<br />
<strong>Voluntary</strong> <strong>Observing</strong> <strong>Ship</strong>s (VOS)<br />
Climate Subset Project<br />
(VOSCLIM)Project Document.<br />
JCOMM Technical Report No 5 –<br />
WMO/TD No.1010<br />
Final report of the VOS Climate<br />
Project. .Second Project Meeting,<br />
Asheville N.C.,USA,30 October-1<br />
November 2000<br />
1 See The Mariner Observer,<br />
January 1992, 24<br />
2 Binary Universal Form for the<br />
Representation of meteor logical<br />
data (FM94 –XI Ext.BUFR)<br />
3 Character form for the Representation<br />
and EXchange of data<br />
(FM95 –XI Ext.CREX.<br />
Editors Note:<br />
This original article was first<br />
printed in the April 2001 issue<br />
of the Marine Observer.<br />
Permission to re-print this<br />
article with updates has been<br />
authorized by the UK MET<br />
OFFICE.
Spring/Summer 2002 31
32 <strong>Mariners</strong> <strong>Weather</strong> <strong>Log</strong><br />
VOS Climate Project
VOS Climate Project<br />
Spring/Summer 2002 33
34 <strong>Mariners</strong> <strong>Weather</strong> <strong>Log</strong><br />
VOS Climate Project
VOS Climate Project<br />
Spring/Summer 2002 35
36 <strong>Mariners</strong> <strong>Weather</strong> <strong>Log</strong><br />
VOS Climate Project
Attention <strong>Ship</strong> Owners, <strong>Ship</strong> Operators and<br />
Navigation Officers<br />
Ian T Hunter<br />
Manager, Marine Services<br />
South African <strong>Weather</strong> Service<br />
This satellite image (right) was<br />
captured onboard EUMETSAT’s<br />
geostationary satellite<br />
METEOSAT VII at 12h00 UTC<br />
on Tuesday 07 May 2002.<br />
The cloud mass centred<br />
approximately 150 nautical miles<br />
south-east of East London<br />
represents a deep secondary<br />
vortex which developed rapidly<br />
overnight on the eastern Agulhas<br />
Bank. The primary vortex is<br />
clearly visible further offshore<br />
with its frontal band spiralling in<br />
from the southern Mozambique<br />
Channel.<br />
Of all the numerical models<br />
available to the South African<br />
<strong>Weather</strong> Service, not one<br />
accurately analysed the secondary<br />
system. As a result, it was<br />
expected that both winds and<br />
waves would be under-forecast<br />
off South Africa’s east coast. But<br />
how to quantify this ?<br />
Fortunately the Sealand Voyager<br />
(KHRK) provided invaluable<br />
observations at both 06 and 12h00<br />
UTC as she journeyed southwards<br />
off the Transkei coast. Her 06h00<br />
observation (including a 55-knot<br />
southwesterly wind) helped<br />
analysts to gauge the depth of the<br />
new low. By 12h00 she was<br />
estimating the wind wave<br />
component at 10 m and the swell<br />
at 9 m. (An abnormal wave<br />
warning for the Agulhas Current<br />
had been issued the previous day<br />
and was still in force.)<br />
Some comments and a heartfelt<br />
plea :<br />
• KHRK was the only ship<br />
observation all day<br />
between Durban and<br />
Cape Town (a distance of<br />
some 800 nm). Although<br />
this is a major sea route,<br />
this scarcity of ship<br />
observations around the<br />
Southern African coast is<br />
by no means unusual. In<br />
terms of tanker traffic<br />
alone, the Cape Sea<br />
Route carries over 10%<br />
of the world’s sea-borne<br />
oil trade.<br />
South African <strong>Weather</strong> Service<br />
• Land-based winds,<br />
particularly around this<br />
coast in winter are<br />
notoriously nonrepresentative<br />
of<br />
conditions offshore.<br />
• Satellites are not the be<br />
all and end all. Cloud<br />
imagery is not always<br />
easy to quantify, and<br />
satellite-derived winds are<br />
by no means always<br />
available.<br />
PLEASE - WE NEED YOUR<br />
‘OBS’.<br />
As can be seen from the above<br />
example, VOS data can still have<br />
a marked impact on the accuracy<br />
of marine predictions – and thus<br />
maritime safety.<br />
Spring/Summer 2002 37
Marine <strong>Weather</strong> Review<br />
North Atlantic Area<br />
September through December 2001<br />
George P. Bancroft<br />
Introduction<br />
From September through<br />
November, low-pressure systems<br />
tracked northeast from the<br />
Canadian Maritimes to the vicinity<br />
of Greenland and Iceland before<br />
turning east. With the exception of<br />
late September and early October,<br />
high pressure of varying strength<br />
was present off the coast of<br />
western Europe. By early<br />
December the high pressure<br />
shifted to the British Isles and<br />
38 <strong>Mariners</strong> <strong>Weather</strong> <strong>Log</strong><br />
strengthened, forcing low-pressure<br />
systems moving off the U.S. East<br />
Coast and the Maritimes to turn<br />
north or even northwest toward<br />
Greenland and the Davis Strait.<br />
There was considerable tropical<br />
cyclone activity during the first<br />
three months, with eight named<br />
systems either moving into or<br />
forming in MPC’s waters north of<br />
31°N. and west of 35°N. Three of<br />
these were of subtropical origin,<br />
forming from cut-off occluded<br />
Marine <strong>Weather</strong> Review<br />
lows in the far southern MPC<br />
waters. The others either moved<br />
around the west and north sides of<br />
the subtropical ridge and<br />
weakened, were absorbed by, or<br />
became extratropical lows (those<br />
found outside the tropics, typically<br />
associated with fronts).<br />
Tropical Activity<br />
Hurricane Erin: Erin, the first<br />
hurricane of the Atlantic season,<br />
moved northwest into MPC’s<br />
Figure 1 - GOES-8 enhanced infrared satellite image of Hurricane Erin valid 1515 UTC September 10,<br />
2001. Colder, higher cloud tops such as in the central dense overcast and spiral cloud bands around the<br />
center or “eye” of Erin appear near 35°N 65°W.
waters just east of Bermuda on<br />
the morning of September 9 and<br />
attained a peak intensity with<br />
maximum sustained winds of 105<br />
kt with gusts to 130 kt near<br />
33.3°N. 63.3°W. at 0000 UTC<br />
September 10. Erin was the<br />
strongest tropical cyclone to affect<br />
MPC’s waters during this season.<br />
Figure 1 is an enhanced infrared<br />
satellite image of Erin, still near<br />
maximum strength about 15 hours<br />
later, with a well-defined “eye.”<br />
Erin subsequently turned northeast<br />
and weakened before reintensifying<br />
as an extratropical<br />
storm by 0000 UTC September 16<br />
(Figure 2). As the center passed<br />
to the west, the seas at Buoy<br />
44141 (42°N. 56°W.) jumped from<br />
3.5 meters (11 ft) to 9.5 meters<br />
(31 ft) during the 10-hour period<br />
ending at 1000 UTC September<br />
14. The maximum wind reported<br />
by a ship was a southwest wind of<br />
45 kt from the SeaLand Pride<br />
(WDA3673) near 36°N. 61°W. at<br />
0000 UTC September 13. Buoy<br />
44140 (43.7°N. 51.8°W.) reported<br />
a southwest wind of 35 kt with<br />
6.5-m seas (22 ft) at 2100 UTC<br />
September 14. The system is<br />
shown at maximum intensity as an<br />
extratropical storm in the second<br />
part of Figure 2. The QuikScat<br />
image in Figure 3 is valid about 7.5<br />
hours later, indicating winds of 50<br />
kt or higher south and southeast of<br />
Cape Farewell, with even some 70<br />
kt wind barbs. The storm<br />
subsequently passed east of<br />
Greenland and weakened on the<br />
16th.<br />
Hurricane Felix: Like Erin, Felix<br />
moved into MPC’s waters as a<br />
hurricane, shown in Figure 2.<br />
Unlike Erin, Felix peaked in<br />
strength while south of 31°N., was<br />
in a slow weakening trend, and<br />
followed a more east-northeast<br />
track while in MPC’s area. The<br />
center passed east of 35°W. by<br />
0600 UTC September before<br />
weakening to a tropical storm near<br />
35°N. 31°W. at 1200 UTC<br />
September 17. At that time, the<br />
ship C6PW2 reported a northeast<br />
wind of 35 kt and 7-m seas (23 ft)<br />
near 38°N. 34°W. A highpressure<br />
ridge east and north of<br />
the center halted further eastward<br />
progress at that time. At 0600<br />
UTC September 19 the system<br />
weakened to a remnant low near<br />
35°N. 31°W.<br />
Hurricane Gabrielle: Figure<br />
2,shows Tropical Storm Gabrielle<br />
moving on a northeast track<br />
toward MPC’s offshore waters.<br />
At 0000 UTC September 16 the<br />
Lykes Discoverer (WGXO)<br />
near 32°N. 80°W. reported a<br />
north wind of 50 kt and 8-m seas<br />
(27 ft). The Discoverer was one<br />
of several ships reporting winds of<br />
50 kt west and northwest of the<br />
center through 1200 UTC<br />
September 16. Frying Pan<br />
Shoals (FPSN7) at 33.5°N.<br />
77.5°W. reported a north wind of<br />
45 kt at 1800 UTC September 15.<br />
Winds reached 35 kt from the<br />
northeast at Buoy 41004 (32.5°N.<br />
79.1°W.), along with seas to 4.5<br />
meters (15 ft) at 0600 UTC<br />
September 16. Gabrielle then<br />
intensified to a hurricane near<br />
33°N. 71°W. at 0000 UTC<br />
September 17 and developed<br />
maximum sustained winds of 70 kt<br />
with gusts to 85 kt near 35°N.<br />
67°W. twelve hours later, before<br />
Marine <strong>Weather</strong> Review<br />
beginning to weaken. Gabrielle<br />
became an extratropical storm<br />
near 43°N. 55°W. at 0600 UTC<br />
September 19 with a 976-mb<br />
central pressure. The ship<br />
MZGK7 near 46°N. 42°W.<br />
encountered south winds of 55 kt<br />
eighteen hours later. The system<br />
continued to move northeast and<br />
re-intensified east of Labrador. By<br />
September 22, it had weakened<br />
east of Greenland and turned<br />
southeast.<br />
Hurricane Humberto:<br />
Humberto entered MPC’s<br />
forecast area near 31°N. 68°W. at<br />
1200 UTC September 23 as a<br />
strong tropical storm and became<br />
a hurricane six hours later while<br />
continuing to move north at about<br />
10 kt. The maximum strength was<br />
reached at 1200 UTC September<br />
26 near 41°N. 59°W., with<br />
maximum sustained winds of 90 kt<br />
and gusts to 110 kt. The system<br />
then turned east and weakened to<br />
an extratropical gale near 41°N.<br />
42°W. at 0000 UTC September<br />
28. At that time the ship PGBO<br />
south of the center near 39°N.<br />
40°W. reported southwest winds<br />
of 35 kt and 5-m seas (17 ft).<br />
Hurricane Karen: Karen began<br />
as a frontal wave of low pressure<br />
that underwent initial rapid<br />
intensifcation in the 24-hour period<br />
ending at 0000 UTC October 12.<br />
Figure 4 depicts the system as an<br />
intense occluded cyclone, which,<br />
after initial weakening, reintensified<br />
while losing its frontal<br />
structure. The Tropical Prediction<br />
Center (TPC) classified it as a<br />
subtropical storm (Figure 4)<br />
before naming it Tropical Storm<br />
Spring/Summer 2002 39
40 <strong>Mariners</strong> <strong>Weather</strong> <strong>Log</strong><br />
Figure 5<br />
Marine <strong>Weather</strong> Review<br />
Figure 2 - MPC North Atlantic surface analysis charts valid 1800 UTC September 14 and 0000 UTC September<br />
16, 2001.
Marine <strong>Weather</strong> Review<br />
Figure 3 -High-resolution QukScat scatterometer winds valid at 0736 UTC September 16, 2001. The<br />
resolution of the wind barbs is 12.5 km, versus 25 km in regular QuikScat imagery. Image is<br />
courtesy of <strong>NOAA</strong>/NESDIS Office of Research and Applications.<br />
Karen at 1200 UTC October 13.<br />
Figure 5 is a QuikScat image valid<br />
about the time of the first analysis<br />
in Figure 4, showing winds to 60 kt<br />
on the backside of the system.<br />
Figure 6 is a satellite image valid<br />
at 2215 UTC October 13 showing<br />
Karen with indications of a central<br />
area or ring of convection around<br />
an “eye.” Karen was upgraded to<br />
a hurricane shortly before that<br />
time. At 0600 UTC October 14<br />
Karen reached peak intensity near<br />
39°N. 64°W., with maximum<br />
sustained winds of 70 kt and gusts<br />
to 85 kt, before weakening to an<br />
extratropical gale over the<br />
Canadian Maritimes on October<br />
15 and continuing to move north.<br />
Tropical Storm Lorenzo:<br />
Lorenzo moved northwest to a<br />
position near 31°N. 46°W. at 1200<br />
UTC October 30 before turning to<br />
the north-northeast and was only a<br />
minimal tropical storm with<br />
maximum sustained winds of 35 kt<br />
and gusts to 45 kt. Lorenzo then<br />
became extratropical and merged<br />
with an approaching cold front on<br />
October 31.<br />
Hurricane Noel: The<br />
development of Noel was similar<br />
to that of Karen. Low pressure<br />
developed on a northeast to<br />
southwest oriented front near<br />
35°N. 43°W. early on November<br />
1 and drifted southwest before<br />
Spring/Summer 2002 41
Figure 4 - MPC North Atlantic surface analysis charts (Part 2) valid 0000 UTC and 1200<br />
UTC October 12, and 0000 UTC October 13 and 14, 2001. The time interval between<br />
charts is 12 hours, except 24 hours between the third and fourth charts.<br />
42 <strong>Mariners</strong> <strong>Weather</strong> <strong>Log</strong><br />
Marine <strong>Weather</strong> Review
turning northwest and intensifying<br />
to an occluded storm analyzed<br />
with 984-mb central pressure near<br />
34°N. 50°W. at 1800 UTC<br />
November 3. The system then<br />
drifted north and weakened to a<br />
gale at 1200 UTC November 4<br />
(Figure 7), before re-intensifying<br />
and developing tropical<br />
characteristics such as persistent<br />
convective clouds near the center<br />
(Figure 8). Based on a report of a<br />
southwest wind of 65 kt from the<br />
ship Tellus (WRYG) near 37°N.<br />
50°W. at 1400 UTC November 5,<br />
TPC upgraded the system to<br />
Hurricane Noel in a 1600 UTC<br />
November 5 advisory. Six hours<br />
later the ship ELRT2 near 36°N.<br />
48°W. encountered southwest<br />
winds of 35 kt and 8-m seas (27<br />
ft). The system weakened to a<br />
tropical storm near 40°N. 50°W.<br />
at 0000 UTC November 6 before<br />
merging into a developing<br />
extratropical storm over the<br />
Marine <strong>Weather</strong> Review<br />
Canadian Maritimes. The first<br />
analysis in Figure 9 has the<br />
remains of Noel near 47°N.<br />
47°W., where they are about to be<br />
absorbed.<br />
Hurricane Olga: Like Karen and<br />
Nöel, Olga formed from a low on<br />
a front, this time south of MPC’s<br />
waters, which initially developed<br />
into an occluded cut-off low. This<br />
system subsequently lost its frontal<br />
structure as it drifted into MPC’s<br />
Figure 5 - QuikScat satellite-sensed scatterometer winds valid about 0000 UTC October 12. Image is<br />
courtesy of <strong>NOAA</strong>/NESDIS Office of Research and Applications.<br />
Spring/Summer 2002 43
44 <strong>Mariners</strong> <strong>Weather</strong> <strong>Log</strong><br />
Marine <strong>Weather</strong> Review<br />
Figure 6 - GOES infrared satellite image valid at 2215 UTC October 13, 2001. Satellite senses temperature, which is<br />
displayed in various ahdes of gray, ranging from white (cold) to black (wwarm) in this type of image.
Marine <strong>Weather</strong> Review<br />
Figure 7 - MPC North Atlantic surface analysis charts (Part 2) valid 1200 UTC November 4 and 5, 2001.<br />
waters late on November 24 and<br />
continued to intensify, with TPC<br />
classifying it as a subtropical<br />
storm (Figure 10). With a strong<br />
high-pressure ridge to the north, a<br />
large area of gale to storm force<br />
northeast winds developed north<br />
and west of the center. Several<br />
gale-force reports are plotted in<br />
Figure 10. The highest wind<br />
reported by a ship was a north<br />
wind of 55 kt, along with 10-m<br />
seas (33 ft) from the Liberty Sun<br />
(WCOB) near 31°N. 56°W. at<br />
1800 UTC November 25. The<br />
storm continued to intensify during<br />
the next two days while remaining<br />
nearly stationary, with TPC<br />
upgrading it to Hurricane Olga<br />
near 31.5°N. 56°W. at 2100 UTC<br />
November 26. The intensity<br />
peaked late on the 27 th when<br />
maximum sustained winds reached<br />
80 kt with gusts to 100 kt. The<br />
500-mb analysis in Figure 11, with<br />
the same valid time as Figure 10,<br />
shows this system nearly vertically<br />
stacked. A 500-mb ridge building<br />
to the north eventually forced<br />
Olga to move southwest and<br />
weaken. By early on the 29 th Olga<br />
weakened to a tropical storm<br />
south of MPC’s area.<br />
Other Significant Events of the<br />
Period<br />
Western Atlantic/Canadian<br />
Maritimes Storm of 7-8<br />
November: Referring again to<br />
Figure 9, the 960-mb storm shown<br />
in the second analysis formed<br />
from the merger of the low over<br />
Nova Scotia with the secondary<br />
system at 39°N. 58°W., the<br />
remains of Tropical Storm Noel<br />
and the storm center near 30°N.<br />
63°W. which was formerly<br />
Hurricane Michelle. At 0600 UTC<br />
November 7 the ship ELRT2<br />
near 36°N. 57°W. reported a<br />
south wind of 60 kt. The Atlantic<br />
Cartier (C6MS4) encountered<br />
southeast winds of 60 kt near<br />
46°N. 49°W. at 1800 UTC<br />
November 7. The buoy 44140<br />
(43.8°N. 51.7°W.) at that time<br />
reported 7.5-m seas (25 ft). The<br />
Sea-Land Developer (KHRH)<br />
reported seas to 9.5 meters (31 ft)<br />
along with 35-kt southwest winds,<br />
also at that same time. This was<br />
the strongest storm in terms of<br />
central pressure in the western<br />
North Atlantic during this fourmonth<br />
period. The system<br />
subsequently moved northnortheast<br />
and weakened, before<br />
re-intensifying while passing east<br />
of Greenland by November 10.<br />
Spring/Summer 2002 45
46 <strong>Mariners</strong> <strong>Weather</strong> <strong>Log</strong><br />
Marine <strong>Weather</strong> Review<br />
Figure 8 - GOES-8 infrared satellite image valid 1215 UTC November 5, or approximately the valid time of the<br />
second analysis in Figure 7.
Marine <strong>Weather</strong> Review<br />
Figure 9 - MPC North Atlantic surface analysis charts (Part 2) valid 0000 UTC November 7 and 8, 2001.<br />
Spring/Summer 2002 47
48 <strong>Mariners</strong> <strong>Weather</strong> <strong>Log</strong><br />
Marine <strong>Weather</strong> Review<br />
Figure 10 - MPC North Atlantic surface analysis chart (Part 2) valid 1200 UTC November 25, 2001.
Figure 11 - MPC 500-mb analysis valid 1200 UTC November 25, 2001. Short-wave troughs are depicted as<br />
broken line segments.<br />
North Atlantic Storm of 9-14<br />
December: This storm is<br />
depicted in its most rapid phase of<br />
development in Figure 12. The<br />
central pressure dropped 24 mb,<br />
to 979 mb, in the 24-hour period<br />
ending at 1800 UTC December<br />
10. This development certainly<br />
qualifies as a meteorological<br />
“bomb.” At 1200 UTC December<br />
10 the ship ELVG7 reported a<br />
west wind of 60 kt and 8-m seas<br />
(26 ft) near 40°N. 51°W. Figure<br />
13 is a QuikScat image showing<br />
winds to 70 kt west and northwest<br />
of the center near 44°N. 39°W.<br />
Upon passing east of<br />
Newfoundland and approaching<br />
35°W., the storm was forced<br />
north and slowed by a blocking<br />
high over the British Isles. The<br />
Fidelio (WQVY) reported 13.5-m<br />
seas (45 ft), along with northwest<br />
winds of 55 kt, near 44°N. 44°W.<br />
at 0000 UTC December 14. The<br />
storm weakened near 49°N.<br />
34°W. on the 14 th but was<br />
replaced by another storm<br />
following a similar track on the<br />
16 th . This helped to maintain a long<br />
band of southeast gale to storm<br />
force winds from south of<br />
Greenland to near 40°N. 28°W.<br />
through December 18, with the<br />
strong high pressure persisting to<br />
the east. The Lykes Liberator<br />
(WGXN ) near 47°N. 27°W.<br />
reported a southeast wind of 45 kt<br />
and 10.5-m seas (35 ft) at 1800<br />
UTC December 17.<br />
Marine <strong>Weather</strong> Review<br />
East Coast Storm of 18-19<br />
December: This system<br />
developed near Long Island at<br />
1800 UTC December 18 and<br />
moved slowly north-northeast<br />
across the Canadian Maritimes<br />
through the 19 th before turning<br />
more northwest and weakening,<br />
blocked by strong high pressure to<br />
the east. The central pressure<br />
bottomed out at 965 mb near<br />
46°N. 57°W. at 1200 UTC<br />
December 19. The Sea-Land<br />
Motivator (WAAH ) reported<br />
northwest winds of 45 kt and 13m<br />
seas (42 ft) near 39°N. 62°W.<br />
at this time. The highest wind<br />
reported by a ship was a<br />
northwest wind of 60 kt from<br />
VCRT near 44°N. 58°W., also at<br />
1200 UTC December 19.<br />
Spring/Summer 2002 49
Figure 12 - MPC North Atlantic surface analysis chart (Part 2) valid 1200 UTC December 9 and<br />
a second surfsce analysis (Part 1) valid 0000 UTC December 11, 2001.<br />
50 <strong>Mariners</strong> <strong>Weather</strong> <strong>Log</strong><br />
Marine <strong>Weather</strong> Review<br />
Figure 13 - QuikScat scatterometer winds valid about 0745 UTC December 11, 2001.<br />
Imagery is from <strong>NOAA</strong>/NESDIS Office of Research and Applications (North Atlantic Storm<br />
of 9-14 December).
Marine <strong>Weather</strong> Review<br />
North Pacific Area<br />
September through December 2001<br />
George Bancroft<br />
Introduction<br />
The weather pattern began with<br />
low-pressure systems tracking<br />
east across or just south of the<br />
Bering Sea and into the Gulf of<br />
Alaska with former tropical<br />
systems in the mix, especially<br />
through October when the tropics<br />
were most active. There were<br />
seven tropical cyclones which<br />
appeared on MPC oceanic<br />
analysis charts and either became<br />
extratropical before entering<br />
MPC’s high seas area (see<br />
Reference 2) or actually moved<br />
into the high seas waters as<br />
tropical cyclones. All came from<br />
the tropical western North Pacific<br />
and passed near or east of Japan<br />
before recurving northeast.<br />
As the fall season progressed the<br />
main track of lows shifted south<br />
with a southern track from near<br />
Japan to the Gulf of Alaska<br />
becoming more active, producing<br />
some intense lows. Sometimes the<br />
upper-air flow pattern became<br />
more amplified and steered storms<br />
coming off Japan northward<br />
toward the Kamchatka Peninsula<br />
or the southwest Bering Sea.<br />
Many of the low-pressure systems<br />
produced storm force winds;<br />
hence, attention is focused mainly<br />
on those out-of-the-ordinary<br />
systems producing hurricane-force<br />
winds.<br />
Tropical Activity<br />
Typhoon Wutip: Still a typhoon<br />
with maximum sustained winds of<br />
70 kt with gusts to 85 kt near<br />
31°N. 150°E at the start of<br />
September, Wutip weakened to a<br />
tropical storm at 1800 UTC<br />
September 1. At 1200 UTC<br />
September 1 the ship DGLO<br />
reported a southwest wind of 45 kt<br />
and 10-m seas (32 ft). Wutip<br />
became extratropical at 0000 UTC<br />
September near 39°N. 161°E and<br />
raced northeast along a front<br />
associated with a gale in the<br />
Bering Sea without redeveloping.<br />
Tropical Storm Danas: Just east<br />
of Japan near 42°N. 146°E at<br />
0000 UTC September 12 with<br />
maximum sustained winds of 45 kt<br />
with gusts to 55 kt, Danas moved<br />
northeast and became an<br />
extratropical gale near the Kurile<br />
Islands within 12 hours. The<br />
system later intensified into a<br />
storm just south of the eastern<br />
Aleutians at 1200 UTC September<br />
14. The ship ELXX6 near 44N.<br />
166E reported a southwest wind of<br />
45 kt at 0600 UTC September 13.<br />
QuikScat scatterometer winds at<br />
0600 UTC September 14 showed<br />
winds to 60 kt west and southwest<br />
Marine <strong>Weather</strong> Review<br />
of the center (not shown). The<br />
storm then weakened to a low in<br />
the southern Gulf of Alaska late on<br />
September 16.<br />
Typhoon Vipa: Vipa passed just<br />
south of Japan on September 19<br />
with maximum sustained winds of<br />
70 kt with gusts to 85 kt. By 1800<br />
UTC September 21 Vipa was a<br />
tropical storm with maximum<br />
winds 45 kt with gusts to 55 kt.<br />
The system then merged with a<br />
low in the western Bering Sea by<br />
1200 UTC September and moved<br />
east while intensifying, developing<br />
a 968-mb central pressure in the<br />
western Gulf of Alaska at 0000<br />
UTC September 14. The ship<br />
ELOT3 reported a northwest<br />
wind of 50 kt and 10.5-m seas (35<br />
ft) near 52°N. 170°W., and the<br />
same wind with 13-m seas (42 ft)<br />
near 52°N. 171°W. at 1800 UTC<br />
September 13 and 0000 UTC<br />
September 14, respectively. The<br />
President Truman (WNDP)<br />
near 54°N. 164°W. experienced<br />
northwest winds of 60 kt at 1200<br />
UTC September 14. The storm<br />
then weakened and drifted east.<br />
Typhoon Francisco: Francisco<br />
attained maximum strength with<br />
maximum winds of 100 kt and<br />
gusts to 125 kt near 26°N. 148°E<br />
at 1200 UTC September 23 and<br />
began to weaken 24 hours later<br />
Spring/Summer 2002 51
while drifting north. Francisco then<br />
weakened to a tropical storm near<br />
37°N. 150°E at 0600 UTC<br />
September 25 and accelerated<br />
northeast, becoming an<br />
extratropical storm 44°N. 160°E<br />
eighteen hours later. The system<br />
then weakened while passing<br />
south of the Aleutians on the 26 th<br />
and 27 th , before re-intensifying to a<br />
storm near the Queen Charlotte<br />
Islands at 1200 UTC September<br />
29. Buoy 46004 reported<br />
southwest winds of 40 kt and 7.5m<br />
seas (25 ft) at this time. The<br />
system moved inland and<br />
weakened later that day.<br />
Typhoon Krosa: Tropical Storm<br />
Krosa formed south of Japan near<br />
16°N. at 0600 UTC October 4 and<br />
moved northwest, rapidly<br />
intensifying to a typhoon with<br />
maximum sustained winds of 105<br />
kt with gusts to 130 kt near 20°N.<br />
137°E at 1200 UTC October 5<br />
before recurving northeast and<br />
weakening. Figure 1 depicts Krosa<br />
as a tropical storm merging with a<br />
frontal zone to the north and<br />
rapidly re-intensifying into a<br />
hurricane-force extratropical storm<br />
over a 36-hour period. The central<br />
pressure dropped 32 mb in the 24hour<br />
period ending at 1800 UTC<br />
October 10. The President<br />
Wilson (WCY3438) encountered<br />
south winds of 65 kt near 40°N.<br />
177°E at 0600 UTC October 10.<br />
Twelve hours later this ship was at<br />
39°N. 178°W. reporting west<br />
winds of 50 kt and 13.5-m seas<br />
(44 ft). A QuikScat image for<br />
1548 UTC October 10 (Figure 2)<br />
reveals hurricane force winds up<br />
to 75 kt to the south and north of<br />
the center. The storm<br />
52 <strong>Mariners</strong> <strong>Weather</strong> <strong>Log</strong><br />
subsequently tracked northeast<br />
and weakened in the northern Gulf<br />
of Alaska on October 12.<br />
Super Typhoon Podul: Podul<br />
attained a maximum strength of<br />
140 kt with gusts to 170 kt at 0600<br />
UTC October 24 near 17°N.<br />
157°E while drifting north<br />
northeast, then began to weaken<br />
after 0600 UTC October 26.<br />
Figure 3 shows Podul approaching<br />
a front to the north and becoming<br />
extratropical 24 hours later. The<br />
typhoon actually entered the MPC<br />
high seas area at 1200 UTC<br />
October 27 before becoming<br />
extratropical. Figure 4 is a GMS<br />
infrared satellite image showing<br />
Podul as a white circular cloud<br />
mass entering the southern end of<br />
a northeast to southwest frontal<br />
band. The ship JRZH reported<br />
north winds of 50 kt and 9-m seas<br />
(30 ft) near 36°N. 157°E at 1200<br />
UTC October 27. The system then<br />
redeveloped northeast near the<br />
eastern Aleutians on the 28 th and<br />
reached the Gulf of Alaska on<br />
October 30.<br />
Super Typhoon Faxai: Faxai<br />
approached the southwest corner<br />
of MPC’s high seas waters near<br />
29°N. 158°E at 1800 UTC<br />
December 25 as a minimal<br />
typhoon, before becoming<br />
extratropical six hours later near<br />
31°N. 161°E. Prior to this, Faxai<br />
was once a super typhoon with<br />
maximum sustained winds of 150<br />
kt and gusts to 180 kt. The system<br />
then moved east and rapidly<br />
weakened.<br />
Marine <strong>Weather</strong> Review<br />
Other Significant Events<br />
Gulf of Alaska Storm of 2-3<br />
November: This system<br />
developed rapidly as depicted in<br />
Figure 5, absorbing an arctic lowpressure<br />
system and cold front to<br />
the north, and deepening by 29 mb<br />
in the 24-hour period ending at<br />
1800 UTC November 3. The<br />
system was at maximum intensity<br />
in the second analysis of Figure 5.<br />
The GOES-10 infrared satellite<br />
image of the storm (Figure 6)<br />
reveals an “eye” at the center, a<br />
characteristic of an intense<br />
system. Figure 7 is a highresolution<br />
QuikScat image of<br />
scatterometer winds around the<br />
storm about 14 hours prior to the<br />
time of maximum intensity. There<br />
are 70 kt wind barbs off the coast<br />
of Southeast Alaska. At 1541<br />
UTC November there was a ship<br />
(callsign unknown) reporting south<br />
winds of 70 kt near 55°N. 132°W.<br />
The vessel WCD7842 at 57°N.<br />
143°W. reported southwest winds<br />
of 50 kt and 9-m seas (30 ft) at<br />
2100 UTC November 3. The<br />
storm then drifted toward the west<br />
and weakened.<br />
Western Pacific Storm of 12-14<br />
November: Figure 8 depicts the<br />
rapid development of this storm<br />
over 36 hours. Initial deepening<br />
was 32 mb in the 24-hour period<br />
ending at 0600 UTC November<br />
13, with this storm certainly<br />
qualifying as a meteorological<br />
“bomb”. Between 0000 UTC and<br />
0600 UTC November 13 the storm<br />
center passed the ship DHDH<br />
which reported an east wind of 35<br />
kt shifting to west 115 kt with the<br />
latter location at 39°N. 155°E.<br />
This latter wind may appear high
Marine <strong>Weather</strong> Review<br />
Figure 1 - MPC North Pacific surface analysis charts (Part 2) valid 0600 UTC October 9 and 1800<br />
UTC October 10, 2001.<br />
Figure 2 - QuickScat scatterometer winds valid about 1548 UTC<br />
October 10, 2001. Image is courtesy of <strong>NOAA</strong>/NESDIS/Office of<br />
Research and Applications.<br />
Spring/Summer 2002 53
54 <strong>Mariners</strong> <strong>Weather</strong> <strong>Log</strong><br />
Marine <strong>Weather</strong> Review<br />
Figure 3 - MPC North Pacific surface analysis charts (Part 2) valid 0000 UTC October 27 and 28, 2001.<br />
Figure 4 - GMS-5 infrared satellite image valid 2132 UTC October 26, 2001.<br />
Satellite senses temperature on a scale from cold (white) to warm (balack) in this<br />
type of image. The valid time is about two and one-half hours prior to time of first<br />
surface analysis in Figure 3. (from NASA Global Hydrology and Climate Center)
Marine <strong>Weather</strong> Review<br />
Figure 5 - MPC North Pacific surface analysis charts (Part 1) valid 1200 UTC November 2 and 1800 UTC<br />
November 3, 2001.<br />
Figure 6 - GOES-10 infrared satellite image valid 1800 UTC November 3,<br />
2001 (same as valid time of second analysis in Figure 5).<br />
Spring/Summer 2002 55
Figure 8 - MPC North Pacific surface analysis charts (Part 2) valid 0600 UTC November 12 and 1800 UTC<br />
November 13, 2001.<br />
56 <strong>Mariners</strong> <strong>Weather</strong> <strong>Log</strong><br />
Marine <strong>Weather</strong> Review<br />
Figure 7 - High-resolution QuickScat image of scatterometer winds<br />
valid about 0410 UTC November 3, 2001. The resolution is 12.5 km in<br />
this image, versus 25 km for regular QuickScat imagery. (from <strong>NOAA</strong>/<br />
NESDIS Office of Research and Applications)
Marine <strong>Weather</strong> Review<br />
Figure 9 - QuikScat satellite image of scatterometer winds valid<br />
0826 UTC November 13, 2001. (from <strong>NOAA</strong>/NESDIS/Office of<br />
Research Applications)<br />
Figure 10 - MPC North Pacific surface analysis charts (Part 2) valid 0600 UTC December 3 and 4, 2001.<br />
Spring/Summer 2002 57
for the open ocean outside a<br />
typhoon, but a QuickScat pass for<br />
0826 UTC November 13 (Figure<br />
9) has an 80 kt wind barb near the<br />
location of the ship. Reported seas<br />
were 9.5 meters (31 ft) in the<br />
second report. The storm then<br />
moved north to near the<br />
Kamchatka Peninsula with a 960<br />
mb central pressure before<br />
beginning to drift southwest and<br />
weaken. The APL China (S6TA)<br />
encountered southwest winds of<br />
50 kt and 11.5-m seas (38 ft) near<br />
50°N. 171°E at 1800 UTC<br />
November 14.<br />
Western Pacific Storm of 3-4<br />
December: In Figure 10 the 996hPa<br />
developing storm is depicted<br />
deepening by 44 hPa in the 24hour<br />
period ending at 0600 UTC<br />
December 4. This is perhaps the<br />
most impressive intensification<br />
rate in either ocean during the<br />
four-month period. The APL<br />
58 <strong>Mariners</strong> <strong>Weather</strong> <strong>Log</strong><br />
China reported a northwest wind<br />
of 69 kt and 16.5-m seas (54 ft)<br />
near 39°N. 172°E at 1800 UTC<br />
December 3, while the Essen<br />
Express (DHEE) nearby<br />
encountered northwest winds of<br />
65 kt. The Westwood Belinda<br />
(H9IM) at 39°N. 171°E reported<br />
northwest winds of 50 kt and 16-m<br />
seas (53 ft) at 0000 UTC<br />
December 4, while ahead of the<br />
system, the Mayview Maersk<br />
(OWEB2) encountered southeast<br />
winds of 60 kt and 8-m seas (27<br />
ft) near 45°N. 179°W. Figure 11 is<br />
a QuikScat image of satellitesensed<br />
winds valid at 1755 UTC<br />
December 3 featuring 65-kt north<br />
wind barbs on the back side of the<br />
storm. This system then turned<br />
toward the north, to just south of<br />
the Aleutians at 1800 UTC<br />
December 4, before drifting<br />
northwest and weakening.<br />
Marine <strong>Weather</strong> Review<br />
Figure 11 - QuickScat scatterometer winds valid 1755 UTC<br />
December 3, 2001. (from <strong>NOAA</strong>/NESDIS/Office of Research and<br />
Applications)<br />
Two Hurricane-Force Storms<br />
in North Pacific, 22-24<br />
December: This situation was<br />
made possible by the presence of<br />
two major upper-level troughs and<br />
a very strong jet stream. Figure 12<br />
depicts the surface developments<br />
over a 36-hour period, while the<br />
500-mb analysis in Figure 13<br />
corresponds to the time of rapid<br />
intensification of both systems and<br />
depicts strong jet streams and<br />
short-wave troughs supporting<br />
development. See Reference 1 for<br />
more information on the<br />
relationships of the 500-mb chart<br />
to surface features. The western<br />
storm is shown in the second part<br />
of Figure 12 at maximum intensity.<br />
This was the most intense storm of<br />
the four-month period in either<br />
ocean. The eastern storm is shown<br />
rapidly intensifying, but the peak<br />
intensity of 960 mb was reached<br />
six hours prior to the valid time of<br />
the second surface analysis.<br />
Figure 14 is an infrared satellite
image of the North Pacific<br />
showing both storms, with the<br />
western storm at maximum<br />
intensity. The spiral cloud pattern<br />
around the well-defined center is<br />
indicative of a very intense<br />
system. The highest wind reported<br />
by a ship was a southwest wind<br />
of 61 kt from the Westwood<br />
Marianne (C6QD3) near 40°N.<br />
156°W. at 1200 UTC December<br />
22. The same ship reported a<br />
northwest wind of 50 kt and 14.5m<br />
seas (48 ft) near 39°N. 156°W.<br />
six hours later, the highest<br />
reported in these two storms. <strong>Ship</strong><br />
data was lacking near the<br />
western storm, except on the<br />
fringes. The Mackinac Bridge<br />
(JKES) near 46°N. 164°W.<br />
reported a south wind of 60 kt<br />
and 8-m seas (26 ft) at 0000 UTC<br />
December 24. Buoy 46035<br />
(57°N. 178°W.) had northeast<br />
winds up to 40 kt and seas of 10.5<br />
meters (34 ft) at 0600 UTC<br />
December 24. On the southern<br />
periphery of the storm, the CSX<br />
Reliance (WFLH) near 39°N.<br />
170°W. encountered northwest<br />
winds of 45 kt and 11-m seas (36<br />
ft). A QuikScat image (Figure 15)<br />
valid about 0439 UTC December<br />
23 reveals hurricane force winds<br />
on the back side of the eastern<br />
storm, and also shows the eastern<br />
edge of the western storm which<br />
has some 60-kt wind barbs.<br />
The eastern storm subsequently<br />
moved into the Gulf of Alaska<br />
and weakened later on December<br />
24. The stronger western storm<br />
endured a bit longer, drifting east<br />
while slowly weakening and<br />
becoming absorbed by a storm<br />
passing to the south by December<br />
27.<br />
References<br />
1. Sienkiewicz, J. and Chesneau,<br />
L., Mariner’s Guide to the 500-<br />
Mb Chart (<strong>Mariners</strong> <strong>Weather</strong><br />
<strong>Log</strong>, Winter 1995).<br />
Marine <strong>Weather</strong> Review<br />
2. Bancroft, G., High Seas Text<br />
Bulletins Issued by MPC<br />
(<strong>Mariners</strong> <strong>Weather</strong> <strong>Log</strong>, Vol. 40,<br />
No. 2, Summer 1996).<br />
Figure 12 - MPC North Pacific surface analysis charts valid 0600 UTC<br />
December 22 and 1800 UTC December 23, 2001.<br />
Spring/Summer 2002 59
60 <strong>Mariners</strong> <strong>Weather</strong> <strong>Log</strong><br />
Marine <strong>Weather</strong> Review<br />
Figure 13 - MPC 500-hPa analysis valid 0000 UTC December 23, 2001. The valid time is halfway between<br />
the analysis times of the two charts in Figure 12.<br />
Figure 14 - Composite image made up of GOES-10 and GMS infrared satellite<br />
imagery valid 1830 UTC December 23, 2001.
Marine <strong>Weather</strong> Review<br />
Figure 15 - QuikScat scatterometer winds valid abour 0439 UTC December 23, 2001. (from <strong>NOAA</strong>/<br />
NESDIS/Office of Research and Applications.<br />
Spring/Summer 2002 61
TROPICAL REVIEW<br />
September 2001 - December 2001<br />
Dr. Jack Beven<br />
National Hurricane Center<br />
Daniel Brown<br />
Tropical Analysis and Forecast Branch<br />
Introduction<br />
The Tropical Prediction Center/<br />
National Hurricane Center (TPC/<br />
NHC) became much busier as<br />
activity in the Atlantic significantly<br />
increased. A total of 20 tropical<br />
storms and hurricanes occurred in<br />
the Atlantic and eastern Pacific<br />
during the summary period.<br />
Several non-tropical gale events<br />
also affected the TPC high seas<br />
forecast areas.<br />
The Tale of the Tellus<br />
Most hurricane seasons bring<br />
many encounters between ships<br />
and tropical cyclones, and<br />
examples of how ship<br />
observations aid the TPC in<br />
analysis and forecasting. One of<br />
the best such examples from the<br />
2001 season was that of the<br />
Tellus (WRYG) and the storm<br />
that became Hurricane Noel.<br />
A non-tropical low formed in the<br />
eastern Atlantic late on 1<br />
November near 32°N. 40°W. This<br />
system strengthened into a storm<br />
center the next day as it drifted<br />
northwestward. Convection began<br />
to increase near the center on 3<br />
and 4 November, which suggested<br />
62 <strong>Mariners</strong> <strong>Weather</strong> <strong>Log</strong><br />
that the storm might be acquiring<br />
tropical characteristics. The<br />
Tellus began its encounter with<br />
the storm at 0000 UTC 5<br />
November (Table 1) as it traveled<br />
westward into the now northwardmoving<br />
circulation. The key<br />
observations were at 1200 UTC<br />
and 1400 UTC. Figure 1 shows an<br />
image of the soon-to-be Noel at<br />
1145 UTC with the 1200 UTC<br />
ship observations plotted on it.<br />
Note that while Tellus was<br />
reporting 60 kt and 992.0 hPa<br />
from near the center, other nearby<br />
Marine <strong>Weather</strong> Review<br />
ships were reporting 30 kt or less.<br />
This indicated the storm had<br />
developed a strong inner core<br />
characteristic of a tropical<br />
cyclone, even though its<br />
appearance on satellite images<br />
was less than classically tropical.<br />
The 1400 UTC observation of 65<br />
kt indicated that the system was<br />
at hurricane strength. Subsequent<br />
Tellus observations helped<br />
determine the size of the wind<br />
field on the southwest side of the<br />
storm.<br />
Table 1. Observations from the Tellus during its encounter with<br />
Hurricane Noel, 5-6 November
Based on the observations from<br />
the Tellus and satellite<br />
microwave data indicating the<br />
system was warm-core, the TPC/<br />
NHC wrote the first advisory on<br />
Hurricane Noel at 1500 UTC 5<br />
November (Figure 2). After this<br />
time, Noel continued northward<br />
and weakened to a tropical storm<br />
later that day. It became<br />
extratropical about 285 nmi<br />
southeast of Cape Race,<br />
Newfoundland on 6 November<br />
and was soon absorbed into<br />
another extratropical low.<br />
The TPC normally requests in its<br />
Forecast/Advisories that all ships<br />
with 300 nmi of a tropical cyclone<br />
send three-hourly observations.<br />
Increased observations (threehourly<br />
and hourly) are also useful<br />
when a tropical cyclone is first<br />
forming regardless of whether it<br />
forms from a non-tropical low or a<br />
tropical disturbance, or when the<br />
observed weather is significantly<br />
different than indicated in forecast<br />
or analysis products.<br />
The 2002 Hurricane Season<br />
The 2002 hurricane season begins<br />
in the eastern Pacific on 15 May<br />
and in the Atlantic on 1 June. Both<br />
seasons run through 30<br />
November. The names for this<br />
season’s storms are listed in the<br />
table below.<br />
Significant <strong>Weather</strong> of the<br />
Period<br />
A. Tropical Cyclones: Twelve<br />
tropical cyclones occurred in the<br />
Atlantic basin during the summary<br />
period, making this one of the<br />
most active September-December<br />
periods ever. These included one<br />
tropical depression, two tropical<br />
storms, and nine hurricanes. Four<br />
of the hurricanes reached<br />
Category 3 or higher on the Saffir-<br />
Simpson Hurricane Scale. The<br />
Marine <strong>Weather</strong> Review<br />
eastern North Pacific basin<br />
produced ten tropical cyclones,<br />
including one tropical depression,<br />
four tropical storms and five<br />
hurricanes, with Hurricane Juliette<br />
reaching Category 4 status on the<br />
Saffir-Simpson scale.<br />
1. Atlantic<br />
Hurricane Erin: Erin formed<br />
from a tropical wave on 1<br />
September and quickly became a<br />
tropical storm about 660 miles<br />
west-southwest of the Cape<br />
Verde Islands (Fig. 2). It moved<br />
west-northwestward over the next<br />
few days, with maximum<br />
sustained winds reaching 50 kt on<br />
3 September. After that, westerly<br />
wind shear caused the cyclone to<br />
weaken to an area of disturbed<br />
weather about 400 miles east of<br />
the northern Leeward islands on 5<br />
September. The shear then<br />
decreased and a new center<br />
formed the next day about 475<br />
miles north-northeast of the<br />
northern Leeward Islands. The<br />
reborn Erin moved northnorthwestward<br />
and strengthened<br />
into a tropical storm on 7<br />
September and to a hurricane on 8<br />
September. It passed about 90 nmi<br />
east of Bermuda on the 9<br />
September just before maximum<br />
winds peaked at 105 kt (Fig. 3).<br />
After a slow recurvature from 11<br />
to 13 September, Erin accelerated<br />
northeastward and passed near<br />
Cape Race on the 14 September<br />
at just below hurricane strength. It<br />
became extratropical shortly<br />
thereafter.<br />
Several ships encountered Erin,<br />
with the most notable observation<br />
Spring/Summer 2002 63
64 <strong>Mariners</strong> <strong>Weather</strong> <strong>Log</strong><br />
Marine <strong>Weather</strong> Review<br />
Figure 1. GOES-8 infrared image of hurricane Noel at 1145 UTC 5 November 2001 with<br />
1200 UTC ship observations overlaid on the imagery.<br />
coming from the Semyonovosk<br />
(UCTR) which reported 48kt<br />
winds at 1500 UTC 14<br />
September. Also noteworthy was<br />
data from the Sealand Pride<br />
(WDA367) which intermittently<br />
reported tropical storm winds<br />
from 1200 UTC on 12 September<br />
to 0000 UTC on the 14<br />
September. Other significant ship<br />
observations in Erin are included<br />
in Table 2.<br />
Erin brought strong winds and<br />
heavy rains to portions of<br />
southeastern Newfoundland, with<br />
Cape Race reporting 46-kt<br />
sustained winds and gusts to 58 kt<br />
at 0200 UTC 15 September.<br />
Bermuda reported a gust to 36 kt.<br />
There are no reports of damages<br />
or casualties.<br />
Hurricane Felix: A tropical<br />
wave developed into a tropical<br />
depression on 7 September<br />
southwest of the Cape Verde<br />
Islands (Fig. 2). Late on 8<br />
September, the westward-moving<br />
depression encountered strong<br />
shear and weakened to a tropical<br />
wave. As the wave continued<br />
westward, the shear relaxed<br />
enough to allow a new center to<br />
form early on 10 September about<br />
1000 miles east of the Lesser<br />
Antilles. This made the system the<br />
season’s fourth topical cyclone to<br />
dissipate in the deep tropics and<br />
then regenerate. The depression<br />
tracked steadily westnorthwestward<br />
and became<br />
Tropical Storm Felix on 11<br />
September. During the next two<br />
days Felix turned northwestward<br />
and then northward, becoming a<br />
hurricane late on 12 September.<br />
Maximum winds reached 100 kt<br />
as Felix curved northeastward late<br />
on 13 September. Slow weakening<br />
occurred thereafter. Felix turned<br />
eastward on 15 September and<br />
continued this motion until it<br />
weakened back to a tropical storm<br />
on 17 September, at which time it<br />
stalled about 350 miles southwest<br />
of the Azores. Increasing shear<br />
and cooler waters caused Felix to<br />
weaken to a depression early on<br />
18 September and to dissipate
Figure 2 - Atlantic tropical storms and hurricanes of 2001.<br />
later that day about 400 miles<br />
southwest of the Azores.<br />
Only a few ships encountered<br />
Felix. The LTC Calvin P. Titus<br />
(KAKG) reported 35 kt winds at<br />
1800 UTC on 16 September, while<br />
the Nariva (C6PW2) reported 34<br />
kt winds at 1200 UTC on 17<br />
September. There were no reports<br />
of damages or casualties.<br />
Hurricane Gabrielle: Gabrielle<br />
formed over the southeastern Gulf<br />
of Mexico on 11 September from<br />
a non-tropical low (Fig. 2). It<br />
looped slowly for two days before<br />
moving northeastward on 13<br />
Marine <strong>Weather</strong> Review<br />
Table 2 - Selected ship and buoy observations of 34 kt or greater<br />
winds for Hurricane Erin, 1-15 September, 2001.<br />
Spring/Summer 2002 65
Figure 3 - Close-up of image of Hurricane Erin with winds peaked at 105<br />
kt. Image is MODIS data acquired by direct broadcast from the NASA<br />
Terra spacecraft at the Space Science and Engineering Center,<br />
University of Wisonsin-Madison.<br />
September as it became a tropical<br />
storm. Gabrielle moved inland<br />
near Venice, Florida on 14<br />
September as a tropical storm<br />
with 60-kt tropical storm winds.<br />
After meandering across the<br />
Florida Peninsula, the storm<br />
moved northeastward into the<br />
Atlantic near Cape Canaveral on<br />
15 September. Gabrielle continued<br />
northeastward and became a<br />
hurricane with 70-kt winds on 17<br />
September while located about<br />
250 miles north of Bermuda. It<br />
weakened to a tropical storm on<br />
18 September and became<br />
extratropical the next day about<br />
330 miles south of Cape Race.<br />
Even while it was a hurricane,<br />
Gabrielle had a large wind field<br />
similar to that of an extratropical<br />
low. Selected observations from<br />
66 <strong>Mariners</strong> <strong>Weather</strong> <strong>Log</strong><br />
Marine <strong>Weather</strong> Review<br />
some ships it affected are given<br />
in Table 3. The most significant<br />
observations were from the<br />
KRPDD (name unknown)<br />
which reported 58-kt winds at<br />
0000 and 1800 UTC 16<br />
September. Additionally, a buoy<br />
off the southwest Florida coast<br />
reported 44-kt sustained winds<br />
with a gust to 85 kt at 1210 UTC<br />
on 14 September. At the shore,<br />
the Coastal Marine Automated<br />
Network (C-MAN) station at St.<br />
Augustine, Florida reported 51-kt<br />
sustained winds with gusts to 65<br />
kt, while a marine laboratory at<br />
New Pass, Florida also reported<br />
51-kt sustained winds.<br />
Gabrielle is blamed for one death<br />
and $230 million in damage in the<br />
United States.<br />
Table 3. Selected ship and buoy observations of 34 kt or greater winds for<br />
Hurricane Gabrielle, 11-19 September, 2001.
Tropical Depression Nine: A<br />
tropical wave moving through the<br />
Caribbean spawned a tropical<br />
depression about 50 nmi northnorthwest<br />
of San Andres Island<br />
on 19 September (Fig. 4). The<br />
system moved westnorthwestward<br />
and made landfall<br />
near Puerto Cabezas, Nicaragua<br />
early on 20 September. It<br />
dissipated over land later that<br />
day, and there were no reports of<br />
damages or casualties.<br />
Hurricane Humberto:<br />
Humberto had an unusual origin<br />
in that it formed from a trough<br />
extending southwestward from<br />
Gabrielle. The cyclone developed<br />
on 21 September about 490 miles<br />
south of Bermuda (Fig. 2). It<br />
moved northwestward and<br />
strengthened into a tropical<br />
storm on 22 and 23 September.<br />
On 23 September Humberto<br />
gradually turned northward and<br />
became a hurricane, passing about<br />
140 miles west of Bermuda.<br />
Winds reached 85 kt early on 24<br />
September, followed by some<br />
weakening while Humberto turned<br />
northeastward. The cyclone<br />
unexpectedly re-intensified on 26<br />
September, and maximum winds<br />
reached 90 kt while Humberto<br />
was centered about 200 miles<br />
south-southeast of Sable Island,<br />
Nova Scotia. The hurricane turned<br />
eastward and weakened to a<br />
tropical storm on 27 September.<br />
Humberto became extratropical<br />
later that day, and the remnant<br />
circulation was eventually<br />
absorbed by a larger low over the<br />
far north Atlantic.<br />
Marine <strong>Weather</strong> Review<br />
Figure 4 - Best track of Tropical Depression Nine, 19 - 20 September<br />
2001.<br />
<strong>Ship</strong>s generally avoided Humberto.<br />
The Sealand Expedition<br />
(WPGJ) and the Onejskyi<br />
(UCTI) reported 37-kt winds at<br />
1800 UTC 23 September and 1200<br />
UTC 27 September, respectively.<br />
Bermuda reported a gust to 37 kt.<br />
There were no reports of damages<br />
or casualties.<br />
Hurricane Iris: Iris developed<br />
from a tropical wave near the<br />
Windward Islands on 4 October<br />
(Fig. 2). Moving westnorthwestward<br />
into the Caribbean<br />
Sea, it became a tropical storm on<br />
6 October. Iris turned westward<br />
and reached hurricane status on 7<br />
October just south of the<br />
Barahona Peninsula of the<br />
Dominican Republic. The<br />
hurricane passed near the<br />
southern coast of Jamaica later<br />
that day, before rapidly<br />
intensifying while crossing the<br />
western Caribbean. Maximum<br />
winds reached 125 kt just before<br />
landfall near Monkey River Town<br />
in southern Belize on the evening<br />
of 8 October. Iris weakened<br />
rapidly after landfall and dissipated<br />
over eastern Mexico on 9<br />
October.<br />
Although Iris was a Category 4<br />
hurricane on the Saffir-Simpson<br />
scale at landfall, the core was<br />
very small with hurricane force<br />
winds extending no more than 25<br />
nmi from the center. Tropicalstorm<br />
force winds generally<br />
extended no more than 100 nmi<br />
from the center. No ships reported<br />
tropical storm winds from Iris.<br />
However, a marine tragedy<br />
occurred at landfall when the M/V<br />
Spring/Summer 2002 67
Wave Dancer capsized in harbor<br />
near Big Creek, Belize with the<br />
loss of 20 lives.<br />
Iris caused severe damage from<br />
winds and an 8- to 15-ft storm<br />
surge within a 60 nmi wide area of<br />
southern Belize. Including those on<br />
the Wave Dancer, Iris was<br />
responsible for 31 deaths, and<br />
damage in Belize was estimated at<br />
$66 million.<br />
Tropical Storm Jerry: Jerry<br />
developed from a tropical wave on<br />
6 October about 540 nmi eastsoutheast<br />
of Barbados (Fig. 2).<br />
Moving west-northwestward, it<br />
reached tropical storm strength<br />
later that day. Jerry moved<br />
through the Windward Islands at<br />
its maximum intensity of 45-kt<br />
winds on 7 and 8 October. The<br />
system then became disorganized<br />
in the eastern Caribbean Sea and<br />
dissipated late on 8 October.<br />
There are no ship reports of<br />
tropical-storm-force winds from<br />
Jerry. The town of Caravelle on<br />
Martinique reported 39 kt<br />
sustained winds with gusts to 50<br />
kt on 8 October. There were no<br />
reports of damages or casualties.<br />
Hurricane Karen: A frontal<br />
system stalled about 200 nmi<br />
southeast of Bermuda on 10<br />
October. A low formed on the<br />
front early on 11 October, and the<br />
low became a strong subtropical<br />
storm as it tracked northwestward<br />
just southwest of Bermuda early<br />
the next day (Fig. 2). The storm<br />
turned northward later that day.<br />
The cyclone then became better<br />
organized, transforming into<br />
68 <strong>Mariners</strong> <strong>Weather</strong> <strong>Log</strong><br />
Tropical Storm Karen early on 13<br />
October and progressing to<br />
hurricane status later that day.<br />
Karen moved generally<br />
northward for the next 2 days,<br />
with maximum winds reaching 70<br />
kt early on 14 October. It made<br />
landfall in western Nova Scotia<br />
on 15 October as a 40-kt tropical<br />
storm and became extratropical<br />
while moving toward western<br />
Newfoundland, where it merged<br />
with a large mid-latitude low<br />
pressure system.<br />
The Nordic Empress (ELJV7)<br />
was anchored at Bermuda while<br />
the subtropical storm passed and<br />
reported 79-kt sustained winds<br />
with a gust to 103 kt at the<br />
anemometer height of 153 ft. The<br />
ship also reported a 991.0 mb<br />
pressure. Other ship observations<br />
for hurricane Karen are included<br />
in Table 4.<br />
Official land observations on<br />
Bermuda included 58-kt sustained<br />
winds with gusts to 78 kt. There<br />
were unofficial reports of<br />
sustained winds near 65 kt with<br />
Marine <strong>Weather</strong> Review<br />
gusts to 85 kt. These winds<br />
caused tree and power line<br />
damage, leaving more than 23,000<br />
people without power and causing<br />
the Norwegian Majesty to break<br />
anchor at the height of the storm.<br />
Cape George, Nova Scotia<br />
reported 41-kt sustained winds<br />
with a gust to 56 kt when Karen<br />
made landfall.<br />
Tropical Storm Lorenzo:<br />
Lorenzo formed from a nontropical<br />
low in the eastern<br />
Atlantic that developed on 26<br />
October. The low became a<br />
tropical depression on 27 October<br />
about 850 miles southwest of the<br />
Azores and moved slowly<br />
westward (Fig. 2). Late on 29<br />
October it reached minimal<br />
tropical storm strength about 1250<br />
miles west-southwest of the<br />
Azores. Lorenzo turned to the<br />
northwest and then to the north on<br />
30 October with little change in<br />
strength. Accelerating rapidly to<br />
the north-northeast early on 31<br />
October, Lorenzo lost tropical<br />
characteristics ahead of an<br />
approaching cold front about 700<br />
Table 4 - Selected ship observations of 34 kt or greater winds associated<br />
with Hurricane Karen, 12-15 October 2001.Best track of Tropical<br />
Depression Nine, 19 - 20 September 2001.
miles west of the Azores. There<br />
were no reliable reports of<br />
tropical-storm-force winds from<br />
Lorenzo, and there were no<br />
reports of damages or casualties.<br />
Hurricane Michelle: This classic<br />
late-season hurricane started as a<br />
broad low associated with a<br />
tropical wave in the southwestern<br />
Caribbean Sea on 27 October. It<br />
developed into a tropical<br />
depression on 29 October along<br />
the east coast of Nicaragua (Fig.<br />
2). The depression then moved<br />
inland and meandered over<br />
northeastern Nicaragua for two<br />
days. Late on 31 October it moved<br />
into the northwestern Caribbean<br />
Sea and became Tropical Storm<br />
Michelle. The cyclone moved<br />
slowly north-northwestward for<br />
the next two days as it<br />
strengthened into a hurricane. The<br />
hurricane turned slowly northward<br />
on 3 November (Fig. 5), with an<br />
Air Force Reserve Hurricane<br />
Hunter aircraft measuring a<br />
central pressure of 933 hPa.<br />
Michelle turned northeastward on<br />
4 November as maximum winds<br />
reached 120 kt. Later that day it<br />
hit western Cuba as a Category 4<br />
hurricane on the Saffir-Simpson<br />
Hurricane Scale. A weakening<br />
Michelle continued northeastward<br />
through the Bahamas on 5<br />
November and became<br />
extratropical over the<br />
southwestern Atlantic on 6<br />
November. The system was<br />
absorbed by a cold front late that<br />
day.<br />
Several ships encountered the<br />
large circulation of Michelle. The<br />
most significant observations were<br />
from the Scan Partner (call sign<br />
unknown) and the ELWU7 (name<br />
unknown). The Scan Partner<br />
passed near the center of Michelle<br />
at 0730 UTC 2 November and<br />
reported 34-47 kt winds and a<br />
988.0 mb pressure. The ELWU7<br />
reported 60-kt winds and a 995.0<br />
mb pressure at 1200 UTC on 5<br />
November. Other significant ship<br />
and buoy observations are<br />
included in Table 5.<br />
Michelle was the strongest<br />
hurricane to hit Cuba since 1952<br />
and left a trail of damage and<br />
death from Central America to the<br />
Bahamas. Cayo Largo, Cuba<br />
reported 108-kt sustained winds<br />
with gusts to 115 kt, along with a<br />
9- to 10-ft storm surge that<br />
Marine <strong>Weather</strong> Review<br />
reportedly innudated the entire<br />
island. Nassau, Bahamas reported<br />
a peak gust of 89 kt. Winds of 35<br />
to 45 kt occurred over portions of<br />
south Florida. In addition to the<br />
main storm surge, above normal<br />
tides and battering waves<br />
occurred in portions of Cuba, the<br />
Bahamas, the Cayman Islands,<br />
and south Florida. Seventeen<br />
deaths are associated with the<br />
hurricane, including 6 in<br />
Honduras, 5 in Cuba, 4 in<br />
Nicaragua, and 2 in Jamaica.<br />
Widespread severe damage<br />
occurred across western and<br />
central Cuba, with additional<br />
damage over portions of Central<br />
America, the Cayman Islands,<br />
Jamaica, and the Bahamas.<br />
Figure 5 - GOES-8 visible image of Hurricane Michelle at 1245<br />
UTC 3 November. Image courtesy of the Naval Research<br />
Laboratory, Monterey, CA.<br />
Spring/Summer 2002 69
Table 5 - Selected ship and buoy observations of 34 kt or greater winds<br />
for Hurricane Michelle, 29 October - 5 November, 2001.<br />
Hurricane Noel: The story of<br />
Noel is found above. A few ships<br />
besides the Tellus encountered<br />
the storm, and their reports are<br />
included in Table 6. There were<br />
no reports of damages or<br />
casualties from Noel.<br />
Hurricane Olga: Olga originated<br />
from yet another non-tropical low<br />
over the central Atlantic. The low<br />
formed on 22 November, and by<br />
24 November it had sufficiently<br />
organized convection to be<br />
classified a subtropical storm<br />
about 780 nmi east-southeast of<br />
Bermuda (Fig. 2). The storm<br />
moved northwestward to<br />
westward for a day or so as it<br />
acquired full tropical<br />
characteristics. It became a<br />
hurricane about 435 nmi east of<br />
Bermuda on 26 November. Olga<br />
made two loops from 26 to 28<br />
November, during which time<br />
maximum winds reached 80 kt. It<br />
70 <strong>Mariners</strong> <strong>Weather</strong> <strong>Log</strong><br />
then moved southwestward,<br />
weakening to a tropical storm on<br />
29 November and a depression on<br />
30 November. Olga turned<br />
northwestward late on 1<br />
December. It then turned northnorthwestward<br />
and regained<br />
tropical storm strength on 2<br />
November. The cyclone turned<br />
eastward on 3 November and<br />
again weakened to a depression<br />
the next day. It dissipated later<br />
that day about 600 nmi east of<br />
Nassau.<br />
Marine <strong>Weather</strong> Review<br />
Olga’s extratropical origin resulted<br />
in a large wind field which<br />
affected many ships. Selected<br />
observations are given in Table 7.<br />
The most significant reports were<br />
from the sailing yacht Manana<br />
Tres (call sign unknown), which<br />
indicated the system had formed a<br />
strong inner core, and from the<br />
Liberty Sun (WCOB), which<br />
passed near the center just before<br />
Olga became a hurricane.<br />
The only known damage from<br />
Olga was to the Manana Tres,<br />
which reported “lots of damage.”<br />
Swells generated by Olga affected<br />
portions of the U. S. east coast,<br />
the Bahamas, and the northeastern<br />
Caribbean islands.<br />
2. Eastern Pacific<br />
Hurricane Gil and Tropical<br />
Storm Henriette: These two<br />
storms developed almost<br />
simultaneously and eventually<br />
interacted with each other. Gil<br />
formed from an area of disturbed<br />
weather associated with the<br />
southern portion of the tropical<br />
wave which spawned Dean in the<br />
Atlantic. The disturbance moved<br />
westward across Central America<br />
Table 6 - Selected ship or buoy reports with winds of at least 34 kt for<br />
Hurricane Noel, 4-6 November 2001.
Table 7 - Selected ship reports with winds of at least 34 kt for Hurricane<br />
Olga, 24 November - 4 December, 2001.<br />
on 24 August, but it did not<br />
become a tropical depression until<br />
4 September when it was located<br />
about 850 nmi southwest of Cabo<br />
San Lucas, Mexico (Fig. 6). On<br />
the same day, early morning<br />
visible satellite images indicated<br />
that another circulation was<br />
organized enough to be classified<br />
as a tropical depression about 300<br />
nmi west-southwest of<br />
Manzanillo, Mexico. This was<br />
about 765 nmi east of Gil. Gil<br />
reached hurricane intensity with<br />
maximum winds of 85 kt on 6<br />
September, while Henriette<br />
strengthened to a peak of 55 kt<br />
on 7 September. Initially, Gil<br />
moved westward but Henriette<br />
moved faster and passed to the<br />
north of Gil. The two cyclones<br />
began to rotate around each other<br />
on 7 September. Henriette<br />
became absorbed by the<br />
circulation of Gil and dissipated on<br />
8 September. However, its<br />
remnant disturbance made a<br />
counterclockwise loop of Gil over<br />
the ensuing 24 hours. Gil’s<br />
circulation persisted a little bit<br />
longer but gradually weakened and<br />
dissipated on 9 September about<br />
1150 miles east of the Hawaiian<br />
Islands.<br />
The combination of Gil and<br />
Henriette created a large area of<br />
southwesterly and southerly winds<br />
Marine <strong>Weather</strong> Review<br />
to the east and southeast of the<br />
cyclones. The ship Pacific<br />
Highway reported 40 kt winds<br />
and 22 ft seas at 0000 UTC 7<br />
September in this flow while<br />
about 205 nmi southeast of the<br />
center of Gil.<br />
Tropical Storm Ivo: Ivo first<br />
formed about 100 nmi southsouthwest<br />
of Acapulco on 10<br />
September (Fig. 6). It moved<br />
slowly west-northwestward<br />
through its lifetime with its<br />
circulation hugging the coast.<br />
The cyclone became a tropical<br />
storm on 11 Septemberand<br />
reached a peak intensity of 45 kt<br />
on 12 September. It then<br />
weakened to a depression on 14<br />
September and dissipated the<br />
next day about 300 nmi west of<br />
Baja California.<br />
The ship ZDEB2 (name<br />
unknown) reported 37 kt winds<br />
at 0600 UTC 12 September,<br />
which was the basis for<br />
upgrading Ivo to a tropical storm.<br />
Although tropical-storm force<br />
winds occurred along portions of<br />
the coast of Mexico, there were<br />
no reports of damages or<br />
casualties.<br />
Hurricane Juliette: This large<br />
and powerful hurricane was the<br />
only eastern Pacific cyclone to<br />
make landfall during 2001. Juliette<br />
formed from the remnants of<br />
Atlantic Tropical Depression Nine,<br />
which entered the Pacific on 20<br />
September. The system organized<br />
into a depression about 90 nmi<br />
south of the coast of Guatemala<br />
on 21 September and reached<br />
tropical storm strength later that<br />
Spring/Summer 2002 71
day (Fig. 6). Juliette moved<br />
west-northwestward about<br />
100-200 nmi from the coast<br />
of Mexico from 21 to 26<br />
September. It became a hurricane<br />
on 23 September and reached a<br />
peak intensity of 125 kt on 25<br />
September (Fig. 7). On that date,<br />
an Air Force Reserve Hurricane<br />
Hunter aircraft measured a<br />
central pressure of 923 hPa, the<br />
second lowest measured pressure<br />
of record in the eastern Pacific.<br />
Juliette turned northward and<br />
began to weaken on 26<br />
September. It passed just west of<br />
Cabo San Lucas as a hurricane<br />
with 80 kt winds on 28 September<br />
and made landfall on the Baja<br />
California peninsula near San<br />
Carlos as a tropical storm with<br />
35-kt winds on 30 September.<br />
Juliette continued slowly<br />
northward as a depression into the<br />
Gulf of California and eventually<br />
dissipated over the northern<br />
portion of the Gulf on 3 October.<br />
The large circulation of Juliette<br />
Figure 6 - Eastern North Pacific tropical storms and hurricanes of 2001.<br />
72 <strong>Mariners</strong> <strong>Weather</strong> <strong>Log</strong><br />
Marine <strong>Weather</strong> Review<br />
Table 8 - Selected ship reports with winds of at least 34 kt for Hurricane<br />
Juliette, 23-28 September 2001.<br />
affected several ships. Selected<br />
significant observations are shown<br />
in Table 8. The most significant<br />
observation was from the Zim<br />
Atlantic (4XFD), which reported<br />
55-kt winds at 0600 UTC 28<br />
September.<br />
On shore, Cabo San Lucas<br />
reported sustained winds of 76 kt<br />
with a gust to 94 kt at 0000 UTC<br />
30 September. Two deaths are<br />
attributed to Juliette: a fisherman<br />
near Acapulco whose boat<br />
capsized in high seas, and a surfer<br />
who drowned near the Baja<br />
California coast. According to<br />
Mexican news agency reports,<br />
Juliette “clobbered’ the resort of<br />
Cabo San Lucas, isolating it for<br />
several days. Flooding in the state<br />
of Sonora drove more than 38,000<br />
people from their homes. Moisture<br />
from Juliette produced<br />
thunderstorms in southern<br />
California on 30 September,<br />
knocking down trees and power<br />
lines across the Coachella Valley.<br />
Hurricane Kiko: A portion of<br />
the tropical wave that spawned<br />
Atlantic Hurricane Felix likely<br />
spawned Kiko. The cyclone<br />
formed on 21 September about<br />
550 nmi southwest of Cabo San<br />
Lucas (Fig. 6). Moving generally<br />
west-northwestward to westward,<br />
the cyclone became a tropical<br />
storm later that day and briefly<br />
became a hurricane with 65-kt
Marine <strong>Weather</strong> Review<br />
Figure 7 - GOES-10 visible image of Hurricane Juliette near peak intensity at 2100<br />
UTC 25October 2001. Image courtesy of the National Climatic Data.<br />
winds on 23 September. Kiko<br />
weakened to a depression on 25<br />
September and degenerated into a<br />
low cloud swirl later that day near<br />
19oN. 129oW. There were no<br />
reports of damages, casualties, or<br />
tropical-storm-force winds.<br />
Tropical Storm Lorena: A<br />
tropical wave that crossed into the<br />
Pacific on 27 September organized<br />
into a tropical depression on 2<br />
October about 300 nmi south of<br />
Acapulco, Mexico (Fig. 6). The<br />
cyclone moved westnorthwestward<br />
and became<br />
Tropical Storm Lorena later that<br />
day. Lorena turned northnorthwestward<br />
on 3 October as it<br />
reached a peak intensity of 50-kt<br />
winds. The storm appeared to be a<br />
threat to the coast of Mexico at<br />
that time; however, strong vertical<br />
shear caused rapid weakening,<br />
and Lorena became a weak low<br />
on 4 October about 120 nmi<br />
southwest of Puerto Vallarta,<br />
Mexico.<br />
The ship ELXX7 (name<br />
unknown) reported 35-kt winds at<br />
1730 UTC 3 October, while an<br />
unidentified ship reported 35-kt<br />
winds a half-hour later. There<br />
were no reports of damages or<br />
casualties.<br />
Tropical Depression Fourteen-<br />
E: This short-lived system formed<br />
on 3 October about 800 nmi<br />
southwest of Cabo San Lucas.<br />
Maximum winds reached 30 kt<br />
before the system dissipated the<br />
next day.<br />
Tropical Storm Manuel: Manuel<br />
formed from the remnants of<br />
Atlantic Hurricane Iris. While Iris<br />
dissipated over Central America<br />
on 9 October, a new circulation<br />
center formed over the adjacent<br />
Pacific. This system became<br />
organized into a tropical<br />
depression on 10 October about<br />
175 nmi south of Acapulco (Fig.<br />
6). After becoming a tropical<br />
storm on 11 October, it moved<br />
westward to west-southwestward<br />
away from Mexico and weakened<br />
to a tropical depression on 12<br />
October. Manuel then turned<br />
northwestward and regained<br />
tropical storm status on 15<br />
October. It strengthened to its<br />
peak intensity of 50 kt on 16<br />
October a little over 520 nmi<br />
south-southwest of Cabo San<br />
Spring/Summer 2002 73
Lucas. Weakening occurred<br />
thereafter, with Manuel becoming<br />
a depression again on 17October<br />
and dissipating about 660 nmi<br />
west-southwest of Cabo San<br />
Lucas the next day. There were<br />
no reports of damages, casualties,<br />
or tropical-storm force winds.<br />
Hurricane Narda: Narda formed<br />
about 1150 nmi southwest of Cabo<br />
San Lucas on 20 October (Fig. 6).<br />
It became a tropical storm later<br />
that day and a hurricane with 75<br />
kt winds on 22 October while<br />
moving west-northwestward.<br />
Narda then turned westward and<br />
weakened, becoming a tropical<br />
storm on 23 October and a<br />
depression on 24 October. Strong<br />
vertical wind shear caused the<br />
tropical cyclone to dissipate about<br />
520 nmi east-southeast of the<br />
Hawaiian Islands on 25 October.<br />
There were no reports of<br />
damages, casualties, or tropicalstorm-force<br />
winds.<br />
Hurricane Octave: Octave<br />
developed from a large area of<br />
disturbed weather about 1000 nmi<br />
southwest of Cabo San Lucas on<br />
31 October (Fig. 6). The westnorthwestward<br />
moving cyclone<br />
became a tropical storm later that<br />
day and a hurricane on 1<br />
November. Octave turned<br />
northwestward and reached a<br />
peak intensity of 75 kt on 2<br />
November before weakening to a<br />
tropical storm later that day. On 3<br />
November, the system turned<br />
westward and weakened to a<br />
depression, and it dissipated later<br />
that day about 1300 nmi westsouthwest<br />
of Cabo San Lucas.<br />
There were no reports of<br />
74 <strong>Mariners</strong> <strong>Weather</strong> <strong>Log</strong><br />
damages, casualties, or tropicalstorm-force<br />
winds.<br />
B. Other Significant Events:<br />
1. Atlantic, Caribbean and Gulf of<br />
Mexico<br />
West Atlantic Gale 30<br />
September: An early season<br />
cold front became stationary on 26<br />
September from the western<br />
Atlantic across south central<br />
Florida to the Bay of Campeche.<br />
Winds increased late on 28<br />
September across the Gulf of<br />
Mexico and western Atlantic as a<br />
low pressure center formed along<br />
the front just north of the Yucatan<br />
Peninsula. At 1200 UTC 29<br />
September, a 1005 mb low was<br />
analyzed near the Dry Tortugas,<br />
Florida. The low moved<br />
northeastward across south<br />
Florida and by 0000 UTC 30<br />
September was located just east<br />
of Palm Beach, Florida. It<br />
continued northeastward and<br />
produced a brief period of gales<br />
off the Georgia and north Florida<br />
coasts. The ship A. V. Kastner<br />
(ZCAM9) reported northeast<br />
winds of 35 kt at 0000 UTC 30<br />
September. By 1200 UTC the low<br />
center was near 31°N. 70°W., and<br />
gales had moved north of 31°N.<br />
Since no QuikScat data were<br />
available due to the short duration<br />
of the event, the ship observations<br />
were extremely useful in<br />
determining the magnitude of the<br />
winds.<br />
Northwest Caribbean Gale 29-<br />
31 October: A cold front that<br />
moved off the coast of Texas on<br />
Marine <strong>Weather</strong> Review<br />
25 October reached the<br />
northwestern Caribbean on 27<br />
October. The front moved slowly<br />
southeast across the Gulf on 26<br />
October, and by 1200 UTC that<br />
day, a strong 1037 hPa high was<br />
located well northwest of the front<br />
over the central United States.<br />
Northeast winds increased to 20-<br />
25 kt across the northwest<br />
Caribbean behind the front. On 28<br />
October, the front was stationary<br />
across the northwestern<br />
Caribbean while a broad low<br />
pressure area (the precursor of<br />
Hurricane Michelle) strengthened<br />
over the southwestern Caribbean<br />
Sea. By 1200 UTC on 29 October,<br />
winds increased to gale force from<br />
16°N. to 20°N. between 78°W<br />
and 85°W. At that time the ship<br />
Chiquita Schweiz (C6KD9)<br />
reported 34-kt winds and 4-m (13ft)<br />
seas near 18°N. 80°W. Later<br />
that day the broad low became a<br />
tropical depression (Fig. 2). Galeforce<br />
winds were associated with<br />
the stationary front located well<br />
north of the depression. QuikScat<br />
data from just before 0000 UTC<br />
30 October indicated a large area<br />
of 30-40 kt winds over the<br />
northern Caribbean. The area of<br />
gale-force winds spread<br />
northeastward, and by 1200 UTC<br />
on 30 October covered the entire<br />
Caribbean north of 18°N. At that<br />
time Chiquita Schweiz again<br />
observed gale force winds of 40 kt<br />
near the Windward Passage. By<br />
1200 UTC 31 October, the high<br />
pressure over the eastern United<br />
States began to weaken and move<br />
northeastward. This weakened the<br />
pressure gradient over the<br />
northwestern Caribbean and winds<br />
decreased below gale force.
Figure 8 - GOES-8 visible image of western Atlantic gale at 1815 UTC 15 November<br />
2001. Image courtesy of the National Climatic Data Center.<br />
However, winds in that area soon<br />
increased with the approach of<br />
Michelle.<br />
Central Atlantic Gale 3-4<br />
November: This event was<br />
associated with the low that<br />
eventually became Hurricane<br />
Noel. As the low intensified just<br />
north of the TPC high seas<br />
forecast area on 2 November, the<br />
winds increased to gale force over<br />
the area north of 29°N. between<br />
45°W. and 55°W. At 0600 UTC<br />
that day the ship Chiquita<br />
Schweiz again encountered gale<br />
force winds of 36 kt near 29°N.<br />
53°W. This helped confirm<br />
QuikScat data a short time later.<br />
By 1800 UTC that day, the low<br />
had strengthened into a storm<br />
center near 33°N.44°W. At that<br />
time the ships Chiquita Schweiz,<br />
Endurance (WAUU), and<br />
Grafton (ZCBO5) observed<br />
northeast winds of 35 to 40 kt<br />
near 30°N. 50°W. The storm<br />
center moved northwestward on 3<br />
November. A QuikScat pass from<br />
2108 UTC that day detected 30-<br />
35-kt winds north of 30°N.<br />
between 48°W. and 57°W. Gales<br />
ended south of 31°N by 1800<br />
UTC on 4 November as the<br />
system turned northward.<br />
West Atlantic Gale: 15-16<br />
November: A weakening<br />
stationary front extended east to<br />
west across the western Atlantic,<br />
while a strong high pressure<br />
center located along the mid-<br />
Atlantic coast produced strong<br />
northeast to east winds north of<br />
the front. A low started forming<br />
on the western end of the front<br />
late on 14 November just east of<br />
Marine <strong>Weather</strong> Review<br />
central Florida. The low quickly<br />
strengthened and became a 1006<br />
hPa gale center near 28°N. 80°W.<br />
at 0600 UTC on 15 November. At<br />
0600 UTC, the Tellus and the<br />
Kent Sprint (VGDX) observed<br />
40-kt winds off the north Florida<br />
and Georgia coasts. The ship<br />
observations confirmed a 1023<br />
UTC QuikScat pass which<br />
showed an area of 30-40-kt<br />
easterly winds from 30°N. to<br />
33°N. west of 72°W. At 1200<br />
UTC, the ship Lykes<br />
Discoverer (WGXO)<br />
encountered northeast winds of 37<br />
kt, while an unidentified ship<br />
reported 40-kt winds near 31°N.<br />
78.5°W. GOES-8 visible satellite<br />
imagery at 1815 UTC 15<br />
November (Fig. 8) showed the<br />
well-defined low just off the eastcentral<br />
Florida coast. The gale<br />
center drifted northeastward and<br />
Spring/Summer 2002 75
weakened while the high pressure<br />
center off the mid-Atlantic coast<br />
moved east into the central<br />
Atlantic. By 0600 UTC on 16<br />
November, gale conditions ended<br />
south of 31°N. but continued over<br />
the Marine Prediction Center’s<br />
area north of 31°N. At 1800<br />
UTC, the gale center weakened<br />
to a low near 29°N. 76°W., which<br />
eventually dissipated northeast of<br />
Puerto Rico on 21 November.<br />
Gulf of Mexico Cold Front 29-<br />
30 November: A slow-moving<br />
cold front moved off the coast of<br />
southeast Texas around 0000<br />
UTC 28 November. Early on 29<br />
November, the front accelerated<br />
southeastward as stronger high<br />
pressure moved southward across<br />
the central United States. By<br />
0600 UTC, the front extended<br />
from just east of Lake Charles,<br />
Louisiana to the southwestern<br />
Bay of Campeche. At that time<br />
northwesterly gale force winds<br />
began over the southwest Gulf of<br />
Mexico in the area south of 25°N.<br />
west of the cold front. The ship<br />
Koeln Express (9VBL)<br />
observed 37-kt winds at 1200<br />
UTC and 33-kt winds at 1800<br />
UTC in the southwest Bay of<br />
Campeche. The short-lived gale<br />
event ended at 0000 UTC 30<br />
November.<br />
Central and East Atlantic<br />
Gales 17-18 December and<br />
23-26 December: A<br />
predominant longwave trough was<br />
over the central and east Atlantic<br />
during the later half of December.<br />
Several fast-moving cold fronts<br />
and gale centers moved<br />
southeastward, then eastward just<br />
76 <strong>Mariners</strong> <strong>Weather</strong> <strong>Log</strong><br />
north of 31°N., producing periods<br />
of gale force winds over the<br />
eastern portion of the TPC<br />
forecast area. Gales associated<br />
with the first system began at<br />
0600 UTC 17 December. Gale<br />
conditions and seas of 4.5 to 6 m<br />
(15-20 ft) occurred over the TPC<br />
forecast area north of 29°N. east<br />
of 50°W. At 0600 UTC and 1200<br />
UTC 17 December the ship<br />
Chiquita Nederland (C6KD6)<br />
encountered west to northwest 35<br />
to 40-kt winds near 30°N. 45°W.<br />
A day later the ship Coral Reef<br />
(C6RO6) and the ship C6RO2<br />
(name unknown) experienced<br />
westerly gale force winds of 35-<br />
40 kt near 30°N. 45°W. at 0600<br />
UTC and 1200 UTC. By 0000<br />
UTC 19 December, gale<br />
conditions ended south of 31°N.;<br />
however, swells of 3.5-5.5 m (12-<br />
Marine <strong>Weather</strong> Review<br />
Figure 9 - QuikSCAT data at 0755 UTC 26 December 2001. Image<br />
courtesy of the National Environmental Satellite, Data, and<br />
Information Service.<br />
18 ft) continued north of 25°N.<br />
east of 55°W. through the rest of<br />
that day.<br />
The next cold front began<br />
producing gales along 31°N.<br />
shortly before 1200 UTC 23<br />
December. At that time this fastmoving<br />
front extend through<br />
31°N. 42°W. - 21°N. 55°W. to<br />
near Puerto Rico. QuikScat data<br />
at 2134 UTC that day showed a<br />
large area of 30 to35-kt winds<br />
north of 29°N. between 45°W.<br />
and 55°W. On 24 December at<br />
0000 UTC, the ship Licorne<br />
Pacifique (J8CV5) reported<br />
northwest winds of 35 kt near<br />
29°N. 53°W. By 0000 UTC on 25<br />
December, the cold front reached<br />
from 31°N. 31°W. -19°N. 40°W.<br />
to near 15°N. 58°W. At that time<br />
gale conditions covered the area
Figure 10 - GOES-8 visible image of eastern Atlantic gale at 1215 UTC<br />
26 December 2001. Image courtesy of the National Climatic Data<br />
Center.<br />
north of 27°N. east of 53°W. On<br />
25-26 December a fast-moving<br />
storm center moved<br />
southeastward and then eastward<br />
just north of 31°N. This caused<br />
winds to increase 30-40 kt over<br />
the TPC forecast area. At 0600<br />
UTC on the 26th, the 988-hPa<br />
storm was centered near 33°N.<br />
42°W. At that time the ship<br />
Chiquita Rostock (ZCBD2)<br />
experienced west winds of 40 kt<br />
near 29°N. 42°W. QuikScat<br />
detected 40 to 50 kt winds just<br />
southwest of the storm center and<br />
30 to 40-kt winds south of 31°N.<br />
at 0755 UTC that day (Fig. 9).<br />
GOES-8 satellite imagery at 1215<br />
UTC 26 December (Fig. 10)<br />
clearly detected the well-defined<br />
storm. By 0000 UTC on 27<br />
December, the storm weakened<br />
and moved northeastward away<br />
from the TPC forecast area, and<br />
gale conditions moved north of<br />
31°N. However, northwest winds<br />
of 25-30 kt and seas of 3.5-5.5 m<br />
(12-18 ft) continued north of<br />
25°N. east of 50°W. until 28<br />
December.<br />
2. Eastern Pacific<br />
Six Gulf of Tehuantepec gale<br />
events occurred during the period<br />
beginning in the middle of<br />
October, with the estimated<br />
beginning and ending times given<br />
in Table 9. These events were<br />
documented by QuikScat data or<br />
occasionally by reliable ship<br />
observations.<br />
The first event occurred between<br />
17-19 October. A strong cold<br />
front moved southeastward<br />
Marine <strong>Weather</strong> Review<br />
across the Gulf of Mexico on the<br />
16-17 October, and a 1030 hPa<br />
high pressure center moved<br />
southward to eastern Texas by<br />
0600 UTC on the 17th. At that<br />
time gales began over the Gulf of<br />
Tehuantepec. There were no ship<br />
observations of gale force winds<br />
during the event; however,<br />
QuikScat data detected 30 to35-kt<br />
winds during the event, which<br />
ended at 1200 UTC 19 October.<br />
The second event, beginning at<br />
0600 UTC 28 October, was more<br />
prolonged. Two ships reported<br />
gale force winds - the Chiquita<br />
Joy (ZCBC2), which observed<br />
north winds of 37 kt at 1800 UTC<br />
28 October and 38 kt at 0000<br />
UTC 29 October, and the Marine<br />
Chemist (KMCB), which<br />
reported 35-kt winds at 0000 UTC<br />
on 29 October. Several QuikScat<br />
passes during the event showed<br />
gales with winds as high as 40 kt<br />
at 1232 UTC on 29 October.<br />
Subsequent QuikScat passes on<br />
30-31 October showed 30-35 kt<br />
winds. The event ended at 1200<br />
UTC 1 November.<br />
The next event began just before<br />
1200 UTC 5 November and was<br />
observed by several ships. The<br />
ship Tristan (SKWI) encountered<br />
winds of 37 kt and 38 kt at 1200<br />
and 1800 UTC, respectively.<br />
Other ships including the Saloma<br />
(VRVT2), Leverkusen Express<br />
(DEHY), Overseas New<br />
Orleans (WFKW), and the ship<br />
30111 (name unknown) observed<br />
winds of 35-40 kt between 1800<br />
UTC on 5 November and 1800<br />
UTC on 6 November. It is unusual<br />
to receive so many ships’<br />
Spring/Summer 2002 77
observations of gale force winds<br />
during a single Tehuantepec<br />
event. These observations were<br />
very useful, as QuikScat data<br />
only detected 30 to35-kt winds.<br />
The event ended at 1800 UTC 7<br />
November.<br />
The fourth event began a few<br />
days later, just before 0000 UTC<br />
10 November. During the event<br />
there were no ship observations<br />
of gale force winds; however the<br />
ship Zim Asia (4XFB) observed<br />
32-kt winds at 0600 UTC on 11<br />
November. Another ship, the<br />
Bosporus Bridge (3FMV3),<br />
78 <strong>Mariners</strong> <strong>Weather</strong> <strong>Log</strong><br />
Marine <strong>Weather</strong> Review<br />
Table 9 - Gulf of Tehuantepec Gale Events (October - December 2001).<br />
encountered 33-kt winds well<br />
south of the Gulf of Tehuantepec<br />
six hours later. Therefore, it is<br />
likely that gale-force winds<br />
occurred over the Gulf of<br />
Tehuantepec. Winds decreased<br />
below gale force at 0600 UTC 12<br />
November.<br />
The next event lasted only 24<br />
hours. Gales began just before<br />
0000 UTC 10 December. Highresolution<br />
QuikScat data<br />
indicated 35 to 40-kt winds near<br />
that time; however, no ship<br />
observations of gales were<br />
received. The event ended by<br />
0000 UTC 11 December.<br />
The sixth event of the period<br />
began just before 1200 UTC 20<br />
December. QuikScat data from<br />
1208 UTC 20 December indicated<br />
35-kt winds over the Gulf. Two<br />
subsequent QuikScat passes near<br />
0000 UTC and 1200 UTC on 21<br />
December showed winds of 35-40<br />
kt.<br />
There were no ship observations<br />
of gale-force winds during the<br />
event, but the ship Pearl Ace<br />
(VRUN4) observed 30-kt winds<br />
at 0600 UTC on 22 December.<br />
Gale conditions ended shortly<br />
before 1200 UTC that day.
New Great Lakes <strong>Weather</strong> Station Gives<br />
Forecasters and <strong>Mariners</strong> Crucial Data<br />
By David Gilhousen<br />
National Data Buoy Center<br />
In November 2001, the<br />
National Data Buoy<br />
Center (NDBC) installed a<br />
new automatic weather station<br />
atop the Lake St. Clair<br />
Lighthouse near Detroit. The<br />
station, identified as LSCM4, is<br />
the 57 th station in NDBC’s<br />
Coastal-Marine Automated<br />
Network (C-MAN). On April 11,<br />
2002, a buoy (station 45012) was<br />
deployed in the middle of Lake<br />
Ontario, expanding its present<br />
network to approximately 70<br />
moored buoy stations. Station<br />
45012 is located near Rochester,<br />
NY at approximately 43° 37' N.,<br />
77° 24' W.<br />
The C-MAN station at Lake St.<br />
Clair Lighthouse is funded<br />
through Michigan’s Department<br />
of Environmental Quality (DEQ)<br />
with support from the U.S.<br />
Geological Survey (USGS.) and<br />
the Detroit Water and Sewerage<br />
Department. Lake St. Clair is a<br />
large source of drinking water for<br />
the Detroit area, and the USGS.<br />
is conducting modeling of lake<br />
currents in order to better assess<br />
the effect of pollutants on the<br />
lake. The USGS needed a high<br />
quality, year-round wind<br />
measurement for its computer<br />
model and worked with the DEQ<br />
to fund the C-MAN station. In<br />
addition to the winds, the C-MAN<br />
station also measures air<br />
temperature, water temperature,<br />
dew point, and sea level pressure.<br />
“Though there are weatherreporting<br />
data buoys in the lake,<br />
they are retrieved by the middle of<br />
November and not re-deployed<br />
until April,” said Greg Mann of the<br />
National <strong>Weather</strong> Service Office<br />
in Detroit. “We produce marine<br />
New Great Lakes <strong>Weather</strong> Station<br />
(Photo used by permission of<br />
Don Carter)<br />
forecasts year-round for<br />
Lake St. Clair, and the worst<br />
storms usually occur in late fall or<br />
early spring.” Lake St. Clair is a<br />
popular location for recreational<br />
boaters and ice fishermen. The<br />
weather reporting buoys are<br />
operated by the University of<br />
Michigan and the Meteorological<br />
Service of Canada.<br />
The buoy in Lake Ontario will<br />
serve as a replacement for our C-<br />
MAN station at Galloo Island, NY<br />
(GLLN6). The Canadian Coast<br />
Guard will be used to deploy and<br />
retrieve the buoy, since the U.S.<br />
Coast Guard has no buoy tenders<br />
in Lake Ontario and maintains<br />
Aids-to-Navigation buoys via an<br />
agreement with the Canadians.<br />
The C-MAN equipment will be<br />
removed from GLLN6 because<br />
the lighthouse (where the<br />
equipment is located), is in<br />
disrepair, and the Coast Guard<br />
facility has been sold to a private<br />
party. A Canadian weather buoy<br />
station, 45135, located about 20<br />
miles southwest of GLLN6,<br />
provides representative<br />
observations for Eastern Lake<br />
Ontario, and the National <strong>Weather</strong><br />
Service’s Eastern Region has<br />
determined a greater need for<br />
observations in central Lake<br />
Ontario. The Meteorological<br />
Service of Canada is also aiding in<br />
this effort by providing buoy<br />
winter storage and dock space at<br />
their facilities in Hamilton,<br />
Ontario.<br />
In addition to wave height and<br />
period, the buoy will measure<br />
winds, air temperature, water<br />
temperature, and sea level<br />
pressure. In a 2000 survey<br />
conducted by WFO Buffalo of<br />
<strong>NOAA</strong> <strong>Weather</strong> Radio users, the<br />
lack of wave measurements was<br />
identified as the single most<br />
important deficiency in weather<br />
information. The observations<br />
provided by 45012 should help fill<br />
this void.<br />
Observations from both stations<br />
can be obtained through <strong>NOAA</strong><br />
<strong>Weather</strong> Radio, the Dial-A-Buoy<br />
line (228-688-1948), or by<br />
accessing NDBC’s Web site,<br />
www.ndbc.noaa.gov.<br />
Spring/Summer 2002 79
Alaskan Waters:<br />
Collecting <strong>Ship</strong>s Observations<br />
Rich Courtney<br />
PMO WSO Kodiak, Alaska<br />
Another pair of eyes is<br />
always advantageous. It is<br />
the main reason why many<br />
police officers work in pairs,<br />
airliners have two pilots, and<br />
indeed, many vessels double the<br />
watch for conducting hazardous<br />
evolutions such as entering port or<br />
restricted waters. So too, lies the<br />
relationship between the vessel<br />
crews and meteorologists. A<br />
second set of eyes measure the<br />
effectiveness of computer models<br />
in rapidly changing dynamic<br />
weather patterns. Masters, mates<br />
and seamen all assist in the<br />
forecast process by providing the<br />
“ground truth” that is vital to a<br />
good forecast. Meteorologists keep<br />
the forecast on track with the help<br />
of the vessel crews. Recruitment<br />
of these eyes has a very high<br />
priority within the various offices in<br />
the Alaskan Region.<br />
Alaska has the largest coastline of<br />
any U.S. state with numerous<br />
bays, passes and channels.<br />
Forecasting correct weather<br />
conditions is challenging at best.<br />
There are very few shipping lanes<br />
into the region, and this has led to<br />
very sparse weather observations<br />
in the past. However, there is a<br />
large amount of coastal traffic in<br />
the form of tugs, cruise ships,<br />
ferries, oil/gas platforms and<br />
fishing vessels. These numerous<br />
80 <strong>Mariners</strong> <strong>Weather</strong> <strong>Log</strong><br />
“second set” of eyes are used to<br />
keep the forecasts current and on<br />
track. Most observations are<br />
collected via High Frequency<br />
Single Side Band Radio, SEAS<br />
software, e-mail or by telephone.<br />
Alaska Region has three, part-time<br />
Port Meteorological Officers<br />
located in Anchorage, Kodiak and<br />
Valdez. The responsibilities of<br />
these offices include recruiting and<br />
training ship’s personnel in<br />
reporting weather observations,<br />
principally with the SEAS<br />
software systems. More than 200<br />
ship visits were made in pursuit of<br />
these duties during 2001. In<br />
addition, Alaska has three forecast<br />
offices, in Anchorage, Juneau and<br />
Fairbanks, and ten <strong>Weather</strong><br />
Service Offices. Forecast Offices<br />
issue warnings and forecasts twice<br />
daily with updates. Meteorologists<br />
occasionally ride ships to<br />
familiarize themselves with ship<br />
operations in sea conditions. The<br />
<strong>Weather</strong> Service Offices located<br />
in Annette Island; Barrow; Bethel;<br />
Cold Bay; King Salmon;<br />
Kotzebue; McGrath; Nome; St.<br />
Paul and Yakutat also visit ships,<br />
collect weather observations,<br />
furnish training, and provide<br />
barometer calibration services.<br />
These offices conducted another<br />
100 visits in an effort to reach our<br />
“at-sea” customer base.<br />
Coastal Forecast Office News<br />
Efforts by the Region to recruit<br />
ships began in the mid 1970’s. Ms.<br />
Peggy Dyson of Kodiak had an<br />
informal grapevine that was used<br />
to pass forecats over HF/SSB<br />
radio and collect reports with at<br />
sea conditions. Afterward, she<br />
would type the observations and<br />
send them over landlines to the<br />
Forecast offices. Later, this effort<br />
was expanded to other National<br />
<strong>Weather</strong> Service Offices. In 1999,<br />
tests were conducted by <strong>Weather</strong><br />
Service Office Kodiak to report<br />
limited amounts of data in the<br />
ship’s synoptic code. The shift to<br />
use the synoptic code was needed<br />
to modernize the reporting process.<br />
It allowed this valuable source of<br />
information directly into model<br />
analyses and integrated into the<br />
various office display equipment<br />
used in the NWS Forecast Offices.<br />
Initially, the vessels only called on<br />
data for pressure, wind, sea height<br />
and air temperature. The result<br />
was a resounding success, with the<br />
Marine Prediction Center and<br />
World Meteorological Organization<br />
getting approximately 3000 ship<br />
observations in a region normally<br />
void of reports. In 2000, efforts<br />
were sought by the Alaska Marine<br />
<strong>Program</strong> Manager, Mr. Greg<br />
Matzen, to secure a programmer to<br />
help automate the reporting process.<br />
Ms. Rose Cunningham, a<br />
programmer in the Alaskan Region
HQ, was assigned the task of<br />
developing a software program<br />
that would encode data reported in<br />
a limited format. The task received<br />
technical assistance in scope and<br />
design from the author in Kodiak.<br />
While the SEAS software was<br />
designed for use by one vessel and<br />
report via Satellite, the BBXX<br />
encoder was designed to report<br />
multiple ship reports through<br />
landlines. During 2000 and 2001,<br />
some 9500 and 12,000 ship observations<br />
were encoded and transmitted<br />
to the Marine Prediction<br />
Center respectively. These observations<br />
ranged from SE Alaska’s<br />
inner channels to the Bering Sea<br />
and across the north slope of<br />
Alaska in the Beaufort Sea.<br />
With the advent of the SEAS 2000<br />
software, an effort was started to<br />
collect ship observations directly<br />
from the vessels involved with<br />
reporting the weather. Smaller<br />
vessels, such as tugs and fishing<br />
vessels are equipped with an email<br />
capability that allows<br />
messages to be sent via Inmarsat-<br />
C. However, the message has to<br />
be in ASCII text. The new SEAS<br />
software has this capability<br />
incorporated into this. To exploit<br />
this capability, an e-mail address<br />
was established in Alaska Region<br />
HQ to accept the reports. They<br />
are then sent to Marine Prediction<br />
Center via landline. In May 2001<br />
Mr. Michael Daigler, Chief Mate<br />
aboard the tug Northern Spirit,<br />
and the author discussed a variety<br />
of ways to increase the number of<br />
reports directly to forecasters in<br />
Alaskan waters. The new SEAS<br />
software was mentioned, including<br />
the fact that the NWS was looking<br />
for a tug to test this capability.<br />
Michael asked to have the software<br />
sent to him on a CD, along with the<br />
accompanying text for taking<br />
observations. Installation and<br />
training was conducted over the<br />
phone and placed on Michael’s<br />
personal laptop. Observations were<br />
taken, encoded and sent through<br />
Inmarsat-C using the ship’s account<br />
with Stratosmobile. Mr. Daigler<br />
continued sending one observation a<br />
day for the remainder of the month,<br />
giving him a direct communication<br />
with the forecasters in the Juneau<br />
Forecast Office. Northern Spirit’s<br />
observations took on a great deal of<br />
importance, as the tug spends<br />
nearly all it’s time in the inner<br />
channels of Southeast Alaska, from<br />
Ketchikan to Haines. In these tight<br />
and congested waters, the<br />
Coastal Forecast Office News<br />
topography of the land greatly<br />
influences the weather conditions,<br />
especially the wind direction and<br />
speed as well as sea conditions.<br />
The following month Mr. Bernie<br />
Meier, Master of the Crowley<br />
Marine Services tug Sinuk, was<br />
Northern Spirit receives award - Superior VOS<br />
Performance.<br />
headed to the northern coast of<br />
Alaska in support of the resupply<br />
effort of the oil industry. Sinuk<br />
and several more Crowley tugs<br />
provided a constant stream of<br />
data of North Slope weather<br />
conditions.<br />
Observations from smaller<br />
coastal craft have also provided<br />
many benefits. The smaller craft<br />
tend to move outside the shipping<br />
lanes providing valuable data in<br />
these isolated coastal areas.<br />
These vessels tend to be located<br />
within 30 feet of the water’s<br />
Spring/Summer 2002 81
82 <strong>Mariners</strong> <strong>Weather</strong> <strong>Log</strong><br />
Tug SINUK<br />
Coastal Forecast Office News<br />
Northern Spirit<br />
surface and provide a closer view<br />
of the sea and swell heights.<br />
Working in the near coastal zone<br />
also provides valuable information<br />
on the topographic effects that<br />
terrain has on the weather<br />
conditions.<br />
As the saying goes, “You can’t do<br />
much about the weather except<br />
talk about it” and that’s just what<br />
the coastal shipping in Alaska is<br />
doing. Plans for the future include<br />
additional vessels from the towing,<br />
ferry, fishing industries and oil and<br />
gas platforms to keep an eye on<br />
the Alaskan weather.
Captain Richard Swain (left) and Chief Mate Steve Iltich (right)<br />
of the Crowley Tug Warrior while at the Port of Anchorage on<br />
November 21, 2001.<br />
Coastal Forecast Office News<br />
The crew of the CSX Anchorage<br />
was presented with an Award of<br />
Excellence while in the port of<br />
Anchorage, Alaska on<br />
November 6, 2001. Pictured<br />
from left to right are: Cadet Jim<br />
Carmany III, 3rd Mate Fred<br />
Koster, and 2nd Mate William<br />
Johnson.<br />
Captain Douglas Lefebvre of the<br />
CSX Anchorage received the<br />
Alaska Marine <strong>Program</strong> Award of<br />
Excellence while at the Port of<br />
Anchorage on November 27, 2001.<br />
The CSX Anchorage is a Top 10<br />
ship. They have made the 4th<br />
highest total of observations in<br />
Alaskan waters for both October<br />
with 92,and for the first 10 months<br />
of 2001 with 565.<br />
Spring/Summer 2002 83
Coastal Forecast Office News<br />
3rd Mate Jack Worman (left) while in the Port of<br />
Anchorage on December 4, 2001, and 2nd Mate Brad<br />
Goodwin (below) of the CSX Kodiak The Kodiak<br />
received the Alaska Marine <strong>Program</strong> Award of<br />
Excellence for November 2001 It was in the Top 10<br />
again in Alaskan waters for ship observations and has<br />
taken 478 so far this year<br />
Captain John Strong from the SeaCoast Tug<br />
Public Pride receiving the Alaskan Marine<br />
<strong>Program</strong> Award of Excellence for being one of<br />
the top weather reporting vessels in Alaskan<br />
waters for May 2001 The Pacific Pride was<br />
visiting the Port of Anchorage on July 27, 2001<br />
Spring/Summer 2002 5
2nd Mate Don Antonio Scichili (left), Captain Domenico Aiello (center)<br />
and 2nd Mate Francesco Caccamo (right) of the LNG Tanker Polar<br />
Eagle as received the Alaska Marine Award of Excellence while in<br />
Nikiski, Alaska on December 19, 2001<br />
6 <strong>Mariners</strong> <strong>Weather</strong> <strong>Log</strong><br />
Coastal Forecast Office News<br />
Captain Larry Thormahlen (left), Chief Mate George Nielsen (center) and<br />
2nd Mate Mark Irish (right) of the Tug Malolo while at the Port of<br />
Anchorage on December 3, 2001 The Malolo was on of the Top 10 weather<br />
reporting vessels in Alaskan water for the month of October 2001 They<br />
began using and enjoying the new Windows SEAS 522 software this<br />
summer
84 <strong>Mariners</strong> <strong>Weather</strong> <strong>Log</strong><br />
VOS New Recruits<br />
National <strong>Weather</strong> Service <strong>Voluntary</strong> <strong>Observing</strong> <strong>Ship</strong> <strong>Program</strong><br />
New Recruits from 1 Nov 2001 to 30 Apr 2002
2 <strong>Mariners</strong> <strong>Weather</strong> <strong>Log</strong><br />
VOS <strong>Program</strong> Awards<br />
VOS award recipients aboard the Norway, from left to right: Kjell<br />
Peterson, 2ND Officer, TrondClar Hauge, and Mariven Castro,<br />
3RD Officer<br />
Jim Nelson, PMO Houston/Galveston (on<br />
right) presents award to Captain William L<br />
Miles (on left) of the Lykes Discoverer<br />
(WGXO) Lykes Discoverer provided our<br />
forecasters with 756 weather observations in<br />
2000 This is Captain Miles’ second year in a<br />
row on two different ships receiving our<br />
annual award When Captain Miles is off,<br />
Captain David S Putty is Master The<br />
National <strong>Weather</strong> Service and <strong>NOAA</strong> extend<br />
their thanks to both Masters for their great<br />
support
Receiving a SEAS award for the <strong>NOAA</strong> ship Albatross are<br />
(from right to left): ENS Sean Suk, Junior Officer; ENS John<br />
Crofts, Junior Officer; CDR Michael Abbott, Commanding<br />
Officer; Stephen Wagner, Operations Officer; and ENS Jeff<br />
Taylor, Navigation Officer<br />
VOS <strong>Program</strong> Awards<br />
PMO Jack Warrelmann presents VOS award to CAPT Satish L<br />
Hardas and First Officer Girish C Lele of the M/V Bernardo<br />
Quintana A Shown right to left are: First Officer Lele, CAPT<br />
Hardas, and PMO Warrelmann<br />
Spring/Summer 2002 3
1st Officer ODD Toedegaard of the Marit Maersk<br />
4 <strong>Mariners</strong> <strong>Weather</strong> <strong>Log</strong><br />
VOS <strong>Program</strong> Awards<br />
PMO Jack Warrelmann presents VOS award to the <strong>NOAA</strong> ship<br />
Gordon Gunter Shown right to left are: PMO Jack Warrelmann,<br />
LT JG Thomas J Peltzer (NAV O), ENS Andrew A Hall (OPS O),<br />
and ENS Sean D Cimilluca
VOS <strong>Program</strong> Awards<br />
PMO Jack Warrelmann presents VOS award to the <strong>NOAA</strong> ship<br />
Oregon II Pictured right to left are: ENS Nick Toth, Master<br />
James C Rowe, PMO Jack Warrelmann, 3rd Mate Dave Nelson<br />
and LT CDR Ray Slagle<br />
The Shiraoi Maru was selected by Pat Brandow,<br />
PMO Seattle, as one of the top performers of 2000 A<br />
VOS plaque was presented to the crew Pictured left<br />
to right are: Wei Shu Jiang, Chief Officer; Zhao Ki<br />
Jun, Captain; and Wang Hui Dong, 3rd Mate<br />
Spring/Summer 2002 5
VOS award presented to the Delaware Bay<br />
Pictured from left to right are: Jim<br />
Farrington (Northeast Atlantic SEAS<br />
Representative), AB Al Shurtleff and Captain<br />
G Gregorek Not shown: Chief Mate - J<br />
Bartek, 2nd Mate K Quinn, 3rd Mate G<br />
Tarzetti and AB J Forester<br />
6 <strong>Mariners</strong> <strong>Weather</strong> <strong>Log</strong><br />
VOS <strong>Program</strong> Awards<br />
Pictured left to right are: Seaman Surveyor Bernard Pooser,<br />
Surveyor, Navigational Officer LTJG Jon Neuhaus, and Seaman<br />
Surveyor Cleo Lewis of the <strong>NOAA</strong> ship Whiting
Meteorological Services—Observations<br />
U.S. Port Meteorological<br />
Officers<br />
Headquarters<br />
David McShane<br />
<strong>Voluntary</strong> <strong>Observing</strong> <strong>Ship</strong> Technical Leader<br />
National Data Buoy Center<br />
Building 1100, Room 353A<br />
Stennis Space Center, MS 39529-6000<br />
Tel: 228-688-1768<br />
Fax: 228-688-3153<br />
E-mail: david.mcshane@noaa.gov<br />
Robert A. Luke<br />
<strong>Voluntary</strong> <strong>Observing</strong> <strong>Ship</strong> <strong>Program</strong> Leader<br />
National Data Buoy Center<br />
Building 1100, Room 353D<br />
Stennis Space Center, MS 39529-6000<br />
Tel: 228-688-1457<br />
Fax: 228-688-3153<br />
E-mail: robert.luke@noaa.gov<br />
Atlantic Ports<br />
Robert Drummond, PMO<br />
National <strong>Weather</strong> Service, <strong>NOAA</strong><br />
2550 Eisenhower Blvd, Suite 312<br />
P.O. Box 165504<br />
Port Everglades, FL 33316<br />
Tel: 954-463-4271<br />
Fax: 954-462-8963<br />
E-mail: robert.drummond@noaa.gov<br />
Lawrence Cain, PMO<br />
National <strong>Weather</strong> Service, <strong>NOAA</strong><br />
13701 Fang Road<br />
Jacksonville, FL 32218-7933<br />
Tel: 904-741-5186<br />
Fax: 904-741-0078<br />
E-mail: larry.cain@noaa.gov<br />
Peter Gibino, PMO, Norfolk<br />
National <strong>Weather</strong> Service, <strong>NOAA</strong><br />
4034-B G. Washington Highway<br />
Yorktown, VA 23692-2724<br />
Tel: 757-877-1692<br />
Fax: 757-877-9561<br />
E-mail: peter.gibino@noaa.gov<br />
James Saunders, PMO<br />
National <strong>Weather</strong> Service, <strong>NOAA</strong><br />
Maritime Center I, Suite 287<br />
2200 Broening Highway<br />
Baltimore, MD 21224-6623<br />
Tel: 410-633-4709<br />
Fax: 410-633-4713<br />
E-mail: james.saunders@noaa.gov<br />
Tim Kenefick, PMO, New York/New Jersey<br />
National <strong>Weather</strong> Service, <strong>NOAA</strong><br />
110 Lower Main Street, Suite 201<br />
South Amboy, NJ 08879-1367<br />
Tel: 732-316-5409<br />
Fax: 732-316-7643<br />
E-mail: timothy.kenefick@noaa.gov<br />
Great Lakes Ports<br />
Amy Seeley, PMO<br />
National <strong>Weather</strong> Service, <strong>NOAA</strong><br />
333 West University Dr.<br />
Romeoville, IL 60446-1804<br />
Tel: 815-834-0600 Ext. 269<br />
Fax: 815-834-0645<br />
E-mail: amy.seeley@noaa.gov<br />
George Smith, PMO<br />
National <strong>Weather</strong> Service, <strong>NOAA</strong><br />
Hopkins International Airport<br />
Cleveland, OH 44135<br />
Tel: 216-265-2374<br />
Fax: 216-265-2371<br />
E-mail: george.e.smith@noaa.gov<br />
Gulf of Mexico Ports<br />
John Warrelmann, PMO<br />
National <strong>Weather</strong> Service, <strong>NOAA</strong><br />
New Orleans International Airport<br />
Box 20026<br />
New Orleans, LA 70141<br />
Tel: 504-589-4839<br />
E-mail: john.warrelmann@noaa.gov<br />
National <strong>Weather</strong> Service, <strong>NOAA</strong><br />
Houston Area <strong>Weather</strong> Office<br />
1620 Gill Road<br />
Dickinson, TX 77539-3409<br />
Tel: 281-534-2640 Ext. 277<br />
Fax: 281-337-3798<br />
Pacific Ports<br />
Derek LeeLoy<br />
Ocean Services <strong>Program</strong> Coordinator<br />
National <strong>Weather</strong> Service Pacific Region<br />
HQ<br />
Grosvenor Center, Mauka Tower<br />
737 Bishop Street, Suite 2200<br />
Honolulu, HI 96813-3201<br />
Tel: 808-532-6439<br />
Fax: 808-532-5569<br />
E-mail: derek.leeloy@noaa.gov<br />
Meteorological Services<br />
Robert Webster, PMO<br />
National <strong>Weather</strong> Service, <strong>NOAA</strong><br />
501 West Ocean Blvd., Room 4480<br />
Long Beach, CA 90802-4213<br />
Tel: 562-980-4090<br />
Fax: 562-980-4089<br />
E-mail: bob.webster@noaa.gov<br />
Robert Novak, PMO<br />
National <strong>Weather</strong> Service, <strong>NOAA</strong><br />
1301 Clay Street, Suite 1190N<br />
Oakland, CA 94612-5217<br />
Tel: 510-637-2960<br />
Fax: 510-637-2961<br />
E-mail: bob.novak@noaa.gov<br />
Patrick Brandow, PMO<br />
National <strong>Weather</strong> Service, <strong>NOAA</strong><br />
7600 Sand Point Way, N.E.<br />
BIN C15700<br />
Seattle, WA 98115-6349<br />
Tel: 206-526-6100<br />
Fax: 206-526-4571 or 6094<br />
E-mail: pat.brandow@noaa.gov<br />
Richard Courtney<br />
National <strong>Weather</strong> Service, <strong>NOAA</strong><br />
600 Sandy Hook Street, Suite 1<br />
Kodiak, AK 99615-6814<br />
Tel: 907-487-2102<br />
Fax: 907-487-9730<br />
E-mail: richard.courtney@noaa.gov<br />
Lynn Chrystal, OIC<br />
National <strong>Weather</strong> Service, <strong>NOAA</strong><br />
Box 427<br />
Valdez, AK 99686-0427<br />
Tel: 907-835-4505<br />
Fax: 907-835-4598<br />
E-mail: lynn.chrystal@noaa.gov<br />
Larry Hubble<br />
National <strong>Weather</strong> Service Alaska Region<br />
222 West 7th Avenue #23<br />
Anchorage, AK 99513-7575<br />
Tel: 907-271-5135<br />
Fax: 907-271-3711<br />
E-mail: larry.hubble@noaa.gov<br />
SEAS Field<br />
Representatives<br />
GOOS Center Manager<br />
Steve Cook<br />
8604 La Jolla Shores Drive<br />
La Jolla, CA 92037-1508<br />
Tel: 858-546-7103<br />
Fax: 619-546-7185<br />
E-mail: steven.cook@noaa.gov<br />
Spring/Summer 2002 85
GOOS Staff<br />
John Steger, LCDR<br />
AOML/GOOS Center<br />
4301 Rickenbacker Causeway<br />
Miami, FL 33149-1026<br />
Tel: 305-361-4356<br />
Fax: 305-361-4366<br />
E-mail: john.steger@noaa.gov<br />
Northeast Atlantic SEAS Rep.<br />
Jim Farrington<br />
SEAS <strong>Log</strong>istics/AMC<br />
439 West York Street<br />
Norfolk, VA 23510<br />
Tel: 757-441-3062<br />
Fax: 757-441-6495<br />
E-mail: james.w.farrington@noaa.gov<br />
Pacific Northwest SEAS Rep.<br />
Bob Decker<br />
SEAS <strong>Log</strong>istics/PMC<br />
7600 Sand Point Way, NE, Bin C15700<br />
Seattle, WA 98115-0700<br />
Tel: 206-526-4280<br />
Fax: 206-526-4281<br />
E-mail: bob.decker@noaa.gov<br />
Southwest Pacific SEAS Rep.<br />
Carrie Wolfe<br />
Southern California Marine Institute<br />
820 S. Seaside Avenue<br />
San Pedro, Ca 90731-7330<br />
Tel: 310-519-3181<br />
Fax: 310-519-1054<br />
E-mail: hbbio048@csun.edu<br />
Southeast Atlantic SEAS Rep.<br />
Ann-Marie Wilburn<br />
AOML/GOSO Center<br />
4301 Rickenbacker Causeway<br />
Miami, FL 33149-1026<br />
Tel: 305-361-4336<br />
Fax: 305-361-4366<br />
E-mail: wilburn@aoml.noaa.gov<br />
Gobal Drifter <strong>Program</strong><br />
Craig Engler<br />
AOML/PHOD<br />
4301 Rickenbacker Causeway<br />
Miami, FL 33149-1026<br />
Tel: 305-361-4439<br />
Fax: 305-361-4366<br />
E-mail: craig.engler@noaa.gov<br />
NIMA Fleet Liaisons<br />
Joe Schruender, East Coast Fleet Liaison<br />
Christopher G. Janus, West Coast Fleet<br />
Liaison<br />
ATTN: GIMM (MS D-44)<br />
4600 Sangamore Road<br />
Bethesda, MD 20816-5003<br />
Tel: 301-227-3120<br />
Fax: 301-227-4211<br />
E-mail: schruendj@nima.mil<br />
janusc@nima.mil<br />
86 <strong>Mariners</strong> <strong>Weather</strong> <strong>Log</strong><br />
U.S. Coast Guard AMVER<br />
Center<br />
Richard T. Kenney<br />
AMVER Maritime Relations Officer<br />
United States Coast Guard<br />
Battery Park Building<br />
New York, NY 10004<br />
Tel: 212-668-7764<br />
Fax: 212-668-7684<br />
E-mail: rkenney@batteryny.uscg.mil<br />
Other Port Meteorological<br />
Officers<br />
Australia<br />
Head Office<br />
Marine Observations Unit<br />
Bureau of Meteorology<br />
150 Lonsdale Street, 7th Floor<br />
Melbourne, VIC 3000<br />
Tel: +613 9669 4651<br />
Fax: +613 9669 4168<br />
E-mail: marine_obs@bom.gov.au<br />
Melbourne<br />
Michael J. Hills, Port Meteorological Agent<br />
Victoria Regional Office<br />
Bureau of Meteorology<br />
150 Lonsdale Street, 26th Floor<br />
Melbourne, VIC 3000<br />
Tel: +613 9669 4982<br />
Fax: +613 9663 4957<br />
E-mail: m.hills@bom.gov.au<br />
Fremantle<br />
Malcolm Young, Port Meteorological Agent<br />
MalMet Services Pty Ltd<br />
Unit 3/76 Gardner Street<br />
COMO WA 6152<br />
Tel: +618 9474 1974<br />
Fax: +618 9260 8475<br />
E-mail: malyoung@iinet.net.au<br />
Sydney<br />
Captain Einion E. (Taffy) Rowlands, PMA<br />
NSW Regional Office<br />
Bureau of Meteorology, Level 15<br />
300 Elizabeth Street<br />
Sydney NSW 2000<br />
Tel:+612 9296 1547<br />
Fax: +612 9296 1648<br />
E-mail: e.rowlands@bom.gov.au<br />
Meteorological Services<br />
Canada<br />
Randy Sheppard, PMO<br />
Meteorological Service of Canada<br />
16th Floor, 45 Aldernay Drive<br />
Dartmouth, Nova Scotia B2Y 2N6<br />
Tel: 902-426-6703<br />
E-mail: randy.sheppard@ec.gc.ca<br />
Jack Cossar, PMO<br />
Meteorological Service of Canada<br />
6 Bruce Street<br />
St. John’s, Newfoundland A1N 4T3<br />
Tel: 709-722-4798<br />
Fax: 709-722-5097<br />
E-mail: jack.cossar@ec.gc.ca<br />
Michael Riley, PMO<br />
Meteorological Service of Canada<br />
700-1200 West 73rd Avenue<br />
Vancouver, British Columbia V6P 6H9<br />
Tel: 604-664-9136<br />
Fax: 604-664-9195<br />
E-mail: mike.riley@ec.gc.ca<br />
Ron Fordyce, Supt. Marine Data Unit<br />
Rick Shukster, PMO<br />
Roland Kleer, PMO<br />
Meteorological Service of Canada<br />
Port Meteorological Office<br />
100 East Port Blvd.<br />
Hamilton, Ontario L8H 7S4<br />
Tel: 905-312-0900<br />
Fax: 905-312-0730<br />
E-mail: ron.fordyce@ec.gc.ca<br />
rick.shukster@ec.gc.ca<br />
roland.kleer@ec.gc.ca<br />
Richard Dupuis, PMO<br />
Meteorological Service of Canada<br />
100 Alexis Nihon Blvd., 3rd Floor<br />
Ville St. Laurent, Quebec H4M 2N8<br />
China<br />
YU Zhaoguo<br />
Shanghai Meteorological Bureau<br />
166 Puxi Road<br />
Shanghai, China<br />
Denmark<br />
Commander Lutz O. R. Niegsch<br />
PMO, Danish Meteorological Inst.<br />
Lyngbyvej 100, DK-2100<br />
Copenhagen, Denmark<br />
Tel: +45 39157500<br />
Fax: +45 39157300
United Kingdom<br />
Headquarters<br />
Capt. E. J. O’Sullivan<br />
Marine Observations Manager, Met. Office<br />
Observations Supply - Marine Networks<br />
Beaufort Park<br />
Easthampstead, Wokingham<br />
Berkshire RG40 3DN<br />
Tel: +44-1344 85-5723<br />
Fax: +44-1344 85-5873<br />
Email: edward.osullivan@metoffice.com<br />
Bristol Channel<br />
Captain A Maytham MM, FRMetS, PGCE<br />
Met Office<br />
Port Met Officer - Bristol Channel<br />
Titan House Rm 107<br />
Cardiff Bay Business Centre<br />
Lewis Road<br />
Cardiff. CF24 5BS<br />
Tel: +44 (0) 29 2045 1323<br />
Fax:+44 (0) 29 2045 1326<br />
E-mail: austin.maytham@metoffice.com<br />
East England<br />
Captain John Steel, PMO<br />
Customs Building, Albert Dock<br />
Hull HU1 2DP<br />
Tel: +44 01482 320158<br />
Fax: +44 01482 328957<br />
Northeast England<br />
Captain Gordon Young, PMO<br />
Able House, Billingham Reach Ind. Estate<br />
Billingham, Cleveland TS23 lPX<br />
Tel: +44 0642 560993<br />
Fax:+44 0642 562170<br />
Northwest England<br />
Colin B. Attfield, PMO<br />
Room 331, Royal Liver Building<br />
Liverpool L3 1JH<br />
Tel:+44 0151 236 6565<br />
Fax: +44 0151 227 4762<br />
Scotland and Northern Ireland<br />
Captain Peter J. Barratt, PMO<br />
Navy Buildings, Eldon Street<br />
Greenock, Strathclyde PA16 7SL<br />
Tel: +44 01475 724700<br />
Fax: +44 01475 892879<br />
Southeast England<br />
Captain Harry H. Gale, PMO<br />
Trident House, 21 Berth, Tilbury Dock<br />
Tilbury, Essex RM18 7HL<br />
Tel: +44 01385 859970<br />
Fax: +44 01375 859972<br />
Southwest England<br />
Captain James M. Roe, PMO<br />
8 Viceroy House, Mountbatten Business<br />
Centre<br />
Millbrook Road East<br />
Southampton SO15 lHY<br />
Tel: +44 023 8022 0632<br />
Fax: +44 023 8033 7341<br />
France<br />
Yann Prigent, PMO<br />
Station Mét., Noveau Semaphore<br />
Quai des Abeilles, Le Havre<br />
Tel: +33 35422106<br />
Fax: +33 35413119<br />
P. Coulon<br />
Station Météorologique<br />
de Marseille-Port<br />
12 rue Sainte Cassien<br />
13002 Marseille<br />
Tel: +33 91914651 Ext. 336<br />
Germany<br />
Volker Weidner, PMO<br />
Deutscher Wetterdienst<br />
Met. Hafendienst<br />
Postfach 70 04 21<br />
22004 Hamburg<br />
Tel: 040 3190 8826<br />
Volker Weidner, PMO<br />
Peter Gollnow, PMO<br />
Horst von Bargen, PMO<br />
Deutscher Wetterdienst<br />
Jenfelder Allee 70a<br />
22043 Hamburg<br />
Tel: +49 40 66901411<br />
Fax: +49 40 66901496<br />
E-mail: pmo@dwd.de<br />
Henning Hesse, PMO<br />
Deutscher Wetterdienst<br />
An de Neuen Schleuse<br />
27570 Bremerhaven<br />
Tel: +49 471 7004018<br />
Fax: +49 471 7004017<br />
E-mail: pmo@dwd.de<br />
Ulrich Ranke, PMO<br />
Deutscher Wetterdienst<br />
Flughafendamm 45<br />
28199 Bremen<br />
Tel: +49 421 5372163<br />
Fax: +49 421 5372166<br />
E-mail: pmo@dwd.de<br />
Christel Heidner, OMP<br />
Christine Bergs, PMO<br />
Deutscher Wetterdienst<br />
Seestr. 15a<br />
18119 Rostock<br />
Tel: +49 381 5438830<br />
Fax: +49 381 5438863<br />
E-mail: pmo@dwd.de<br />
Meteorological Services<br />
Greece<br />
George E. Kassimidis, PMO<br />
Port Office, Piraeus<br />
Tel: +301 921116<br />
Fax: +3019628952<br />
Hong Kong<br />
C. F. Wong, PMO<br />
Hong Kong Observatory<br />
134A Nathan Road<br />
Kowloon, Hong Kong<br />
Tel: +852 2926 3113<br />
Fax: +852 2311 9448<br />
E-mail: hkopmo@hko.gcn.gov.hk<br />
Israel<br />
Hani Arbel, PMO<br />
Haifa Port<br />
Tel: 972 4 8664427<br />
Aharon Ofir, PMO<br />
Marine Department<br />
Ashdod Port<br />
Tel: 972 8 8524956<br />
Japan<br />
Headquarters<br />
Kanno Yoshiaki<br />
Marine Div., Climate and Marine Dept.<br />
Japan Meteorological Agency<br />
1-3-4 Otemachi, Chiyoda-ku<br />
Tokyo, 100-8122 Japan<br />
Fax: +03-3211-6908<br />
Email: ykanno@met.kishou.go.jp<br />
Utsunomiya Tadayoshi, PMO<br />
Kobe Marine Observatory<br />
1-4-3, Wakinohamakaigan-Dori, Chuo-ku<br />
Kobe, 651-0073 Japan<br />
Fax: +078-222-8946<br />
Yazawa Yasushi, PMO<br />
Nagoya Local Meteorological Observatory<br />
2-18, Hiyoricho, Chigusa-ku<br />
Nagoya, 464-0039 Japan<br />
Fax: +052-762-1242<br />
Uwabe Willy, PMO<br />
Yokohama Local Met. Observatory<br />
99 Yamate-cho, Naka-ku<br />
Yokohama, 231-0862 Japan<br />
Fax: +045-622-3520<br />
Kenya<br />
Ali J. Mafimbo, PMO<br />
PO Box 98512<br />
Mombasa, Kenya<br />
Tel: +254 1125685<br />
Fax: +254 11433440<br />
Spring/Summer 2002 87
Malaysia<br />
NG Kim Lai<br />
Assistant Meteorological Officer<br />
Malaysian Meteorological Service<br />
Jalan Sultan, 46667 Petaling<br />
Selangor, Malaysia<br />
Mauritius<br />
Mr. S Ragoonaden<br />
Meteorological Services<br />
St. Paul Road, Vacoas, Mauritius<br />
Tel: +230 6861031<br />
Fax: +230 6861033<br />
Netherlands<br />
Jan Schaap, PMO<br />
KNMI, Afd. WM/OW<br />
Port Meteorological Office<br />
Postbus 201<br />
3730 AE De Bilt, Netherlands<br />
Tel: +3130-2206391<br />
Fax: +3130-2210849<br />
E-mail: jan.schaap@knmi.nl<br />
New Zealand<br />
Julie Fletcher, MMO<br />
MetService New Zealand Ltd.<br />
P.O. Box 722<br />
Wellington, New Zealand<br />
Tel: +644 4700789<br />
Fax: +644 4700772<br />
88 <strong>Mariners</strong> <strong>Weather</strong> <strong>Log</strong><br />
Norway<br />
Tor Inge Mathiesen, PMO<br />
Norwegian Meteorological Institute<br />
Allegaten 70, N-5007<br />
Bergen, Norway<br />
Tel: +475 55236600<br />
Fax: +475 55236703<br />
Poland<br />
Jozef Kowalewski,PMO<br />
Institute of Meteorology and Water Mgt.<br />
Maritime Branch<br />
ul.Waszyngtona 42, 81-342 Gdynia Poland<br />
Tel: +4858 6205221<br />
Fax: +4858 6207101<br />
E-mail: kowalews@stratus/imgw.gdynia.pl<br />
Saudi Arabia<br />
Mahmud Rajkhan, PMO<br />
National Met. Environment Centre<br />
Eddah<br />
Tel:+ 9662 6834444 Ext. 325<br />
Singapore<br />
Edmund Lee Mun San, PMO<br />
Meteorological Service, PO Box 8<br />
Singapore Changi Airport<br />
Singapore 9181<br />
Tel: +65 5457198<br />
Fax: +65 5457192<br />
Meteorological Services<br />
South Africa<br />
C. Sydney Marais, PMO<br />
c/o <strong>Weather</strong> Office<br />
Capt Town International Airport 7525<br />
Tel: + 2721-934-0450 Ext. 213<br />
Fax: +2721-934-3296<br />
Gus McKay, PMO<br />
Meteorological Office<br />
Durban International Airpot 4029<br />
Tel: +2731-422960<br />
Fax: +2731-426830<br />
Mnikeli Ndabambi<br />
Assistant Director, Meteorological Training<br />
South African <strong>Weather</strong> Bureau<br />
Tel: +2712-309-3090<br />
Fax: +2712-323-4518<br />
E-mail: mnikeli@weathersa.co.za<br />
Sweden<br />
Morgan Zinderland<br />
SMHI<br />
S-601 76 Norrköping, Sweden<br />
Tel: 516-924-0499 (0227)
U.S. DEPARTMENT OF COMMERCE<br />
National Oceanic and Atmospheric Administration<br />
National Data Buoy Center<br />
Building 1100, Room 353D<br />
Stennis Space Center, MS 39529-6000<br />
Attn: <strong>Mariners</strong> <strong>Weather</strong> <strong>Log</strong><br />
Address Correction Requested Special<br />
OFFICIAL BUSINESS Standard Rate<br />
PENALTY FOR PRIVATE USE $300<br />
In this Issue:<br />
Edmund Fitzgerald Remembered ............................................................ 4<br />
The Beatrice Hurricane ........................................................................... 12<br />
Seventeenth Century Seafarer, William Dampier.................................... 16<br />
VOS Climate Project ................................................................................ 24<br />
New Great Lakes <strong>Weather</strong> Station .......................................................... 79