Mariners Weather Log - Voluntary Observing Ship Program - NOAA
Mariners Weather Log - Voluntary Observing Ship Program - NOAA
Mariners Weather Log - Voluntary Observing Ship Program - NOAA

You also want an ePaper? Increase the reach of your titles
YUMPU automatically turns print PDFs into web optimized ePapers that Google loves.
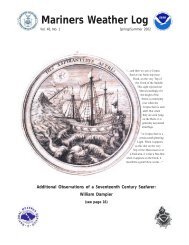
<strong>Mariners</strong> <strong>Weather</strong> <strong>Log</strong><br />
Vol. 42, No. 3 December 1998<br />
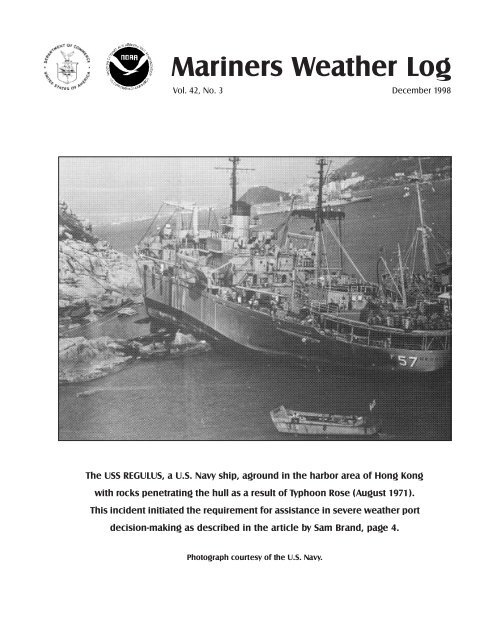
The USS REGULUS, a U.S. Navy ship, aground in the harbor area of Hong Kong<br />
with rocks penetrating the hull as a result of Typhoon Rose (August 1971).<br />
This incident initiated the requirement for assistance in severe weather port<br />
decision-making as described in the article by Sam Brand, page 4.<br />
Photograph courtesy of the U.S. Navy.
2 <strong>Mariners</strong> <strong>Weather</strong> <strong>Log</strong><br />
<strong>Mariners</strong> <strong>Weather</strong> <strong>Log</strong><br />
U.S. Department of Commerce<br />
William M. Daley, Secretary<br />
National Oceanic and<br />
Atmospheric Administration<br />
Dr. D. James Baker, Administrator<br />
National <strong>Weather</strong> Service<br />
John J. Kelly, Jr.,<br />
Assistant Administrator for <strong>Weather</strong> Services<br />
National Environmental Satellite,<br />
Data, and Information Service<br />
Robert S. Winokur,<br />
Assistant Administrator<br />
United States Navy<br />
Naval Meteorology and Oceanography Command<br />
RADM Kenneth E. Barbor USN, Commander<br />
Editorial Supervisor<br />
Martin S. Baron<br />
Editor<br />
Mary Ann Burke<br />
The Secretary of Commerce has determined that the publication of this<br />
periodical is necessary in the transaction of the public business required by law<br />
of this department. Use of funds for printing this periodical has been approved<br />
by the director of the Office of Management and Budget through December<br />
1999.<br />
The <strong>Mariners</strong> <strong>Weather</strong> <strong>Log</strong> (ISSN: 0025-3367) is published by the National<br />
<strong>Weather</strong> Service, Office of Meteorology, Integrated Hydrometeorological<br />
Services Core, Silver Spring, Maryland, (301) 713-1677, Ext. 134. Funding is<br />
provided by the National <strong>Weather</strong> Service, National Environmental Satellite,<br />
Data, and Information Service, and the United States Navy. Data is provided by<br />
the National Climatic Data Center.<br />
Articles, photographs, and letters should be sent to:<br />
Mr. Martin S. Baron, Editorial Supervisor<br />
<strong>Mariners</strong> <strong>Weather</strong> <strong>Log</strong><br />
National <strong>Weather</strong> Service, <strong>NOAA</strong><br />
1325 East-West Highway, Room 14108<br />
Silver Spring, MD 20910<br />
Phone: (301) 713-1677 Ext. 134<br />
Fax: (301) 713-1598<br />
E-mail: martin.baron@noaa.gov<br />
<strong>Mariners</strong> <strong>Weather</strong> <strong>Log</strong><br />
From the Editorial Supervisor<br />
The <strong>Mariners</strong> <strong>Weather</strong> <strong>Log</strong> is now available on the World Wide<br />
Web. Beginning with the August 1998 issue, you can find the <strong>Log</strong><br />
at http://www.nws.noaa.gov/om/mwl/mwl.htm. You will need the<br />
Adobe Acrobat Reader (available from the web site) to view the<br />
magazine.<br />
We are privileged to have another article on the Automated Mutualassistance<br />
Vessel Rescue (AMVER) program, with several dramatic<br />
accounts of rescues at sea. In one notable incident, a fishing vessel,<br />
the SEA LION, adrift without engine power in the North Pacific<br />
during August 1998, began taking on water. In heavy seas, all ten<br />
crew members abandoned ship into a lifeboat. U.S. Coast Guard<br />
rescue coordinators located the AMVER vessel SOLAR WING a<br />
few miles away, and a boat-to-boat transfer was soon completed<br />
without loss of life.<br />
We encourage all mariners to participate in the AMVER program.<br />
Now in its 40th year, AMVER has 12,000 participating ships from<br />
143 nations. Over the last five years alone, AMVER has rescued<br />
over 1,500 people, most of whom would have perished were it not<br />
for this extraordinary program. It’s very easy to join AMVER.<br />
Simply complete an SAR Questionnaire (SAR-Q), available by fax<br />
from the AMVER Maritime Relations Office. You then provide<br />
AMVER with your sail plan before leaving port and update your<br />
position once every 48 hours while underway. Should you require<br />
assistance at sea, alert the nearest rescue coordination center in one<br />
of several ways, including INMARSAT, Radiotelex, EPIRB, or the<br />
distress button on your satellite or DSC terminal.<br />
For <strong>Voluntary</strong> <strong>Observing</strong> <strong>Ship</strong>s, the special AMVER/SEAS<br />
software is now available to simplify preparation of weather and<br />
AMVER messages. When COMSAT receives weather messages<br />
formatted by this software, your vessel call sign and position is<br />
forwarded to the AMVER center (eliminating the need to send a<br />
separate AMVER position update), while the weather message goes<br />
to the National <strong>Weather</strong> Service. There is no cost to vessels using<br />
AMVER/SEAS software.<br />
A Y2K compliant version of the AMVER/SEAS software is now<br />
available (AMVER/SEAS version 4.51), and vessels are encouraged<br />
to obtain free copies. You can download this software from the<br />
web at http://seas.nos.noaa.gov/seas.html.<br />
For more information about AMVER, contact Mr. Rick Kenney,<br />
U.S. Coast Guard Maritime Relations Officer. For more information<br />
about the AMVER/SEAS software, contact Mr. Steve Cook, SEAS<br />
<strong>Program</strong> Manager. Both are listed in the back of this publication.<br />
Port Meteorological Officers and SEAS Field Representatives can<br />
also provide information about these valuable programs.<br />
By the time this issue is in print, <strong>Mariners</strong> <strong>Weather</strong> <strong>Log</strong> readers<br />
with complimentary subscriptions will have received questionnaires<br />
through the mail. This is to update our mailing list. Please fill out<br />
and return the questionnaire promptly, no later than May 30, 1999.<br />
Martin S. Baronh
Table of Contents<br />
<strong>Mariners</strong> <strong>Weather</strong> <strong>Log</strong><br />
Severe <strong>Weather</strong> Port Evaluation Effort at the Naval Research Laboratory .......................................... 4<br />
Great Lake <strong>Ship</strong>wrecks—The Sinking of The Argus ................................................................... 11<br />
The National Hurricane Center <strong>Weather</strong>s the Storm ......................................................................... 12<br />
AMVER <strong>Program</strong>—Rescues Up and Down the Pacific Ocean Demonstrate<br />
the Value of AMVER Participation ............................................................................................ 18<br />
Departments:<br />
Physical Oceanography ..................................................................................................................................... 21<br />
Fam Float—S/S ARCO FAIRBANKS .............................................................................................................. 28<br />
National Data Buoy Center................................................................................................................................ 30<br />
Marine <strong>Weather</strong> Review<br />
North Atlantic, April–July 1998 .......................................................................................................... 32<br />
North Pacific, April–July 1998............................................................................................................ 36<br />
Tropical Atlantic and Tropical East Pacific, May–August 1998 ......................................................... 43<br />
Climate Prediction Center, May–August 1998 .................................................................................... 50<br />
VOS <strong>Program</strong> .................................................................................................................................................... 52<br />
VOS Cooperative <strong>Ship</strong> Reports ......................................................................................................................... 69<br />
Buoy Climatological Data Summary ................................................................................................................. 85<br />
Meteorological Services<br />
Observations ......................................................................................................................................... 94<br />
Forecasts ............................................................................................................................................... 97<br />
December 1998 3
Severe <strong>Weather</strong> Port Evaluation Effort<br />
at the Naval Research Laboratory<br />
Sam Brand<br />
Naval Research Laboratory<br />
7 Grace Hopper Avenue<br />
Monterey, CA 93943<br />
E-mail: brand@nrlmry.navy.mil<br />
Abstract<br />
The U.S. Navy operates throughout<br />
the world and many of the<br />
U.S. Navy ships are in port at any<br />
instant in time. Environmental<br />
phenomena such as strong winds,<br />
high waves, storm surge, restrictions<br />
to visibility, and thunderstorms<br />
can be hazardous to these<br />
ships while in these ports, or<br />
maneuvering in or out of port.<br />
Because the U.S. Navy recognized<br />
this as a serious concern to Navy<br />
ship captains, the Marine Meteorology<br />
Division of the Naval<br />
Research Laboratory, Monterey,<br />
California, was asked to evaluate<br />
the severe weather suitability of<br />
numerous ports and document the<br />
results. The resulting analyses<br />
provide decision-making guidance<br />
for ship captains as well as<br />
environmental information for<br />
operational forecasters. Well over<br />
a hundred port evaluations have<br />
been completed and disseminated.<br />
4 <strong>Mariners</strong> <strong>Weather</strong> <strong>Log</strong><br />
This article will describe the<br />
development strategy for these<br />
port studies, provide insight into<br />
the details of the presentation of<br />
the information, and discuss the<br />
future direction and enhancements.<br />
1. Introduction<br />
U.S. Navy ship captains operating<br />
throughout the globe often find<br />
themselves in new port locations,<br />
with experience providing the<br />
cornerstone of operational safety,<br />
whether in peacetime or in time of<br />
conflict. Severe weather decision<br />
making can be extremely challenging<br />
for these ship captains. For<br />
example, when faced with an<br />
approaching tropical cyclone, a<br />
timely decision regarding the<br />
necessity and method of evasion<br />
must be reached. In complex<br />
regions such as the Mediterranean,<br />
the wind systems that are produced<br />
challenge the most skilled<br />
Naval Research Laboratory<br />
ship captains. A number of “local”<br />
wind events, including the Mistral,<br />
Bora, Levante, etc., are characterized<br />
by rapid onset and cessation<br />
and greatly varying spatial variations.<br />
These winds can cause an<br />
unprepared ship captain to drag<br />
anchor or part mooring lines.<br />
For over 20 years, the Naval<br />
Research Laboratory Marine<br />
Meteorology Division (formerly<br />
Naval Environmental Prediction<br />
Research Facility and Naval<br />
Oceanographic and Atmospheric<br />
Research Laboratory) has been<br />
developing severe weather port<br />
guidance for the U.S. Navy. The<br />
guidance research efforts can be<br />
categorized as follows:<br />
1) Tropical Cyclone Haven<br />
Studies<br />
2) Mediterranean Severe<br />
<strong>Weather</strong> Port Studies<br />
Continued on Page 5
Port Evaluation<br />
Continued from Page 4<br />
3) Regional Severe <strong>Weather</strong><br />
Guide Development<br />
The purpose of this article is to<br />
describe the development strategy<br />
for each of the above categories,<br />
provide insight into the details of<br />
the presentation of the information<br />
in hard copy and electronic form,<br />
and discuss future enhancements<br />
and requirements.<br />
2. Tropical Cyclone Haven<br />
Studies<br />
Tropical cyclones are among the<br />
most destructive weather phenomena<br />
a ship captain may encounter,<br />
whether the ship be in port or at<br />
sea. The dilemma to the ship<br />
captain is as follows: Should the<br />
ship remain in port, evade at sea,<br />
or if at sea, should the ship seek<br />
the shelter of a nearby port? In<br />
general, it is an oversimplification<br />
to label a harbor as merely good or<br />
bad. Consequently, enough<br />
information has to be conveyed<br />
for the ship commanding officer to<br />
reach a sound decision. The<br />
decision often is not based on<br />
weather conditions alone because<br />
the characteristics of the harbor<br />
and the ship itself must also be<br />
considered (Brand, 1978).<br />
The Naval Research Laboratory<br />
(NRL) Marine Meteorology<br />
Division has developed tropical<br />
cyclone “havens” handbooks for<br />
the western Pacific/Indian Ocean<br />
region (Brand, 1996) and the<br />
Atlantic Ocean region (Turpin and<br />
Brand, 1982; Perryman et al,<br />
1993). Figures 1 and 2 provide<br />
locator maps for the two regions<br />
and identify ports evaluated. The<br />
port evaluations themselves were<br />
based on extensive data collection<br />
efforts and discussions with local<br />
port and meteorological officials.<br />
The format for each of the port<br />
studies included the following:<br />
1) A brief description of the port<br />
location and surrounding<br />
topography.<br />
2) A brief description of the<br />
harbor and facilities.<br />
3) Tropical cyclone climatological<br />
information for the port.<br />
4) Effects of storm surge and<br />
wave action within the harbor.<br />
5) Effects of topography on<br />
tropical cyclone winds and<br />
seas.<br />
6) Evasion rationale, including<br />
discussion of pertinent factors<br />
to consider in making a<br />
decision to remain in port or<br />
try to evade a tropical cyclone<br />
at sea.<br />
7) General conclusions concerning<br />
the harbor as a tropical<br />
cyclone haven.<br />
As the typhoon and hurricane<br />
haven studies were completed,<br />
they were distributed to all U.S.<br />
Navy ships and shore locations in<br />
the Pacific and Atlantic areas.<br />
3. Mediterranean Severe<br />
<strong>Weather</strong> Port Studies<br />
The complex land and sea distributions<br />
in and around the Mediterranean<br />
have a strong influence on<br />
the synoptic and mesoscale<br />
weather affecting many port and<br />
harbor areas. In addition, because<br />
Naval Research Laboratory<br />
of the irregular coastline and<br />
numerous islands in the Mediterranean,<br />
swell can be refracted<br />
around barriers and come from<br />
directions which vary greatly from<br />
those of the wind and wind waves.<br />
Anchored ships may experience<br />
winds and seas from one direction<br />
and swell from a different direction.<br />
This can be extremely<br />
hazardous for close maneuvering,<br />
tending of vessels, refueling, and<br />
small boating operations.<br />
During the past decade, the U.S.<br />
Navy identified 55 ports of interest<br />
in the Mediterranean region to be<br />
evaluated with respect to severe<br />
weather suitability. The following<br />
approach was used to develop the<br />
individual studies:<br />
1) A literature search for reference<br />
material was performed.<br />
2) Navy cruise reports were<br />
reviewed, if available.<br />
3) Navy personnel with current<br />
or previous area experience<br />
were interviewed.<br />
4) A preliminary report, which<br />
included questions on various<br />
local conditions, was developed.<br />
5) Port visits were made by U.S.<br />
Navy and/or their representatives<br />
who gathered information<br />
through interviews with local<br />
harbor pilots, harbor masters,<br />
tug masters, meteorologists,<br />
etc. Local reference material<br />
was also obtained.<br />
6) The cumulative information<br />
was reviewed, combined, and<br />
condensed for each port study.<br />
Continued on Page 8<br />
December 1998 5
6 <strong>Mariners</strong> <strong>Weather</strong> <strong>Log</strong><br />
Naval Research Laboratory<br />
Figure 1. Locator map for the 40 ports evaluated for the typhoon haven<br />
studies for the western Pacific/ Indian Ocean regions.<br />
METEOSAT-6 infrared satellite<br />
image of early April 1998 storm<br />
which affected the eastern North<br />
Atlantic. Note the layered frontal<br />
cloud band with high (cold) tops<br />
wrapping around the south and<br />
southeast sides of the center and<br />
cumulus-type clouds streaming into<br />
the “dry slot” farther to the south.<br />
The storm was near maximum<br />
intensity and centered near 39N<br />
19W with 958 mb central pressure<br />
at the time of the image (1200 UTC<br />
02 April 1998).
Naval Research Laboratory<br />
Figure 2. Locator map for the 29 ports evaluated for the hurricane<br />
haven studies for the North Atlantic Ocean.<br />
Figure 3. Mediterranean ports evaluated for the severe weather guide series. Port numbers are those listed in<br />
Table 1.<br />
December 1998 7
Port Evaluation<br />
Continued from Page 5<br />
Hard copy port studies were<br />
produced (U.S. Navy, 1988-1995)<br />
containing two port-specific<br />
information sections (preceded by<br />
a brief introduction offering<br />
general guidance). The first<br />
section summarized harbor conditions<br />
and was intended for use as<br />
a quick reference guide by ship<br />
captains, navigators, harbor<br />
officials, or other in-port or at-sea<br />
personnel. This section contained<br />
the following:<br />
1) A brief narrative summary of<br />
severe weather hazards.<br />
2) A table display of vessel<br />
location/situations, potential<br />
No. Port<br />
1 GAETA, ITALY<br />
2 NAPLES, ITALY<br />
3 CATANIA, ITALY<br />
4 AUGUSTA BAY, ITALY<br />
5 CAGLIARI, ITALY<br />
6 LA MADDALENA, ITALY<br />
7 MARSEILLE, FRANCE<br />
8 TOULON, FRANCE<br />
9 VILLEFRANCHE, FRANCE<br />
10 MALAGA, SPAIN<br />
11 NICE, FRANCE<br />
12 CANNES, FRANCE<br />
13 MONACO<br />
14 ASHDOD, ISRAEL<br />
15 HAIFA, ISRAEL<br />
16 BARCELONA, SPAIN<br />
17 PALMA, SPAIN<br />
18 IBIZA, SPAIN<br />
19 POLLENSA BAY, SPAIN<br />
20 LIVORNO, ITALY<br />
21 LA SPEZIA, ITALY<br />
22 VENICE, ITALY<br />
23 TRIESTE, ITALY<br />
24 CARTAGENA, SPAIN<br />
25 VALENCIA, SPAIN<br />
26 SAN REMO, ITALY<br />
27 GENOA, ITALY<br />
28 PORTO TORRES, ITALY<br />
8 <strong>Mariners</strong> <strong>Weather</strong> <strong>Log</strong><br />
severe weather hazards,<br />
advance indicators of the<br />
hazards, and effects of<br />
hazards and precautionary/<br />
evasion actions.<br />
3) Local wind and wave conditions.<br />
4) Tables depicting wave conditions<br />
at selected harbor<br />
locations resulting from<br />
propagation of deep-water<br />
swell into the harbor.<br />
The second section of the port<br />
study contained additional details<br />
and background information on<br />
hazardous conditions as a function<br />
of season. This section was<br />
designed to serve personnel who<br />
had a need for additional insights<br />
No. Port<br />
29 PALERMO, ITALY<br />
30 MESSINA, ITALY<br />
31 TAORMINA, ITALY<br />
32 TARANTO, ITALY<br />
33 TANGIER, MOROCCO<br />
34 BENIDORM, SPAIN<br />
35 ROTA, SPAIN<br />
36 LIMASSOL, CYPRUS<br />
37 LARNACA, CYPRUS<br />
38 ALEXANDRIA, EGYPT<br />
39 PORT SAID, EGYPT<br />
40 BIZERTE, TUNISIA<br />
41 TUNIS, TUNISIA<br />
42 SOUSSE, TUNISIA<br />
43 SFAX, TUNISIA<br />
44 SOUDA BAY (CRETE), GREECE<br />
45 PIRAEUS, GREECE<br />
46 KALAMATA, GREECE<br />
47 KERKIRA (CORFU), GREECE<br />
48 KITHIRA, GREECE<br />
49 THESSALONIKI, GREECE<br />
50 VALLETTA, MALTA<br />
51 ISTANBUL, TURKEY<br />
52 IZMIR, TURKEY<br />
53 MERSIN, TURKEY<br />
54 ISKENDERUN, TURKEY<br />
55 ANTALYA, TURKEY<br />
Table 1. Mediterranean ports evaluated by study number and port name.<br />
Naval Research Laboratory<br />
on severe weather hazards and<br />
related weather events, and was<br />
intended more for use by operational<br />
weather forecasters.<br />
The 55 port evaluations were<br />
developed during the eight-year<br />
period 1988-1995. As they were<br />
completed, they were distributed<br />
to all U.S. Navy ships and shore<br />
locations in the Atlantic and<br />
Mediterranean regions in hard<br />
copy form. Because of interest in<br />
a compilation of the port studies<br />
as a ready-reference guide, the<br />
evaluations were condensed and<br />
disseminated as one handbook<br />
(Brand, 1997). In addition, to<br />
satisfy the demand for presentations<br />
via electronic media, the 55<br />
port studies were also disseminated<br />
in CD-ROM form as well<br />
(U.S. Navy, 1995).<br />
4. Regional Severe <strong>Weather</strong><br />
Guide Development<br />
A good example of a regional<br />
severe weather guide is the Puget<br />
Sound area port guide (Gilmore et<br />
al., 1996). The guide was developed<br />
in response to a Navy<br />
request to evaluate the severe<br />
weather in a region where there<br />
were many Navy assets concentrated<br />
in one general location. Its<br />
prime purpose was to aid ship<br />
captains and other Navy officials<br />
in evaluating adverse weather<br />
situations and assist them in<br />
making decisions whether to move<br />
to a better anchorage, move to<br />
another port in the Puget Sound<br />
area, or to remain in a specific<br />
harbor.<br />
Continued on Page 9
Port Evaluation<br />
Continued from Page 8<br />
Puget Sound is located in an area<br />
of complex topography. Strong<br />
southerly winds are common over<br />
Puget Sound during late autumn,<br />
winter and early spring. The most<br />
severe weather conditions are<br />
associated with fronts and low<br />
pressure systems approaching<br />
from the Pacific. The effects of<br />
strong winds across the Puget<br />
Sound region varies greatly from<br />
one location to another. Wind<br />
conditions that may adversely<br />
affect one area of the Sound may<br />
have little or no effect on another.<br />
Many of the sites evaluated in the<br />
guide are located adjacent to<br />
significant topographic features<br />
that either shield the port area<br />
from strong winds or enhance the<br />
wind flow at that location. Figure<br />
4 shows the locations in Puget<br />
Sound of interest to the U.S. Navy<br />
that were evaluated in the severe<br />
weather guide.<br />
The guide presented the following<br />
information for each of the port<br />
locations shown in Figure 4:<br />
1) A brief description of port<br />
location and surrounding<br />
topography.<br />
2) A brief description of the<br />
harbor and facilities.<br />
Figure 4. Locations in Puget Sound area (black dots)<br />
evaluated in severe weather guide.<br />
Naval Research Laboratory<br />
3) A description of normal and<br />
extreme weather conditions at<br />
the port.<br />
4) A description of indicators of<br />
hazardous weather conditions.<br />
5) A description of protective/<br />
mitigating measures that can<br />
be taken.<br />
In addition to the above, the guide<br />
provided a description of general<br />
environmental conditions in the<br />
Puget Sound area, a discussion of<br />
the weather patterns by season, a<br />
presentation of extreme weather<br />
events, and a section describing<br />
sources of weather forecasts and<br />
warnings.<br />
Continued on Page 10<br />
December 1998 9
Port Evaluation<br />
Continued from Page 9<br />
5. Future Direction<br />
Navy decision makers ashore and<br />
afloat are requesting that all of the<br />
documents discussed above be<br />
placed into electronic format. The<br />
electronic implementation could<br />
be flexible and allow for both Web<br />
and CD-ROM customer demand.<br />
Another future enhancement could<br />
be the capability to provide ship<br />
captains a simulated entry or exit<br />
view, in animated form, of the<br />
harbor region under a wide variety<br />
of conditions, such as day versus<br />
night, restricted visibility, etc.<br />
This would be extremely useful as<br />
a training tool for ship captains<br />
not familiar with local reference<br />
points or hazards. The CD-ROM<br />
is an ideal vehicle for this kind of<br />
simulated training or rehearsal,<br />
particularly for U.S. Navy ship<br />
captains who continuously find<br />
themselves in unfamiliar port<br />
situations.<br />
Requests for documents discussed<br />
in this article should be made in<br />
letter form to Naval Research<br />
Laboratory, Attn: Sam Brand, 7<br />
Grace Hopper Avenue, Monterey,<br />
CA 93943-5502. For electronic<br />
examples of the Typhoon Havens<br />
Handbook and Hurricane Havens<br />
Handbook, refer to http://www.<br />
cnmoc.navy.mil.<br />
The requirement for new or<br />
updates of port evaluations is<br />
continuous and will ensure severe<br />
weather port studies for many<br />
years to come. For example, the<br />
Navy recently requested 147 ports<br />
be evaluated in the European<br />
10 <strong>Mariners</strong> <strong>Weather</strong> <strong>Log</strong><br />
region. Many will be updates of<br />
previous studies, but most were<br />
new due to the ever-changing<br />
political scene in the European<br />
area. Navy ships are visiting many<br />
eastern European countries that<br />
they never thought they would be<br />
visiting a few years ago. In these<br />
new locations, the vulnerability to<br />
severe weather is still very real<br />
and significant.<br />
Acknowledgments<br />
Funding for this effort has been<br />
provided by the Commander,<br />
Naval Meteorology and Oceanography<br />
Command. Numerous U.S.<br />
Navy and contractor personnel<br />
have been involved in port visits<br />
and data gathering for the past two<br />
decades. In addition, the author<br />
would like to thank the hundreds of<br />
port, harbor, and meteorological<br />
officials who contributed input,<br />
comments, and suggestions to the<br />
studies.<br />
References<br />
Brand, S., 1978: Typhoon havens<br />
research program at the Naval<br />
Environmental Prediction Research<br />
Facility. Bull. Amer.<br />
Meteor. Soc., 59, 374-383.<br />
Brand, S. (Editor), 1997: Mediterranean<br />
Ports Severe <strong>Weather</strong><br />
Handbook. NRL/PU/7543—97-<br />
0030, 766 pp. [Available from<br />
Naval Research Laboratory, 7<br />
Grace Hopper Avenue, Monterey,<br />
CA 93943.]<br />
Gilmore, R.E., R.E. Englebretson,<br />
R.G. Handlers and S. Brand, 1996:<br />
Puget Sound Area Heavy <strong>Weather</strong><br />
Port Guide. NRL/PU/7543—96-<br />
Marine Prediction Center<br />
0028, 126 pp. [Available from the<br />
Naval Research Laboratory, 7<br />
Grace Hopper Avenue, Monterey,<br />
CA 93943.]<br />
Brand, S. (Editor), 1996: Typhoon<br />
havens handbook for the western<br />
Pacific and Indian Oceans, reprint<br />
96. NRL/PU/7543—96-0025, 808<br />
pp. [Available from Naval Research<br />
Laboratory, 7 Grace<br />
Hopper Avenue, Monterey, CA<br />
93943.]<br />
Perryman, D.C., R.E. Gilmore and<br />
R.E. Englebretson, 1993: Naval<br />
stations Mobile, Pascagoula, and<br />
Ingleside as hurricane havens.<br />
NRL/PU/7541—93-0009, 108 pp.<br />
[Available from Naval Research<br />
Laboratory, 7 Grace Hopper<br />
Avenue, Monterey, CA 93943.]<br />
Turpin, R., and S. Brand, 1982:<br />
Hurricane havens handbook for<br />
the North Atlantic Ocean. NEPRF<br />
Technical Report 82-03, 614 pp.<br />
[Available from the Naval Research<br />
Laboratory, 7 Grace<br />
Hopper Avenue, Monterey, CA<br />
93943.]<br />
U.S. Navy, 1988-95: Severe<br />
weather guide Mediterranean<br />
ports, Nos. 1 - 55. [Available from<br />
Naval Research Laboratory, 7<br />
Grace Hopper Avenue, Monterey,<br />
CA 93943.]<br />
U.S. Navy, 1995: Marine climatic<br />
atlas of the world including Mediterranean<br />
severe weather port<br />
guides, CD-ROM. [Available from<br />
Fleet Numerical Meteorology and<br />
Oceanography Detachment,<br />
Federal Building, 151 Patton<br />
Avenue, Asheville, North Carolina<br />
28801.]h
The Sinking of The Argus<br />
Skip Gillham<br />
Vineland, Ontario, Canada<br />
This fall marks the 85th<br />
anniversary of the great<br />
storm of 1913. For days the<br />
winds howled, building mountainous<br />
seas and hurling all forms of<br />
blinding precipitation. From<br />
November 7-11, 1913, the upper<br />
Great Lakes offered no safety for<br />
ship or sailor. Most avoided<br />
confrontation with the elements<br />
and waited in port. Others, caught<br />
by the wintry blast, found no place<br />
to hide. The casualty toll was<br />
enormous, with 251 lives lost, 12<br />
ships sunk, and many others<br />
damaged. Among those lost with<br />
all hands was the ARGUS.<br />
The ship ARGUS was built by the<br />
American <strong>Ship</strong>building Co. and<br />
launched at Lorain, Ohio, on<br />
August 5, 1903. The 436 foot long<br />
freighter, originally known as the<br />
LEWIS WOODRUFF, went to<br />
work for the Gilchrist Transportation<br />
Company. The steam powered<br />
carrier could haul about 7000 tons<br />
of cargo per trip and usually<br />
brought iron ore or grain down the<br />
lakes and returned upbound with<br />
coal. Gilchrist transportation<br />
experienced hard times and when<br />
their fleet was disbanded, several<br />
vessels joined the Interlake<br />
Steamship Company. In 1913<br />
LEWIS WOODRUFF was among<br />
the latter and sailed as the<br />
ARGUS.<br />
ARGUS departed November 7,<br />
1913, from Buffalo with a load of<br />
coal and got as far as Lake Huron.<br />
There, on November 9-10, it went<br />
down with all hands. Reports from<br />
the nearby GEORGE G. CRAW-<br />
FORD indicated the snow stopped<br />
falling long enough to watch the<br />
demise. Apparently, ARGUS got<br />
caught in the trough and could not<br />
pull out. The hull “crumpled like<br />
an egg shell” and sank.<br />
Marine Prediction Center<br />
A total of 24 sailors perished. The<br />
ship was valued at $136,000 (U.S.<br />
dollars in 1913).<br />
Note: Skip Gillham is the author<br />
of 18 books, most related to Great<br />
Lakes ships and shipping. “Seaway<br />
Era <strong>Ship</strong>wrecks,” released in<br />
1994, tells the story of 100 ship<br />
accidents from the opening of the<br />
St. Lawrence Seaway in 1959.<br />
Copies are available from the<br />
author for a fee.h<br />
The ARGUS sank November 9-10, 1913, on Lake Huron. Twentyfour<br />
sailors perished. Photo courtesy of Milwaukee Public Library.<br />
December 1998 11
Debi Iacovelli is a freelance<br />
writer specializing in tropical<br />
meteorology. Her stories have<br />
appeared in <strong>Weather</strong>wise,<br />
Mariner’s <strong>Weather</strong> <strong>Log</strong>, the<br />
Navy’s “Fathom” magazine, The<br />
American <strong>Weather</strong> Observer,<br />
and the <strong>Weather</strong> Watcher Review.<br />
[Editors Note: This is a look back<br />
to 1992 (August 22-25), when the<br />
National Hurricane Center<br />
withstood the forces of Hurricane<br />
Andrew. The article was written in<br />
November 1992.]<br />
More than one hundred<br />
people stood silent, eyes<br />
wide open in sudden<br />
fright, as the crash shook the<br />
National Hurricane Center (NHC),<br />
which was located on the sixth<br />
floor of the IRE Building (Gables<br />
One Tower) in Coral Gables,<br />
Florida. On the roof above the<br />
12th floor, the white dome that<br />
12 <strong>Mariners</strong> <strong>Weather</strong> <strong>Log</strong><br />
Hurricane Andrew–1992<br />
The National Hurricane Center <strong>Weather</strong>s the Storm<br />
Debi Iacovelli<br />
Cape Coral, Florida<br />
enclosed the radar unit shattered<br />
in the winds of Hurricane Andrew,<br />
shaking the entire building,<br />
sending the now-exposed radar<br />
unit crashing to the roof. “Hearts<br />
stopped for a second and<br />
everyone’s eyes got real big,”<br />
remembers Joel Cline, a meteorologist<br />
at the NHC who worked<br />
in the Tropical Satellite Analysis<br />
and Forecasting Unit, all the while<br />
thinking to himself, “It sounded<br />
like the radar fell off the roof!”<br />
The silence that descended on the<br />
crowd of media, photographers,<br />
weather specialists, and their<br />
family members was broken by<br />
the lone figure who walked out of<br />
the radar room. “I lost the scope”<br />
he said, with a look of disbelief.<br />
“Somewhere about 4:45 to 4:50 am<br />
or so, all the systems blew away,”<br />
according to the National Hurricane<br />
Center’s Director, Dr. Robert<br />
Sheets. “The instrumentation blew<br />
away, the radome itself shattered<br />
and blew away. Even before that,<br />
we lost our satellite antennas; they<br />
were destroyed by the wind. The<br />
radar antenna itself was blown off<br />
of something like a little penthouse<br />
that sits on our roof. It’s<br />
about fifteen feet above the<br />
normal roof level. So when it blew<br />
off, it fell onto the roof. It weighs<br />
a couple of tons and shook the<br />
whole building. Everybody sort of<br />
looked. I knew what it was and<br />
what had happened just based on<br />
the weight and the thud that took<br />
place. We didn’t know how much<br />
damage that it may have caused on<br />
the roof, but fortunately, it did not<br />
cause any structural damage itself.<br />
The building was shaking from the<br />
wind anyway, sort of swaying a<br />
little bit.”<br />
The NHC and Miami’s National<br />
<strong>Weather</strong> Service (NWS) shared<br />
the sixth floor of the IRE Building,<br />
Continued on Page 13
Hurricane Andrew<br />
Continued from Page 12<br />
which was the only floor in the<br />
building with hurricane shutters.<br />
“We had encapsulated ourselves<br />
with the exterior shutters we have<br />
for our floor,” said Sheets. “They<br />
were all closed early Sunday<br />
evening before the winds ever<br />
started to pick up. There we were,<br />
concrete floor above us, concrete<br />
floor below us, in this engineered<br />
building. So we felt reasonably<br />
safe from the elements of the<br />
hurricane.”<br />
Suddenly, around 3:30 am, the<br />
NHC lost electricity. Emergency<br />
generators roared to life. However,<br />
a problem with the generators<br />
prevented the Center’s air<br />
conditioning system from operating.<br />
Temperatures climbed to 95<br />
degrees inside the cramped<br />
quarters, and stayed there for the<br />
next few days. Because of the<br />
excessive heat, some of the<br />
computer systems had to be shut<br />
down.<br />
Around 4:30 am, the eyewall of<br />
Hurricane Andrew began to cut a<br />
swath of destruction along South<br />
Florida’s coastline. “Here at the<br />
Hurricane Center itself, we were<br />
just outside of the eyewall. That<br />
meant that we did not get the<br />
strongest conditions, but we got<br />
strong enough to cause considerable<br />
problems here,” said Sheets.<br />
“On the roof of our building, which<br />
is an elevation of 150 feet or so,<br />
we measured sustained winds up<br />
to 120 to 125 mph, with gusts to<br />
168 mph, about 3:30-4:00 in the<br />
morning, as the center approached<br />
the coast.”<br />
Joel Cline stood in the darkness at<br />
the back door of the IRE Building,<br />
watching in amazement, as the<br />
satellite dishes were blown away<br />
in the early morning hours. “The<br />
thing that impacted our work the<br />
most was the satellite dishes that<br />
blew away, because that allows us<br />
to see from Africa to Hawaii,”<br />
says Cline. The duties of the fallen<br />
WSR-57 radar unit at the NHC<br />
were absorbed by other NWS<br />
radars. “We were using the new<br />
SR-88D (Doppler) radar out of<br />
Melbourne to track the hurricane<br />
as it moved across the state.” said<br />
Sheets. “We had been doing that<br />
prior to our own radar failure, but<br />
continued that every fifteen<br />
minutes that we were bringing in<br />
the imagery; we had that in loop<br />
form; until it got well out of range,<br />
out over the Gulf of Mexico. We<br />
also had the Tampa radar that we<br />
were monitoring as it was moving<br />
along, and then the Key West<br />
radar. So, even though we lost our<br />
radar, we still had three others that<br />
were on it.”<br />
Anticipating the worst, early in the<br />
morning on Sunday, August 23rd,<br />
the NHC sent six of their staff to<br />
the National Meteorological<br />
Center (NMC, now known as<br />
NCEP [National Centers for<br />
Environmental Prediction])<br />
Meteorological Operations<br />
Division in Washington. Among<br />
them were Jerry Jarrell, Deputy<br />
Director of the NHC, and hurricane<br />
specialist Miles Lawrence.<br />
This move was made because the<br />
forecast track had Andrew at the<br />
front door of the NHC. The NMC<br />
is the alternate site used to send<br />
out hurricane watches and warn-<br />
Hurricane Andrew–1992<br />
ings in case the NHC cannot<br />
operate. Although, in the end, the<br />
NHC never lost their forecasting<br />
abilities, once their satellite dishes<br />
were destroyed, they did require<br />
help from the NMC to get satellite<br />
data. Satellite imagery was sent by<br />
Ethernet line from Washington to<br />
Wallops Island, Virginia, then on<br />
to the NHC. Thus, satellite<br />
pictures continued to come in to<br />
the NHC, though delayed 40<br />
minutes due to the rerouting.<br />
Although radar and satellite data<br />
was somewhat disrupted, reconnaissance<br />
aircraft flew into the<br />
hurricane continuously right up to<br />
the Miami coastline. When<br />
Andrew emerged in the Gulf of<br />
Mexico, the planes picked it up<br />
again. “We did not lose (reconnaissance)<br />
communications,” according<br />
to Sheets. “We lost the direct<br />
link to the recon through the<br />
satellite link, but we were able to<br />
link those through Keesler Air<br />
Force Base and phone communications.<br />
So, we were at a reduced<br />
capacity, but continuing with the<br />
vital data.”<br />
The NHC held steadfastly to the<br />
computer forecast models of a<br />
possible landfall in the southern<br />
part of Florida, even when the<br />
hurricane weakened within a few<br />
millibars of being dismissed as a<br />
tropical system.<br />
Andrew started to increase in<br />
forward motion on Saturday,<br />
August 22, but the track remained<br />
consistent. “In fact, our forecast,<br />
some 30 hours or so before the<br />
center moved across the coast was<br />
Continued on Page 14<br />
December 1998 13
Hurricane Andrew<br />
Continued from Page 13<br />
within eight miles of where it<br />
made landfall” said Sheets. “We<br />
were about three hours slow in our<br />
forecast 30 hours before it struck.<br />
We had forecast that the center<br />
would cross the coast somewhere<br />
around 8:00 am on Monday<br />
morning, and it turned out to be<br />
closer to 5:00 am. So we were<br />
about three hours slow, but right<br />
on track with that.”<br />
When asked what he attributed to<br />
the accuracy in the forecast track<br />
of Hurricane Andrew, Cline<br />
responded, “It was a straightmoving<br />
storm. The synoptic<br />
patterns were well forecast by<br />
models, and the pattern was not<br />
one that was rapidly changing.<br />
When you have a straight-moving<br />
storm, as opposed to a recurvature,<br />
then it doesn’t matter which ocean<br />
you’re in, you’re always going to<br />
come out with a fairly accurate<br />
landfall forecast. You could even<br />
look back at forecasts of others<br />
that have done that same thing.<br />
Hugo was a good forecast. From<br />
the time it went around Puerto<br />
Rico until it hit Charleston, the<br />
course it took was pretty much a<br />
straight line.” According to Sheets,<br />
since pressures were extremely<br />
high to the north, that forced<br />
Andrew on a westward track<br />
rather than the normal recurvature<br />
out in the Atlantic. For a hurricane<br />
or a tropical storm that gets into<br />
that high of a latitude, they would<br />
normally start turning toward the<br />
north, as this storm did temporarily.<br />
Then the high pressure to<br />
the north strengthened, and it also<br />
got up under an upper level<br />
14 <strong>Mariners</strong> <strong>Weather</strong> <strong>Log</strong><br />
anticyclone, so it was in a favorable<br />
area for strengthening.<br />
While the winds and destruction<br />
raged outside, the forecasters had<br />
to concentrate on their duties<br />
inside, not on their personal losses.<br />
Many employees had their mates<br />
and children, along with other<br />
family members, at the NHC to<br />
ride out the storm together. This<br />
was a policy that Sheets insisted<br />
on if ever a hurricane hit the area.<br />
Sheets added, “I’d rather have<br />
their families up here rather than<br />
everyone worrying about them.”<br />
As positive proof to this statement,<br />
after the radar fell and<br />
shook the building, Sheets went<br />
back to check on all the families<br />
huddled at the NHC. Although he<br />
was in the middle of what would<br />
prove to be the most terrible<br />
natural disaster to hit the United<br />
States, he never lost sight of the<br />
reality that the people under his<br />
roof were all living through a<br />
terrifying experience.<br />
Even after being severely affected<br />
by the hurricane, Sheets and his<br />
department could not afford to<br />
contemplate what had happened<br />
because the West coast of Florida<br />
was expecting 120 mph winds as<br />
the storm moved out into the Gulf<br />
of Mexico. “Even though the<br />
hurricane was striking us, we still<br />
had the responsibility to put out<br />
warnings for Southwest Florida<br />
and the North Gulf Coast, because<br />
we knew it was going to go out<br />
into the Gulf and continue to<br />
strengthen,” recalled Sheets. “Our<br />
primary thoughts were on continuing<br />
the forecast and warning<br />
process. There wasn’t much we<br />
could do about this area at that<br />
Hurricane Andrew–1992<br />
stage. We had already done as<br />
much as we could in terms of the<br />
forecasts and warnings that took<br />
place here.”<br />
It is ironic that the forecasters at<br />
the NHC can “see” over 8,000<br />
miles of ocean and land, but during<br />
this night, they were only left to<br />
wonder what terrible devastation<br />
was occurring literally in their own<br />
back yards. “I knew that my<br />
family had been evacuated out of<br />
the area to the west part of the<br />
county,” said Sheets. “I thought<br />
that they’d be reasonably safe<br />
there in a well constructed cinder<br />
block and stucco-type structure.<br />
But, I don’t think any of us comprehended<br />
the degree of damage<br />
that had actually taken place until<br />
we got out into the community and<br />
saw what had happened.”<br />
In the rage of Andrew’s winds,<br />
many NHC and NWS employees<br />
faced the terrible truth that they<br />
would never see their homes<br />
again. “I did what I could, but quite<br />
frankly, I live closest to the water,”<br />
explained Cline. “I took pictures of<br />
my house and took my insurance<br />
papers with me. Although no<br />
employees were injured in the<br />
hurricane, many had no homes to<br />
come back to. “There were ten<br />
whose homes were either destroyed<br />
or not livable after the<br />
hurricane,” said Sheets.<br />
As Hurricane Andrew moved<br />
west, many at the NHC reflected<br />
on that long night spent battling<br />
the storm and the personal price<br />
they paid trying to help save lives.<br />
“I was on the 4:00 pm to midnight<br />
Continued on Page 15
Hurricane Andrew<br />
Continued from Page 14<br />
shift, and had to be back on at<br />
7:00 am” remembers Cline. “So<br />
then, during the height of the<br />
storm I could help out, because<br />
there was no way I was going to<br />
get to sleep. Early in the evening,<br />
right after I did the classification<br />
of the system at 8:00 pm, I knew a<br />
good deal about the hurricane. I<br />
got kind of quiet and started<br />
thinking about things. I was<br />
looking out the window and it’s<br />
overcast, but not ominous. One of<br />
my friends, who is a producer for<br />
a TV network, walked over and<br />
said, ‘What are you thinking<br />
about, Joel? What’s going through<br />
your mind?’” Cline replied, “No<br />
matter what we did, no matter how<br />
many hours Bob sits in front of<br />
your TV cameras, no matter how<br />
many interviews he gives, no<br />
matter how many times people<br />
call here, no matter how many<br />
police went out to beat on doors<br />
and evacuate people off barrier<br />
islands, no matter how many<br />
Spanish stations, Haitian radio<br />
stations broadcast everything,<br />
people are alive now that will not<br />
be alive at 8:00 in the morning.”<br />
“It’s a very sobering and a very<br />
true statement,” said Cline. “That<br />
makes me feel worse than saying<br />
goodbye to my house. In essence,<br />
you have no control over whether<br />
your house is there or not. That’s<br />
what insurance money is for, to<br />
rebuild or whatever. You can’t<br />
rebuild a human life. Our job is to<br />
warn people so they get can out.<br />
You’re not going to control it and<br />
you’re not going to stop it from<br />
damaging any property. We’re not<br />
Hurricane Andrew–1992<br />
Hurricane Andrew Hits Fowey Rocks C-Man<br />
(Coastal Marine Automated Network) Station<br />
In August of 1992, Fowey<br />
Rocks C-MAN station<br />
(FWIF1) was in the direct path<br />
of Hurricane Andrew. The Category<br />
four hurricane blew out all<br />
the glass in the structure, and most<br />
of the weather equipment on this<br />
C-MAN station was either destroyed<br />
or damaged. The intense<br />
winds bent the 30 foot high trolley<br />
mast that held the sensor cross<br />
arm, wind speed sensors, and<br />
remote barometer port. The mast<br />
was bent 90 degrees to the west<br />
about 5 feet above its base. The<br />
cross arm and sensor mounts from<br />
the trolley mast were found about<br />
150 feet west of the lighthouse<br />
base in 10 feet of water. The<br />
GOES antenna was broken off and<br />
the outboard solar panel was<br />
impacted by debris, leaving only<br />
the aluminum frame intact.<br />
Although Fowey Rocks took the<br />
brunt of Hurricane Andrew, it<br />
measured wind speed and direc-<br />
here for that purpose. What we are<br />
here for is so people won’t die.<br />
And you know that no matter what<br />
you do, or how good you do it, or<br />
how long you let people know,<br />
people will die. The next one that<br />
hits the United States, people will<br />
die. People in Galveston may<br />
remember, Mobile may remember<br />
Camille, people in Charleston<br />
remember Hugo, and people here<br />
will remember Andrew for a long<br />
time.”<br />
Acknowledgments<br />
My gratitude to Dr. Robert Sheets,<br />
Joel Cline, and Vivian Jorge, who<br />
at the time worked at the National<br />
Hurricane Center. My thanks also<br />
to <strong>NOAA</strong> cartographer Kevin<br />
Shaw for his research.h<br />
tion, peak winds, sea level pressure,<br />
and temperature until the<br />
station failed due to the intensity<br />
of the hurricane. Wind was<br />
measured at 140 mph (two-minute<br />
average) with a five-second peak<br />
of 169 mph. This data helped<br />
forecasters verify meteorological<br />
information gathered from radar,<br />
satellites, and reconnaissance<br />
aircraft, along with provided data<br />
for further research after the<br />
storm.h<br />
December 1998 15
16 <strong>Mariners</strong> <strong>Weather</strong> <strong>Log</strong><br />
Hurricane Andrew–1992
Fowey Rocks C-MAN station before Hurricane<br />
Andrew.<br />
Hurricane Andrew–1992<br />
Fowey Rocks trolley mast bent 90° by Hurricane<br />
Andrew.<br />
Fowey Rocks C-MAN cross arm and sensor mounts under 10<br />
feet of water.<br />
December 1998 17
In a dramatic series of rescues<br />
stretching the length of the<br />
Pacific Ocean, merchant ships<br />
were responsible for the recovery<br />
of 19 survivors in three emergency<br />
incidents over the course of a one<br />
month period. Quick location, and<br />
the quick reaction of masters and<br />
crews, made the literal difference<br />
between life and death at sea.<br />
Fishermen Fished Out!<br />
On August 15, 1998, the captain of<br />
an 80-foot fishing vessel, the SUN<br />
LION (Belize flag), radioed the<br />
U.S. Coast Guard in Juneau that<br />
his vessel had been adrift for 48<br />
hours. The vessel then began<br />
taking on water in its engine room<br />
375 miles south of Dutch Harbor,<br />
Alaska. Its Philippine crew of ten<br />
abandoned ship into a lifeboat in<br />
10-foot seas and 20-knot winds. A<br />
Hercules C-130 aircraft was<br />
launched from USCG Air Station<br />
Kodiak. At the same time, a<br />
18 <strong>Mariners</strong> <strong>Weather</strong> <strong>Log</strong><br />
AMVER <strong>Program</strong><br />
Rescues Up and Down The Pacific Ocean<br />
Demonstrate the Value of AMVER Participation<br />
Rick Kenney<br />
AMVER Maritime Relations Officer<br />
United States Coast Guard<br />
Japanese specialized cargo ship,<br />
the SOLAR WING, was located<br />
by rescue coordinators using the<br />
AMVER system. The C-130<br />
vectored the merchant ship three<br />
miles to the location of the survivors,<br />
where a boat-to-boat transfer<br />
was accomplished. The ship<br />
carried the survivors to its next<br />
port of call in Tokyo, where it was<br />
presented with a U.S. Coast<br />
Guard Public Service Commendation.<br />
Deliverers Delivered!<br />
A leaking fuel line caused the 44foot<br />
sailboat KATHI II to catch<br />
fire 76 nm southeast of Baja,<br />
Mexico, on July 20, 1998. Two<br />
sailors delivering a friend’s boat<br />
from Mexico to Newport Beach,<br />
California, were forced to abandon<br />
the boat, which soon became<br />
engulfed in flames. A 406 MHz<br />
EPIRB signal was received at the<br />
Coast Guard Command Center in<br />
San Diego, California, and a C-130<br />
aircraft from the USCG Air<br />
Station in Sacramento, on a<br />
scheduled patrol nearby, was<br />
diverted. It located two persons in<br />
a life raft and dropped a radio to<br />
establish communications.<br />
Again, rescuers queried the<br />
AMVER system and located the<br />
American President Lines ship,<br />
M/V PRESIDENT HOOVER,<br />
only 12 miles away. The two<br />
sailors were recovered after only<br />
five hours in the raft as the 900foot<br />
ship maneuvered within six<br />
feet of the raft and dropped its<br />
accommodation ladder. The ship<br />
carried Rick Wempe, described as<br />
“Captain Calm” by his “terrified”<br />
partner Tim Anderson, to Long<br />
Beach, California, where they<br />
were met by news media and<br />
Continued on Page 20
AMVER <strong>Program</strong><br />
Grateful survivors from the SUN LION strike a pose with rescuers from the M/S SOLAR WING.<br />
December 1998 19
Rescues<br />
Continued from Page 18<br />
interviewed about their rescue,<br />
which became the lead story on<br />
local newscasts that evening.<br />
Anderson described a HOOVER<br />
crew member crouched at the<br />
bottom of the big ship’s ladder as<br />
“being dunked as the ship rolled,<br />
yet telling me to walk on top of<br />
him to get on the ladder – he is the<br />
bravest man I ever met in my<br />
life!” Captain Peter Arnstadt,<br />
Master of the PRESIDENT<br />
HOOVER, put his extraordinary<br />
ship handling role in perspective<br />
during a television interview when<br />
he said: “that’s what we get paid<br />
to do!” The retired Navy Captain<br />
also commented that the crew of<br />
the Coast Guard C-130 could have<br />
won the Navy’s aerial bombing<br />
competition with their precise radio<br />
drop!<br />
Back to the Future–New<br />
<strong>Ship</strong> on Maiden Voyage<br />
Saves Seven from Historic<br />
Sailing Craft<br />
Combining the best elements of an<br />
exciting adventure novel, Coast<br />
Guard rescue coordinators in<br />
Honolulu relied on today’s modern<br />
technology to save the crew of an<br />
historic mahogany catamaran<br />
sailing canoe, which replicated the<br />
purported design of ancient sailing<br />
vessels. On a voyage in planning<br />
for over seven years, the 75-foot<br />
FEATHERED SERPENT III was<br />
en route from Hawaii to Brisbane,<br />
Australia on August 20, 1998, via<br />
Fiji, as part of a multi-year circumnavigation<br />
expedition to prove<br />
suspected sea travel of ancient<br />
20 <strong>Mariners</strong> <strong>Weather</strong> <strong>Log</strong><br />
AMVER <strong>Program</strong><br />
Peruvians and possible contact<br />
with Pacific Islanders. The vessel<br />
encountered heavy weather which<br />
caused it to capsize and break up<br />
1,400 nm south of Oahu.<br />
The crew scrambled into life rafts,<br />
which were secured together with<br />
the wreckage. Among contemporary<br />
safety equipment carried<br />
aboard were VHF and single<br />
sideband (SSB) radios, celestial<br />
navigation equipment, and a 406<br />
MHz EPIRB. It was the EPIRB’s<br />
satellite signal that alerted rescue<br />
officials to the catamaran’s plight.<br />
Among the resources marshaled to<br />
assist were a U.S. Coast Guard<br />
C-130 from Air Station Barbers<br />
Point, Hawaii; elements of the<br />
U.S. Navy’s Pacific fleet and<br />
Third Fleet (opportunely returning<br />
from deployment); and a French<br />
container ship participating in<br />
AMVER, the DIRECT FALCON,<br />
which diverted from a<br />
position 484 nm (or 28<br />
steaming hours) away.<br />
An Urgent Marine<br />
Information Broadcast<br />
(UMIB) was also issued<br />
to all ships in the area.<br />
One of those ships, the<br />
M/V EVER VICTORY,<br />
a Taiwanese bulk carrier<br />
on its maiden voyage<br />
from its builder’s<br />
shipyard in Rio De<br />
Janeiro to Tokyo,<br />
responded to the UMIB<br />
and voluntarily diverted<br />
at best speed from its<br />
position only 195 nm<br />
away. The C-130 arrived<br />
on scene and dropped an<br />
additional life raft and<br />
radio to the survivors. At dawn,<br />
the EVER VICTORY appeared<br />
and picked up the survivors, all in<br />
good condition. The expedition’s<br />
leader is Gene Savoy, a 70-yearold,<br />
well-known explorer noted<br />
for the discovery of several<br />
ancient cities in the Peruvian rain<br />
forests since the 1950s.<br />
The Master of the EVER VIC-<br />
TORY, Captain D.M. Huang,<br />
normally participates in AMVER,<br />
but could not on the maiden<br />
voyage because reporting instructions<br />
had not yet been placed<br />
aboard. The critical difference in<br />
response time from a ship identified<br />
at a distance of 195 nm as<br />
opposed to 484 nm from the<br />
position of the emergency points<br />
up the advantage of maximum<br />
ship participation in AMVER by<br />
the world’s merchant fleet!h<br />
Rick Wempe and Tim Anderson hold a<br />
souvenir life ring signed by PRESIDENT<br />
HOOVER crew. They were forced to abandon<br />
the sailboat KATHI II after she caught fire 76<br />
nm southeast of Baja, Mexico.
Why Are the Tides So Predictable?<br />
Bruce Parker<br />
National Ocean Service<br />
Bruce Parker is the Chief of the<br />
Coast Survey Development<br />
Laboratory, National Ocean<br />
Service, <strong>NOAA</strong>.<br />
Methods for precisely<br />
predicting the tide have<br />
been known for more<br />
than a 100 years, and cruder but<br />
still useful methods have been<br />
known for centuries, perhaps even<br />
back 2000 years. With only a few<br />
days of data from a tide gauge, the<br />
tide can be predicted at that<br />
location for years into the future.<br />
With six months of data, such<br />
predictions can be accurate to the<br />
nearest inch and the nearest<br />
couple of minutes.<br />
I should clarify here that by the<br />
tide I mean the astronomical tide,<br />
namely, the tide that is predicted in<br />
national Tide Tables. That may be<br />
obvious to most readers of this<br />
column, but changes in water level,<br />
including the changes due to wind<br />
and atmospheric pressure, are<br />
sometimes still referred to as the<br />
tide. During storms and hurricanes,<br />
the term storm tide is often<br />
used by the media. Wind and<br />
barometric pressure are part of the<br />
weather and so their affect on<br />
water level can vary greatly. When<br />
a tide prediction does not exactly<br />
match the measured water level, it<br />
is because of the wind and pressure<br />
and, in some places, because<br />
of river discharge. But the astronomical<br />
tide is another story and<br />
the key to its predictability is, of<br />
course, the word astronomical.<br />
The tide is caused by the gravitational<br />
effects of the moon and the<br />
sun. The rotations, revolutions,<br />
and orbits involving the Earth,<br />
moon, and sun are all periodic<br />
motions with fixed and precisely<br />
known time periods. We will see<br />
that the predictability of the tide<br />
can be traced back to the predict-<br />
Physical Oceanography<br />
ability of these astronomical<br />
motions.<br />
To answer the question in the title<br />
of this column, we first need to<br />
describe how the tides are caused.<br />
Let’s look at the moon first,<br />
because, being much closer than<br />
the sun, it is the largest generator<br />
of the tides. The Earth and moon<br />
both actually revolve around a<br />
common point, which, because the<br />
Earth is much more massive than<br />
the moon, is inside the Earth, but<br />
not at the Earth’s center (see<br />
Figure 1). At the center of the<br />
Earth, there is a balance between<br />
the gravitational attraction of the<br />
moon (trying to pull the Earth and<br />
moon together) and the centrifugal<br />
force of the revolving Earth<br />
(trying to push the Earth outward<br />
away from the moon—but see last<br />
issue’s column for the real explanation<br />
of this fictitious force). At a<br />
Continued on Page 22<br />
December 1998 21
Figure 1. The Earth-Moon system (viewed from above the North Pole)<br />
revolving around a common axis (just inside the Earth). The Earth is<br />
shown with a hypothetical ocean covering the whole Earth (with no<br />
continents) and two bulges, resulting from the imbalances of gravitational<br />
and centrifugal forces.<br />
Tides<br />
Continued from Page 21<br />
location on the Earth’s surface<br />
closest to the moon, the gravitational<br />
attraction of the moon is<br />
greater than the centrifugal force.<br />
On the opposite side of the Earth,<br />
facing away from the moon, the<br />
centrifugal force is greater than<br />
the moon’s gravitational attraction.<br />
Figure 1 shows a hypothetical<br />
ocean (covering the whole<br />
Earth with no continents) with two<br />
bulges, one facing the moon and<br />
one facing away from the moon.<br />
These bulges result from the two<br />
imbalances of gravitational and<br />
centrifugal forces. However, if we<br />
look at the side facing the moon,<br />
the force vertically upward from<br />
the Earth toward the moon overhead<br />
(due to the gravitational<br />
force of the moon being greater<br />
than the centrifugal force of the<br />
Earth’s revolution) is so small<br />
compared to the Earth’s gravitational<br />
force as to be insignificant.<br />
22 <strong>Mariners</strong> <strong>Weather</strong> <strong>Log</strong><br />
So what then actually causes the<br />
bulges?<br />
If we move away to another point<br />
on the Earth that is not directly<br />
under the moon, we see that the<br />
Physical Oceanography<br />
attractive force is still pointing<br />
toward the moon, but is no longer<br />
perfectly vertical relative to the<br />
Earth. The further away we get<br />
from the point under the moon, the<br />
less vertical the force is (see<br />
Figure 2). At these other points we<br />
now have both a vertical component<br />
of the force and a horizontal<br />
component, the latter one being<br />
parallel to the Earth’s surface.<br />
This horizontal force, though<br />
small, has nothing opposing it, and<br />
so it can move the water in the<br />
ocean. One can see from Figure 2<br />
that all the horizontal components<br />
shown tend to move the water into<br />
a bulge centered around the point<br />
that is directly under the moon.<br />
Similarly, on the other side of the<br />
Earth (where the centrifugal force<br />
is greater than the moon’s gravitational<br />
attraction) another bulge<br />
results.<br />
Continued on Page 23<br />
Figure 2. The tide generating forces (the thick black arrows) on the Earth<br />
resulting from the difference between gravitational attraction (the open<br />
arrows) and centrifugal force (the hatched arrows). The small black<br />
arrows are the horizontal components of the tide generating forces, which<br />
tend to move the water into the two bulges shown in Figure 1.
Tides<br />
Continued from Page 22<br />
One can envision the Earth<br />
rotating under these bulges in this<br />
hypothetical ocean that covers the<br />
entire Earth. In one complete<br />
rotation in one day, there will be<br />
two high tides (when under a<br />
bulge) and two low tides (when<br />
halfway between bulges), and thus<br />
one entire tidal cycle would be<br />
completed in half a day. However,<br />
this is still an extreme simplification.<br />
Not only are the continents<br />
left out, but this assumes that the<br />
oceans respond instantly to the<br />
tide-generating force. There is a<br />
lot more to explain.<br />
Let’s add the continents in and<br />
look at one of the oceans, the<br />
Atlantic, for example. And lets<br />
also look at a bay connected to the<br />
Atlantic. The tide-generating force<br />
is extremely small, too small to<br />
cause a tide directly in the bay.<br />
Only in a large ocean are the<br />
cumulative effects of the tidegenerating<br />
force throughout the<br />
ocean large enough to produce a<br />
tide. What is actually generated is<br />
a very long wave with a fairly<br />
small amplitude, on the order of a<br />
foot or two (see Figure 3). However,<br />
when this wave reaches the<br />
reduced depths of the continental<br />
shelf, there is a partial reflection of<br />
the wave, and the part of the wave<br />
that continues toward the coast is<br />
increased in amplitude. At the<br />
coast, another reflection further<br />
increases the height of this tidal<br />
wave (NOT to be confused with<br />
the tsunami caused by an earthquake),<br />
now reaching at least a<br />
few feet or more along most<br />
coasts. When the wave moves up<br />
into a bay, there can be even more<br />
amplification, depending on the<br />
depth and length of the bay, with<br />
the highest tidal ranges seen in the<br />
Bay of Fundy (on the order of 50<br />
feet).<br />
At this point I need to talk briefly<br />
about pendulums and coffee cups<br />
and bath tubs in order to explain<br />
what makes tides higher in some<br />
places than others, and ultimately<br />
to explain why tides are so predictable.<br />
There are two main parts<br />
in the study of tides, the part<br />
dealing with astronomy (which we<br />
will get back to in a minute) and<br />
the part dealing with the motion of<br />
water in a basin, namely, the<br />
hydrodynamics, which I will talk<br />
briefly about, as soon as we look<br />
at the pendulum. If we have a<br />
Physical Oceanography<br />
Figure 3. The tide generating forces caused by the moon and sun produce<br />
in the ocean a very long wave of relatively small amplitude. When this long<br />
wave reaches the continental shelf, then the coast, and finally propagates<br />
up a bay, it is amplified by an amount that depends on the length and<br />
depth of each of the basins.<br />
simple pendulum, say a ball<br />
hanging on a string, and we hit the<br />
ball sideways just once, and then<br />
let it swing back and forth, it will<br />
always take the same amount of<br />
time to complete one oscillation<br />
back and forth. This period of<br />
oscillation depends only on the<br />
length of the string, a longer string<br />
producing a longer period of<br />
oscillation. If we have a basin of<br />
water and we push down once on<br />
the water to get its surface oscillating<br />
back and forth (like a<br />
seesaw, with the center point not<br />
moving and the ends moving up<br />
and down) it also will have a<br />
period of oscillation. This natural<br />
period of oscillation of a basin<br />
depends both on its length and its<br />
depth. The longer the basin, the<br />
larger the period of oscillation;<br />
Continued on Page 24<br />
December 1998 23
Tides<br />
Continued from Page 23<br />
however, the deeper the basin, the<br />
smaller the period of oscillation.<br />
The length effect is more dominant.<br />
If, for example, we increase<br />
both the length and depth of a<br />
basin by say 100 times, the period<br />
of oscillation will increase by about<br />
10 times (and the frequency of<br />
oscillation will decrease by 10<br />
times). Thus, water in a tea cup<br />
will have a shorter period of<br />
oscillation (and will oscillate back<br />
and forth much faster) than water<br />
in a bath tub. The bathtub, in turn,<br />
has a much shorter of period of<br />
oscillation than the Atlantic Ocean<br />
(which has a natural period of<br />
about 19 hours).<br />
When we hit the pendulum once,<br />
and let it go, the resulting oscillation<br />
is called a free oscillation.<br />
But we could keep hitting the<br />
pendulum at a regular time<br />
interval. Suppose the natural<br />
period of a pendulum is 6 seconds,<br />
but we hit the pendulum every 4<br />
seconds, namely, before it has<br />
time to do a complete oscillation<br />
we send it back in the opposite<br />
direction again. If we keep this up,<br />
the period of oscillation of the<br />
pendulum is 4 seconds, and this is<br />
called a forced oscillation.<br />
The same is true for water in a<br />
basin; if we push down on the<br />
water at a regular interval, we can<br />
cause the water to have a forced<br />
oscillation with a period that<br />
matches our interval of pushing.<br />
This is essentially what the tidegenerating<br />
forces do in the Atlantic<br />
Ocean, except that it is not a<br />
24 <strong>Mariners</strong> <strong>Weather</strong> <strong>Log</strong><br />
single push downward; it is<br />
continuous horizontal pushing of<br />
the water everywhere over the<br />
entire ocean with the direction<br />
varying over a 12.42 hour period<br />
(why this is more than twelve<br />
hours will be explained below<br />
when we get back to the astronomy<br />
part of the story). The<br />
small arrows in Figure 2 show the<br />
horizontal tide generating forces at<br />
one instant in time. As the Earth<br />
rotates, and we follow one point on<br />
the Earth’s surface around, we<br />
can see that the direction of the<br />
force will rotate completely around<br />
the compass.<br />
How large the tide range is<br />
depends on how close the natural<br />
period of the basin is to the period<br />
of the tide-generating force. Look<br />
again at the pendulum. If the<br />
pendulum does one complete<br />
oscillation from right to left and<br />
back again, and is just beginning to<br />
move to the left again as we hit it<br />
to the left, we impart the additional<br />
energy at just the right time<br />
and the pendulum swings higher<br />
than it would have. Likewise, if<br />
the natural period of the basin is<br />
the same as the period of the tidegenerating<br />
force, then the energy<br />
from the tidal forcing will be input<br />
just at the right time and the tide<br />
range will be larger. This is called<br />
resonance. The Atlantic Ocean is<br />
too wide for there to be resonance<br />
(its 19-hour natural period being<br />
much longer than 12.42 hours).<br />
[There may, however, have been a<br />
time in Earth’s history, before<br />
continental drift got as far as is has<br />
today, when the Atlantic was<br />
smaller, and perhaps the tides<br />
Physical Oceanography<br />
were larger.] The largest tide<br />
ranges in the world are in shallower<br />
basins with just the right<br />
length and depth combination, like<br />
the Bay of Fundy, or along ocean<br />
coasts with very wide continental<br />
shelves and the right depth, like<br />
off southern Argentina.<br />
There is not enough space in this<br />
column to explain all aspects of the<br />
hydrodynamics of the tides, but for<br />
the purposes of answering the<br />
question in the title of this column,<br />
we really don’t need to know any<br />
more about the hydrodynamics. It<br />
doesn’t matter how the hydrodynamics<br />
has affected the tide range<br />
or the times of high water and low<br />
water. All that matters is that,<br />
because this is a forced oscillating<br />
system, the tide will oscillate with<br />
the periods determined by the<br />
relative motions of the Earth,<br />
moon, and sun. Then all we need<br />
to do is to analyze a few days (or<br />
months) of water level data in<br />
order to accurately predict the tide<br />
at the location where the data were<br />
taken. However, we need to go<br />
back to the astronomy because<br />
there is not just a single tidal<br />
period to consider. There are many<br />
different periods involved due to<br />
the complex nature of the orbit of<br />
the moon around the Earth and of<br />
the orbit of the Earth around the<br />
sun. To accurately predict the tide,<br />
one must consider the most<br />
important of these periods.<br />
Let’s start with the most important<br />
tidal period, the 12.42 hour period<br />
already mentioned. The Earth<br />
rotates on its axis, taking approxi-<br />
Continued on Page 25
Tides<br />
Continued from Page 24<br />
mately 24 hours to go through a<br />
complete day-night cycle. If the<br />
moon was standing still, then the<br />
two high water bulges on the<br />
Earth mentioned above (see Figure<br />
1 again) would be 12 hours apart.<br />
However, the moon is moving<br />
around the Earth in the same<br />
direction that the Earth is rotating.<br />
By the time the Earth has made<br />
one complete rotation (in 24<br />
hours) the moon has moved a<br />
little, so it actually takes 24.84<br />
hours before that same point on<br />
the Earth is directly under the<br />
moon again. And thus the two<br />
high water bulges are really<br />
separated by 12.42 hours (the<br />
principal lunar period). The tidal<br />
constituent representing this lunar<br />
period is called M2 (for moon,<br />
twice a day).<br />
Another tidal period comes from<br />
the effect of the sun. Although the<br />
sun is much more massive than the<br />
moon, it is so far away that the<br />
tide generating force of the sun is<br />
less than half that of the moon.<br />
The principal solar constituent<br />
(called S2) has a period of exactly<br />
12 hours, as one would expect.<br />
There are two times of the month<br />
when the moon and sun are in line<br />
with the Earth, at which time they<br />
both work together to produce<br />
higher tides, called spring tides<br />
(see Figure 4). This occurs when<br />
the sun and moon are on opposite<br />
sides of the Earth (full moon), or<br />
on the same side (new moon).<br />
When the moon is in first quarter<br />
or third quarter, the moon and sun<br />
work against each other and so the<br />
Physical Oceanography<br />
Figure 4. The combined effect of the moon and sun varies throughout the<br />
month. When the moon and sun are working with each other (at Full<br />
Moon and New Moon), one sees the highest tides (spring tides). At First<br />
Quarter and Last Quarter, the moon and sun work against each other,<br />
resulting in smaller tides (neap tides).<br />
result is tides that are not as high,<br />
called neap tides.<br />
Another tidal period comes from<br />
the fact that the moon’s orbit<br />
around the Earth is not a perfect<br />
circle, but is an ellipse. Thus the<br />
moon moves closest to the Earth<br />
(called perigee) and then to a point<br />
Continued on Page 26<br />
December 1998 25
Tides<br />
Continued from Page 25<br />
farthest away (called apogee) and<br />
then to the closest point again in<br />
the orbit, the whole cycle taking<br />
25.5 days. The tides will be larger<br />
when the moon is closest to the<br />
Earth (perigean tides) and smaller<br />
when the moon is farthest from<br />
the Earth (apogean tides). The<br />
period of this elliptical tidal<br />
constituent (called N2) is 12.66<br />
hours, and it is a little trickier to<br />
understand where this number<br />
comes from. If two waves are<br />
added together, one with a larger<br />
amplitude and a period of 12.42<br />
hours and one with a smaller<br />
amplitude and a period of 12.66<br />
hours, the result will be a wave<br />
with a 12.42-hour period that<br />
slowly varies in amplitude over a<br />
25.5-day period. In order words,<br />
one can represent the variation in<br />
tide range due to the changing<br />
distance of the moon from the<br />
Earth by simply adding a wave<br />
with 12.66-hour period to the<br />
Figure 5. When the moon is at<br />
maximum declination north or<br />
south of the equator, the tidal bulge<br />
also shifts north or south. When<br />
this happens, certain locations on<br />
the Earth would rotate under only<br />
one high water bulge.<br />
26 <strong>Mariners</strong> <strong>Weather</strong> <strong>Log</strong><br />
principal lunar wave with period<br />
of 12.42 hours. We can use Figure<br />
4 to illustrate this, if, in that<br />
figure, we replace S2 with N2,<br />
spring tide with perigean tide, and<br />
neap tide with apogean tide. The<br />
difference is that with the M2 plus<br />
S2 case there really are two<br />
distinct effects being added, but in<br />
the case of the changing distance<br />
between the moon and Earth, this<br />
directly varies the amplitude of the<br />
tide; and N2 is merely a convenient<br />
way (in combination with<br />
M2) to represent this variation of<br />
amplitude.<br />
There are many other variations in<br />
the moon’s orbit, the Earth’s<br />
rotation, and the Earth’s orbit<br />
about the sun, and these all can be<br />
represented by other tidal constituents<br />
with appropriate periods to<br />
represent the various affects on the<br />
tide’s amplitude. I will mention<br />
only two others, because at some<br />
locations on the Earth they can<br />
lead to (with some help from<br />
hydrodynamics) only one high<br />
water per day instead of two. The<br />
moon is directly over the Earth’s<br />
equator only two times a month.<br />
Half the time it moves north of the<br />
equator, and half the time it moves<br />
south of the equator. At the point<br />
when the moon is the farthest<br />
north of the equator (or farthest<br />
south) the bulge is shifted also. In<br />
Figure 5, one can see places north<br />
of 30°N where the Earth would<br />
rotate under only one high water<br />
bulge. In the real world, the size of<br />
a particular basin would determine<br />
whether these diurnal tidal periods<br />
would dominate over the<br />
semidiurnal periods described<br />
above. In many places there are<br />
Physical Oceanography<br />
still two high waters a day, but one<br />
is larger than the other (and<br />
likewise for the low waters); this<br />
is referred to as a mixed tide.<br />
Knowing the periods of these and<br />
other smaller tidal constituents,<br />
which are derived from the<br />
relative astronomical motions of<br />
the Earth, moon, and sun, one can<br />
analyze a data series of water level<br />
observations from a particular<br />
location. The result of such a<br />
harmonic analysis is an amplitude<br />
and phase for each of these tidal<br />
constituents, which represent how<br />
large each effect is at that particular<br />
location, and when in time the<br />
peak of each effect will take place<br />
[for example, relative to when the<br />
moon passes over (transits) that<br />
location]. The hydrodynamics<br />
affect both the amplitude and<br />
phase (timing) of each tidal<br />
constituent, but we really don’t<br />
need to know the details of how it<br />
happened, only that it did happen.<br />
And, as long as the hydrodynamics<br />
stay the same, the tide predictions<br />
from these calculated<br />
harmonic constants (the amplitudes<br />
and phases) will be accurate.<br />
The hydrodynamics will stay the<br />
same as long as the length and<br />
depth of the basin stays the same.<br />
For small bays, shoaling or<br />
dredging can change the hydrodynamics<br />
and thus change the tide<br />
range and times of high and low<br />
waters.<br />
The method of harmonic analysis<br />
was first invented by Sir William<br />
Thomson (Lord Kelvin) in 1867<br />
and later refined by George<br />
Continued on Page 27
Tides<br />
Continued from Page 26<br />
Darwin (son of Charles Darwin).<br />
To carry out a tide prediction in<br />
that era, long before computers,<br />
machines were built with gears<br />
and pulleys connected by a wire to<br />
a pen. Each tidal constituent had a<br />
different size rotating gear and a<br />
pin and yoke system connected to<br />
a pulley (see Figure 6). The pin<br />
and yoke system turned the<br />
rotating motion of the gear into a<br />
vertical up and down motion of the<br />
pulley, which moved the wire over<br />
it and thus moved the pen up and<br />
down on a roll of moving paper.<br />
The wire ran over a number of<br />
pulleys so all the constituent<br />
effects could be added together.<br />
The first tide predicting machine<br />
was a wooden model built for<br />
Kelvin in 1872, but later models<br />
were huge brass machines with<br />
dozens of finely made gears and<br />
pulleys. The first one built in the<br />
U.S. was by William Ferrel in<br />
1885.<br />
Prior to the use of harmonic<br />
analysis, there were other less<br />
sophisticated methods based upon<br />
recognized relationships between<br />
the tides and the movements of the<br />
moon and sun. For example, for a<br />
particular place, high tide might<br />
occur a certain number of hours<br />
after the moon was directly<br />
overhead, and the highest (spring)<br />
tide might occur a certain number<br />
of days after full moon or after<br />
new moon. In many of the early<br />
maritime nations, tide prediction<br />
schemes were treasured family<br />
secrets passed on to the next<br />
generation. One of the earliest tide<br />
tables discovered was for London<br />
Bridge in the early 1200s.<br />
The earliest recognition of the<br />
connection between the tides and<br />
Figure 6. A schematic of an early tide prediction machine. Each gear and<br />
pulley combination represented one tidal constituent. The wire running<br />
over every pulley summed the motions and moved a pen on a moving roll<br />
of paper to draw a tide curve.<br />
Physical Oceanography<br />
the moon appears to be by a Greek<br />
geographer, Pytheas of Massilia,<br />
around 325 B.C. Pytheas had<br />
traveled from his home in the<br />
Mediterranean Sea, which does<br />
not have a noticeable tide, to the<br />
British Isles, where he observed<br />
significant tides and even tried to<br />
measure them. Other Greek and<br />
Roman thinkers went on to<br />
describe many patterns in the tides<br />
and their similarity to motions of<br />
the moon and sun. Yet no one<br />
could come up with an explanation<br />
of how the moon and sun<br />
actually caused the tide. They<br />
were especially confused by there<br />
being two high waters a day, one<br />
of those occurring in the day when<br />
the moon was nowhere to be seen.<br />
A variety of strange ideas were<br />
proposed. Some regarded the<br />
Earth as an animal and attributed<br />
the tides to its respiration or to its<br />
alternate drinking in and spouting<br />
out of water. Others attributed it to<br />
the heat of the sun or to river<br />
discharges or to winds caused by<br />
the sun or moon striking the water.<br />
Even those that believed that the<br />
moon had to be the cause did not<br />
know how. In 1609, Kepler<br />
proposed that the tides were due to<br />
the gravitational attraction of the<br />
moon, but he seemed to think that<br />
the second high tide was due to<br />
the waters rushing back after the<br />
moon had pulled them westward,<br />
where they had hit a continent and<br />
were freed from the moon’s pull<br />
as it continued around to the other<br />
side of the Earth. It was not until<br />
1687 that Newton, in his book<br />
Principia, finally explained the<br />
cause of the tides, including the<br />
reason for two high waters per<br />
day.h<br />
December 1998 27
The S/S ARCO FAIR-<br />
BANKS was built by<br />
Bethlehem Steel in 1974.<br />
The ship is 880 feet long, and on<br />
this trip was carrying about<br />
800,000 barrels of oil. This was<br />
trip number 556 for the ship. A<br />
typical journey of this type from<br />
Valdez, Alaska, to Cherry Point,<br />
Washington, can be completed in<br />
about three and one-half days with<br />
good sea conditions. However,<br />
this trip took just over five days,<br />
as we encountered rough weather<br />
and sea conditions along the way.<br />
My trip began at 0400 from<br />
Valdez on Friday, January 16,<br />
1998. The weather was beautiful<br />
with partly cloudy skies and<br />
plenty of stars out. The area was<br />
in a typical winter pattern of high<br />
pressure over the interior, providing<br />
some cold northeast winds.<br />
With a complement of escort<br />
vessels, and a harbor pilot on<br />
board, we headed out through the<br />
Valdez Narrows into Prince<br />
28 <strong>Mariners</strong> <strong>Weather</strong> <strong>Log</strong><br />
Fam Float<br />
Marine Familiarization Float on Board the<br />
S/S ARCO FAIRBANKS—January 16-21, 1998<br />
Dave Hefner, Marine Forecaster<br />
Fairbanks, Alaska<br />
William Sound. With the slower<br />
speed limits in the sound, we did<br />
not reach Hinchinbrook entrance<br />
to the Gulf of Alaska until noon<br />
on Friday.<br />
The S/S ARCO FAIRBANKS<br />
receives marine facsimile data<br />
from both Kodiak and Point<br />
Reyes. From Kodiak, they receive<br />
the surface analysis and a 36-hour<br />
surface forecast, both prepared by<br />
the Anchorage forecast office.<br />
From Point Reyes, they receive a<br />
North Pacific surface analysis<br />
(from Japan to California), and a<br />
12- and 24-hour forecast of winds<br />
and seas. These charts are all<br />
prepared by the National Centers<br />
for Environmental Prediction<br />
(NCEP), Marine Prediction Center<br />
(MPC). They also have access to<br />
marine text forecasts via<br />
INMARSAT-C SafetyNET.<br />
Second Mate Statler spent quite a<br />
bit of time with me talking about<br />
weather. He has quite an interest<br />
in weather and considers himself<br />
an amateur observer. He was quite<br />
knowledgeable of general weather<br />
conditions. He said the ship takes<br />
an 18Z observation everyday.<br />
Their observation equipment<br />
consists of a barometer,<br />
barograph, thermometers for both<br />
air temperature and wet-bulb<br />
temperature, and a weather vane<br />
and cup anemometer.<br />
Twenty-four hours into the trip,<br />
we started hitting swells of 10 to<br />
15 feet. These were obviously<br />
swells generated by a distant<br />
storm, as we were under partly<br />
cloudy skies, with just a hint of<br />
layered clouds to the far south.<br />
Winds were only 15 to 20 kts. For<br />
a while, the swells were hitting us<br />
head on, with beautiful displays of<br />
water spraying high into the air off<br />
the bow. But soon the swells<br />
started to hit us at a bit of an angle<br />
and the water really started to<br />
wash over the main deck. By the<br />
time we reached about 55 north<br />
Continued on Page 29
Fam Float<br />
Continued from Page 28<br />
latitude, we hit the back side of a<br />
strong storm, and winds increased<br />
northwest to 50 kts. The seas<br />
became quite chaotic, increasing<br />
to about 15 to 20 feet. In addition<br />
to the seas washing across the<br />
Fam Float<br />
deck, we were receiving quite a bit<br />
of sea spray, even up to the<br />
windows on the bridge.<br />
The normal cruising speed for this<br />
tanker is around 15 kts. For most<br />
of Saturday and Sunday we had<br />
only been traveling between 5 and<br />
10 kts, putting us quite a bit<br />
Photo of inbound tanker in Prince William Sound heading for Valdez to<br />
pick up a load of crude oil. Picture taken from the bridge of the outbound<br />
S/S ARCO FAIRBANKS.<br />
Photo taken from the bridge of the S/S ARCO FAIRBANKS during a<br />
storm in the North Pacific en route to Cherry Point, Washington.<br />
behind schedule. By 1000 Sunday,<br />
we were only abreast of the<br />
northern Queen Charlotte Islands,<br />
which is a little short of half way<br />
to Cherry Point, Washington. The<br />
seas did begin to smooth out,<br />
though swells remained 10 to 15<br />
feet. By Monday evening we were<br />
only about 150 miles from Port<br />
Angeles.<br />
We reached the Straits of Juan de<br />
Fuca Tuesday evening. We made a<br />
quick stop to pick up the harbor<br />
pilot near Port Angeles.<br />
We reached Cherry Point at 0600<br />
Wednesday. Cherry Point is very<br />
remote, located on the Washington<br />
coast north of Bellingham, and<br />
only about 10 miles from the<br />
Canadian border. The facilities are<br />
located out from moderately sized<br />
cliffs, and pipes carry the oil to a<br />
refinery at least one-half mile<br />
inland. There are two other<br />
unloading piers in the area, both<br />
being about one-half mile apart.<br />
One pier was for unloading bulk<br />
cargo, and the other one was for<br />
unloading oil. It takes about 24 to<br />
28 hours to unload one of these<br />
tankers. Some of the crew told me<br />
that the return trip back to Valdez<br />
becomes significantly rougher<br />
given the same sea conditions, due<br />
to riding so much higher out of the<br />
water.<br />
I truly enjoyed the trip as it was a<br />
real learning experience for me to<br />
see how marine conditions can<br />
vary on the open sea, especially<br />
the north Pacific. I appreciated the<br />
opportunity to sail with the crew<br />
of the S/S ARCO FAIRBANKS<br />
on this trip.h<br />
December 1998 29
Northeast Pacific Cooperative Drifter <strong>Program</strong><br />
Michael K. Burdette<br />
National Data Buoy Center<br />
United States and Canadian<br />
forecasters are continually<br />
challenged in their efforts<br />
to prepare accurate forecasts for<br />
the coastal areas of the Northeast<br />
Pacific. The Gulf of Alaska and<br />
the North Pacific are well known<br />
as areas for development and<br />
intensification of major storm<br />
systems which pose a moderate to<br />
severe threat to the coastal and<br />
land areas of the U.S. and Canada.<br />
Although the Northeast Pacific is<br />
well served by U.S. and Canadian<br />
moored buoys and <strong>Voluntary</strong><br />
<strong>Observing</strong> <strong>Ship</strong>s, large expanses<br />
of ocean still exist where little<br />
meteorological information is<br />
available to forecasters.<br />
This noted lack of meteorological<br />
observations, along with the<br />
30 <strong>Mariners</strong> <strong>Weather</strong> <strong>Log</strong><br />
associated risk, was severely felt<br />
on October 11, 1984, when an<br />
under-forecasted, rapidly deepening<br />
storm, a “marine bomb,”<br />
struck the West Coast of Canada,<br />
resulting in the loss of seven<br />
fishing vessels and five lives.<br />
Subsequent investigation into the<br />
incident, known as the “Le Blonde<br />
Report,” highlighted the importance<br />
of understanding the physics<br />
of rapidly deepening storms, and<br />
developing methods for early<br />
detection. One action addressing<br />
requirements identified in the<br />
report was to supplement the<br />
existing moored buoy networks on<br />
the west coast with drifting buoys<br />
that could measure needed parameters<br />
such as wind speed and<br />
direction, pressure, and sea state,<br />
as future developments allowed.<br />
National Data Buoy Center<br />
Since that time, Environment<br />
Canada has attempted to maintain<br />
a network of 10-12 drifting buoys<br />
in the Northeast Pacific as an early<br />
warning network. The National<br />
Data Buoy Center (NDBC) has<br />
also deployed a few drifters in the<br />
area for other unrelated projects.<br />
Over the years, however, it has<br />
been difficult for Environment<br />
Canada to maintain the network<br />
with little or no assistance.<br />
In 1997, the Atmospheric Environment<br />
Branch of Environment<br />
Canada contacted NDBC, recommending<br />
a joint effort to deploy<br />
and maintain a drifter array for<br />
three years. The resulting network<br />
would be larger, more reliable, and<br />
Continued on Page 31
Drifter <strong>Program</strong><br />
Continued from Page 30<br />
more valuable than either could<br />
support individually.<br />
In September 1998, the first six<br />
deployments were successfully<br />
made. Drifters measuring wind<br />
speed and direction, barometric<br />
pressure, air temperature, sea<br />
temperature, and location were<br />
placed along 160W longitude, at<br />
40N, 41N, 43N, 46N, 49N, and<br />
52N latitudes. The buoys are<br />
expected to slowly drift towards<br />
the west coast of the U.S. and<br />
Canada over the next two years.<br />
They will report through the Polar<br />
Orbiting Environmental Satellites,<br />
with data being distributed<br />
through Service Argos to the<br />
Global Telecommunications<br />
System. Data will be available to<br />
all west coast forecasters on the<br />
SSVX08 header. Marine interests<br />
should note that the data will also<br />
be plotted on standard National<br />
Centers for Environmental Prediction<br />
(NCEP) Surface Analysis<br />
Charts. One important point to be<br />
kept in mind when analyzing the<br />
data is that the winds are measured<br />
at one meter above the sea<br />
National Data Buoy Center<br />
surface and contain no adjustment<br />
to the standard 10-meter observation<br />
height. If not adjusted to 10meter<br />
height for use, the data will<br />
show a low wind speed bias.<br />
NDBC and Environment Canada<br />
are expecting to add additional<br />
buoys to the array over the next<br />
two years. As current buoys drift<br />
slowly towards the coastlines of<br />
the U.S. and Canada, additional<br />
buoys will be deployed behind<br />
them. The result will be a comprehensive<br />
buoy array stretching from<br />
160W toward the coastlines in<br />
1999 and 2000.h<br />
Under the Northeast Pacific Cooperative Drifter <strong>Program</strong>, six drifting buoys were deployed in September 1998.<br />
This is a joint U.S. and Canadian effort. More buoys will be depoloyed over the next two years.<br />
December 1998 31
Marine <strong>Weather</strong> Review<br />
North Atlantic Area<br />
April—July 1998<br />
George P. Bancroft<br />
Meteorologist<br />
Marine Prediction Center<br />
Like the North Pacific, the<br />
North Atlantic experienced<br />
its most active weather<br />
early in April. A series of frontal<br />
waves moved east or southeast<br />
from near the Canadian<br />
Maritimes, into the base of a mean<br />
upper low (trough) southeast of<br />
Greenland and amplified. The<br />
strongest of these became an<br />
intense storm in the eastern<br />
Atlantic, dropping 31 mb in 24<br />
hours from 12Z April 1 to 12Z<br />
April 2, therefore qualifying as a<br />
meteorological “bomb” (see<br />
Figure 1). In the second panel or<br />
part of Figure 1, the storm has<br />
almost finished deepening, and<br />
actually bottomed out at 954 mb at<br />
18Z April 2. This was the most<br />
intense storm in the North Atlantic<br />
during this April to July period.<br />
Note the 60 kt west wind southwest<br />
of the center. It is conceivable<br />
that this storm produced<br />
32 <strong>Mariners</strong> <strong>Weather</strong> <strong>Log</strong><br />
hurricane force winds in the<br />
strongest portion of the storm.<br />
The third panel of Figure 1 shows<br />
the storm slowing. The system<br />
subsequently became stationary<br />
over Great Britain, increasing in<br />
size and dominating much of the<br />
eastern North Atlantic until April<br />
8. This storm developed seas of 16<br />
ft or higher from Great Britain<br />
south to near 40N in the eastern<br />
North Atlantic, with a maximum<br />
of 43 ft (13 meters) in the Bay of<br />
Biscay on April 3.<br />
Figure 1 also shows a change in<br />
the upper air pattern in the western<br />
Atlantic to a trough near the U.S.<br />
east coast which continued into<br />
June, supporting a series of lows<br />
moving off the east coast, while a<br />
ridge developed in the eastern<br />
North Atlantic. Split flow over the<br />
western North Atlantic and parts<br />
of North America was apparent<br />
Marine <strong>Weather</strong> Review<br />
during this period, with separate<br />
northern and southern jet streams,<br />
perhaps the remnants of El Niño.<br />
This also led to cutoff lows at<br />
southern latitudes. Figure 2 is an<br />
example from this period, showing<br />
a separate 500 mb northern stream<br />
sending short wave troughs east<br />
and northeast toward the<br />
Greenland area, with associated<br />
surface development. A low is<br />
moving off the east coast and a<br />
cutoff low is shown forming near<br />
33N 35W, with developing gale<br />
conditions. East coast low pressure<br />
developments beginning late<br />
in April remained below storm<br />
strength. However, one longlasting<br />
low, cut off at southern<br />
latitudes, off the Carolinas on May<br />
11 remained for several days,<br />
resulting in a large area of north-<br />
Continued on Page 35
Marine <strong>Weather</strong> Review<br />
Figure 1. Three-panel display of surface and 500-mb analysis charts produced by the MPC for the dates April 1,<br />
2, and 3, valid at 12Z, showing development of the most intense storm of the April to July 1998 period.<br />
December 1998 33
34 <strong>Mariners</strong> <strong>Weather</strong> <strong>Log</strong><br />
Marine <strong>Weather</strong> Review<br />
Figure 2. Two-panel display of surface analysis and corresponding 500-mb charts for 12Z May 2 and 00Z May 3,<br />
1998, showing “split flow.”<br />
Figure 3. Surface analysis for 18Z May 13, 1998, showing a large cutoff low<br />
with gale winds off the east coast of the U.S.
North Atlantic Area<br />
Continued from Page 32<br />
east gales over the western and<br />
northern offshore waters (Figure<br />
3). Highest reported seas were 16<br />
to 23 ft (5 to 7 meters). This<br />
sytem started to weaken on the<br />
15th, but took until the 18th of<br />
May to move out and pass east of<br />
Newfoundland.<br />
By early June, a blocking area of<br />
higher pressure in the Greenland<br />
area resulted in slow moving<br />
systems out of the northeastern<br />
U.S. to the Canadian Maritimes<br />
with winds of gale strength or less.<br />
One of these moved slowly from<br />
New England on June 3 as a<br />
complex gale, taking a week to<br />
reach Great Britain. The blocking<br />
receded north by the middle of<br />
June, allowing systems to turn<br />
north toward the Labrador Sea.<br />
The strongest of these moved off<br />
the New England coast on June 27<br />
and intensified. Figure 4 depicts<br />
this development over a period of<br />
30 hours to a mature system with<br />
strong gales reported around the<br />
Marine <strong>Weather</strong> Review<br />
south, west, and north sides at 06Z<br />
June 29. This was the system<br />
closest to being a storm in MPC’s<br />
portion of the North Atlantic<br />
during the June to July period, a<br />
time when cyclonic activity is<br />
approaching a minimum for the<br />
year.<br />
Reference<br />
Joe Sienkiewicz and Lee<br />
Chesneau, Mariner’s Guide to the<br />
500-Millibar Chart (<strong>Mariners</strong><br />
<strong>Weather</strong> <strong>Log</strong>, Winter 1995).h<br />
Figure 4. Two-panel display of surface and 500-mb analysis charts showing the development of a strong gale of<br />
June 28 at 00Z to June 29 at 06Z. The analysis time of 06Z was chosen for the second-panel surface analysis to<br />
show the system at maximum development.<br />
December 1998 35
Marine <strong>Weather</strong> Review<br />
North Pacific Area<br />
April—July 1998<br />
George P. Bancroft<br />
Meteorologist<br />
Marine Prediction Center<br />
The weather pattern over the<br />
North Pacific was unusually<br />
active in April and<br />
May, with developing lows<br />
frequently tracking from near<br />
Japan to the Bering Sea, with<br />
some of these passing or redeveloping<br />
south of the Alaska Peninsula.<br />
April began with a weakening<br />
gale, formerly a storm, in the<br />
northern Bering Sea, with residual<br />
swells reported in the 20 to 32 ft<br />
range (6 to 10 meters) around the<br />
eastern Aleutians both on the<br />
North Pacific and Bering sides.<br />
The ships at 54N 170W and 54N<br />
163W both reported 32 ft seas (10<br />
meters) and west winds of 40 kt.<br />
This system was soon replaced by<br />
a rapidly intensifying developing<br />
storm, depicted in the first panel<br />
Continued on Page 40<br />
36 <strong>Mariners</strong> <strong>Weather</strong> <strong>Log</strong><br />
Marine <strong>Weather</strong> Review<br />
GMS infrared satellite image of Bering Sea storm of April 9-10, 1998. Note<br />
the broad frontal cloud band with high (cold) tops northwest, north, and<br />
east of the storm center. The storm was near maximum intensity and<br />
centered near 58N 177W with 956 mb central pressure at the time of the<br />
image (2345 UTC 09 April 1998).
Marine <strong>Weather</strong> Review<br />
Figure 1. Three-panel display of surface and 500-mb analysis charts produced by MPC for the dates April 1, 2,<br />
and 3, 1998, with valid time 00Z.<br />
December 1998 37
38 <strong>Mariners</strong> <strong>Weather</strong> <strong>Log</strong><br />
Marine <strong>Weather</strong> Review<br />
Figure 2. Three-panel display of surface and 500-mb analysis charts produced by MPC for the dated April 8, 9,<br />
and 10, 1998, with valid time 00Z. The 500-mb chart valid for 00Z April 8 is a 12-hour forecast from a computer<br />
model used in this case in lieu of a 500-mb.
Marine <strong>Weather</strong> Review<br />
Figure 3. Three-panel display of surface and 500-mb analysis charts produced by the MPC for the dates April 15,<br />
16, and 17, 1998, with valid time 00Z.<br />
December 1998 39
North Pacific Area<br />
Continued from Page 36<br />
of Figure 1, approaching the<br />
western Aleutians at the start of<br />
April. The second two panels of<br />
Figure 1 show intensification of a<br />
500 mb low. Storm force winds<br />
were observed by 12Z April 1<br />
ahead of the front south of the<br />
center near 50N 173E. Central<br />
pressure dropped from 995 mb at<br />
00Z April 1 to 955 mb at 00Z<br />
April 2, bottoming out at 954 mb<br />
at 06Z April 2, with the center<br />
moving through the southern<br />
Bering Sea. A southwest wind of<br />
60 kt was observed southeast of<br />
the center at 53N 176W along<br />
with 43 ft seas (13 meters). Note<br />
40 <strong>Mariners</strong> <strong>Weather</strong> <strong>Log</strong><br />
the ship reports in the third panel<br />
of Figure 1 with 45 to 60 kt in the<br />
southern Bering Sea at 00Z April<br />
3. The ship at 54N 174W reported<br />
west winds 60 kt and also reported<br />
the highest seas in this event, 56 ft<br />
(17 meters). At 00Z April 2, buoy<br />
46035 56N 178W reported an 8minute<br />
average wind of NE 45 kt.<br />
By 00Z April 3, gale force winds<br />
and seas to 23 ft (7 meters)<br />
extended down to 42N south of<br />
the eastern Aleutians as this<br />
system started to weaken in the<br />
southeast Bering Sea.<br />
A similar rapid development in the<br />
western Pacific occurred on April<br />
8-10 as depicted in Figure 2. A<br />
Marine <strong>Weather</strong> Review<br />
storm developed 18 hours later<br />
near 50N 167E at 978 mb with a<br />
ship reporting NW 55 kt winds<br />
and 30 ft seas (9 meters) southwest<br />
of the center at 48N 163E<br />
(not shown). The storm center<br />
moved northeast and deepened to<br />
958 mb by 18Z April 9. Winds of<br />
45 to 60 kt and 33 to 50 ft seas (10<br />
to 15 meters) were reported from<br />
ships around the central and<br />
eastern Aleutians and southwest<br />
Gulf of Alaska on April 9. The<br />
third panel of Figure 2 shows the<br />
system near maximum intensity at<br />
00Z April 10. By 18Z April 10,<br />
the system was weakening to a<br />
Figure 4. Two-panel display of surface and 500-mb analysis charts valid May 16 and 17, 1998, at 12Z.<br />
Continued on Page 41
North Pacific Area<br />
Continued from Page 40<br />
gale in the northern Bering Sea,<br />
but a ship south of the center was<br />
still reporting a SW wind of 45 kt<br />
and 52 ft seas (16 meters).<br />
In mid-April the only storm of the<br />
month to move into the northeast<br />
Pacific and pass south of the<br />
eastern Aleutians developed from<br />
a frontal wave south of the western<br />
Aleutians on the 14th near<br />
47N 174E. The storm developed<br />
rapidly by 18Z on the 15th near<br />
47N 169W, with a pressure of 975<br />
mb. Figure 3 shows this development.<br />
At 00Z April 17, ship<br />
reports show winds of 45 to 55 kt<br />
south of the center, and seas were<br />
23 to 36 ft (7 to 11 meters). The<br />
lowest pressure was 958 mb six<br />
Figure 5. Surface analysis valid at 12Z June 8, 1998.<br />
hours before map time of the third<br />
panel of Figure 3. The center then<br />
drifted northeast into the Gulf of<br />
Alaska and weakened on the 18th,<br />
while secondary development on a<br />
front southwest of the old system<br />
subsequently spun up another<br />
storm near 48N 145W, although<br />
not as strong (976 mb at 06Z April<br />
20).<br />
Subsequent storm development<br />
occurred in the northwest Pacific<br />
late in April and into May, with<br />
systems tracking northeast into the<br />
Bering Sea. The strongest of these<br />
is shown in Figure 4 as northern<br />
and southern systems combine to<br />
form a storm, unusually intense<br />
for May, in the southeast Bering<br />
Sea by 12Z on May 17. <strong>Ship</strong><br />
reports showed 50 kt winds near<br />
Marine <strong>Weather</strong> Review<br />
the eastern Aleutians at 00Z May<br />
17 (not shown) and seas up to 25<br />
ft (8 meters) in the eastern Bering<br />
Sea on May 17th and 18th. This<br />
was the last system of the 1997-98<br />
fall-winter-spring period with<br />
storm force winds in MPC’s North<br />
Pacific area.<br />
In June, lows tracked east along<br />
the latitude of Japan then turned<br />
northeast toward the eastern<br />
Aleutians and western Gulf of<br />
Alaska, blocked by an upper ridge<br />
over the eastern Pacific. The<br />
strongest of these intensified to<br />
975 mb as it moved north to the<br />
Alaska Peninsula and developed<br />
winds of 35 to 45 kt and seas 20 to<br />
25 ft (6 to 8 meters) on June 7-8.<br />
See Figure 5. The north portion of<br />
Continued on Page 42<br />
December 1998 41
North Pacific Area<br />
Continued from Page 41<br />
the upper ridge weakened in mid-<br />
June, allowing lows to move into<br />
the eastern Gulf of Alaska. By<br />
June’s end, cyclonic activity<br />
weakened and much of the North<br />
Pacific was dominated by high<br />
pressure.<br />
In July, the eastern Pacific ridge<br />
shifted west and allowed the<br />
westerlies to shift unusually far<br />
south for July off the west coast of<br />
North America. A series of lows<br />
moved from well west of northern<br />
California to the coast near<br />
Vancouver Island. The first panel<br />
of Figure 6 shows the pattern, a<br />
deep trough aloft over the northeast<br />
Pacific. The strong short<br />
wave trough approaching the coast<br />
is associated with the gale center<br />
approaching the British Columbia<br />
coast (second panel of Figure 6)<br />
with 40 kt south winds reported in<br />
the Vancouver Island and Washington<br />
offshore waters. Around<br />
this time, another deep upper<br />
trough was near Japan and supported<br />
the development of the<br />
deepest low of July on a front off<br />
Japan. The low deepened briefly<br />
to 984 mb when over the warm<br />
Kuroshio Current (third panel of<br />
Figure 6) before moving north<br />
toward the Kamchatka Peninsula<br />
and weakening.<br />
Reference<br />
Joe Sienkiewicz and Lee<br />
Chesneau, Mariner’s Guide to the<br />
500-Millibar Chart (<strong>Mariners</strong><br />
<strong>Weather</strong> <strong>Log</strong>, Winter 1995).h<br />
42 <strong>Mariners</strong> <strong>Weather</strong> <strong>Log</strong><br />
Marine <strong>Weather</strong> Review<br />
Figure 6. A 500-mb analysis valid at 00Z July 17, 1998, plus a surface<br />
analysis valid six hours prior to this time, and a third chart which is a<br />
surface analysis valid at 06Z July 18, 1998, showing significant July<br />
weather events.
Marine <strong>Weather</strong> Review<br />
Tropical Atlantic and Tropical East Pacific Areas<br />
May—August 1998<br />
Dr. Jack Beven<br />
Andrew R. Shashy<br />
Tropical Prediction Center<br />
Tropical Analysis and Forecast Branch<br />
Miami, Florida<br />
I. Introduction<br />
A combination of a waning El<br />
Niño and the normal northward<br />
movement of the jet stream ended<br />
the series of strong winter storms<br />
in the TPC area. The Atlantic and<br />
Eastern Pacific Hurricane seasons<br />
both started slowly; however, by<br />
the end of August, both basins<br />
were showing near normal activity.<br />
II. <strong>Ship</strong> Encounters with<br />
Tropical Cyclones<br />
<strong>Ship</strong>s generally avoid tropical<br />
cyclones, especially the central<br />
core region. Forecasts and warnings<br />
transmitted by radio facsimile<br />
and the International SafetyNET<br />
service usually enable ships to<br />
take evasive action long before<br />
encountering the storms. However,<br />
ships occasionally wind up in the<br />
core of a tropical cyclone.<br />
The greatest example of this<br />
occurred on 18 August 1927,<br />
when a ship measured an 887 mb<br />
pressure in a western Pacific<br />
typhoon. This is apparently a<br />
record low pressure measured by a<br />
ship. All lower pressures in<br />
tropical cyclones have been<br />
measured by reconnaissance<br />
aircraft.<br />
A more recent example was on 6-7<br />
September 1995, when the TEAL<br />
ARROW sailed into the eye of<br />
Atlantic Hurricane Luis. The ship<br />
reported a minimum pressure of<br />
942 mb at 1800 UTC 6 September,<br />
which was very close to that<br />
reported by aircraft. It estimated<br />
125 kt wind gusts and 50 ft seas as<br />
it passed through the eyewall.<br />
Another example occurred on 25<br />
August 1998, when the BRITISH<br />
HAWK sailed through the center<br />
of Hurricane Bonnie (Table 1).<br />
Marine <strong>Weather</strong> Review<br />
The ship reported maximum<br />
sustained winds of 75 kt at 1200<br />
UTC, with a minimum pressure of<br />
965.8 mb three hours later. The<br />
data suggest the ship was inside<br />
Bonnie’s large and poorly defined<br />
eye. However, no maximum wind<br />
or minimum pressure data is<br />
available between the observations.<br />
Maximum combined seas<br />
reported by the ship were 33 ft at<br />
1800 UTC.<br />
If a ship does encounter the core<br />
of a tropical cyclone, the crew<br />
should try to document the<br />
encounter as best as possible. The<br />
TPC normally asks for three<br />
hourly ship reports within 300 nm<br />
of a tropical cyclone. However, a<br />
ship in the core should try to<br />
report every hour to provide the<br />
TPC (or other warning centers)<br />
with the best possible information.<br />
Peak conditions between reports<br />
Continued on Page 44<br />
December 1998 43
Time Lat. Lon. Wind Dir./ Pressure<br />
(UTC) ( O N) ( O W) Speed (kt) (mb)<br />
0900 29.7 74.7 050/60 997.7<br />
1200 29.7 74.9 060/75 980.3<br />
1500 29.2 75.3 290/50 965.8<br />
1800 29.1 74.9 200/70 991.0<br />
2100 29.3 74.2 180/50 1001.9<br />
Table 1. Meteorological data reported by the BRITISH HAWK during its<br />
encounter with Hurricane Bonnie, August 25, 1998.<br />
44 <strong>Mariners</strong> <strong>Weather</strong> <strong>Log</strong><br />
Marine <strong>Weather</strong> Review<br />
Tropical Prediction Center<br />
Continued from Page 43<br />
should be noted in plain language<br />
remarks whenever possible. If<br />
such observations are not possible,<br />
the ships’ Captain or weather<br />
observer could mail the TPC (or<br />
other warning centers) a log of the<br />
observations after the fact. This<br />
would prove useful in the TPC’s<br />
post-analysis of the storm.<br />
Continued on Page 45<br />
Figure 1. Preliminary tracks for Tropical Storm Alex and Hurricane Bonnie. Open circles represent tropical<br />
disturbance or tropical depression phase. Open symbols are tropical storm phase, while shaded symbols are<br />
hurricane phase.
Figure 2. GOES-8 infrared image at 1215 UTC 22 August. Hurricane<br />
Bonnie is near the southeastern Bahamas, while Tropical Storm charley is<br />
making landfall in Texas. Hurricane Howard is intensifying in the Pacific.<br />
Image courtesy of the National Climatic Data Center.<br />
Tropical Prediction Center<br />
Continued from Page 44<br />
III. Significant <strong>Weather</strong> of<br />
the Period<br />
A. Tropical Cyclones: The Atlantic<br />
produced two hurricanes and<br />
three other tropical storms during<br />
the May-August period, with the<br />
third storm (Earl) reaching hurricane<br />
strength in September. The<br />
Eastern Pacific produced eight<br />
named storms, of which five<br />
reached hurricane strength. There<br />
was also one Eastern Pacific<br />
tropical depression.<br />
All information on the storms is<br />
preliminary and all times are<br />
UTC.<br />
1. Atlantic<br />
Tropical Storm Alex: A tropical<br />
wave moved off the African coast<br />
on 26 July (Figure 1). It became<br />
Tropical Depression One near 12N<br />
27W the next day. Moving generally<br />
west, the cyclone reached<br />
tropical storm strength early on 29<br />
July. Alex continued generally<br />
west through 31 July, then turned<br />
west-northwest on 1 August. An<br />
unfavorable environment limited<br />
strengthening, and Alex reached a<br />
peak intensity of 45 kt during the<br />
30 July-1 August period. Steady<br />
weakening then occurred, and<br />
Alex dissipated near 21N 60W<br />
late on 2 August.<br />
Marine <strong>Weather</strong> Review<br />
Alex never affected land during its<br />
life, and most ships avoided the<br />
cyclone. However, ship FNPH<br />
(FORT DESAIX) reported 64 kt<br />
winds (believed to be convective<br />
gusts) north of the center at 1800<br />
UTC 1 August. <strong>Ship</strong>s ELLE9<br />
(CAPE HORN), 3ENX9 (ROYAL<br />
STAR), and ELVV2 (name<br />
unknown) encountered Alex just<br />
as it was developing, and their<br />
observations were invaluable in<br />
determining that a depression had<br />
formed.<br />
Hurricane Bonnie: A large<br />
tropical wave gradually organized<br />
over the eastern and central<br />
tropical Atlantic in mid-July. It<br />
became Tropical Depression Two<br />
near 16N 51W on 19 August<br />
(Figure 1). Moving rapidly westnorthwest,<br />
the system reached<br />
tropical storm strength just<br />
northeast of the Leeward Islands<br />
on 20 August. Bonnie continued a<br />
slower west-northwest track on<br />
21-22 August, with the storm<br />
reaching hurricane strength on 22<br />
August (Figure 2). The hurricane<br />
slowed to an erratic northwest<br />
drift on 23-24 August while just<br />
east of the Bahama Islands. It<br />
reached its peak intensity of 100<br />
kt on 24 August and maintained<br />
this intensity until it made landfall.<br />
A north-northwest motion<br />
developed on 25 August, with a<br />
turn to the north on 26 August.<br />
This brought Bonnie’s center to<br />
the North Carolina coast at Cape<br />
Fear late on 26 August.<br />
Bonnie slowed again as it made<br />
landfall and turned northeast. It<br />
Continued on Page 46<br />
December 1998 45
Tropical Prediction Center<br />
Continued from Page 45<br />
was not until early on 28 August<br />
that the center moved back into<br />
the Atlantic near Manteo, North<br />
Carolina. Bonnie weakened to a<br />
tropical storm over land, but<br />
regained minimal hurricane<br />
strength as it moved offshore.<br />
Slow weakening occurred as<br />
Bonnie moved generally northeast,<br />
with the storm passing just south<br />
of Sable Island early on 30<br />
August. Bonnie became extratropical<br />
later that day near 45N 52W.<br />
Bonnie’s large circulation affected<br />
the Leeward Islands, the Virgin<br />
Islands, Puerto Rico, the Bahamas,<br />
and the eastern parts of North and<br />
South Carolina. It also affected<br />
many ships, buoys, and automated<br />
stations besides the BRITISH<br />
HAWK. The Coastal Marine<br />
Automated Network (C-MAN)<br />
station at Frying Pan Shoals,<br />
North Carolina, reported a 10minute<br />
average wind of 76 kt,<br />
with a gust to 90 kt between 2000-<br />
2100 UTC 26 August. The station<br />
reported a minimum pressure of<br />
964.6 mb at 1700 UTC. The<br />
SABRINA reported 60 kt winds<br />
with 75 kt gusts on 26 August,<br />
along with 23-26 ft seas. An oil rig<br />
near Sable Island reported 65 kt<br />
winds above the surface at 0300<br />
UTC 30 August. Finally, a reconnaissance<br />
plane reported a 954 mb<br />
central pressure at 0151 UTC 24<br />
August.<br />
Bonnie is blamed for three deaths<br />
at this time. Damage figures are<br />
still incomplete, but may be in the<br />
hundreds of millions of dollars.<br />
46 <strong>Mariners</strong> <strong>Weather</strong> <strong>Log</strong><br />
Bonnie was one of the most<br />
researched hurricanes in history.<br />
Five <strong>NOAA</strong> and NASA research<br />
planes flew experimental missions<br />
in and around the storm. They<br />
were aided by the NASA Tropical<br />
Rainfall Measuring Mission<br />
(TRMM) satellite.<br />
Tropical Storm Charley: A<br />
tropical wave accompanied by a<br />
broad area of low pressure moved<br />
into the southeast Gulf of Mexico<br />
on 19 August. The low moved<br />
west-northwest and organized into<br />
a tropical depression near 26N<br />
95W on 21 August (Figure 3). The<br />
depression continued westnorthwest<br />
and became Tropical<br />
Storm Charley later that day.<br />
Charley steadily strengthened to a<br />
peak intensity of 50 kt as it made<br />
landfall on 22 August just north of<br />
Port Arkansas, Texas (Figure 2).<br />
The storm turned west and weak-<br />
Marine <strong>Weather</strong> Review<br />
ened to a low pressure area over<br />
south Texas later that day. While<br />
this was the end of Charley as a<br />
tropical cyclone, the remnant low<br />
continued to spread heavy rain<br />
through south Texas, causing<br />
severe flooding in Del Rio and<br />
elsewhere along the Rio Grande.<br />
Oil Rig K7R8 reported 40 kt<br />
winds with gusts to 50 kt above<br />
the surface at 1647 UTC 21<br />
August. Several additional reports<br />
of 40-60 kt gusts were received<br />
from the middle and upper Texas<br />
coast. Rockport, Texas, reported a<br />
1000.7 mb pressure at 1053 UTC<br />
22 August. There are no known<br />
ship reports of tropical stormforce<br />
winds.<br />
Charley is blamed for 21 deaths,<br />
mainly due to the severe flooding<br />
around Del Rio.<br />
Continued on Page 47<br />
Figure 3. Preliminary track for Tropical Storm Charley. Open circles<br />
represent tropical disturbance or tropical depression phase. Open symbols<br />
represent tropical storm phase.
Tropical Prediction Center<br />
Continued from Page 46<br />
Hurricane Danielle: A tropical<br />
wave over the eastern Atlantic<br />
organized into Tropical Depression<br />
Four near 14N 37W on 24<br />
August. The cyclone moved<br />
steadily west-northwest through<br />
29 August. The depression<br />
reached tropical storm strength<br />
later on 24 August and hurricane<br />
strength the next day. A peak<br />
intensity of 90 kt was estimated<br />
from satellite imagery on 26<br />
August. Danielle slowly weakened<br />
to a minimal hurricane by 30<br />
August due to a combination of<br />
unfavorable upper level winds and<br />
cold water left in the wake of<br />
Bonnie. Later on 30-31 August,<br />
Danielle gradually turned from a<br />
west-northwest to north-northeast<br />
track and re-intensified. At this<br />
time the storm was between the<br />
southeast United States and<br />
Bermuda (Figure 4).<br />
Danielle was a smaller storm than<br />
its predecessor Bonnie, and ships<br />
generally avoided it during this<br />
period. The ship P3ZH4<br />
(HYUNDAI TAKOMA) reported<br />
35 kt winds at 0600 UTC 31<br />
August.<br />
Hurricane Earl: A tropical wave<br />
that moved off the African coast in<br />
mid-August moved into the<br />
southwest Gulf of Mexico on 30<br />
August. An associated broad low<br />
pressure system organized into<br />
Tropical Depression Five near<br />
22N 94W on 31 August, and<br />
became Tropical Storm Earl later<br />
that day (Figure 4).<br />
Continued on Page 48<br />
Marine <strong>Weather</strong> Review<br />
Figure 4. GOES-8 visible image at 1815 UTC 31 August. Hurricane<br />
Danielle is off the southeast U.S. coast. Tropical Storm Earl is developing<br />
over the Gulf of Mexico. The cyclone forming south of Baja, California,<br />
would become Hurricane Isis in September. Image courtesy of the National<br />
Climatic Data Center.<br />
Figure 5. Preliminary tracks for Tropical Storm Agatha, Tropical<br />
Depression Two-E, Hurricane Blas, Tropical Storm Celia, and Hurricane<br />
Darby. Open circles represent tropical disturbance or tropical depression<br />
phase. Open symbols are tropical storm phase, while shaded symbols are<br />
hurricane phase.<br />
December 1998 47
Tropical Prediction Center<br />
Continued from Page 47<br />
2. Eastern Pacific<br />
Tropical Storm Agatha: A<br />
tropical wave crossed Central<br />
America on 7-8 June. This system<br />
slowly organized into Tropical<br />
Depression One-E near 12N 105W<br />
on 11 June (Figure 5). Further<br />
strengthening was slow, and the<br />
cyclone did not reach tropical<br />
storm strength until 13 June.<br />
Agatha reached a peak intensity of<br />
55 kt on 14 June, then steadily<br />
weakened until it dissipated near<br />
20N 123W on 16 June.<br />
Agatha was far from land, and no<br />
known ships encountered the<br />
storm.<br />
Tropical Depression Two-E:<br />
Tropical Depression Two-E<br />
formed near 15N 106W on 19<br />
June (Figure 5). The cyclone<br />
followed a general west-northwest<br />
track until it dissipated near 19N<br />
114W on 22 June. Maximum<br />
sustained winds were estimated at<br />
30 kt.<br />
Hurricane Blas: A tropical wave<br />
caused increasing convection off<br />
the Pacific coast of Central<br />
America on 19 June. The activity<br />
gradually organized and became<br />
Tropical Depression Three-E near<br />
8N 95W early on 22 June (Figure<br />
5). Moving generally westnorthwest<br />
to northwest, the<br />
cyclone reached tropical storm<br />
strength later that day and hurricane<br />
strength the next day. Blas<br />
continued strengthening to a peak<br />
intensity of 120 kt on 25 June.<br />
48 <strong>Mariners</strong> <strong>Weather</strong> <strong>Log</strong><br />
Weakening started on 26 June as<br />
Blas turned west, and Blas was<br />
downgraded to a tropical storm by<br />
28 June. The cyclone dissipated<br />
near 18N 132W on 30 June, with<br />
the residual low cloud swirl<br />
continuing west to south of the<br />
Hawaiian Islands by 5 July.<br />
<strong>Ship</strong>s avoided Blas, so there are<br />
no reports of tropical storm-force<br />
or greater winds. Blas may have<br />
indirectly enhanced rainfall over<br />
southern Mexico which led to<br />
mudslides that caused four<br />
deaths.<br />
Tropical Storm Celia: A tropical<br />
wave spawned a tropical disturbance<br />
south of the Gulf of<br />
Tehuantepec on 13 July. The<br />
disturbance tracked west-northwest<br />
with little development for<br />
the next three days. It became<br />
better organized on 17 July, and it<br />
became a tropical depression near<br />
17N 105W early that day. The<br />
cyclone reached tropical storm<br />
strength later that day. Celia<br />
turned west on 19 July as it<br />
reached a peak intensity of 50 kt.<br />
Weakening occurred after that,<br />
and Celia dissipated near 23N<br />
122W on 21 July.<br />
Several ships were caught between<br />
Celia and the Mexican<br />
coast. <strong>Ship</strong> KGTI (GREEN<br />
LAKE) reported 45 kt winds at<br />
1200 UTC 17 July, which was the<br />
basis for naming Celia. <strong>Ship</strong><br />
4XGX (ZIK ISRAEL) reported 50<br />
kt winds at 1700 UTC that day.<br />
Hurricane Darby: A tropical<br />
wave started showing increased<br />
organization south of Acapulco on<br />
Marine <strong>Weather</strong> Review<br />
19 July. Further development was<br />
slow, with the disturbance becoming<br />
a tropical depression early on<br />
23 July near 12N 111W. This<br />
system would follow a general<br />
west to west-northwest track<br />
during its lifetime. The cyclone<br />
reached tropical storm strength<br />
later on 23 July and hurricane<br />
strength on 24 July. Darby twice<br />
reached a peak intensity of 100 kt,<br />
first on 25 July then from 26-28<br />
July. The hurricane weakened to a<br />
tropical storm as it crossed into<br />
the Central Pacific Hurricane<br />
Center’s area of responsibility on<br />
29 July. Further weakening<br />
occurred, and Darby dissipated on<br />
1 August near 24N 154W.<br />
Darby was far from land and no<br />
known ships encountered the<br />
storm.<br />
Hurricane Estelle: Tropical<br />
Depression Six-E formed near<br />
15N 101W on 29 July. The<br />
depression moved west and<br />
reached tropical storm strength the<br />
next day. Estelle reached hurricane<br />
strength on 31 July while continuing<br />
west through 1 August. A peak<br />
intensity of 115 kt and a turn to<br />
the west-northwest occurred on<br />
2 August. A turn back to the west<br />
took place on 4 August as Estelle<br />
weakened to a tropical storm.<br />
Estelle weakened to a depression<br />
the next day, and the system<br />
dissipated over the Central Pacific<br />
near 23N 149W on 8 August.<br />
Estelle remained far from land and<br />
there are no reports of damage or<br />
casualties.<br />
Continued on Page 49
Tropical Prediction Center<br />
Continued from Page 48<br />
Tropical Storm Frank: A persistent<br />
area of disturbed weather<br />
associated with a tropical wave<br />
organized into a tropical depression<br />
near 17N 112W on 6 August.<br />
The depression moved generally<br />
north and reached tropical storm<br />
strength on 8 August. Frank<br />
reached a peak intensity of 40 kt<br />
early on 9 August just west of<br />
Baja California. The storm<br />
weakened and turned northwest<br />
later that day. It dissipated near<br />
29N 117W on 10 August.<br />
<strong>Ship</strong> C6LF9 (DOMINICA)<br />
reported 30-35 kt winds on 8-9<br />
August, which was the basis for<br />
upgrading the depression to a<br />
tropical storm. Frank affected<br />
southern and central Baja California<br />
and the adjacent Gulf of<br />
California with locally gusty<br />
winds and heavy rains. There are<br />
no reports of damage or casualties<br />
at this time.<br />
Hurricane Georgette: Tropical<br />
Depression Eight-E formed near<br />
12N 110W on 11 August. Moving<br />
west-northwest, the cyclone<br />
reached tropical storm strength<br />
later that day. Georgette followed<br />
a general west-northwest to<br />
northwest track for the rest of its<br />
life. The storm reached hurricane<br />
strength on 12 August and a peak<br />
intensity of 100 kt on 14 August.<br />
Steady weakening then developed,<br />
with Georgette becoming a<br />
tropical storm and then a depression<br />
on 16 August. The system<br />
dissipated early on 17 August near<br />
25N 127W.<br />
<strong>Ship</strong> KGTI (GREEN LAKE)<br />
reported 35 kt winds at 0600 UTC<br />
14 August. It and several other<br />
ships encountered large swells (up<br />
to 24 ft) generated by Georgette.<br />
There are no reports of damage or<br />
casualties at this time.<br />
Hurricane Howard: Tropical<br />
Depression Nine-E formed near<br />
11N 97W on 20 August. Moving<br />
west-northwest, the cyclone<br />
reached both tropical storm and<br />
hurricane strength the next day.<br />
Howard continued west-northwest<br />
as it strengthened to a peak<br />
intensity of 130 kt on 23 August.<br />
After a slight weakening, Howard<br />
reached a secondary peak intensity<br />
of 115 kt while turning west on 25<br />
August. The hurricane turned<br />
Marine <strong>Weather</strong> Review<br />
west-northwest and weakened on<br />
27 August. It fell to tropical storm<br />
status on 28 August and tropical<br />
depression status on 29 August.<br />
Howard dissipated on 30 August<br />
near 20N 134W.<br />
An unidentified ship reported 40<br />
kt winds and a 1005 mb pressure<br />
at 0000 UTC 21 August. There are<br />
no reports of damage or casualties<br />
at this time.<br />
B. Other Significant Events: A<br />
complex low pressure system<br />
centered north of the TPC area of<br />
responsibility affected the Atlantic<br />
north of 25N and west of 50W<br />
between 9-16 May. The lows<br />
produced 20-30 kt winds and 8-13<br />
ft seas across this region.h<br />
Figure 6. Preliminary tracks for Hurricane Estelle, Tropical Storm Fran,<br />
Hurricane Georgette, and Hurricane Howard. Open circles represent<br />
tropical disturbance or tropical depression phase. Open symbols are<br />
tropical storm phase, while shaded symbols are hurricane phase.<br />
December 1998 49
50 <strong>Mariners</strong> <strong>Weather</strong> <strong>Log</strong><br />
The chart on the left shows the two-month mean 500-mb height contours<br />
at 60 m intervals in solid lines, with alternate contours labeled in<br />
decameters (dm). Height anomalies are contoured in dashed lines at<br />
30 m intervals. Areas where the mean height anomaly was greater than<br />
30 m above normal have light shading, and areas where the mean height<br />
anomaly was more than 30 m below normal have heavy shading<br />
The chart on the right shows the two-month mean sea level pressure at<br />
4-mb intervals in solid lines, labeled in mb. Anomalies of SLP are<br />
contoured in dashed lines and labeled at 2-mb intervals, with light<br />
shading in areas more than 2 mb above normal, and heavy shading in<br />
areas in excess of 2 mb below normal.<br />
Marine <strong>Weather</strong> Review
December 1998 51<br />
The chart on the left shows the two-month mean 500-mb height contours<br />
at 60 m intervals in solid lines, with alternate contours labeled in<br />
decameters (dm). Height anomalies are contoured in dashed lines at<br />
30 m intervals. Areas where the mean height anomaly was greater than<br />
30 m above normal have light shading, and areas where the mean height<br />
anomaly was more than 30 m below normal have heavy shading<br />
The chart on the right shows the two-month mean sea level pressure at<br />
4-mb intervals in solid lines, labeled in mb. Anomalies of SLP are<br />
contoured in dashed lines and labeled at 2-mb intervals, with light<br />
shading in areas more than 2 mb above normal, and heavy shading in<br />
areas in excess of 2 mb below normal.<br />
Marine <strong>Weather</strong> Review
<strong>Voluntary</strong> <strong>Observing</strong> <strong>Ship</strong> <strong>Program</strong><br />
Martin S. Baron<br />
National <strong>Weather</strong> Service<br />
Silver Spring, Maryland<br />
NWS <strong>Observing</strong> Handbook No. 1 to be Updated<br />
52 <strong>Mariners</strong> <strong>Weather</strong> <strong>Log</strong><br />
VOS <strong>Program</strong><br />
We are working to update the 1995 edition of NWS <strong>Observing</strong> Handbook No. 1, Marine Surface <strong>Weather</strong><br />
Observations. The revised edition should be ready Fall 1999.<br />
While there have been no code changes since the 1995 edition was published, we are making some corrections<br />
and adding new material. As a result of GMDSS implementation, there have been many changes to<br />
<strong>Ship</strong>board communication methods, so we have rewritten Chapter 3, “Transmitting The Observation.” Here<br />
are highlights of the changes to be incorporated in the new edition.<br />
Pages 2-7 — We have corrected a mistake here: i w is reported as 3 or 4, not as 03 or 04 as indicated in the<br />
August 1995 edition. Under How To Code, the new text will be:<br />
U.S. VOS <strong>Program</strong> vessels report wind speed in knots. Use 3 when estimating wind speed in knots, or 4 when<br />
measuring wind speed with an anemometer in knots.<br />
Some vessels in foreign VOS programs report wind speed in meters per second. These vessels should use 0<br />
when estimating wind speed in meters per second, or 1 when measuring wind speed with an anemometer in<br />
meters per second.<br />
Code<br />
Figure<br />
0 Wind speed estimated in meters per second<br />
1 Wind speed obtained from anemometer in meters per second<br />
3 Wind Speed estimated in knots<br />
4 Wind Speed obtained from anemometer in knots<br />
Pages 2-40 — We have added information on how Great Lakes vessels should report sea level pressure. The<br />
text being added is:<br />
For Great Lakes vessels: PMOs in Cleveland and Chicago calibrate your barometers to read sea level pressure<br />
using the elevation of Lake Erie in the correction factor. From other Great Lakes, to obtain sea level pressure<br />
Continued on Page 53
VOS <strong>Program</strong><br />
Continued from Page 52<br />
VOS <strong>Program</strong><br />
you must know the difference in elevation between Lake Erie and the lake your on, and add or subtract a<br />
correction.<br />
From Lake Huron or Lake Michigan (both 10 feet above Lake Erie), please add .4 hp to your pressure reading<br />
before reporting. For Lake Superior (30 feet above Lake Erie), add 1.1 hp. For Lake Ontario (325 feet below<br />
Lake Erie), subtract 12 hp.<br />
Chapter 3, “Transmitting The Observation” — We have rewritten the entire chapter. Highlights from the<br />
new chapter include:<br />
STATIONS ACCEPTING VOS WEATHER OBSERVATIONS<br />
<strong>Weather</strong> observations sent by ships participating in the VOS program are sent at no cost to the ship except as<br />
noted.<br />
The stations listed accept weather observations which enter an automated system at National <strong>Weather</strong> Service<br />
headquarters. This system is not intended for other types of messages. To communicate with NWS personnel,<br />
see phone numbers and e-mail addresses at the beginning of this manual.<br />
INMARSAT<br />
Follow the instructions with your INMARSAT terminal for sending a telex message. Use the special dialing<br />
code 41 (except when using the SEAS/AMVER software in compressed binary format with INMARSAT C),<br />
and do not request a confirmation. Here is a typical procedure for using an INMARSAT transceiver:<br />
1. Select appropriate Land Earth Station Identity (LES-ID). See the table below.<br />
2. Select routine priority.<br />
3. Select duplex telex channel.<br />
4. Initiate the call. Wait for the GA+ signal.<br />
5. Select the dial code for meteorological reports, 41+.<br />
6. Upon receipt of our answerback, NWS OBS MHTS, transmit the weather message starting with<br />
BBXX and the ship’s call sign. The message must be ended with 5 periods. Do not send any<br />
preamble.<br />
GA+<br />
41+<br />
NWS OBS MHTS<br />
BBXX WLXX 29003 99131 70808 41998 60909 10250 2021/ 4011/ 52003 71611 85264 22234<br />
00261 20201 31100 40803.....<br />
The 5 periods indicate the end of the message, and must be included after each report. Do not request<br />
a confirmation.<br />
Continued on Page 54<br />
December 1998 53
VOS <strong>Program</strong><br />
Continued from Page 53<br />
54 <strong>Mariners</strong> <strong>Weather</strong> <strong>Log</strong><br />
VOS <strong>Program</strong><br />
Land-Earth Station Identify (LES-ID) of the U.S. INMARSAT stations Accepting <strong>Ship</strong>s <strong>Weather</strong><br />
(BBXX) and Oceanographic (JJYY) Reports<br />
Station ID<br />
Operator Service AOR-W AOR-E IOR POR<br />
COMSAT A 01 01 01 01<br />
COMSAT B 01 01 01 01<br />
COMSAT C 001 101 321 201<br />
COMSAT C (AMVER/SEAS) 001 101 321 201<br />
STRATOS/IDB A (octal ID) 13-1 13-1 13-1 13-1<br />
STRATOS/IDB A (decimal ID) 11-1 11-1 11-1 11-1<br />
STRATOS/IDB B 013 013 013 013<br />
Use abbreviated dialing code 41.<br />
Do not request a confirmation<br />
If your ship’s Inmarsat terminal does not contain a provision for using abbreviated dialing code 41, TELEX<br />
address 0023089406 may be used via COMSAT. Please note that the ship will incur telecommunication<br />
charges for any messages sent to TELEX address 0023089406 using any Inmarsat earth station other than<br />
COMSAT.<br />
Some common mistakes include: (1) failure to end the message with five periods when using INMARSAT A,<br />
(2) failure to include BBXX in the message preamble, (3) incorrectly coding the Date, Time, Latitude,<br />
Longitude, or quadrant of the globe, (4) requesting a confirmation (which increases cost to NWS).<br />
Using The SEAS/AMVER Software<br />
The National Oceanic and Atmospheric Administration (<strong>NOAA</strong>) in cooperation with the U.S. Coast Guard<br />
Automated Mutual-assistance VEssel Rescue program (AMVER) and COMSAT, has developed a PC software<br />
package known as AMVER/SEAS which simplifies the creation of AMVER and meteorological<br />
(BBXX) reports. The U.S. Coast Guard is able to accept, at no cost to the ship, AMVER reports transmitted<br />
via Inmarsat-C in a compressed binary format, created using the AMVER/SEAS program. Typically, in the<br />
past, the cost of transmission for AMVER messages has been assumed by the vessel. When ships participate<br />
in both the SEAS and AMVER programs, the position of ship provided in the meteorological report is<br />
forwarded to the Coast Guard as a supplementary AMVER position report to maintain a more accurate plot.<br />
To obtain the AMVER/SEAS program contact your U.S. PMO or AMVER/SEAS representative listed at the<br />
beginning of this handbook.<br />
If using the <strong>NOAA</strong> AMVER/SEAS software, follow the instructions outlined in the AMVER/SEAS User’s<br />
Manual. When using Inmarsat-C, use the compressed binary format and 8-bit X.25 (PSDN) addressing<br />
(31102030798481), rather than TELEX if possible when reporting weather.<br />
Common errors when using the AMVER/SEAS include sending the compressed binary message via the code<br />
41 or a plain text message via the X.25 address. Only COMSAT can accept messages in the compressed<br />
Continued on Page 55
VOS <strong>Program</strong><br />
Continued from Page 54<br />
VOS <strong>Program</strong><br />
binary format. Text editors should not be utilized in sending the data in the compressed binary format as this<br />
will corrupt the message.<br />
Telephone (Landline, Cellular, Satphone, Etc.)<br />
The following stations will accept VOS weather observations via telephone. Please note that the ship will<br />
be responsible for the cost of the call in this case.<br />
GLOBE WIRELESS 650-726-6588<br />
MARITEL 228-897-7700<br />
WLO 334-666-5110<br />
The National <strong>Weather</strong> Service is developing a dial-in bulletin board to accept weather observations using a<br />
simple PC program and modem. The ship will be responsible for the cost of the call when using this<br />
system. For details contact:<br />
CDR Tim Rulon, <strong>NOAA</strong><br />
W/OM12 SSMC2 Room 14114<br />
1325 East-West Highway<br />
Silver Spring, MD 20910 USA<br />
301-713-1677 Ext. 128<br />
301-713-1598 (Fax)<br />
timothy.rulon@noaa.gov<br />
marine.weather@noaa.gov<br />
Reporting Through United States Coast Guard Stations<br />
U.S. Coast Guard stations accept SITOR (preferred) or voice radiotelephone weather reports. Begin with the<br />
BBXX indicator, followed by the ships call sign and the weather message.<br />
U.S. Coast Guard High Seas Communication Stations<br />
<strong>Ship</strong> <strong>Ship</strong><br />
SEL ITU Xmit Rec<br />
Location (CALL) Mode CAL MMSI # CH# Freq Freq Watch<br />
Boston (NMF) Voice 003669991 424 4134 4426 Night 3<br />
Boston (NMF) Voice 003669991 601 6200 6501 24Hr<br />
Boston (NMF) Voice 003669991 816 8240 8764 24Hr<br />
Boston (NMF) Voice 003669991 1205 12242 13089 Day 3<br />
Chesapeake (NMN) SITOR 1097 604 6264.5 6316 Night 2<br />
Chesapeake (NMN) SITOR 1097 824 8388 8428 24Hr<br />
Chesapeake (NMN) SITOR 1097 1227 12490 12592.5 24hr<br />
Chesapeake (NMN) SITOR 1097 1627 16696.5 16819.5 24Hr<br />
Chesapeake (NMN) SITOR 1097 2227 22297.5 22389.5 Day 2<br />
Chesapeake (NMN) Voice 003669995 424 4134 4426 Night 2<br />
Continued on Page 56<br />
December 1998 55
VOS <strong>Program</strong><br />
Continued from Page 55<br />
56 <strong>Mariners</strong> <strong>Weather</strong> <strong>Log</strong><br />
VOS <strong>Program</strong><br />
<strong>Ship</strong> <strong>Ship</strong><br />
SEL ITU Xmit Rec<br />
Location (CALL) Mode CAL MMSI # CH# Freq Freq Watch<br />
Chesapeake (NMN) Voice 003669995 601 6200 6501 24Hr<br />
Chesapeake (NMN) Voice 003669995 816 8240 8764 24Hr<br />
Chesapeake (NMN) Voice 003669995 1205 12242 13089 Day 2<br />
Miami (NMA) Voice 003669997 601 6200 6501 24Hr<br />
Miami (NMA) Voice 003669997 1205 12242 13089 24Hr<br />
Miami (NMA) Voice 003669997 1625 16432 17314 24Hr<br />
New Orleans (NMG) Voice 003669998 424 4134 4426 24Hr<br />
New Orleans (NMG) Voice 003669998 601 6200 6501 24Hr<br />
New Orleans (NMG) Voice 003669998 816 8240 8764 24Hr<br />
New Orleans (NMG) Voice 003669998 1205 12242 13089 24Hr<br />
Kodiak (NOJ) SITOR 1106 407 4175.5 4213.5 Night<br />
Kodiak (NOJ) SITOR 1106 607 6266 6317.5 24Hr<br />
Kodiak (NOJ) SITOR 1106 807 8379.5 8419.5 Day<br />
Kodiak (NOJ) Voice 003669899 1 *** 4125 4125 24Hr<br />
Kodiak (NOJ) Voice 003669899 1 601 6200 6501 24Hr<br />
Pt. Reyes (NMC) SITOR 1096 620 6272.5 6323.5 Night<br />
Pt. Reyes (NMC) SITOR 1096 820 8386 8426 24Hr<br />
Pt. Reyes (NMC) SITOR 1096 1620 16693 16816.5 Day<br />
Pt. Reyes (NMC) Voice 003669990 424 4134 4426 24Hr<br />
Pt. Reyes (NMC) Voice 003669990 601 6200 6501 24Hr<br />
Pt. Reyes (NMC) Voice 003669990 816 8240 8764 24Hr<br />
Pt. Reyes (NMC) Voice 003669990 1205 12242 13089 24Hr<br />
Honolulu (NMO) SITOR 1099 827 8389.5 8429.5 24hr<br />
Honolulu (NMO) SITOR 1099 1220 12486.5 12589 24hr<br />
Honolulu (NMO) SITOR 1099 2227 22297.5 22389.5 Day<br />
Honolulu (NMO) Voice 003669993 1 424 4134 4426 Night 4<br />
Honolulu (NMO) Voice 003669993 1 601 6200 6501 24Hr<br />
Honolulu (NMO) Voice 003669993 1 816 8240 8764 24Hr<br />
Honolulu (NMO) Voice 003669993 1 1205 12242 13089 Day 4<br />
Guam (NRV) SITOR 1100 812 8382 8422 24hr<br />
Guam (NRV) SITOR 1100 1212 12482.5 12585 Night<br />
Guam (NRV) SITOR 1100 1612 16689 16812.5 24hr<br />
Guam (NRV) SITOR 1100 2212 22290 22382 Day<br />
Guam (NRV) Voice 003669994 1 601 6200 6501 Night 5<br />
Guam (NRV) Voice 003669994 1 1205 12242 13089 Day 5<br />
1 MF/HF DSC has not yet been implemented at these stations.<br />
2 2300-1100 UTC Nights, 1100-2300 UTC Days<br />
3 2230-1030 UTC Nights, 1030-2230 UTC Days<br />
4 0600-1800 UTC Nights, 1800-0600 UTC Days<br />
5 0900-2100 UTC Nights, 2100-0900 UTC Days<br />
Stations also maintain an MF/HF DSC watch on the following frequencies: 2187.5 kHz, 4207.5 kHz, 6312<br />
khz, 8414.5 Khz, 12577 kHz and 16804.5 kHz.<br />
Voice frequencies are carrier (dial) frequencies. SITOR and DSC frequencies are assigned frequencies.<br />
Continued on Page 57
VOS <strong>Program</strong><br />
Continued from Page 56<br />
Note that some stations share common frequencies.<br />
VOS <strong>Program</strong><br />
An automated watch is kept on SITOR. Type “HELP+” for the of instructions or “OBS+” to send the weather<br />
report.<br />
For the latest information on Coast Guard frequencies, visit their webpage at: http://www.navcen.uscg.mil/<br />
marcomms<br />
U.S. Coast Guard Group Communication Stations<br />
U.S. Coast Guard Group communication stations monitor VHF marine channels 16 and 22A and/or MF<br />
radiotelephone frequency 2182 kHz (USB). Great Lakes stations do not have MF installations.<br />
The following stations have MF DSC installations and also monitor 2187.5 kHz DSC. Additional stations are<br />
planned. Note that although a station may be listed as having DSC installed, that installation may not have yet<br />
been declared operational. The U.S. Coast Guard is not expected to have the MF DSC network installed and<br />
declared operational until 2003 or thereafter.<br />
The U.S. Coast Guard is not expected to have an VHF DSC network installed and declared operational until<br />
2005 or thereafter.<br />
STATION MMSI #<br />
CAMSLANT Chesapeake VA MF/HF -- 003669995<br />
COMMSTA Boston MA MF/HF Remoted to CAMSLANT 003669991<br />
COMMSTA Miami FL MF/HF Remoted to CAMSLANT 003669997<br />
COMMSTA New Orleans LA MF/HF Remoted to CAMSLANT 003669998<br />
CAMSPAC Pt Reyes CA MF/HF -- 003669990<br />
COMMSTA Honolulu HI MF/HF Remoted to CAMSPAC 003669993<br />
COMMSTA Kodiak AK MF/HF -- 003669899<br />
Group Atlantic City NJ MF 003669903<br />
Group Cape Hatteras NC MF 003669906<br />
Group Southwest Harbor MF 003669921<br />
Group Eastern Shore VA MF 003669932<br />
Group Mayport FL MF 003669925<br />
Group Long Island Snd MF 003669931<br />
Act New York NY MF 003669929<br />
Group Ft Macon GA MF 003669920<br />
Group Astoria OR MF 003669910<br />
Reporting Through Specified U.S. Commercial Radio Stations<br />
If a U.S. Coast Guard station cannot be communicated with, and your ship is not INMARSAT equipped, U.S.<br />
commercial radio stations can be used to relay your weather observations to the NWS. When using SITOR,<br />
use the command “OBS +”, followed by the BBXX indicator and the weather message. Example:<br />
OBS + BBXX WLXX 29003 99131 70808 41998 60909 10250 2021/ 40110 52003 71611 85264 22234<br />
00261 20201 31100 40803<br />
Continued on Page 58<br />
December 1998 57
VOS <strong>Program</strong><br />
Continued from Page 57<br />
58 <strong>Mariners</strong> <strong>Weather</strong> <strong>Log</strong><br />
VOS <strong>Program</strong><br />
Commercial stations affiliated with Globe Wireless (KFS, KPH, WNU, WCC, etc.) accept weather messages<br />
via SITOR or morse code (not available at all times).<br />
Commercial Stations affiliated with Mobile Marine Radio, Inc. (WLO, KLB, WSC) accept weather<br />
messages via SITOR, with Radiotelephone and Morse Code (weekdays from 1300-2100 UTC only) also<br />
available as backups.<br />
MARITEL Marine Communication System accepts weather messages via VHF marine radiotelephone<br />
from near shore (out 50-60 miles), and from the Great Lakes.<br />
Globe Wireless<br />
<strong>Ship</strong> <strong>Ship</strong><br />
SEL ITU Xmit Rec<br />
Location (CALL) Mode CAL MMSI# CH# Freq Freq Watch<br />
Slidell, (WNU) SITOR 401 4172.5 4210.5 24Hr<br />
Louisina (WNU) SITOR 4200.5 4336.4 24Hr<br />
(WNU) SITOR 627 6281 6327 24Hr<br />
(WNU) SITOR 819 8385.5 8425.5 24Hr<br />
(WNU) SITOR 1257 12505 12607.5 24Hr<br />
(WNU) SITOR 1657 16711.5 16834.5 24Hr<br />
Barbados, (8PO) SITOR 409 4176.5 4214.5 24Hr<br />
(8PO) SITOR 634 6284.5 6330.5 24Hr<br />
(8PO) SITOR 834 8393 8433 24Hr<br />
(8PO) SITOR 1273 12513 12615.5 24Hr<br />
(8PO) SITOR 1671 16718.5 16841.5 24Hr<br />
San (KPH) SITOR 413 4178.5 4216 24Hr<br />
Fransisco, (KPH) SITOR 613 6269 6320 24Hr<br />
California (KPH) SITOR 813 8382.5 8422.5 24Hr<br />
(KPH) SITOR 822 8387 8427 24Hr<br />
(KPH) SITOR 1213 12483 12585.5 24Hr<br />
(KPH) SITOR 1222 12487.5 12590 24Hr<br />
(KPH) SITOR 1242 12497.5 12600 24Hr<br />
(KPH) SITOR 1622 16694 16817.5 24Hr<br />
(KPH) SITOR 2238 22303 22395 24Hr<br />
(KFS) SITOR 403 4173.5 4211.5 24Hr<br />
(KFS) SITOR 6253.5 436.4 24Hr<br />
(KFS) SITOR 603 6264 6315.5 24Hr<br />
(KFS) SITOR 8323.5 8526.4 24Hr<br />
(KFS) SITOR 803 8377.5 8417.5 24Hr<br />
(KFS) SITOR 1203 12478 12580.5 24Hr<br />
(KFS) SITOR 1247 12500 12602.5 24Hr<br />
(KFS) SITOR 16608.5 17211.4 24Hr<br />
(KFS) SITOR 1647 16706.5 16829.5 24Hr<br />
(KFS) SITOR 2203 22285.5 22377.5 24Hr<br />
Hawaii (KEJ) SITOR 4154.5 4300.4 24Hr<br />
(KEJ) SITOR 625 6275 6326 24Hr<br />
(KEJ) SITOR 830 8391 8431 24Hr<br />
(KEJ) SITOR 1265 12509 12611.5 24Hr<br />
(KEJ) SITOR 1673 16719.5 16842.5 24Hr<br />
Delaware, (WCC) SITOR 6297 6334 24Hr<br />
USA (WCC) SITOR 816 8384 8424 24Hr<br />
Continued on Page 59
VOS <strong>Program</strong><br />
Continued from Page 58<br />
VOS <strong>Program</strong><br />
<strong>Ship</strong> <strong>Ship</strong><br />
SEL ITU Xmit Rec<br />
Location (CALL) Mode CAL MMSI# CH# Freq Freq Watch<br />
(WCC) SITOR 1221 12487 12589.5 24Hr<br />
(WCC) SITOR 1238 12495.5 12598 24Hr<br />
(WCC) SITOR 1621 16693.5 16817 24Hr<br />
Argentina (LSD836) SITOR 4160.5 4326 24Hr<br />
(LSD836) SITOR 8311.5 8459 24Hr<br />
(LSD836) SITOR 12379.5 12736 24Hr<br />
(LSD836) SITOR 16560.5 16976 24Hr<br />
(LSD836) SITOR 18850.5 19706 24Hr<br />
Guam (KHF) SITOR 605 6265 316.5 24Hr<br />
(KHF) SITOR 808 8380 8420 24Hr<br />
(KHF) SITOR 1301 12527 12629 24Hr<br />
(KHF) SITOR 1726 16751 16869 24Hr<br />
(KHF) SITOR 1813 18876.5 19687 24Hr<br />
(KHF) SITOR 2298 22333 22425 24Hr<br />
Newfoundland, (VCT) SITOR 414 4179 4216.5 24Hr<br />
Canada (VCT) SITOR 416 4180 4217.5 24Hr<br />
(VCT) SITOR 621 6273 6324 24Hr<br />
(VCT) SITOR 632 6283.5 6329.5 24Hr<br />
(VCT) SITOR 821 8386.5 8426.5 24Hr<br />
(VCT) SITOR 838 8395 8435 24Hr<br />
(VCT) SITOR 1263 12508 12610.5 24Hr<br />
(VCT) SITOR 1638 16702 16825 24Hr<br />
Cape Town, (ZSC) SITOR 408 4176 4214 24Hr<br />
South Africa (ZSC) SITOR 617 6271 6322 24Hr<br />
(ZSC) SITOR 831 8391.5 8431.5 24Hr<br />
(ZSC) SITOR 1244 12498.5 12601 24Hr<br />
(ZSC) SITOR 1619 16692.5 16816 24Hr<br />
(ZSC) SITOR 1824 18882 19692.5 24Hr<br />
Bahrain, (A9M) SITOR 419 4181.5 4219 24Hr<br />
Arabian Gulf (A9M) SITOR 8302.5 8541 24Hr<br />
(A9M) SITOR 12373.5 12668 24Hr<br />
(A9M) SITOR 16557.5 17066.5 24Hr<br />
(A9M) SITOR 18853.5 19726 24Hr<br />
Gothenburg, (SAB) SITOR 228 2155.5 1620.5 24Hr<br />
Sweden (SAB) SITOR 4166.5 4259 24Hr<br />
(SAB) SITOR 626 6275.5 6326.5 24Hr<br />
(SAB) SITOR 837 8394.5 8434.5 24Hr<br />
(SAB) SITOR 1291 12522 12624 24Hr<br />
(SAB) SITOR 1691 16728.5 16851.5 24Hr<br />
Norway (LFI) SITOR 2653 1930 24Hr<br />
(LFI) SITOR 4154.5 4339 24Hr<br />
(LFI) SITOR 6250.5 6467 24Hr<br />
(LFI) SITOR 8326.5 8683.5 24Hr<br />
(LFI) SITOR 12415.5 12678 24Hr<br />
(LFI) SITOR 16566.5 17204 24Hr<br />
Awanui, (ZLA) SITOR 402 4173 4211 24Hr<br />
New Zealand (ZLA) SITOR 602 6263.5 6315 24Hr<br />
(ZLA) SITOR 802 8377 8417 24Hr<br />
(ZLA) SITOR 1202 12477.5 12580 24Hr<br />
(ZLA) SITOR 1602 16684 16807.5 24Hr<br />
Continued on Page 60<br />
December 1998 59
VOS <strong>Program</strong><br />
Continued from Page 59<br />
60 <strong>Mariners</strong> <strong>Weather</strong> <strong>Log</strong><br />
VOS <strong>Program</strong><br />
<strong>Ship</strong> <strong>Ship</strong><br />
SEL ITU Xmit Rec<br />
Location (CALL) Mode CAL MMSI# CH# Freq Freq Watch<br />
(ZLA) SITOR 18859.5 19736.4 24Hr<br />
Perth, (VIP) SITOR 406 4175 4213 24Hr<br />
Western (VIP) SITOR 806 8379 8419 24Hr<br />
Austrailia (VIP) SITOR 1206 12479.5 12582 24Hr<br />
(VIP) SITOR 1210 12481.5 12584 24Hr<br />
(VIP) SITOR 1606 16686 16809.5 24Hr<br />
The frequencies listed are used by the stations in the Global Radio network for both SITOR and GlobeEmail.<br />
Stations listed as being 24hr may not be operational during periods of poor propagation.<br />
For the latest information on Globe Wireless frequencies, visit their webpage at: http://www.globewireless.<br />
com.<br />
Stations and channels are added regularly. Contact any Globe Wireless station/channel or visit the website for<br />
an updated list. Information on Morse frequencies available upon request.<br />
Mobile Marine Radio Inc.<br />
<strong>Ship</strong> <strong>Ship</strong><br />
SEL ITU Xmit Rec<br />
Location (CALL) Mode CAL MMSI# CH# Freq Freq Watch<br />
Mobile, AL (WLO) SITOR 1090 003660003 406 4175 4213 24Hr<br />
(WLO) SITOR 1090 003660003 410 4177 4215 24Hr<br />
(WLO) SITOR 1090 003660003 417 4180.5 4218 24Hr<br />
(WLO) SITOR 1090 003660003 606 6265.5 6317 24hr<br />
(WLO) SITOR 1090 003660003 610 6267.5 6319 24hr<br />
(WLO) SITOR 1090 003660003 615 6270 6321 24hr<br />
(WLO) SITOR 1090 003660003 624 6274.5 6325.5 24Hr<br />
(WLO) SITOR 1090 003660003 806 8379 8419 24Hr<br />
(WLO) SITOR 1090 003660003 810 8381 8421 24hr<br />
(WLO) SITOR 1090 003660003 815 8383.5 8423.5 24hr<br />
(WLO) SITOR 1090 003660003 829 8390.5 8430.5 24Hr<br />
(WLO) SITOR 1090 003660003 832 8392 8432 24Hr<br />
(WLO) SITOR 1090 003660003 836 8394 8434 24Hr<br />
(WLO) SITOR 1090 003660003 1205 12479 12581.5 24Hr<br />
(WLO) SITOR 1090 003660003 1211 12482 12584.5 24Hr<br />
(WLO) SITOR 1090 003660003 1215 12484 12586.5 24Hr<br />
(WLO) SITOR 1090 003660003 1234 12493.5 12596 24Hr<br />
(WLO) SITOR 1090 003660003 1240 12496.5 12599 24Hr<br />
(WLO) SITOR 1090 003660003 1251 12502 12604.5 24Hr<br />
(WLO) SITOR 1090 003660003 1254 12503.5 12606 24Hr<br />
(WLO) SITOR 1090 003660003 1261 12507 12609.5 24hr<br />
(WLO) SITOR 1090 003660003 1605 16685.5 16809 24hr<br />
(WLO) SITOR 1090 003660003 1611 16688.5 16812 24Hr<br />
(WLO) SITOR 1090 003660003 1615 16690.5 16814 24Hr<br />
(WLO) SITOR 1090 003660003 1625 16695.5 16818.5 24Hr<br />
(WLO) SITOR 1090 003660003 1640 16703 16826 24Hr<br />
Continued on Page 61
VOS <strong>Program</strong><br />
Continued from Page 60<br />
VOS <strong>Program</strong><br />
<strong>Ship</strong> <strong>Ship</strong><br />
SEL ITU Xmit Rec<br />
Location (CALL) Mode CAL MMSI# CH# Freq Freq Watch<br />
(WLO) SITOR 1090 003660003 1644 16705 16828 24Hr<br />
(WLO) SITOR 1090 003660003 1661 16713.5 16836.5 24Hr<br />
(WLO) SITOR 1090 003660003 1810 18875 19685.5 24Hr<br />
(WLO) SITOR 1090 003660003 2210 22289 22381 24Hr<br />
(WLO) SITOR 1090 003660003 2215 22291.5 22383.5 24Hr<br />
(WLO) SITOR 1090 003660003 2254 22311 22403 24Hr<br />
(WLO) SITOR 1090 003660003 2256 22312 22404 24Hr<br />
(WLO) SITOR 1090 003660003 2260 22314 22406 24Hr<br />
(WLO) SITOR 1090 003660003 2262 22315 22407 24Hr<br />
(WLO) SITOR 1090 003660003 2272 22320 22412 24Hr<br />
(WLO) SITOR 1090 003660003 2284 22326 22418 24Hr<br />
(WLO) SITOR 1090 003660003 2510 25177.5 26105.5 24Hr<br />
(WLO) SITOR 1090 003660003 2515 25180 26108 24Hr<br />
(WLO) DSC 003660003 4208 4219 24Hr<br />
(WLO) DSC 003660003 6312.5 6331.0 24Hr<br />
(WLO) DSC 003660003 8415 8436.5 24Hr<br />
(WLO) DSC 003660003 12577.5 12657 24Hr<br />
(WLO) DSC 003660003 16805 16903 24Hr<br />
(WLO) Voice 003660003 405 4077 4369 24Hr<br />
(WLO) Voice 414 4104 4396 24Hr<br />
(WLO) Voice 419 4119 4411 24Hr<br />
(WLO) Voice 003660003 607 6218 6519 24Hr<br />
(WLO) Voice 003660003 824 8264 8788 24Hr<br />
(WLO) Voice 829 8279 8803 24Hr<br />
(WLO) Voice 830 8282 8806 24Hr<br />
(WLO) Voice 003660003 1212 12263 13110 24Hr<br />
(WLO) Voice 1226 12305 13152 24Hr<br />
(WLO) Voice 1607 16378 17260 24Hr<br />
(WLO) Voice 1641 16480 17362 24Hr<br />
(WLO) VHF Voice CH 25,84 24Hr<br />
(WLO) DSC Call 003660003 CH 70 24Hr<br />
(WLO) DSC Work 003660003 CH 84 24Hr<br />
(WLO) CW 434 434 Day<br />
(WLO) CW 4250 4250 Day<br />
(WLO) CW 6446.5 6446.5 Day<br />
(WLO) CW 8445 8445 Day<br />
(WLO) CW 8472 8472 Day<br />
(WLO) CW 8534 8534 Day<br />
(WLO) CW 8658 8658 Day<br />
(WLO) CW 12660 12660 Day<br />
(WLO) CW 12704.5 12704.5 Day<br />
(WLO) CW 13024.9 13024.9 Day<br />
(WLO) CW 16969 16969 Day<br />
(WLO) CW 17173.5 17173.5 Day<br />
(WLO) CW 22686.5 22686.5 Day<br />
Tuckerton, (WSC) SITOR 1108 419 4181.5 4219 24Hr<br />
NJ (WSC) SITOR 1108 832 8392 8432 24Hr<br />
(WSC) SITOR 1108 1283 12518 12620.5 24Hr<br />
(WSC) SITOR 1108 1688 16727 16850 24Hr<br />
(WSC) SITOR 1108 1805 18872.5 19683 24Hr<br />
Continued on Page 62<br />
December 1998 61
VOS <strong>Program</strong><br />
Continued from Page 61<br />
<strong>Ship</strong> <strong>Ship</strong><br />
SEL ITU Xmit Rec<br />
Location (CALL) Mode CAL MMSI# CH# Freq Freq Watch<br />
(WSC) SITOR 1108 2295 22331.5 22423.5 24Hr<br />
(WSC) CW 482 482 24Hr<br />
(WSC) CW 4316 4316 24Hr<br />
(WSC) CW 6484.5 6484.5 24Hr<br />
(WSC) CW 8680 8680 24Hr<br />
(WSC) CW 12789.5 12789.5 24Hr<br />
(WSC) CW 16916.5 16916.5 24Hr<br />
Seattle, WA (KLB) SITOR 1113 408 4176 4214 24Hr<br />
(KLB) SITOR 1113 608 6266.5 6318 24Hr<br />
(KLB) SITOR 1113 818 8385 8425 24Hr<br />
(KLB) SITOR 1113 1223 12488 12590.5 24Hr<br />
(KLB) SITOR 1113 1604 16685 16808.5 24Hr<br />
(KLB) SITOR 1113 2240 22304 22396 24Hr<br />
(KLB) CW 488 488 24Hr<br />
(KLB) CW 4348.5 4348.5 24Hr<br />
(KLB) CW 8582.5 8582.5 24Hr<br />
(KLB) CW 12917 12917 24Hr<br />
(KLB) CW 17007.7 17007.7 24Hr<br />
(KLB) CW 22539 22539 24Hr<br />
WLO Radio is equipped with an operational Thrane & Thrane TT-6200A DSC system for VHF and MF/HF<br />
general purpose digital selective calling communications.<br />
To call a Mobile Marine Radio Inc. coast station facility on Morse Code ‘CW’, use a frequency from the<br />
worldwide channels listed below.<br />
CW Calling Frequencies: 4184.0, 6276.0, 8368.0, 12552.0, 16736.0, 22280.5, 25172.0 4184.5, 6276.5,<br />
8369.0, 12553.5, 16738.0, 22281.0<br />
<strong>Ship</strong> Telex Automatic System Computer Commands and Guidelines for Contacting Mobile Marine<br />
Radio Stations<br />
<strong>Ship</strong> Station Response Land Station Response<br />
1) INITIATE ARQ CALL<br />
4) SHIP’S ANSWERBACK IDENTITY<br />
6) Send Command<br />
OBS+ (<strong>Weather</strong> Observations)<br />
OPR+ (Operator Assistance)<br />
HELP+ (Operator Procedure)<br />
62 <strong>Mariners</strong> <strong>Weather</strong> <strong>Log</strong><br />
2) RTTY CHANNEL<br />
3) “WHO ARE YOU”<br />
(Requests <strong>Ship</strong> Answerback)<br />
5) GA+?<br />
7) MOM<br />
VOS <strong>Program</strong><br />
Continued on Page 63
VOS <strong>Program</strong><br />
Continued from Page 62<br />
9) SEND MESSAGE<br />
10) KKKK (End of Message Indicator,<br />
WAIT for System Response<br />
DO NOT DISCONNECT)<br />
12) SHIP’S ANSWERBACK<br />
15) GO TO STEP 6, or<br />
16) BRK+? Clear Radio Circuit)<br />
8) MSG+?<br />
11) RTTY CHANNEL<br />
13) SYSTEM REFERENCE, INFORMATION,<br />
TIME, DURATION<br />
14) GA+?<br />
Stations listed as being 24-hr may not be operational during periods of poor propagation.<br />
For the latest information on Mobile Marine Radio frequencies, visit their webpage at: http://www.<br />
wloradio.com.<br />
MARITEL STATIONS<br />
INSTRUCTIONS FOR MARITEL<br />
Key the mike for five seconds on the working channel for that station. You should then get a recording telling<br />
you that you have reached the MARITEL system, and if you wish to place a call, key your mike for an<br />
additional five seconds. A MARITEL operator will then come on frequency. Tell them that you want to pass a<br />
marine weather observation.<br />
For the latest information on MARITEL frequencies, visit their webpage at: http://www.maritelinc.com.<br />
STATIONS VHF CHANNEL(S)<br />
WEST COAST<br />
Bellingham, WA 28,85<br />
Port Angeles, WA 25<br />
Camano Island, WA 24<br />
Seattle, WA 26<br />
Tacoma, WA 28<br />
Tumwater, WA 85<br />
Astoria, OR 24,26<br />
Rainer, OR 28<br />
Portland, OR 26<br />
Newport, OR 28<br />
Coos Bay, OR 25<br />
Santa Cruz, CA 27<br />
Santa Barbara, CA 86<br />
Redondo Bch, CA 27,85,87<br />
HAWAII<br />
Haleakala,HI (Maui) 26<br />
Palehua, HI (Oahu) 27<br />
GREAT LAKES<br />
Duluth, MN (Superior) 84<br />
Ontonagon, MI (Superior) 86<br />
Copper Harbor (Superior) 87<br />
Grand Marias (Superior) 84<br />
Sault Ste Marie (Superior) 86<br />
Port Washington, WI (Mich) 85<br />
Charlevoix (Michican) 84<br />
Chicago, IL (Michican) 27<br />
Roger City (Huron) 28<br />
Alpena, MI (Huron) 84<br />
Tawas City, MI (Huron) 87<br />
Port Huron, MI (Huron) 25<br />
Detroit, MI (Erie) 28<br />
VOS <strong>Program</strong><br />
Cleveland, OH (Erie) 86<br />
Buffalo, NY (Erie) 28<br />
NORTH EAST COAST<br />
Portland, ME 24,28,87<br />
Gloucester, MA 25<br />
Boston, MA 26<br />
Hyannisport, MA 28<br />
Nantucket, MA 85<br />
New Bedford, MA 24,26<br />
Providence, RI 27<br />
Narragansett, RI 84<br />
New London, CT 26,86<br />
Bridgeport, CT 27<br />
Staten Island, NY 28<br />
Sandy Hook, NJ 24<br />
Toms River, NJ 27<br />
<strong>Ship</strong> Bottom, NJ 28<br />
Continued on Page 64<br />
December 1998 63
VOS <strong>Program</strong><br />
Continued from Page 63<br />
Beach Haven, NJ 25<br />
Atlantic City, NJ 26<br />
Cape May, NJ 24<br />
Philadelphia, PA 26<br />
Delaware WW Odessa, DE 28<br />
Delaware WW Lewes, DE 27<br />
Bethany Beach, DE 86<br />
Ocean City, MD 26<br />
North Bay, MD 24<br />
Virginia Bch, VA 26,27<br />
CHESAPEAKE BAY<br />
Baltimore, MD 25,26<br />
Cambridge, MD 28<br />
Point Lookout, MD 26<br />
Belle Haven, VA 25<br />
SOUTH EAST COAST<br />
Morehead City, NC 28<br />
Wilmington, NC 26<br />
Georgetown, SC 24<br />
Charleston, SC 26<br />
Savannah, GA 27<br />
Military Communications Circuits<br />
64 <strong>Mariners</strong> <strong>Weather</strong> <strong>Log</strong><br />
Jacksonville, FL 26<br />
Daytona Bch, FL 28<br />
Cocoa Bch, FL 26<br />
Vero Bch, FL 27<br />
St Lucie, FL 26<br />
W Palm Bch, FL 28<br />
Ft Lauderdale, FL 84<br />
Miami, FL 24,25<br />
Key Largo, FL 27,28<br />
Marathon, FL 27<br />
Key West, FL 26,84<br />
GULF COAST<br />
Port Mansfield, TX 25<br />
Corpus Christi, TX 26,28<br />
Port O’Conner, TX 24<br />
Matagorda, TX 84<br />
Freeport, TX 25,27<br />
Galveston, TX 24<br />
Arcadia, TX 87<br />
Houston, TX 26<br />
High Island, TX 85<br />
Port Arthur, TX 27<br />
Lake Charles, LA 28,84<br />
Erath, LA 87<br />
Morgan City, LA 24,26<br />
Houma, LA 86<br />
Venice, LA 27,28,86<br />
New Orleans, LA 24,26,87<br />
Hammond, LA 85<br />
Hopedale, LA 85<br />
Gulfport, MS 28<br />
Pascagoula, MS 27<br />
Pensacola, FL 26<br />
Ft Walton Bch, FL 28<br />
Panama City, FL 26<br />
Apalachicola, FL 28<br />
Crystal River, FL 28<br />
Port Richie, FL 25<br />
Clearwater, FL 26<br />
Tampa Bay, FL 24<br />
Venice, FL 27<br />
Ft Myers, FL 26<br />
Naples, FL 25<br />
Navy, Naval, and U.S. Coast Guard ships wishing to participate in the VOS program may do so by sending<br />
unclassified weather observations in synoptic code (BBXX format) to the following Plain Language ADdress<br />
(PLAD):<br />
SHIP OBS NWS SILVER SPRING MD<br />
As weather observations received by NWS are public data, vessels should check with their local command<br />
before participating in the VOS <strong>Program</strong>.<br />
New Recruits — May through August 1998<br />
VOS <strong>Program</strong><br />
During the four-month period ending August 31, 1998, PMOs recruited 33 vessels as weather observers/<br />
reporters in the National <strong>Weather</strong> Service (NWS) <strong>Voluntary</strong> <strong>Observing</strong> <strong>Ship</strong> (VOS) <strong>Program</strong>. Thank you for<br />
joining the program.<br />
All <strong>Voluntary</strong> <strong>Observing</strong> <strong>Ship</strong>s are asked to follow the worldwide weather reporting schedule—by reporting<br />
weather four times daily at 0000, 0600, 1200, and 1800 UTC. The United States and Canada have a threehourly<br />
weather reporting schedule from coastal waters out 200 miles from shore, and from anywhere on the<br />
Great Lakes. From these coastal areas, please report weather at 0000, 0300, 0600, 0900, 1200, 1500, 1800,<br />
and 2100 ZULU or UTC, whenever possible.<br />
Continued on Page 65
VOS <strong>Program</strong><br />
Continued from Page 64<br />
PMOs attend SEAS/AMVER Training<br />
VOS <strong>Program</strong><br />
National <strong>Weather</strong> Service PMOs attended one of two SEAS/AMVER training sessions held at COMSAT<br />
headquarters in Bethesda, Maryland, near Washington, D.C., September 15-16, 1998, and November 3-4,<br />
1998. The purpose of the training was for the PMOs to become familiar with the software and help them<br />
provide training to ship’s officers. Also present at the meetings were Vince Zegowitz (Marine Observations<br />
<strong>Program</strong> Leader), Martin Baron (Assistant <strong>Program</strong> Leader, Marine Observations), Tim Rulon (GMDSS<br />
<strong>Program</strong> Manager), Bill Woodward (head of the SEAS <strong>Program</strong> Office, who led the effort to develop the<br />
software), and SEAS Field Representatives Jim Farrington (Norfolk) and Warren Krug (Miami).<br />
The SEAS/AMVER software has been developed to simplify preparation of weather and Automated Mutual<br />
Assistance Vessel Rescue (AMVER) messages. When COMSAT receives your weather message as formatted<br />
by this software, your call sign and position is forwarded to the AMVER center (other INMARSAT stations<br />
do not currently perform this service). Please contact any United States PMO to obtain this free software.h<br />
National <strong>Weather</strong> Service <strong>Voluntary</strong> <strong>Observing</strong> <strong>Ship</strong> <strong>Program</strong><br />
New Recruits from May 1 to August 31, 1998<br />
NAME OF SHIP CALL AGENT NAME RECRUITING PMO<br />
ALEGRIA ZCCK5 MAX FONVIELLE MIAMI, FL<br />
APOLLOGRACHT PCSV C.V. SCHEEPVAARTONDERNEMING APOLLOGRACHT BALTIMORE, MD<br />
ATLANTIC NOVA 3FWT4 BARBER INTERNATIONAL LTD SEATTLE, WA<br />
BUNGA SAGA EMPAT 9MBM9 MAYAYSIAN INTERNATIONAL SHIPPING CO., INC SEATTLE, WA<br />
CAMARINA MVGY5 DENHOLM SHIP MGMT. LTD. NEW ORLEANS, LA<br />
CAPE JACOB WJBA CAPE JACOB @ AMERICAN OVERSEAS MARINE CORP NEW ORLEANS, LA<br />
CHARLOTTE SCHULTE P3WE4 TRANSCO AGENCIES NORFOLK, VA<br />
EASTERN BRIDGE C6JY9 ROPNER SHIP MANAGEMENT LIMITED BALTIMORE, MD<br />
ENDEAVOR WCE5063 FARRELL LINES NORFOLK, VA<br />
ETERNAL WIND 3FIX7 WORLD MARINE COMPANY, LTD BALTIMORE, MD<br />
EVER APEX 3FCX7 THE WORLD TRADE CENTER BALTIMORE, MD<br />
EVER DIADEM 3FOF8 EVERGREEN AMERICA CORP NEW YORK CITY, NY<br />
GULF STAR 3FQY7 STAR MARITIME NEW ORLEANS, LA<br />
HYUNDAI EXPLORER 3FTG4 HYUNDAI AMERICA SHIPPING AGENCY, INC SEATTLE, WA<br />
KANIN ELEO2 SPLOSNA PLOVBA NEW ORLEANS, LA<br />
KENNICOTT WCY2920 ALASKA MARINE HIGHWAY SYSTEM D.O.T. SEATTLE, WA<br />
LEISE MAERSK OXGR2 MAERSK LINE SAN FRANCISCO, CA<br />
LIBRA SANTOS V2AF1 INCHAPE SHIPPING SERVICES NORFOLK, VA<br />
MAERSK GENOA DGUC MAERSK INC, GIELADA FARMS NEW YORK CITY, NY<br />
MAERSK TAIKI 9VIG A. P. MOLLER SINGAPORE PTE. LTD. BALTIMORE, MD<br />
MEKHANIK KALYUZHNIY UFLO FESCO AGENCIES N.A., INC SEATTLE, WA<br />
<strong>NOAA</strong>S GORDON GUNTER WTEO NMFS FACILITY NEW ORLEANS, LA<br />
OCEAN PALM 3FDO7 FUYOKAIUN SHIPMANAGEMENT CORP. SEATTLE, WA<br />
ORIENTAL ROAD 3FXT6 PORT METEOROLOGICAL OFFICER HOUSTON, TX<br />
PRESIDENT HOOVER WCY2883 AMERICAN SHIP MANAGEMENT SAN FRANCISCO, CA<br />
REGINA MAERSK OZIN2 MAERSK INC., GIRALDA FARMS NEW YORK CITY, NY<br />
RUBIN PHOENIX 3FFT7 INCHAPE SHIPPING SERVICES NORFOLK, VA<br />
STAR TRONDANGER LAQQ2 WESTFAL-LARSEN MANAGEMENT A/S BALTIMORE, MD<br />
SUCO DO BRASIL ELAQ5 MARITIME SERVICES ALEUROPA GMBH BALTIMORE, MD<br />
TASCO LAON2 WILHELMSEN LINES, REFLECTIONS II, SUITE 480 NORFOLK, VA<br />
USCGC HEALY WAGB-20 NZZZ USCGC HEALY WAGB-20 SEATTLE, WA<br />
VISAYAS VICTORY DZVP STAR SHIPPING (NY) INC BALTIMORE, MD<br />
WESTERN BRIDGE C6JQ9 ROPNER SHIP MANAGEMENT LIMITED BALTIMORE, MD<br />
December 1998 65
66 <strong>Mariners</strong> <strong>Weather</strong> <strong>Log</strong><br />
VOS <strong>Program</strong><br />
VOS <strong>Program</strong> Awards and Presentations Gallery<br />
PMO Jim Saunders of Baltimore<br />
presenting award to<br />
Captain Scribner of the ITB<br />
JACKSONVILLE.<br />
PMO Jim Saunders of Baltimore<br />
presenting award to<br />
Second Officer Peter Q. Merka<br />
of the M/V AGULHAS.
A 1997 VOS Plaque was awarded to the WESTWARD<br />
VENTURE for the high quality of surface weather<br />
observations. Pictured with PMO Pat Brandow of<br />
Seattle from the left are Second Mate Mick Richie and<br />
Captain Don Charland.<br />
VOS <strong>Program</strong><br />
The WESTWOOD HALLA was one of the ships recognized<br />
in 1997 by PMO Pat Brandow. Pictured is Captain<br />
Hans Joachim Kruschka.<br />
OCEAN CLIPPER receiving<br />
1997 outstanding VOS <strong>Program</strong><br />
support award from PMO Jack<br />
Warrelman. Standing rear: L -<br />
Mark Buyes R - Jody Elfert;<br />
Standing L-R Ch. Mate Marshall<br />
Perez, DPOs David Fazioli, Don<br />
Vandelinder, Mike Billings, Ch.<br />
Mate Jonathon Samual; Sitting:<br />
DPO Michelle Gorman; Kneeling:<br />
DPO Fred Blackden; Not Shown:<br />
DPOs Ted Agon, Darin Hilton,<br />
Chris Serrano.<br />
December 1998 67
The GOLDEN GATE BRIDGE comes through<br />
once again with one of the top honors for 1997<br />
in the VOS awards program. Pictured form left to<br />
right are Third Mate Arjun Ravikant, Chief Mate<br />
C.S. Batibrolu, Seattle PMO Pat Brandow,<br />
Captain T. Yamamoto, and Radio Officer S.<br />
Sarkar.<br />
68 <strong>Mariners</strong> <strong>Weather</strong> <strong>Log</strong><br />
VOS <strong>Program</strong><br />
PMO Bob Drummond of Miami presents a 1997<br />
VOS award to Captain James V. Sieler of the<br />
R/V SEWARD JOHNSON<br />
PMO George Smith of Cleveland<br />
presents a 1997 award to Captain<br />
James Van Dongen of the<br />
INDIANA HARBOR. The vessel<br />
is 1000 feet long and 150 feet<br />
wide.
VOS Cooperative <strong>Ship</strong> Reports<br />
VOS Coop <strong>Ship</strong> Reports — May through August 1998<br />
The National Climatic Data Center compiles the tables for the VOS Cooperative <strong>Ship</strong> Report from radio<br />
messages. The values under the monthly columns represent the number of weather reports received. Port<br />
Meteorological Officers supply ship names to the NCDC. Comments or questions regarding this report should<br />
be directed to NCDC, Operations Support Division, 151 Patton Avenue, Asheville, NC 28801, Attn: Dimitri<br />
Chappas (828-271-4055 or dchappas@ncdc.noaa.gov).<br />
SHIP NAME CALL PORT MAY JUN JUL AUG TOTAL<br />
1ST LT ALEX BONNYMAN WMFZ New York City 0 8 0 120 128<br />
1ST LT BALDOMERO LOPEZ WJKV Jacksonville 0 0 43 0 43<br />
A. V. KASTNER ZCAM9 Jacksonville 0 41 74 65 180<br />
AALSMEERGRACHT PCAM Long Beach 42 30 35 40 147<br />
ACADIA FOREST D5DI New Orleans 0 87 55 56 198<br />
ACT 7 GWAN Newark 17 57 65 73 212<br />
ACT I GYXG Newark 87 57 45 63 252<br />
ADAM E. CORNELIUS WCF7451 Chicago 38 78 18 0 134<br />
ADVANTAGE WPPO Norfolk 1 52 80 0 133<br />
AGDLEK OUGV Miami 33 28 42 43 146<br />
AGULHAS 3ELE9 Baltimore 59 101 56 48 264<br />
AL AWDAH 9KWA Houston 127 63 356 65 611<br />
AL FUNTAS 9KKX Miami 34 12 21 3 70<br />
AL SAMIDOON 9KKF Houston 61 0 9 27 97<br />
AL SHUHADAA 9KKH Houston 15 11 51 3 80<br />
ALBEMARLE ISLAND C6LU3 Newark 73 16 72 103 264<br />
ALBERNI DAWN ELAC5 Houston 58 496 73 10 637<br />
ALDEN W. CLAUSEN ELBM4 Norfolk 25 0 53 36 114<br />
ALEXANDER VON HUMBOLD Y3CW Miami 728 656 293 242 1919<br />
ALKMAN C6OG4 Houston 56 43 23 54 176<br />
ALLEGIANCE WSKD Norfolk 7 52 49 34 142<br />
ALLIGATOR AMERICA JPAL Seattle 48 33 63 31 175<br />
ALLIGATOR BRAVERY 3FXX4 Oakland 51 54 104 44 253<br />
ALLIGATOR COLUMBUS 3ETV8 Seattle 32 10 20 77 139<br />
ALLIGATOR FORTUNE ELFK7 Seattle 35 0 0 0 35<br />
ALLIGATOR GLORY ELJP2 Seattle 14 6 14 12 46<br />
ALLIGATOR HOPE ELFN8 Seattle 1 0 0 0 1<br />
ALLIGATOR LIBERTY JFUG Seattle 48 28 67 18 161<br />
ALLIGATOR STRENGTH 3FAK5 Oakland 41 47 48 58 194<br />
ALMERIA LYKES WGMJ Houston 36 24 30 48 138<br />
ALPENA WAV4647 Cleveland 87 72 28 58 245<br />
ALTAIR DBBI Miami 593 685 576 671 2525<br />
AMAZON S6BJ Norfolk 35 43 49 21 148<br />
AMBASSADOR BRIDGE 3ETH9 Oakland 62 129 57 61 309<br />
AMERICA STAR C6JZ2 Houston 23 64 100 52 239<br />
AMERICAN CONDOR WJRG Newark 0 105 70 93 268<br />
AMERICAN CORMORANT KGOP Jacksonville 5 0 99 0 104<br />
AMERICAN FALCON KMJA Jacksonville 0 0 72 24 96<br />
AMERICAN MERLIN WRGY Norfolk 3 0 55 0 58<br />
AMERICANA LADX2 New Orleans 0 24 15 12 51<br />
AMERIGO VESPUCCI ICBA Norfolk 8 19 22 0 49<br />
ANAHUAC ELFV3 Long Beach 5 26 17 22 70<br />
ANASTASIS 9HOZ Miami 0 15 3 1 19<br />
ANATOLIY KOLESNICHENKO UINM Seattle 19 8 12 17 56<br />
ANDERS MAERSK OXIT2 Long Beach 62 70 72 37 241<br />
ANKERGRACHT PCQL Baltimore 31 48 20 15 114<br />
ANNA MAERSK OYKS2 Long Beach 5 45 35 55 140<br />
APL CHINA V7AL5 Seattle 18 52 38 55 163<br />
APL JAPAN V7AL7 Seattle 35 29 171 71 306<br />
APL KOREA WCX8883 Seattle 29 0 0 0 29<br />
APL SINGAPORE WCX8812 Seattle 101 0 0 0 101<br />
APL THAILAND WCX8882 Seattle 83 0 0 0 83<br />
APOLLOGRACHT PCSV Baltimore 34 3 0 1 38<br />
ARABIAN SEA C6QS Miami 0 12 15 21 48<br />
ARCO ALASKA KSBK Long Beach 6 34 10 0 50<br />
ARCO ANCHORAGE WCIO Long Beach 0 12 3 0 15<br />
Continued on Page 70<br />
December 1998 69
Continued from Page 69<br />
70 <strong>Mariners</strong> <strong>Weather</strong> <strong>Log</strong><br />
VOS Cooperative <strong>Ship</strong> Reports<br />
SHIP NAME CALL PORT MAY JUN JUL AUG TOTAL<br />
ARCO CALIFORNIA WMCV Long Beach 1 0 9 24 34<br />
ARCO FAIRBANKS WGWB Long Beach 12 12 8 14 46<br />
ARCO INDEPENDENCE KLHV Long Beach 17 24 19 6 66<br />
ARCO JUNEAU KSBG Long Beach 0 12 10 3 25<br />
ARCO PRUDHOE BAY KPFD Long Beach 1 0 4 0 5<br />
ARCO SAG RIVER WLDF Long Beach 8 18 11 4 41<br />
ARCO SPIRIT KHLD Long Beach 19 14 14 2 49<br />
ARCO TEXAS KNFD Long Beach 12 0 7 19 38<br />
ARCTIC SUN ELQB8 Long Beach 14 14 57 36 121<br />
ARCTIC UNIVERSAL 4QUL Baltimore 75 63 46 61 245<br />
ARGONAUT KFDV Newark 15 26 54 44 139<br />
ARIES KGBD New York City 0 0 94 37 131<br />
ARINA ARCTICA OVYA2 Miami 137 42 77 84 340<br />
ARKTIS LIGHT OZBL2 Miami 0 73 18 108 199<br />
ARKTIS SPRING OWVD2 Miami 0 59 42 48 149<br />
ARMCO WE6279 Cleveland 53 50 74 72 249<br />
ARTHUR M. ANDERSON WE4805 Chicago 67 58 75 76 276<br />
ARTHUR MAERSK OXRS2 Long Beach 40 59 49 6 154<br />
ASPHALT COMMANDER WFJN New Orleans 0 18 19 2 39<br />
ATLANTIC 3FYT Miami 230 219 207 226 882<br />
ATLANTIC BULKER 3FSQ4 Miami 4 44 0 58 106<br />
ATLANTIC CARTIER C6MS4 Norfolk 24 0 18 10 52<br />
ATLANTIC COMPANION SKPE Newark 22 17 25 32 96<br />
ATLANTIC COMPASS SKUN Norfolk 37 16 37 16 106<br />
ATLANTIC CONCERT SKOZ Norfolk 17 40 9 0 66<br />
ATLANTIC CONVEYOR C6NI3 Norfolk 5 9 7 3 24<br />
ATLANTIC ERIE VCQM Baltimore 12 11 19 16 58<br />
ATLANTIC NOVA 3FWT4 Seattle 13 0 0 0 13<br />
ATLANTIC OCEAN C6T2064 Newark 15 0 0 51 66<br />
ATLANTIC SUPERIOR C6BT8 Baltimore 0 32 23 22 77<br />
ATLANTIS KAQP New Orleans 30 0 15 11 56<br />
AUCKLAND STAR C6KV2 Baltimore 39 54 52 58 203<br />
AUSTRAL RAINBOW WEZP New Orleans 6 12 64 27 109<br />
AUTHOR GBSA Houston 35 54 27 39 155<br />
AXEL MAERSK OXSF2 Oakland 0 26 52 83 161<br />
B. T. ALASKA WFQE Long Beach 8 104 20 31 163<br />
BARBARA ANDRIE WTC9407 Chicago 10 23 12 32 77<br />
BARBICAN SPIRIT DVFS Miami 44 102 29 42 217<br />
BARRINGTON ISLAND C6QK Miami 68 38 84 71 261<br />
BAY BRIDGE ELES7 Seattle 31 17 25 14 87<br />
BELGRANO P3HR2 Houston 0 45 51 88 184<br />
BELLONA 3FEA4 Jacksonville 3 0 0 0 3<br />
BERING SEA C6YY Miami 39 94 0 0 133<br />
BERNARDO QUINTANA A C6KJ5 New Orleans 43 41 2 24 110<br />
BLEST FUTURE DUHE Seattle 1 0 0 0 1<br />
BLOSSOM FOREVER DZSL Seattle 0 30 64 119 213<br />
BLUE GEMINI 3FPA6 Seattle 79 34 24 8 145<br />
BLUE HAWK D5HZ Norfolk 32 0 0 0 32<br />
BLUE NOVA 3FDV6 Seattle 21 66 56 10 153<br />
BLUE RIDGE KNJD Oakland 3 0 0 0 3<br />
BONN EXPRESS DGNB Houston 666 676 138 178 1658<br />
BOSPORUS BRIDGE 3FMV3 Oakland 72 73 72 48 265<br />
BOW TRIGGER 3FOT3 New York City 0 42 65 34 141<br />
BP ADMIRAL ZCAK2 Houston 0 17 8 1 26<br />
BREMEN EXPRESS 9VUM Norfolk 0 308 659 613 1580<br />
BRIGHT PHOENIX DXNG Seattle 80 56 77 51 264<br />
BRIGHT STATE DXAC Seattle 44 0 0 0 44<br />
BRIGIT MAERSK OXVW4 Oakland 28 53 58 45 184<br />
BRISBANE STAR C6LY4 Seattle 64 31 9 24 128<br />
BRITISH ADVENTURE ZCAK3 Seattle 16 2 19 56 93<br />
BRITISH RANGER ZCAS6 Houston 90 65 55 94 304<br />
BROOKLYN BRIDGE 3EZJ9 Oakland 55 61 64 54 234<br />
BRUCE SMART ELOF4 Oakland 63 25 61 0 149<br />
BT NAVIGATOR VRIU New Orleans 0 21 0 10 31<br />
BT NESTOR ZCBL4 New York City 0 0 0 4 4<br />
BUCKEYE WAQ3520 Cleveland 0 105 46 58 209<br />
BUNGA ORKID DUA 9MBQ4 Seattle 21 0 47 18 86<br />
BUNGA ORKID SATU 9MBQ3 Seattle 24 0 0 0 24<br />
BUNGA SAGA TIGA 9MBM8 Seattle 0 49 104 83 236<br />
BURNS HARBOR WQZ7049 Chicago 170 120 178 150 618<br />
CABO TAMAR ELMV3 Oakland 0 22 5 46 73<br />
CALCITE II WB4520 Chicago 9 41 74 113 237<br />
Continued on Page 71
Continued from Page 70<br />
VOS Cooperative <strong>Ship</strong> Reports<br />
SHIP NAME CALL PORT MAY JUN JUL AUG TOTAL<br />
CALIFORNIA CURRENT ELMG2 New Orleans 40 30 67 18 155<br />
CALIFORNIA HIGHWAY 3FHQ4 Seattle 7 0 0 0 7<br />
CALIFORNIA JUPITER ELKU8 Long Beach 44 58 25 49 176<br />
CALIFORNIA LUNA 3EYX5 Seattle 0 31 31 27 89<br />
CALIFORNIA MERCURY JGPN Seattle 41 0 37 1 79<br />
CALIFORNIA PEGASUS 3EPB6 Oakland 18 19 12 17 66<br />
CALIFORNIA SATURN ELKU9 Norfolk 0 8 15 6 29<br />
CALIFORNIA TRITON S6DB Long Beach 0 8 0 0 8<br />
CALIFORNIA ZEUS ELJP8 Oakland 0 24 35 151 210<br />
CANBERRA GBVC Miami 0 8 6 9 23<br />
CAPE BREEZE DUGK Seattle 0 12 2 15 29<br />
CAPE CHARLES 3EFX5 Seattle 16 15 12 15 58<br />
CAPE HENRY 3ENQ9 Norfolk 16 21 16 22 75<br />
CAPE HENRY KNJH Norfolk 16 0 0 0 16<br />
CAPE MAY JBCN Norfolk 30 10 11 10 61<br />
CAPE RISE KAFG Norfolk 0 1 0 0 1<br />
CAPE WASHINGTON WRGH Baltimore 0 48 0 0 48<br />
CAPT STEVEN L BENNETT KAXO New Orleans 24 0 0 0 24<br />
CARDIGAN BAY ZCBF5 New York City 61 45 58 50 214<br />
CARIBBEAN BULKER C6PL3 New Orleans 52 0 0 0 52<br />
CARLA A. HILLS ELBG9 Oakland 80 31 103 27 241<br />
CAROLINA WYBI Jacksonville 24 0 0 0 24<br />
CASON J. CALLAWAY WE4879 Chicago 29 96 63 112 300<br />
CELEBRATION ELFT8 Miami 2 0 25 43 70<br />
CENTURY ELQX6 Miami 4 14 15 7 40<br />
CENTURY HIGHWAY #2 3EJB9 Long Beach 20 11 5 19 55<br />
CENTURY HIGHWAY NO. 1 3FFJ4 Houston 9 3 22 0 34<br />
CENTURY HIGHWAY_NO. 3 8JNP Houston 11 16 13 20 60<br />
CENTURY LEADER NO. 1 3FBI6 Houston 24 36 15 40 115<br />
CGM PROVENCE DEGM Houston 0 20 10 12 42<br />
CHARLES E. WILSON WZE4539 Cleveland 0 58 30 22 110<br />
CHARLES ISLAND C6JT Miami 64 62 12 42 180<br />
CHARLES LYKES 3EJT9 Baltimore 33 12 60 37 142<br />
CHARLES M. BEEGHLEY WL3108 Cleveland 5 120 106 37 268<br />
CHARLES PIGOTT 5LPA Oakland 0 0 84 32 116<br />
CHASTINE MAERSK OWNJ2 New York City 0 44 27 34 105<br />
CHELSEA KNCX New York City 0 25 75 44 144<br />
CHEMBULK FORTITUDE 3ESF7 Norfolk 0 0 33 55 88<br />
CHEMICAL PIONEER KAFO Houston 24 20 58 142 244<br />
CHESAPEAKE TRADER WGZK Houston 43 9 77 54 183<br />
CHEVRON ARIZONA KGBE Miami 23 20 2 0 45<br />
CHEVRON ATLANTIC C6KY3 New Orleans 66 89 47 0 202<br />
CHEVRON COLORADO KLHZ Oakland 0 40 100 35 175<br />
CHEVRON EDINBURGH VSBZ5 Oakland 105 38 3 166 312<br />
CHEVRON EMPLOYEE PRIDE C6MC5 Baltimore 54 47 14 0 115<br />
CHEVRON FELUY ELIN Houston 0 0 77 0 77<br />
CHEVRON MARINER ELRC4 New Orleans 0 0 0 17 17<br />
CHEVRON MISSISSIPPI WXBR Oakland 42 26 41 32 141<br />
CHEVRON NAGASAKI A8BK Oakland 91 0 74 50 215<br />
CHEVRON PERTH C6KQ8 Oakland 63 0 0 0 63<br />
CHEVRON SOUTH AMERICA ZCAA2 New Orleans 73 101 20 46 240<br />
CHIEF GADAO WEZD Oakland 37 10 78 66 191<br />
CHILEAN EXPRESS 3EME7 Norfolk 0 1 0 5 6<br />
CHINA HOPE ELQF5 Seattle 0 0 0 2 2<br />
CHIQUITA BARU ZCAY7 Jacksonville 44 44 31 56 175<br />
CHIQUITA BELGIE C6KD7 Baltimore 50 36 47 34 167<br />
CHIQUITA BREMEN ZCBC5 Miami 36 30 33 38 137<br />
CHIQUITA BRENDA ZCBE9 Miami 58 47 72 78 255<br />
CHIQUITA DEUTSCHLAND C6KD8 Baltimore 40 62 56 27 185<br />
CHIQUITA ELKESCHLAND ZCBB9 Miami 22 72 67 55 216<br />
CHIQUITA FRANCES ZCBD9 Miami 60 52 51 60 223<br />
CHIQUITA ITALIA C6KD5 Baltimore 38 36 27 19 120<br />
CHIQUITA JEAN ZCBB7 Jacksonville 50 41 20 30 141<br />
CHIQUITA JOY ZCBC2 Miami 56 58 26 19 159<br />
CHIQUITA NEDERLAND C6KD6 Baltimore 51 8 19 12 90<br />
CHIQUITA ROSTOCK ZCBD2 Miami 65 43 53 41 202<br />
CHIQUITA SCANDINAVIA C6KD4 Baltimore 62 32 28 23 145<br />
CHIQUITA SCHWEIZ C6KD9 Baltimore 39 76 38 48 201<br />
CHITTINAD TRADITION VTRX New Orleans 5 0 0 0 5<br />
CHO YANG ATLAS DQVH Seattle 48 0 0 0 48<br />
CHOYANG VISION 9VOQ Seattle 21 23 82 80 206<br />
CIELO DI FIRENZE V2SM Long Beach 0 158 24 48 230<br />
Continued on Page 72<br />
December 1998 71
Continued from Page 71<br />
72 <strong>Mariners</strong> <strong>Weather</strong> <strong>Log</strong><br />
VOS Cooperative <strong>Ship</strong> Reports<br />
SHIP NAME CALL PORT MAY JUN JUL AUG TOTAL<br />
CITY OF DURBAN GXIC Long Beach 88 62 84 53 287<br />
CLEVELAND KGXA Houston 17 64 40 97 218<br />
CLIFFORD MAERSK OXME2 Newark 0 0 0 11 11<br />
CMS ISLAND EXPRESS J8NX Miami 10 12 17 9 48<br />
COASTAL EAGLE POINT WHMK Houston 0 1 0 0 1<br />
COLUMBIA BAY WRB4008 Houston 7 0 0 0 7<br />
COLUMBIA STAR WSB2018 Cleveland 133 163 90 63 449<br />
COLUMBIA STAR C6HL8 Long Beach 79 63 52 72 266<br />
COLUMBINE 3ELQ9 Baltimore 24 6 51 96 177<br />
COLUMBUS AMERICA ELSX2 Norfolk 56 3 30 54 143<br />
COLUMBUS AUSTRALIA ELSX3 Houston 48 38 48 37 171<br />
COLUMBUS CALIFORNIA ELUB7 Long Beach 48 29 43 45 165<br />
COLUMBUS CANADA ELQN3 Seattle 0 34 83 75 192<br />
COLUMBUS NEW ZEALAND ELSX4 Newark 0 23 20 11 54<br />
COLUMBUS QUEENSLAND ELUB9 Norfolk 7 13 23 20 63<br />
COLUMBUS VICTORIA ELUB6 Long Beach 101 46 50 57 254<br />
CONDOLEEZZA RICE C6OK Baltimore 57 0 0 0 57<br />
CONTSHIP AMERICA 3EIP3 Houston 66 13 11 21 111<br />
COPACABANA PPXI Norfolk 22 0 34 23 79<br />
CORAL HIGHWAY 3FEB5 Jacksonville 0 16 0 1 17<br />
CORDELIA 3ESJ3 Long Beach 8 20 38 10 76<br />
CORMORANT ARROW C6IO9 Seattle 5 7 3 2 17<br />
CORNELIA MAERSK OXIF2 Norfolk 0 29 0 0 29<br />
CORNUCOPIA KPJC Oakland 13 1 2 9 25<br />
CORPUS CHRISTI WMRU Houston 0 13 180 3 196<br />
CORWITH CRAMER WTF3319 Norfolk 39 0 71 0 110<br />
COSMOWAY 3EVO3 Seattle 12 0 0 5 17<br />
COURIER KCBK Houston 0 20 32 15 67<br />
COURTNEY BURTON WE6970 Cleveland 111 169 83 77 440<br />
COURTNEY L ZCAQ8 Baltimore 53 8 36 0 97<br />
CRISTOFORO COLOMBO ICYS Norfolk 0 8 0 6 14<br />
CROATIA EXPRESS 9HZC3 New York City 0 1 2 3 6<br />
CROWN OF SCANDINAVIA OXRA6 Miami 85 87 100 98 370<br />
CROWN PRINCESS ELGH5 Miami 0 188 36 3 227<br />
CSK UNITY 9VPU Seattle 0 62 13 24 99<br />
CSL ATLAS C6IL3 Baltimore 13 0 0 0 13<br />
CSL CABO D5XH Seattle 1 20 4 11 36<br />
CSS HUDSON CGDG Norfolk 49 49 49 42 189<br />
DAGMAR MAERSK DHAF New York City 53 9 0 0 62<br />
DAISHIN MARU 3FPS6 Seattle 82 0 0 22 104<br />
DANIA PORTLAND OXEH2 Miami 58 50 2 33 143<br />
DARYA PREETH VRUX8 Long Beach 0 25 0 0 25<br />
DAWN PRINCESS ELTO4 Miami 11 0 0 0 11<br />
DELAWARE TRADER WXWL Long Beach 73 22 0 55 150<br />
DENALI WSVR Long Beach 27 90 67 40 224<br />
DESTINY 3FKZ3 Miami 92 46 128 161 427<br />
DG COLUMBIA PPSL Norfolk 43 78 156 64 341<br />
DIAMOND STAR VCBW New Orleans 0 2 0 5 7<br />
DIRCH MAERSK OXQP2 Long Beach 34 51 40 32 157<br />
DIRECT CONDOR DQEB Long Beach 0 51 58 43 152<br />
DIRECT EAGLE C6BJ9 Long Beach 0 57 18 29 104<br />
DIRECT FALCON C6MP7 Long Beach 0 48 67 41 156<br />
DIRECT KEA C6MP8 Long Beach 46 57 30 52 185<br />
DIRECT KIWI C6MP9 Long Beach 29 69 48 26 172<br />
DIRECT KOOKABURRA C6MQ2 Long Beach 41 19 25 34 119<br />
DOCK EXPRESS 10 PJRO Baltimore 55 32 29 1 117<br />
DOCK EXPRESS 20 PJRF Baltimore 1 61 0 40 102<br />
DOCTOR LYKES 3ELF9 Baltimore 25 29 87 25 166<br />
DORTHE MAERSK DHPD New York City 0 37 28 18 83<br />
DORTHE OLDENDORFF ELQJ6 Seattle 8 24 92 8 132<br />
DRAGOR MAERSK OXPW2 Long Beach 7 0 0 0 7<br />
DUBROVNIK EXPRESS 9HOO3 Norfolk 0 29 21 24 74<br />
DUCHESS KRCJ Newark 0 6 1 0 7<br />
DUHALLOW ZCBH9 Baltimore 70 72 95 58 295<br />
DUNCAN ISLAND C6JS Miami 47 108 79 46 280<br />
DUSSELDORF EXPRESS S6IG Long Beach 381 667 209 8 1265<br />
E.P. LE QUEBECOIS CG3130 Norfolk 40 220 231 236 727<br />
EAGLE BEAUMONT S6JO New York City 2 0 0 0 2<br />
EARL W. OGLEBAY WZE7718 Cleveland 0 5 0 0 5<br />
EASTERN BRIDGE C6JY9 Baltimore 0 0 0 84 84<br />
ECSTASY ELNC5 Miami 0 39 20 82 141<br />
EDELWIESS VRUM3 Seattle 39 0 22 47 108<br />
Continued on Page 73
Continued from Page 72<br />
VOS Cooperative <strong>Ship</strong> Reports<br />
SHIP NAME CALL PORT MAY JUN JUL AUG TOTAL<br />
EDGAR B. SPEER WQZ9670 Chicago 147 69 93 76 385<br />
EDWARD L. RYERSON WM5464 Chicago 16 0 0 0 16<br />
EDWIN H. GOTT WXQ4511 Chicago 90 142 0 305 537<br />
EDYTH L C6YC Baltimore 23 11 12 8 54<br />
EIDELWEISS 3FGE2 Seattle 5 0 0 0 5<br />
ELATION 3FOC5 Miami 31 0 0 0 31<br />
ELISE SHULTE P3NP4 Miami 0 23 58 2 83<br />
ELLEN KNUDSEN LAKZ4 Norfolk 0 0 1 0 1<br />
ELLIOTT BAY DZFF Seattle 53 64 130 50 297<br />
ELSBERG J8PG Miami 8 0 0 0 8<br />
ELTON HOYT II WE3993 Cleveland 0 58 41 2 101<br />
EMPIRE STATE KKFW New York City 11 63 44 0 118<br />
ENCHANTMENT OF THE SEAS LAXA4 Miami 2 0 0 0 2<br />
ENDEAVOR WAUW New York City 8 0 0 0 8<br />
ENDURANCE WAUU New York City 16 0 0 0 16<br />
ENERGY ENTERPRISE WBJF Baltimore 1 0 0 0 1<br />
ENGLISH STAR C6KU7 Long Beach 66 79 83 71 299<br />
EQUINOX DPSC Baltimore 0 37 36 19 92<br />
EUROPA DLAL Miami 0 0 4 8 12<br />
EVER DELUXE 3FBE8 Norfolk 14 0 0 0 14<br />
EVER GAINING BKJO Norfolk 0 0 0 5 5<br />
EVER GARDEN BKHB Norfolk 0 0 0 7 7<br />
EVER GATHER BKHA Newark 0 0 11 6 17<br />
EVER GENERAL BKHY Baltimore 7 4 0 0 11<br />
EVER GIVEN BKJJ Long Beach 0 1 0 0 1<br />
EVER GLEEFUL BKJY Long Beach 0 12 0 0 12<br />
EVER GUARD 3ESL2 Seattle 0 2 0 0 2<br />
EVER GUEST BKJH Norfolk 2 2 0 8 12<br />
EVER LAUREL BKHH Long Beach 4 0 0 0 4<br />
EVER LEVEL BKHJ Miami 0 15 25 1 41<br />
EVER RACER 3FJL4 Norfolk 0 0 6 11 17<br />
EVER REPUTE 3FRZ4 New York City 0 0 0 4 4<br />
EVER RESULT 3FSA4 Norfolk 0 9 15 0 24<br />
EVER RIGHT 3FML3 Long Beach 0 4 0 0 4<br />
EVER ROUND 3FQN3 Long Beach 4 1 0 0 5<br />
EVER ULTRA 3FEJ6 Seattle 0 36 43 42 121<br />
EVER UNION 3FFG7 Seattle 6 0 35 27 68<br />
EVER UNIQUE 3FXQ6 Seattle 3 0 0 8 11<br />
EVER UNISON 3FTL6 Long Beach 0 1 62 43 106<br />
EVER UNITED 3FMQ6 Seattle 0 1 0 2 3<br />
EXCELSIOR V7AZ2 Baltimore 32 107 20 44 203<br />
EXEMPLAR V7AZ3 Baltimore 0 48 62 60 170<br />
EXPORT PATRIOT WCJY Newark 0 10 72 88 170<br />
FAIRLIFT PEBM Norfolk 35 54 39 43 171<br />
FAIRMAST PJLC Norfolk 31 0 2 0 33<br />
FANAL TRADER VRUY4 Seattle 64 25 92 84 265<br />
FANTASY ELKI6 Miami 19 22 18 9 68<br />
FARALLON ISLAND FARIS Oakland 109 88 54 549 800<br />
FASCINATION 3EWK9 Miami 8 30 33 25 96<br />
FAUST WRYX Jacksonville 45 26 58 36 165<br />
FERNCROFT LLEJ3 Long Beach 0 10 40 8 58<br />
FIDELIO WQVY Jacksonville 31 55 106 34 226<br />
FLAMENGO PPXU Norfolk 0 0 118 77 195<br />
FLORAL LAKE 3FFA5 Seattle 0 3 0 0 3<br />
FOREST CHAMPION 3FSH3 Seattle 0 37 0 0 37<br />
FOREST TRADER A8GJ Seattle 0 0 12 22 34<br />
FRANCES HAMMER KRGC Jacksonville 0 23 47 42 112<br />
FRANCES L C6YE Baltimore 1 216 37 17 271<br />
FRANKFURT EXPRESS 9VPP New York City 21 25 22 5 73<br />
FRED R. WHITE JR WAR7324 Cleveland 35 37 0 0 72<br />
FREEPORT EXPRESS V2AJ5 New York City 0 24 49 32 105<br />
G AND C PARANA LADC2 Long Beach 17 0 0 0 17<br />
GALAXY ACE VRUI2 Jacksonville 0 0 0 19 19<br />
GALVESTON BAY WPKD Houston 51 20 119 71 261<br />
GEETA VRUL7 New Orleans 0 0 0 1 1<br />
GEORGE A. SLOAN WA5307 Chicago 73 81 64 87 305<br />
GEORGE A. STINSON WCX2417 Cleveland 119 142 38 36 335<br />
GEORGE H. WEYERHAEUSER C6FA7 Oakland 50 114 59 26 249<br />
GEORGE SCHULTZ ELPG9 Baltimore 47 53 49 47 196<br />
GEORGE WASHINGTON BRIDGE JKCF Long Beach 80 46 101 57 284<br />
GEORGIA RAINBOW II 3ERJ8 Jacksonville 49 8 37 0 94<br />
GERMAN SENATOR P3ZZ6 Norfolk 0 0 2 2 4<br />
Continued on Page 74<br />
December 1998 73
Continued from Page 73<br />
74 <strong>Mariners</strong> <strong>Weather</strong> <strong>Log</strong><br />
VOS Cooperative <strong>Ship</strong> Reports<br />
SHIP NAME CALL PORT MAY JUN JUL AUG TOTAL<br />
GINGA MARU JFKC Long Beach 0 0 98 88 186<br />
GLOBAL MARINER WWXA Baltimore 24 7 33 0 64<br />
GLOBAL NEXTAGE XYLV Seattle 0 1 0 0 1<br />
GLORIOUS SUCCESS DUHN Seattle 10 46 28 18 102<br />
GLORIOUS SUN DVTR Seattle 0 0 71 61 132<br />
GOLDEN BEAR NMRY Oakland 65 170 0 0 235<br />
GOLDEN GATE KIOH Long Beach 82 52 5 184 323<br />
GOLDEN GATE BRIDGE 3FWM4 Seattle 51 51 55 55 212<br />
GOPHER STATE WCJV Norfolk 0 0 0 1 1<br />
GRANDEUR OF THE SEAS ELTQ9 Miami 24 0 0 0 24<br />
GREAT LAND WFDP Seattle 64 31 25 61 181<br />
GREEN BAY KGTH Long Beach 0 91 24 9 124<br />
GREEN ISLAND KIBK New Orleans 0 34 33 9 76<br />
GREEN LAKE KGTI Baltimore 74 158 65 86 383<br />
GREEN MAYA 3ETA5 Seattle 0 13 15 12 40<br />
GREEN RAINIER 3ENI3 Seattle 1 8 3 7 19<br />
GREEN RIDGE WRYL Seattle 10 0 13 79 102<br />
GREEN SASEBO 3EUT5 Seattle 1 24 47 31 103<br />
GRETKE OLDENDORFF ELQJ7 Seattle 0 166 0 36 202<br />
GROTON KMJL Newark 42 37 62 12 153<br />
GROWTH RING 3ECN7 Seattle 0 67 0 0 67<br />
GUANAJUATO ELMH8 Jacksonville 12 33 134 35 214<br />
GUAYAMA WZJG Jacksonville 25 43 148 142 358<br />
GULF CURRENT ELMF9 New Orleans 0 191 17 0 208<br />
GULF SPIRIT ELIH8 Houston 0 0 0 16 16<br />
GULL ARROW C6KB4 Baltimore 0 1 10 0 11<br />
GYPSUM BARON ZCAN3 Norfolk 0 31 44 44 119<br />
GYPSUM KING ZCAN2 Miami 0 49 48 44 141<br />
H. LEE WHITE WZD2465 Cleveland 0 37 0 0 37<br />
HADERA ELBX4 Baltimore 0 2 0 2 4<br />
HANJIN BARCELONA 3EXX9 Long Beach 0 11 12 0 23<br />
HANJIN BREMEN D7YG Seattle 10 0 1 3 14<br />
HANJIN FELIXSTOWE D9TJ Seattle 11 2 0 3 16<br />
HANJIN HAMBURG D9TP Long Beach 0 4 0 0 4<br />
HANJIN KAOHSIUNG D9TW Seattle 9 5 5 0 19<br />
HANJIN LE HAVRE D9SY Seattle 0 5 8 7 20<br />
HANJIN OAKLAND D9SG Long Beach 0 0 0 7 7<br />
HANJIN PORTLAND 3FSB3 Newark 8 4 6 1 19<br />
HANJIN SEATTLE D9SF Seattle 9 0 0 0 9<br />
HANJIN SHANGHAI 3FGI5 Newark 0 11 5 12 28<br />
HANJIN SINGAPORE D9TX Long Beach 0 0 0 3 3<br />
HANJIN TOKYO 3FZJ3 New York City 1 5 4 0 10<br />
HANJIN VANCOUVER D9TK Long Beach 13 0 0 0 13<br />
HANSA CARRIER ELTY7 Norfolk 0 22 22 0 44<br />
HARBOUR BRIDGE ELJH9 Seattle 43 19 20 24 106<br />
HEICON P3TA4 Norfolk 3 37 11 0 51<br />
HEIDELBERG EXPRESS DEDI Houston 690 475 360 677 2202<br />
HEKABE C6OU2 New Orleans 0 11 30 33 74<br />
HELVETIA OXRO2 Jacksonville 0 26 52 7 85<br />
HENRY HUDSON BRIDGE JKLS Long Beach 0 60 46 85 191<br />
HERBERT C. JACKSON WL3972 Cleveland 0 41 26 29 96<br />
HOEGH CLIPPER C6IM8 Seattle 0 3 1 0 4<br />
HOEGH DRAKE ZHEN7 Norfolk 0 31 0 0 31<br />
HOEGH DYKE C6OX2 Long Beach 26 11 9 19 65<br />
HOEGH MERIT C6IN3 Seattle 0 12 6 0 18<br />
HOEGH MINERVA C6IM6 Seattle 0 54 18 0 72<br />
HOLCK LARSEN VTFJ Cleveland 2 2 2 0 6<br />
HONSHU SILVIA 3EST7 Seattle 63 92 30 43 228<br />
HOOD ISLAND C6LU4 Newark 45 12 21 30 108<br />
HOUSTON FNXB Houston 14 42 44 49 149<br />
HOUSTON EXPRESS DLBB Houston 40 29 32 63 164<br />
HUAL INGRITA LAUX2 Jacksonville 0 6 2 0 8<br />
HUAL ROLITA LAVG4 Jacksonville 0 0 14 0 14<br />
HUMACAO WZJB Norfolk 33 29 141 78 281<br />
HUMBERGRACHT PEUQ Houston 30 33 36 18 117<br />
HUME HIGHWAY 3EJO6 Jacksonville 4 25 27 19 75<br />
HYUNDAI DISCOVERY 3FFR6 Seattle 35 39 45 48 167<br />
HYUNDAI DYNASTY P3BA7 Long Beach 0 54 48 40 142<br />
HYUNDAI FIDELITY DNAG Long Beach 0 59 29 97 185<br />
HYUNDAI FORTUNE 3FLG6 Seattle 11 11 31 23 76<br />
HYUNDAI FREEDOM 3FFS6 Seattle 5 60 11 13 89<br />
HYUNDAI INDEPENDENCE 3FDY6 Seattle 31 90 39 38 198<br />
Continued on Page 75
Continued from Page 74<br />
VOS Cooperative <strong>Ship</strong> Reports<br />
SHIP NAME CALL PORT MAY JUN JUL AUG TOTAL<br />
HYUNDAI LIBERTY 3FFT6 Seattle 14 6 23 0 43<br />
IMAGINATION 3EWJ9 Miami 21 19 26 36 102<br />
INDIAN OCEAN C6T2063 New York City 31 0 0 0 31<br />
INDIANA HARBOR WXN3191 Cleveland 185 123 95 100 503<br />
INLAND SEAS WCJ6214 Chicago 2 13 10 7 32<br />
INSPIRATION 3FOA5 Miami 19 111 46 29 205<br />
IOWA TRADER KNDM Houston 0 3 0 17 20<br />
IRENA ARCTICA OXTS2 Miami 57 98 97 127 379<br />
ISLA DE CEDROS 3FOA6 Seattle 76 6 10 9 101<br />
ISLA GRAN MALVINA LQOK Newark 0 18 2 0 20<br />
ISLAND BREEZE C6KP Miami 4 32 29 0 65<br />
ISLAND PRINCESS GBBM Long Beach 4 1 3 26 34<br />
ITB BALTIMORE WXKM Baltimore 41 13 39 13 106<br />
ITB MOBILE KXDB New York City 8 36 9 48 101<br />
ITB NEW YORK WVDG Newark 0 17 24 6 47<br />
IVER EXPLORER PEXV Houston 22 0 4 7 33<br />
IVER EXPRESS PEXX Houston 23 10 8 17 58<br />
IWANUMA MARU 3ESU8 Seattle 121 83 19 211 434<br />
J. DENNIS BONNEY ELLE2 Baltimore 0 28 15 93 136<br />
J.A.W. IGLEHART WTP4966 Cleveland 65 19 0 0 84<br />
JACKLYN M. WCV7620 Chicago 127 61 19 18 225<br />
JACKSONVILLE WNDG Baltimore 51 122 29 65 267<br />
JADE ORIENT ELRY6 Seattle 12 10 4 0 26<br />
JADE PACIFIC ELRY5 Seattle 0 8 15 0 23<br />
JAHRE SPIRIT LAWS2 Houston 5 0 0 0 5<br />
JAMES ELRR6 New Orleans 15 36 46 40 137<br />
JAMES N. SULLIVAN ELPG8 Baltimore 0 19 6 0 25<br />
JAMES R. BARKER WYP8657 Cleveland 126 168 48 88 430<br />
JAPAN SENATOR DNJS Norfolk 0 65 67 52 184<br />
JEAN LYKES WUBV Houston 0 58 0 0 58<br />
JEB STUART WRGQ Oakland 0 117 6 5 128<br />
JO CLIPPER PFEZ Baltimore 26 35 21 26 108<br />
JO ELM PFFD Baltimore 0 32 20 18 70<br />
JOHN G. MUNSON WE3806 Chicago 58 124 114 113 409<br />
JOHN J. BOLAND WF2560 Cleveland 0 69 21 61 151<br />
JOHN PURVES WCB5820 Chicago 25 0 0 0 25<br />
JOHN YOUNG ELNG9 Oakland 71 0 84 0 155<br />
JOIDES RESOLUTION D5BC Norfolk 1 225 81 58 365<br />
JOSEPH H. FRANTZ WA6575 Cleveland 0 78 24 28 130<br />
JOSEPH L. BLOCK WXY6216 Chicago 37 51 37 68 193<br />
JOSEPH LYKES ELRZ8 Houston 0 1 0 0 1<br />
JUBILANT ELKA7 Jacksonville 1 0 0 11 12<br />
JUBILEE 3FPM5 Long Beach 8 10 0 0 18<br />
JULIUS HAMMER KRGJ Jacksonville 24 32 68 23 147<br />
JUNO ISLAND 3FRF7 Seattle 35 0 0 0 35<br />
KAHO WZ2043 Chicago 0 11 0 0 11<br />
KAIJIN 3FWI3 Seattle 123 6 0 0 129<br />
KANSAS TRADER KSDF Houston 0 23 48 141 212<br />
KAPITAN BYANKIN UAGK Seattle 33 115 42 42 232<br />
KAPITAN GNEZPILOV UQMF Seattle 0 15 15 3 33<br />
KAPITAN KONEV UAHV Seattle 30 49 117 66 262<br />
KAPITAN MAN UJCQ Seattle 9 1 9 13 32<br />
KAPITAN SERYKH UGOZ Seattle 0 42 55 45 142<br />
KAREN ANDRIE WBS5272 Chicago 18 0 42 24 84<br />
KAUAI WSRH Long Beach 20 55 57 61 193<br />
KAYE E. BARKER WCF3012 Cleveland 162 198 58 72 490<br />
KAZIMAH 9KKL Houston 88 54 79 57 278<br />
KELLIE CHOUEST KUS1038 Norfolk 0 0 0 2 2<br />
KEN KOKU 3FMN6 Seattle 38 0 0 26 64<br />
KEN SHIN YJQS2 Seattle 23 57 50 47 177<br />
KENAI WSNB Houston 36 19 8 35 98<br />
KENNETH E. HILL C6FA6 Newark 43 26 47 60 176<br />
KENNETH T. DERR C6FA3 Newark 47 7 81 18 153<br />
KENTUCKY HIGHWAY JKPP Norfolk 0 0 0 7 7<br />
KHALEEJ BAY DHSB Houston 0 0 0 1 1<br />
KINSMAN INDEPENDENT WUZ7811 Cleveland 141 189 96 119 545<br />
KNOCK ALLAN ELOI6 Houston 71 0 5 7 83<br />
KOELN EXPRESS 9VBL New York City 206 665 697 168 1736<br />
KOMET V2SA Miami 31 37 37 37 142<br />
KOMSOMOLETS PRIMORYA EMEK Seattle 0 37 52 35 124<br />
KURAMA 3EOF7 Newark 0 3 6 2 11<br />
KURE 3FGN3 Seattle 15 0 74 35 124<br />
Continued on Page 76<br />
December 1998 75
Continued from Page 75<br />
76 <strong>Mariners</strong> <strong>Weather</strong> <strong>Log</strong><br />
VOS Cooperative <strong>Ship</strong> Reports<br />
SHIP NAME CALL PORT MAY JUN JUL AUG TOTAL<br />
LA ESPERANZA 3EQV8 Baltimore 3 0 34 26 63<br />
LAKE CHARLES KPTB New Orleans 0 9 91 17 117<br />
LAWRENCE H. GIANELLA WLBX Norfolk 26 31 15 12 84<br />
LEE A. TREGURTHA WUR8857 Cleveland 33 62 16 11 122<br />
LEGEND OF THE SEAS ELRR5 New Orleans 17 0 0 0 17<br />
LEONARD J. COWLEY CG2959 Norfolk 0 16 0 0 16<br />
LEOPARDI V7AV8 Baltimore 0 3 0 24 27<br />
LIBERTY SEA KPZH New Orleans 41 0 0 0 41<br />
LIBERTY STAR WCBP New Orleans 54 16 50 108 228<br />
LIBERTY SUN WCOB Houston 0 15 3 40 58<br />
LIBERTY WAVE KRHZ Norfolk 2 0 0 1 3<br />
LIHUE WTST Seattle 14 46 105 30 195<br />
LILAC ACE 3FDL4 Long Beach 0 134 19 13 166<br />
LINDA OLDENDORF ELRR2 Baltimore 12 50 45 9 116<br />
LIRCAY ELEV8 Houston 3 10 9 3 25<br />
LNG AQUARIUS WSKJ Oakland 118 35 76 86 315<br />
LNG CAPRICORN KHLN New York City 64 11 22 0 97<br />
LNG LEO WDZB New York City 13 20 47 28 108<br />
LNG LIBRA WDZG New York City 0 0 0 36 36<br />
LNG TAURUS WDZW New York City 63 13 51 84 211<br />
LNG VIRGO WDZX New York City 0 0 36 112 148<br />
LOA ELOF7 Long Beach 2 0 0 0 2<br />
LONDON SPIRIT GCCC Baltimore 0 36 2 44 82<br />
LONDON VICTORY GCCB New York City 0 62 42 62 166<br />
LONG BEACH 3FOU3 Seattle 4 26 5 144 179<br />
LONG LINES WATF Baltimore 57 0 0 0 57<br />
LOOTSGRACHT PFPT Houston 8 1 19 10 38<br />
LOUIS MAERSK OXMA2 Baltimore 2 0 0 22 24<br />
LT ARGOSY VTKG Cleveland 5 0 0 0 5<br />
LT PRAGATI VVDX Seattle 206 0 0 0 206<br />
LT. ODYSSEY VTKB Cleveland 0 0 0 3 3<br />
LTC CALVIN P. TITUS KAKG Baltimore 0 41 0 0 41<br />
LUCY OLDENDORFF ELPA2 Long Beach 15 20 0 2 37<br />
LUISE OLDENDORFF 3FOW4 Seattle 67 22 47 94 230<br />
LUTJENBURG DGLU Long Beach 0 43 74 70 187<br />
LUTJENBURG ELVF6 Long Beach 56 0 0 0 56<br />
LYKES EXPLORER WGLA Houston 4 10 113 41 168<br />
M/V FRANCOIS L.D. FNEQ Norfolk 17 0 0 0 17<br />
MACKINAC BRIDGE JKES Long Beach 62 54 91 48 255<br />
MADISON MAERSK OVJB2 Oakland 24 20 57 5 106<br />
MAERSK CALIFORNIA WCX5083 Houston 0 0 0 107 107<br />
MAERSK CONSTELLATION WRYJ Oakland 33 0 37 284 354<br />
MAERSK ENDEAVOUR XP4210 Miami 0 195 194 186 575<br />
MAERSK EXPLORER XP3344 Miami 1 129 172 162 464<br />
MAERSK GANNET GJLK Miami 0 21 7 58 86<br />
MAERSK GIANT OU2465 Miami 235 219 233 235 922<br />
MAERSK QUITO OXWF2 Norfolk 0 0 1 0 1<br />
MAERSK SHETLAND MSQK3 Miami 0 20 50 49 119<br />
MAERSK SOMERSET MQVF8 New Orleans 68 37 79 28 212<br />
MAERSK STAFFORD MRSS9 Miami 0 19 8 36 63<br />
MAERSK SUN S6ES Seattle 71 88 36 0 195<br />
MAERSK SURREY MRSG8 Houston 0 0 15 16 31<br />
MAERSK TEXAS WCX3249 Houston 7 0 0 0 7<br />
MAGLEBY MAERSK OUSH2 Newark 26 14 14 20 74<br />
MAHARASHTRA VTSQ Seattle 0 86 0 15 101<br />
MAHIMAHI WHRN Oakland 48 53 67 60 228<br />
MAIRANGI BAY GXEW Long Beach 67 70 80 59 276<br />
MAJ STEPHEN W PLESS MPS1 WHAU Norfolk 0 26 92 11 129<br />
MAJESTIC MAERSK OUJH2 Newark 11 46 49 43 149<br />
MANGAL DESAI VTJS Cleveland 21 7 7 1 36<br />
MANHATTAN BRIDGE 3FWL4 Long Beach 30 25 68 42 165<br />
MANOA KDBG Oakland 41 71 66 81 259<br />
MANUKAI KNLO Oakland 19 58 53 67 197<br />
MANULANI KNIJ Oakland 0 44 30 61 135<br />
MARCARRIER V2VM Newark 243 0 0 1 244<br />
MARCHEN MAERSK OWDQ2 Long Beach 22 11 54 30 117<br />
MAREN MAERSK OWZU2 Long Beach 1 5 51 1 58<br />
MARGARET LYKES WGXO Houston 51 19 79 28 177<br />
MARGRETHE MAERSK OYSN2 Long Beach 12 35 30 47 124<br />
MARI BETH ANDRIE WUY3362 Chicago 0 0 15 37 52<br />
MARIE MAERSK OULL2 Newark 30 46 26 106 208<br />
MARIT MAERSK OZFC2 Oakland 31 26 35 47 139<br />
Continued on Page 77
Continued from Page 76<br />
VOS Cooperative <strong>Ship</strong> Reports<br />
SHIP NAME CALL PORT MAY JUN JUL AUG TOTAL<br />
MARK HANNAH WYZ5243 Chicago 7 47 48 15 117<br />
MARLIN 6ZXG New Orleans 0 0 0 67 67<br />
MARSTA MAERSK OUNO5 Norfolk 5 11 22 49 87<br />
MATHILDE MAERSK OUUU2 Long Beach 19 17 69 34 139<br />
MATSONIA KHRC Oakland 90 73 52 90 305<br />
MAUI WSLH Long Beach 43 30 109 90 272<br />
MAURICE EWING WLDZ Newark 28 26 20 47 121<br />
MAYAGUEZ WZJE Jacksonville 0 35 201 87 323<br />
MAYVIEW MAERSK OWEB2 Oakland 18 102 40 19 179<br />
MC-KINNEY MAERSK OUZW2 Newark 19 17 48 31 115<br />
MEDALLION OYEK2 Jacksonville 0 0 4 14 18<br />
MEDUSA CHALLENGER WA4659 Cleveland 92 108 132 117 449<br />
MEKHANIK MOLDOVANOV UIKI Seattle 22 0 0 0 22<br />
MELBOURNE HIGHWAY 3ERW2 Long Beach 0 0 0 4 4<br />
MELBOURNE STAR C6JY6 Newark 39 81 200 35 355<br />
MELVILLE WECB Long Beach 98 230 19 0 347<br />
MERCHANT PREMIER VROP Houston 31 30 10 38 109<br />
MERCHANT PRINCE C6HQ8 Houston 30 16 12 69 127<br />
MERIDIAN C6IP3 Miami 0 14 34 18 66<br />
MERLION ACE 9VHJ Long Beach 0 16 15 16 47<br />
MESABI MINER WYQ4356 Cleveland 164 0 0 197 361<br />
METEOR DBBH Houston 210 207 200 214 831<br />
METTE MAERSK OXKT2 Long Beach 15 21 19 85 140<br />
MICHIGAN WRB4141 Chicago 11 89 197 0 297<br />
MIDDLETOWN WR3225 Cleveland 44 51 24 38 157<br />
MING ASIA BDEA New York City 11 0 0 6 17<br />
MING PLEASURE BLII Long Beach 0 38 17 39 94<br />
MOANA PACIFIC P3EK7 Long Beach 0 4 2 0 6<br />
MOKIHANA WNRD Oakland 56 61 46 73 236<br />
MOKU PAHU WBWK Oakland 74 54 18 5 151<br />
MORELOS PGBB Houston 47 52 58 172 329<br />
MORMACSKY WMBQ New York City 0 0 3 11 14<br />
MORMACSTAR KGDF Houston 0 30 217 42 289<br />
MORMACSUN WMBK Norfolk 28 10 8 9 55<br />
MOSEL ORE ELRE5 Norfolk 66 61 251 59 437<br />
MSC BOSTON 9HGP4 New York City 8 0 0 0 8<br />
MSC JESSICA C6BK6 Newark 78 12 34 0 124<br />
MSC NEW YORK 9HIG4 New York City 3 0 0 0 3<br />
MUNKEBO MAERSK OUNI5 New York City 17 14 138 25 194<br />
MV MIRANDA 3FRO4 Norfolk 44 0 0 0 44<br />
MYRON C. TAYLOR WA8463 Chicago 27 84 104 105 320<br />
MYSTIC PCCQ Long Beach 0 9 37 45 91<br />
NADA II ELAV2 Seattle 16 0 0 0 16<br />
NAJA ARCTICA OXVH2 Miami 77 62 120 102 361<br />
NATIONAL DIGNITY DZRG Long Beach 8 7 14 9 38<br />
NATIONAL HONOR DZDI Long Beach 9 16 3 3 31<br />
NATIONAL PRIDE DZPK Long Beach 0 18 9 11 38<br />
NAUTICAS MEXICO XCMM Houston 0 0 0 21 21<br />
NEDLLOYD ABIDJAN S6BP Long Beach 18 52 136 12 218<br />
NEDLLOYD DELFT PGDD Houston 56 57 51 64 228<br />
NEDLLOYD HOLLAND KRHX Houston 32 148 52 121 353<br />
NEDLLOYD MONTEVIDEO PGAF Long Beach 32 22 1 44 99<br />
NEDLLOYD RALEIGH BAY PHKG Houston 21 34 36 38 129<br />
NEDLLOYD ROTTERDAM PGEI Newark 1 0 0 0 1<br />
NEDLLOYD VAN DAJIMA PGDB Houston 43 64 50 68 225<br />
NEDLLOYD VAN DIEMEN PGFE Houston 39 47 46 45 177<br />
NEGO LOMBOK DXQC Seattle 0 62 31 21 114<br />
NELVANA YJWZ7 Baltimore 16 67 70 22 175<br />
NEPTUNE ACE JFLX Long Beach 15 66 13 55 149<br />
NEPTUNE JADE 9VNQ Norfolk 0 9 6 4 19<br />
NEPTUNE RHODONITE ELJP4 Long Beach 19 39 32 21 111<br />
NEW CARISSA 3ELY7 Seattle 243 33 24 43 343<br />
NEW HORIZON WKWB Long Beach 52 29 0 6 87<br />
NEW NIKKI 3FHG5 Seattle 81 39 47 74 241<br />
NEWARK BAY WPKS Houston 26 56 35 144 261<br />
NEWPORT BRIDGE 3FGH3 Oakland 17 13 18 17 65<br />
<strong>NOAA</strong> DAVID STARR JORDAN WTDK Seattle 42 7 8 26 83<br />
<strong>NOAA</strong> SHIP ALBATROSS IV WMVF Norfolk 91 97 304 73 565<br />
<strong>NOAA</strong> SHIP CHAPMAN WTED New Orleans 175 147 169 106 597<br />
<strong>NOAA</strong> SHIP DELAWARE II KNBD New York City 142 69 205 55 471<br />
<strong>NOAA</strong> SHIP FERREL WTEZ Norfolk 54 66 125 255 500<br />
<strong>NOAA</strong> SHIP KA’IMIMOANA WTEU Seattle 141 472 106 224 943<br />
Continued on Page 78<br />
December 1998 77
Continued from Page 77<br />
78 <strong>Mariners</strong> <strong>Weather</strong> <strong>Log</strong><br />
VOS Cooperative <strong>Ship</strong> Reports<br />
SHIP NAME CALL PORT MAY JUN JUL AUG TOTAL<br />
<strong>NOAA</strong> SHIP MCARTHUR WTEJ Seattle 36 99 105 33 273<br />
<strong>NOAA</strong> SHIP MILLER FREEMAN WTDM Seattle 197 381 136 229 943<br />
<strong>NOAA</strong> SHIP OREGON II WTDO New Orleans 0 190 160 162 512<br />
<strong>NOAA</strong> SHIP RAINIER WTEF Seattle 60 97 78 81 316<br />
<strong>NOAA</strong> SHIP T. CROMWELL WTDF Seattle 82 413 177 130 802<br />
<strong>NOAA</strong> SHIP WHITING WTEW Baltimore 148 65 212 197 622<br />
NOBEL STAR KRPP Houston 0 8 21 6 35<br />
NOL AMBER S6CY Seattle 0 2 11 0 13<br />
NOL DELPHI ZCBF6 Houston 63 0 48 58 169<br />
NOL DIAMOND 9VYT Long Beach 0 0 2 5 7<br />
NOL LAGENO ZCBF2 New York City 0 58 59 46 163<br />
NOL RISSO ZCBE6 New York City 32 50 35 24 141<br />
NOL RUBY 9VOP Seattle 0 6 0 0 6<br />
NOL STENO ZCBD4 New York City 14 13 23 29 79<br />
NOL STENO ZCBF4 New York City 16 44 38 57 155<br />
NOL TOPAZ 9VOW Seattle 0 7 9 8 24<br />
NOL ZIRCON 9VOS Long Beach 0 29 17 13 59<br />
NOLIZWE MQLN7 New York City 241 45 72 128 486<br />
NOMZI MTQU3 Baltimore 131 105 239 81 556<br />
NOORDAM PGHT Miami 1 0 0 0 1<br />
NORASIA SHANGHAI DNHS New York City 26 4 29 29 88<br />
NORD JAHRE TRANSPORTER LACF4 Baltimore 0 15 8 0 23<br />
NORD PARTNER P3XC5 New York City 0 39 35 61 135<br />
NORDMAX P3YS5 Seattle 64 11 335 82 492<br />
NORDMORITZ P3YR5 Seattle 93 33 79 54 259<br />
NORDSTRAND P3NV5 Norfolk 6 0 0 0 6<br />
NORTHERN LIGHTS WFJK New Orleans 56 116 154 54 380<br />
NORTHERN LION A8IE Long Beach 0 142 67 0 209<br />
NORWAY C6CM7 Miami 0 10 3 3 16<br />
NTABENI 3EGR6 Houston 45 56 68 80 249<br />
NUERNBERG EXPRESS 9VBK Houston 730 689 729 718 2866<br />
NUEVO LEON XCKX Houston 47 62 35 31 175<br />
NUEVO SAN JUAN KEOD Norfolk 32 77 74 70 253<br />
NYK SEABREEZE ELNJ3 Seattle 6 32 24 18 80<br />
NYK SPRINGTIDE S6CZ Houston 7 6 12 15 40<br />
NYK STARLIGHT 3FUX6 Long Beach 10 31 41 52 134<br />
NYK SUNRISE 3FYZ6 Seattle 58 26 27 34 145<br />
NYK SURFWIND ELOT3 Seattle 4 1 0 0 5<br />
OCEAN BELUGA 3FEI6 Jacksonville 56 8 2 6 72<br />
OCEAN CAMELLIA 3FTR6 Seattle 68 51 188 58 365<br />
OCEAN CITY WCYR Houston 0 11 18 105 134<br />
OCEAN CLIPPER 3EXI7 New Orleans 65 0 63 119 247<br />
OCEAN HARMONY 3FRX6 Seattle 0 40 30 15 85<br />
OCEAN LAUREL 3FLX4 Seattle 6 1 4 32 43<br />
OCEAN LILY 3EQS7 Seattle 8 0 0 0 8<br />
OCEAN ORCHID 3ECQ9 Seattle 0 11 9 0 20<br />
OCEAN SERENE DURY Seattle 71 78 51 11 211<br />
OGLEBAY NORTON WAQ3521 Cleveland 83 21 8 11 123<br />
OLEANDER PJJU Newark 5 46 39 136 226<br />
OLIVEBANK 3ETQ5 Baltimore 17 4 27 37 85<br />
OLYMPIAN HIGHWAY 3FSH4 Seattle 0 0 0 11 11<br />
OMI COLUMBIA KLKZ Oakland 63 11 10 15 99<br />
OOCL AMERICA ELSM7 Oakland 20 12 44 53 129<br />
OOCL CALIFORNIA ELSA4 Seattle 28 13 12 23 76<br />
OOCL CHINA ELSU8 Long Beach 54 121 56 47 278<br />
OOCL ENVOY ELNV7 Seattle 31 27 22 17 97<br />
OOCL FAIR ELFV2 Long Beach 29 19 34 33 115<br />
OOCL FAME ELRO3 Seattle 0 42 14 12 68<br />
OOCL FIDELITY ELFV8 Long Beach 32 219 25 25 301<br />
OOCL FORTUNE ELFU8 Norfolk 105 31 20 47 203<br />
OOCL FREEDOM VRCV Norfolk 22 39 54 45 160<br />
OOCL FRONTIER VRUC6 Seattle 0 22 17 14 53<br />
OOCL HONG KONG VRVA5 Oakland 11 40 39 31 121<br />
OOCL INNOVATION WPWH Houston 130 54 40 266 490<br />
OOCL INSPIRATION KRPB Houston 38 146 51 140 375<br />
OOCL JAPAN ELSU6 Long Beach 64 70 57 46 237<br />
ORANGE BLOSSOM ELEI6 Newark 5 0 0 0 5<br />
ORANGE WAVE ELPX7 Newark 0 0 8 3 11<br />
ORIANA GVSN Miami 43 34 22 37 136<br />
ORIENTE GRACE 3FHT4 Seattle 33 21 19 14 87<br />
ORIENTE HOPE 3ETH4 Seattle 53 33 67 46 199<br />
ORIENTE NOBLE 3FVF5 Seattle 26 18 5 22 71<br />
Continued on Page 79
Continued from Page 78<br />
VOS Cooperative <strong>Ship</strong> Reports<br />
SHIP NAME CALL PORT MAY JUN JUL AUG TOTAL<br />
ORIENTE PRIME 3FOU4 Seattle 0 20 23 17 60<br />
OURO DO BRASIL ELPP9 Baltimore 15 26 42 41 124<br />
OVERSEAS ALASKA WEHV Seattle 0 12 7 19 38<br />
OVERSEAS ARCTIC KLEZ New Orleans 0 14 23 36 73<br />
OVERSEAS CHICAGO KBCF Oakland 5 11 131 7 154<br />
OVERSEAS HARRIET WRFJ Houston 0 23 12 30 65<br />
OVERSEAS JOYCE WUQL Jacksonville 60 24 46 33 163<br />
OVERSEAS JUNEAU WWND Seattle 10 46 0 11 67<br />
OVERSEAS MARILYN WFQB Houston 0 21 33 12 66<br />
OVERSEAS NEW ORLEANS WFKW Houston 26 5 18 68 117<br />
OVERSEAS NEW YORK WMCK Houston 16 1 11 17 45<br />
OVERSEAS OHIO WJBG Oakland 47 62 74 53 236<br />
OVERSEAS VIVIAN KAAZ Norfolk 0 0 1 1 2<br />
OVERSEAS WASHINGTON WFGV Houston 0 3 44 79 126<br />
P&O NEDLLOYD CHILE DVRA New York City 20 0 3 0 23<br />
PACASIA ELKM7 Seattle 0 27 18 27 72<br />
PACDUKE A8SL Seattle 8 24 33 8 73<br />
PACIFIC ARIES ELJQ2 Seattle 7 23 0 0 30<br />
PACIFIC HIRO 3FOY5 Seattle 0 0 0 42 42<br />
PACIFIC HOPE 3EOK8 Seattle 0 21 36 0 57<br />
PACIFIC RAINBOW II 3FCY5 Seattle 0 14 5 7 26<br />
PACIFIC SANDPIPER GDRJ Miami 63 83 53 29 228<br />
PACIFIC SELESA DVCK Seattle 27 0 0 0 27<br />
PACIFIC SENATOR ELTY6 Long Beach 0 47 20 37 104<br />
PACIFIC WAVE 3EXQ9 Long Beach 0 1 17 18 36<br />
PACMERCHANT 5MCB Seattle 0 10 11 6 27<br />
PACOCEAN XYLA Seattle 2 2 0 0 4<br />
PACROSE YJQK2 Seattle 2 14 10 92 118<br />
PACSEA XYKX Seattle 8 15 0 17 40<br />
PACSTAR XYLB Seattle 23 50 77 20 170<br />
PARIS ELTY4 Houston 1 0 0 0 1<br />
PAUL BUCK KDGR Houston 0 0 0 103 103<br />
PAUL H. TOWNSEND WF9016 Cleveland 0 35 0 0 35<br />
PAUL R. TREGURTHA WYR4481 Cleveland 69 99 172 75 415<br />
PEGASUS HIGHWAY 3FMA4 New York City 13 18 15 22 68<br />
PEGGY DOW PJOY Long Beach 70 46 30 63 209<br />
PFC EUGENE A. OBREGON WHAQ Norfolk 0 0 5 80 85<br />
PFC JAMES ANDERSON JR WJXG Newark 24 0 0 23 47<br />
PHILADELPHIA KSYP Baltimore 26 47 47 54 174<br />
PHILIP R. CLARKE WE3592 Chicago 38 104 92 39 273<br />
PHOENIX DIAMOND 3EGS6 Norfolk 0 10 34 33 77<br />
PIERRE FORTIN CG2678 Norfolk 223 226 225 235 909<br />
PINO GLORIA 3EZW7 Seattle 15 14 34 41 104<br />
PISCES EXPLORER MWQD5 Long Beach 21 21 34 28 104<br />
PISCES PIONEER MWQE5 Long Beach 40 61 20 30 151<br />
POLAR EAGLE ELPT3 Long Beach 51 36 53 53 193<br />
POLYNESIA D5NZ Long Beach 92 192 104 93 481<br />
POROS P3DX6 New Orleans 0 0 2 0 2<br />
POTOMAC TRADER WXBZ Houston 43 12 17 48 120<br />
POYANG ELAX2 Long Beach 3 43 55 60 161<br />
PRESIDENT ADAMS WRYW Oakland 55 58 69 72 254<br />
PRESIDENT EISENHOWER KRJG Long Beach 2 50 98 56 206<br />
PRESIDENT F. ROOSEVELT KRJF Long Beach 0 77 73 39 189<br />
PRESIDENT HOOVER WCY2883 Oakland 54 0 0 0 54<br />
PRESIDENT JACKSON WRYC Oakland 71 20 82 28 201<br />
PRESIDENT KENNEDY WRYE Oakland 33 32 17 46 128<br />
PRESIDENT POLK WRYD Oakland 62 58 49 60 229<br />
PRESIDENT TRUMAN WNDP Oakland 18 44 24 39 125<br />
PRESQUE ISLE WZE4928 Chicago 144 203 81 89 517<br />
PRIDE OF BALTIMORE II WUW2120 Baltimore 74 0 0 168 242<br />
PRINCE OF OCEAN 3ECO9 Seattle 62 0 58 57 177<br />
PRINCE OF TOKYO 2 3EUU6 Seattle 0 43 283 35 361<br />
PRINCE WILLIAM SOUND WSDX Long Beach 18 64 13 54 149<br />
PRINCESS CLIPPER VRUC4 Norfolk 27 0 0 0 27<br />
PRINCESS OF SCANDINAVIA OWEN2 Miami 129 49 64 104 346<br />
PROJECT ARABIA PJKP Miami 20 26 48 57 151<br />
PROJECT ORIENT PJAG Baltimore 15 32 10 9 66<br />
PUDONG SENATOR DQVI Seattle 55 0 0 58 113<br />
PUERTO CORTES C6IM2 Jacksonville 0 0 1 23 24<br />
PUSAN SENATOR DQVG Seattle 25 22 7 0 54<br />
QUEEN ELIZABETH 2 GBTT New York City 50 20 49 55 174<br />
QUEEN OF SCANDINAVIA OUSE6 Miami 52 78 58 48 236<br />
Continued on Page 80<br />
December 1998 79
Continued from Page 79<br />
80 <strong>Mariners</strong> <strong>Weather</strong> <strong>Log</strong><br />
VOS Cooperative <strong>Ship</strong> Reports<br />
SHIP NAME CALL PORT MAY JUN JUL AUG TOTAL<br />
QUEENSLAND STAR C6JZ3 Houston 122 73 203 77 475<br />
R. HAL DEAN C6JN Long Beach 0 0 7 0 7<br />
R.J. PFEIFFER WRJP Long Beach 65 23 52 22 162<br />
RANI PADMINI ATSR Norfolk 0 15 5 15 35<br />
RAYMOND E. GALVIN ELCO5 Oakland 0 41 9 9 59<br />
REBECCA LYNN WCW7977 Chicago 3 0 0 60 63<br />
REGINA J V2AC3 Miami 0 29 10 0 39<br />
REPULSE BAY MQYA3 Houston 0 59 46 47 152<br />
RESERVE WE7207 Cleveland 50 144 85 75 354<br />
RESOLUTE KFDZ Norfolk 53 11 38 57 159<br />
RHAPSODY OF THE SEAS LAZK4 Miami 4 0 0 0 4<br />
RHINE FOREST ELFO3 New Orleans 0 82 39 47 168<br />
RICHARD G MATTHIESEN WLBV Jacksonville 0 0 3 4 7<br />
RICHARD REISS WBF2376 Cleveland 6 17 0 0 23<br />
RIO ENCO CBRE New York City 4 0 0 0 4<br />
ROGER BLOUGH WZP8164 Chicago 103 103 79 89 374<br />
ROGER REVELLE KAOU New Orleans 55 0 0 46 101<br />
RONALD H. BROWN WTEC New Orleans 83 0 48 251 382<br />
ROSITA LATL2 Miami 0 35 0 4 39<br />
ROSSEL CURRENT J8FI6 Houston 11 210 188 44 453<br />
ROVER KCBH Houston 0 0 4 0 4<br />
ROYAL ETERNITY DUXW Norfolk 56 0 0 0 56<br />
ROYAL MAJESTY 3ETG9 Miami 0 7 13 2 22<br />
ROYAL PRINCESS GBRP Long Beach 27 17 29 11 84<br />
RUBIN BONANZA 3FNV5 Seattle 10 0 28 27 65<br />
RUBIN KOBE DYZM Seattle 52 59 55 63 229<br />
RUBIN PEARL YJQA8 Seattle 0 53 13 9 75<br />
RUBIN STAR 3FIA5 Seattle 0 12 2 0 14<br />
RUBIN STELLA 3FAP5 Seattle 25 159 14 24 222<br />
SAGA CREST LATH4 Miami 0 16 7 0 23<br />
SALOME S6CL Newark 0 5 85 29 119<br />
SAM HOUSTON KDGA Houston 28 0 23 145 196<br />
SAMUEL GINN C6OB Oakland 49 0 0 0 49<br />
SAMUEL H. ARMACOST C6FA2 Oakland 10 7 5 32 54<br />
SAMUEL L. COBB KCDJ Oakland 0 0 24 0 24<br />
SAMUEL RISLEY CG2960 Norfolk 151 86 14 76 327<br />
SAN ANTONIO LATN4 New Orleans 44 62 50 56 212<br />
SAN FELIPE DNEN Houston 15 3 0 0 18<br />
SAN FERNANDO DGGD Houston 37 7 15 24 83<br />
SAN FRANCISCO DIGF New York City 33 17 22 40 112<br />
SAN ISIDRO ELVG8 Norfolk 24 0 0 0 24<br />
SAN MARCOS ELND4 Jacksonville 48 19 289 0 356<br />
SAN VINCENTE DNGV Norfolk 0 29 31 60 120<br />
SANKO LAUREL 3EXQ3 Seattle 0 0 52 60 112<br />
SANKO MOON 3FKE2 Seattle 0 13 5 9 27<br />
SANTA CHRISTINA 3FAE6 Seattle 80 148 55 34 317<br />
SANTA ISABELLALOON DPSI Long Beach 0 0 0 5 5<br />
SANTORIN 2 P3ZL4 Seattle 0 112 46 263 421<br />
SARAMATI 9VIW Baltimore 3 0 1 21 25<br />
SC HORIZON ELOC8 New York City 76 174 64 67 381<br />
SCHACKENBORG OYUY4 Houston 0 2 5 19 26<br />
SEA COMMERCE ELGH7 Miami 0 29 33 31 93<br />
SEA FLORIDA 3EKI3 New Orleans 0 41 61 41 143<br />
SEA FOX KBGK Jacksonville 32 40 191 74 337<br />
SEA INITIATIVE DEBB Houston 4 3 7 49 63<br />
SEA ISLE CITY WCYQ Houston 0 15 28 30 73<br />
SEA LION KJLV Jacksonville 150 0 62 110 322<br />
SEA LYNX DGOO Jacksonville 49 0 0 59 108<br />
SEA MAJESTY DYAA Seattle 0 50 91 45 186<br />
SEA MARINER J8FF9 Miami 68 0 1 0 69<br />
SEA NOVIA ELRV2 Miami 0 13 15 0 28<br />
SEA PRINCESS KRCP New Orleans 6 50 26 15 97<br />
SEA RACER ELQI8 Jacksonville 21 15 13 7 56<br />
SEA SPRAY WRXN Newark 0 4 9 8 21<br />
SEA TRADE ELGH4 Norfolk 0 14 0 0 14<br />
SEA VIGOR P3ZH4 Miami 13 0 0 0 13<br />
SEA WISDOM 3FUO6 Seattle 35 14 0 45 94<br />
SEA WOLF KNFG Jacksonville 4 52 147 92 295<br />
SEA-LAND CHARGER V7AY2 Long Beach 0 42 64 51 157<br />
SEA-LAND EAGLE V7AZ8 Long Beach 58 0 34 30 122<br />
SEA/LAND VICTORY DIDY New York City 3 38 32 25 98<br />
SEABOARD SUN ELRV6 Jacksonville 4 35 17 18 74<br />
Continued on Page 81
Continued from Page 80<br />
VOS Cooperative <strong>Ship</strong> Reports<br />
SHIP NAME CALL PORT MAY JUN JUL AUG TOTAL<br />
SEABOARD UNIVERSE ELRU3 Miami 15 25 65 29 134<br />
SEABREEZE I 3FGV2 Miami 11 14 13 9 47<br />
SEALAND ANCHORAGE KGTX Seattle 50 44 47 44 185<br />
SEALAND ARGENTINA DGVN Jacksonville 9 0 0 0 9<br />
SEALAND ATLANTIC KRLZ Norfolk 24 12 1 33 70<br />
SEALAND CHALLENGER WZJC Newark 74 56 63 35 228<br />
SEALAND CHAMPION V7AM9 Oakland 37 23 75 51 186<br />
SEALAND COMET V7AP3 Oakland 12 16 7 86 121<br />
SEALAND CONSUMER WCHF Long Beach 47 7 40 18 112<br />
SEALAND CRUSADER WZJF Jacksonville 81 89 120 29 319<br />
SEALAND DEFENDER KGJB Oakland 41 34 29 105 209<br />
SEALAND DEVELOPER KHRH Long Beach 29 58 48 52 187<br />
SEALAND DISCOVERY WZJD Jacksonville 72 63 50 62 247<br />
SEALAND ENDURANCE KGJX Long Beach 21 60 8 35 124<br />
SEALAND ENTERPRISE KRGB Oakland 74 103 162 68 407<br />
SEALAND EXPEDITION WPGJ Jacksonville 64 5 175 25 269<br />
SEALAND EXPLORER WGJF Long Beach 46 21 47 106 220<br />
SEALAND EXPRESS KGJD Long Beach 24 377 10 45 456<br />
SEALAND FREEDOM V7AM3 Seattle 23 80 35 51 189<br />
SEALAND HAWAII KIRF Houston 63 42 48 33 186<br />
SEALAND INDEPENDENCE WGJC Long Beach 0 25 126 67 218<br />
SEALAND INNOVATOR WGKF Oakland 90 41 60 31 222<br />
SEALAND INTEGRITY WPVD Houston 111 165 87 148 511<br />
SEALAND INTREPID V7BA2 Norfolk 33 0 0 0 33<br />
SEALAND KODIAK KGTZ Seattle 21 1 19 20 61<br />
SEALAND LIBERATOR KHRP Oakland 63 25 19 18 125<br />
SEALAND MARINER V7AM5 Seattle 0 72 57 5 134<br />
SEALAND MERCURY V7AP6 Oakland 31 25 87 65 208<br />
SEALAND METEOR V7AP7 Long Beach 8 43 27 80 158<br />
SEALAND NAVIGATOR WPGK Long Beach 44 82 93 79 298<br />
SEALAND PACER KSLB Newark 18 12 10 15 55<br />
SEALAND PACIFIC WSRL Long Beach 68 71 99 54 292<br />
SEALAND PATRIOT KHRF Oakland 61 16 95 52 224<br />
SEALAND PERFORMANCE KRPD Norfolk 82 229 57 47 415<br />
SEALAND PRODUCER WJBJ Long Beach 94 78 98 58 328<br />
SEALAND QUALITY KRNJ Jacksonville 9 25 204 22 260<br />
SEALAND RACER V7AP8 Long Beach 17 43 24 26 110<br />
SEALAND RELIANCE WFLH Long Beach 87 61 80 84 312<br />
SEALAND SPIRIT WFLG Oakland 36 0 11 50 97<br />
SEALAND TACOMA KGTY Seattle 45 63 24 58 190<br />
SEALAND TRADER KIRH Oakland 89 47 96 82 314<br />
SEALAND VOYAGER KHRK Seattle 57 35 105 59 256<br />
SEARIVER BATON ROUGE WAFA Oakland 14 9 0 6 29<br />
SEARIVER BAYTOWN KFPM Oakland 0 0 10 5 15<br />
SEARIVER BENICIA KPKL Long Beach 1 2 8 20 31<br />
SEARIVER LONG BEACH WHCA Long Beach 13 0 0 14 27<br />
SEARIVER NORTH SLOPE KHLQ Oakland 8 1 0 0 9<br />
SEARIVER SAN FRANCISCO KAAC Oakland 9 10 13 26 58<br />
SEAWIND CROWN 3EIY6 Miami 0 51 57 31 139<br />
SEILLEAN 3FPF6 Long Beach 0 108 112 117 337<br />
SENSATION 3ESE9 Miami 16 48 37 44 145<br />
SETO BRIDGE JMQY Oakland 0 43 59 65 167<br />
SEVEN OCEAN DULR Seattle 0 1 15 7 23<br />
SEWARD JOHNSON WST9756 Miami 96 0 0 339 435<br />
SGT WILLIAM A BUTTON WJLX Norfolk 0 0 31 19 50<br />
SGT. METEJ KOCAK WHAC Norfolk 10 13 12 34 69<br />
SHELLY BAY 3EKH3 Miami 18 73 59 59 209<br />
SHIRAOI MARU 3ECM7 Seattle 82 76 77 52 287<br />
SIBOHELLE LAQN4 Norfolk 0 10 7 18 35<br />
SIDNEY STAR C6JY7 Houston 59 64 30 56 209<br />
SIETE OCEANOS DYBX Seattle 0 57 0 0 57<br />
SINCERE GEMINI 3FFG3 Seattle 0 5 0 1 6<br />
SINCERE SUCCESS VRUC5 Seattle 0 2 22 9 33<br />
SKAUBRYN LAJV4 Seattle 24 21 27 15 87<br />
SKAUGRAN LADB2 Seattle 61 9 3 2 75<br />
SKOGAFOSS V2QT Norfolk 0 44 29 40 113<br />
SKY PRINCESS GYYP Miami 0 26 114 24 164<br />
SNOW CRYSTAL C6ID8 New York City 0 42 43 58 143<br />
SOKOLICA ELIG5 Baltimore 2 8 28 35 73<br />
SOL DO BRASIL ELQQ4 Baltimore 0 18 13 5 36<br />
SOLAR WING ELJS7 Jacksonville 42 37 40 29 148<br />
SONG OF AMERICA LENA3 Miami 7 20 16 6 49<br />
Continued on Page 82<br />
December 1998 81
Continued from Page 81<br />
82 <strong>Mariners</strong> <strong>Weather</strong> <strong>Log</strong><br />
VOS Cooperative <strong>Ship</strong> Reports<br />
SHIP NAME CALL PORT MAY JUN JUL AUG TOTAL<br />
SONORA XCTJ Houston 39 309 37 32 417<br />
SOREN TOUBRO VTFM Cleveland 1 167 34 7 209<br />
SOUTH FORTUNE 3FJC6 Seattle 61 0 0 0 61<br />
SOUTHERN LION V7AW8 Long Beach 38 7 19 8 72<br />
SPERO LAON4 Seattle 80 46 47 74 247<br />
SPRING GANNET 3EVB3 Seattle 92 43 5 22 162<br />
SPRING WAVE 9VXB Seattle 19 25 23 48 115<br />
ST BLAIZE J8FO Norfolk 52 0 44 38 134<br />
ST. CLAIR WZA4027 Cleveland 0 118 0 0 118<br />
STAR ALABAMA LAVU4 Long Beach 10 2 7 5 24<br />
STAR AMERICA LAVV4 Jacksonville 37 30 132 7 206<br />
STAR DOVER LAEP4 Seattle 6 0 0 0 6<br />
STAR EAGLE LAWO2 Houston 30 12 14 25 81<br />
STAR EVVIVA LAHE2 Jacksonville 9 42 29 14 94<br />
STAR FLORIDA LAVW4 Houston 43 24 32 52 151<br />
STAR FUJI LAVX4 Seattle 14 35 19 22 90<br />
STAR GRAN LADR4 Long Beach 33 14 18 0 65<br />
STAR GRINDANGER ELFT9 Norfolk 4 0 0 0 4<br />
STAR HANSA LAXP4 Jacksonville 1 0 0 0 1<br />
STAR HARDANGER LAXD4 Baltimore 5 119 45 79 248<br />
STAR HERDLA LAVD4 Baltimore 34 16 30 22 102<br />
STAR HOYANGER LAXG4 Long Beach 0 0 1 0 1<br />
STAR SKARVEN LAJY2 Miami 36 33 28 41 138<br />
STAR SKOGANGER LASS2 Houston 12 7 5 12 36<br />
STAR STRONEN LAHG2 Houston 22 0 4 62 88<br />
STATENDAM PHSG Miami 12 0 0 0 12<br />
STELLA LYKES WGXN Houston 27 17 14 131 189<br />
STEPAN KRASHENINNIKOV UYPO Seattle 5 2 5 8 20<br />
STEPHAN J V2JN Miami 95 145 133 131 504<br />
STEWART J. CORT WYZ3931 Chicago 33 5 23 81 142<br />
STOLT CONDOR D5VF Newark 9 0 2 0 11<br />
STOLT HELLULAND ELJZ7 New York City 0 3 0 0 3<br />
STONEWALL JACKSON KDDW New Orleans 68 11 75 33 187<br />
STRONG CAJUN KALK Norfolk 25 0 0 0 25<br />
STRONG VIRGINIAN KSPH Oakland 0 50 33 15 98<br />
SUGAR ISLANDER KCKB Houston 0 1 0 0 1<br />
SUMMER BREEZE ZCBB4 Miami 2 45 42 22 111<br />
SUMMER MEADOW ZCAY8 Long Beach 0 10 13 7 30<br />
SUN DANCE 3ETQ8 Seattle 12 14 23 14 63<br />
SUN PRINCESS ELSJ2 Miami 0 0 4 2 6<br />
SUNBELT DIXIE D5BU Baltimore 16 17 15 49 97<br />
SUNDA ELPB8 Houston 64 43 54 58 219<br />
SUSAN W. HANNAH WAH9146 Chicago 11 209 0 0 220<br />
SVEN OLTMANN V2JP Miami 32 27 22 29 110<br />
SWAN ARROW C6CN8 Baltimore 4 0 0 0 4<br />
T/V STATE OF MAINE NTNR Norfolk 12 44 3 0 59<br />
TADEUSZ OCIOSZYNSKI SQGI Houston 0 0 7 0 7<br />
TAI CHUNG BHFL Seattle 0 0 29 19 48<br />
TAI HE BOAB Long Beach 53 42 34 90 219<br />
TAI SHING BHFR Seattle 0 11 37 13 61<br />
TAIHO MARU 3FMP6 Seattle 114 32 27 21 194<br />
TAIKO LAQT4 New York City 9 2 3 1 15<br />
TAKAYAMA LACQ5 New York City 5 35 68 120 228<br />
TALABOT LAQU4 Miami 4 53 3 63 123<br />
TALLAHASSEE BAY WRA4829 Houston 0 45 0 0 45<br />
TANABATA LAZO4 Baltimore 18 21 16 0 55<br />
TAPIOLA LAOQ2 Norfolk 3 0 0 0 3<br />
TARAGO C6LS7 Long Beach 0 0 18 0 18<br />
TARONGA LACU5 Jacksonville 0 0 38 0 38<br />
TELLUS WRYG Baltimore 56 35 24 34 149<br />
TEPOZTECO II ZCAZ7 Seattle 0 11 3 24 38<br />
TEQUI 3FDZ5 Seattle 19 32 15 0 66<br />
TEXAS LMWR3 Baltimore 0 0 21 43 64<br />
TEXAS CLIPPER KVWA Houston 0 37 35 0 72<br />
TILLIE LYKES WMLH Houston 73 136 42 58 309<br />
TMM MEXICO XCMG Houston 15 59 37 306 417<br />
TMM OAXACA ELUA5 Houston 60 44 19 0 123<br />
TMM VERACRUZ ELFU9 Norfolk 24 20 30 15 89<br />
TOBIAS MAERSK MSJY8 Long Beach 22 25 3 0 50<br />
TOKIO EXPRESS 9VUY Long Beach 357 6 118 603 1084<br />
TOLUCA 3EFY7 Long Beach 0 9 5 4 18<br />
TONSINA KJDG Houston 0 0 0 1 1<br />
Continued on Page 83
Continued from Page 82<br />
VOS Cooperative <strong>Ship</strong> Reports<br />
SHIP NAME CALL PORT MAY JUN JUL AUG TOTAL<br />
TORBEN V2TI Norfolk 0 15 0 12 27<br />
TORM AMERICA J8FI5 New York City 0 19 0 0 19<br />
TORM FREYA OXDF3 Norfolk 27 32 30 32 121<br />
TOWER BRIDGE ELJL3 Seattle 14 14 12 15 55<br />
TRADE APOLLO VRUN7 New York City 25 51 63 39 178<br />
TRANSWORLD BRIDGE ELJJ5 Seattle 60 60 55 43 218<br />
TRINITY WRGL Houston 55 0 0 0 55<br />
TRITON WTU2310 Chicago 63 0 0 0 63<br />
TROPIC DAY J8PC Miami 0 0 16 0 16<br />
TROPIC FLYER J8NV Miami 0 0 15 24 39<br />
TROPIC ISLE J8PA Miami 0 18 11 14 43<br />
TROPIC JADE J8NY Miami 0 19 19 14 52<br />
TROPIC KEY J8PE Miami 13 32 0 0 45<br />
TROPIC LURE J8PD Miami 19 11 12 14 56<br />
TROPIC MIST J8NZ Miami 16 0 0 0 16<br />
TROPIC SUN 3EZK9 New Orleans 63 45 33 37 178<br />
TROPIC TIDE 3FGQ3 Miami 38 16 35 41 130<br />
TROPICALE ELBM9 New Orleans 1 40 0 4 45<br />
TRSL ARCTURUS MSQQ8 Baltimore 0 18 22 0 40<br />
TRUST 38 3EUY3 Baltimore 0 75 59 0 134<br />
TUI PACIFIC P3GB4 Seattle 53 0 0 0 53<br />
TURMOIL 9VGL New York City 14 13 3 2 32<br />
TYSON LYKES WMLG Houston 31 47 48 20 146<br />
USCGC ACACIA (WLB406) NODY Chicago 0 3 16 9 28<br />
USCGC ACTIVE WMEC 618 NRTF Seattle 91 0 119 20 230<br />
USCGC ACUSHNET WMEC 167 NNHA Oakland 20 0 43 3 66<br />
USCGC ALERT (WMEC 630) NZVE Seattle 0 7 0 0 7<br />
USCGC BOUTWELL WHEC 719 NYCQ Seattle 0 6 5 0 11<br />
USCGC BRAMBLE (WLB 392) NODK Cleveland 0 0 3 1 4<br />
USCGC CHASE (WHEC 718) NLPM Long Beach 0 0 1 0 1<br />
USCGC COURAGEOUS NCRG Norfolk 0 0 2 1 3<br />
USCGC DAUNTLESS WMEC 624 NDTS Houston 0 25 19 88 132<br />
USCGC DILIGENCE WMEC 616 NMUD Norfolk 0 0 7 4 11<br />
USCGC DURABLE (WMEC 628) NRUN Houston 0 3 0 12 15<br />
USCGC EAGLE (WIX 327) NRCB Miami 0 4 0 1 5<br />
USCGC HAMILTON WHEC 715 NMAG Long Beach 0 0 0 5 5<br />
USCGC HARRIET LANE NHNC Norfolk 31 9 13 16 69<br />
USCGC HORNBEAM NODM Norfolk 0 4 0 0 4<br />
USCGC LEGARE NRPM Norfolk 0 2 0 25 27<br />
USCGC MELLON (WHEC 717) NMEL Seattle 0 28 0 85 113<br />
USCGC MIDGETT (WHEC 726) NHWR Seattle 0 2 25 61 88<br />
USCGC PLANETREE NRPY Seattle 0 0 34 4 38<br />
USCGC POLAR SEA__(WAGB 1 NRUO Seattle 140 0 0 6 146<br />
USCGC RELIANCE WMEC 615 NJPJ Miami 1 2 2 1 6<br />
USCGC SASSAFRAS NODT Oakland 0 0 1 1 2<br />
USCGC SEDGE (WLB 402) NODU Seattle 0 0 3 8 11<br />
USCGC SENECA NFMK Norfolk 31 0 30 26 87<br />
USCGC SPENCER NWHE Norfolk 5 0 0 0 5<br />
USCGC STEADFAST (WMEC 62 NSTF Seattle 0 3 84 0 87<br />
USCGC STORIS (WMEC 38) NRUC Seattle 12 10 20 6 48<br />
USCGC SUNDEW (WLB 404) NODW Chicago 1 2 0 6 9<br />
USCGC SWEETBRIER WLB 405 NODX Seattle 7 6 17 6 36<br />
USCGC TAHOMA NCBE Norfolk 29 13 13 96 151<br />
USCGC TAMPA WMEC 902 NIKL Norfolk 0 0 0 97 97<br />
USCGC THETIS NYWL Jacksonville 23 0 0 39 62<br />
USCGC VALIANT (WMEC 621) NVAI Miami 0 38 0 23 61<br />
USCGC VENTUROUS WMEC 625 NVES Oakland 13 9 78 0 100<br />
USCGC WOODRUSH (WLB 407) NODZ Seattle 0 5 3 1 9<br />
USNS ALGOL NAMW Jacksonville 0 0 0 1 1<br />
USNS APACHE (T-ATF 172) NIGP Norfolk 40 20 14 39 113<br />
USNS BOWDITCH NWSW New Orleans 0 0 51 53 104<br />
USNS CAPELLA NBXO Jacksonville 0 0 23 0 23<br />
USNS DENEBOLA NDSP Newark 0 0 8 0 8<br />
USNS GUS W. DARNELL KCDK Houston 13 4 6 46 69<br />
USNS HAYES NRLW Jacksonville 0 0 109 0 109<br />
USNS HENSON NENB New Orleans 48 0 0 0 48<br />
USNS JOHN MCDONNELL (T-A NJMD New Orleans 0 93 20 0 113<br />
USNS LARAMIE T-AO 203 NLAR New Orleans 0 2 0 0 2<br />
USNS PATHFINDER T-AGS 60 NGKK New Orleans 0 0 86 57 143<br />
USNS PATUXENT NPCZ New Orleans 63 120 72 48 303<br />
USNS PECOS NPEC Oakland 0 504 11 0 515<br />
Continued on Page 84<br />
December 1998 83
Continued from Page 83<br />
84 <strong>Mariners</strong> <strong>Weather</strong> <strong>Log</strong><br />
VOS Cooperative <strong>Ship</strong> Reports<br />
SHIP NAME CALL PORT MAY JUN JUL AUG TOTAL<br />
USNS SATURN T-AFS-10 NADH Norfolk 48 34 43 60 185<br />
USNS SIOUX NJOV Oakland 202 0 0 0 202<br />
USNS SIRIUS (T-AFS 8) NPGA Norfolk 0 24 48 48 120<br />
USNS SUMNER NZAU New Orleans 72 69 50 33 224<br />
USNS TIPPECANOE (TAO-199 NTIP New Orleans 0 0 0 263 263<br />
USNS VANGUARD TAG 194 NIDR Newark 0 10 247 45 302<br />
USNS YUKON (T-AO 202) NYUK New Orleans 27 0 0 0 27<br />
VASILTY BURKHANOV UZHC Seattle 12 15 31 12 70<br />
VEGA 9VJS Houston 39 42 36 32 149<br />
VENUS DIAMOND 9VRR Houston 0 0 13 0 13<br />
VERA ACORDE 3EAG4 Seattle 8 285 0 11 304<br />
VICTORIA GBBA Miami 7 22 16 5 50<br />
VIRGINIA 3EBW4 Seattle 114 102 74 162 452<br />
VISAYAN GLORY 3EHJ7 Seattle 0 28 135 0 163<br />
VIVA LACU2 Norfolk 0 63 61 110 234<br />
WALTER J. MCCARTHY WXU3434 Cleveland 0 21 33 22 76<br />
WASHINGTON HIGHWAY JKHH Seattle 38 15 45 61 159<br />
WASHINGTON SENATOR DEAZ Long Beach 0 0 36 55 91<br />
WAVELET DVDJ Seattle 0 0 0 13 13<br />
WECOMA WSD7079 Seattle 90 84 89 62 325<br />
WESTERN BRIDGE C6JQ9 Baltimore 0 0 0 75 75<br />
WESTERN LION A8BN Long Beach 0 63 0 24 87<br />
WESTWARD WZL8190 Miami 28 0 0 24 52<br />
WESTWARD VENTURE KHJB Seattle 95 141 144 86 466<br />
WESTWOOD ANETTE DVDM Seattle 74 52 29 48 203<br />
WESTWOOD BELINDA C6CE7 Seattle 44 48 55 61 208<br />
WESTWOOD CLEO C6OQ8 Seattle 60 26 15 5 106<br />
WESTWOOD FUJI S6BR Seattle 63 35 58 53 209<br />
WESTWOOD HALLA S6BO Seattle 42 127 61 55 285<br />
WESTWOOD JAGO C6CW9 Seattle 64 21 16 32 133<br />
WESTWOOD MARIANNE DVPV Seattle 0 6 23 22 51<br />
WILFRED SYKES WC5932 Chicago 3 38 46 52 139<br />
WILLIAM E. CRAIN ELOR2 Oakland 0 32 0 0 32<br />
WILLIAM E. MUSSMAN D5OE Seattle 66 42 57 46 211<br />
WOLVERINE WZC4518 Cleveland 0 68 11 21 100<br />
YUCATAN XCUY Houston 39 130 20 28 217<br />
YURIY OSTROVSKIY UAGJ Seattle 79 189 81 82 431<br />
ZAGREB EXPRESS 9HPL3 Norfolk 9 0 0 0 9<br />
ZENITH ELOU5 Miami 0 11 3 7 21<br />
ZIM ADRIATIC 4XIO Long Beach 0 36 23 5 64<br />
ZIM AMERICA 4XGR Newark 17 5 22 38 82<br />
ZIM ASIA 4XFB New Orleans 52 68 48 22 190<br />
ZIM ATLANTIC 4XFD New York City 26 33 20 55 134<br />
ZIM CANADA 4XGS Norfolk 55 33 29 41 158<br />
ZIM CHINA 4XFQ New York City 48 0 0 0 48<br />
ZIM EUROPA 4XFN New York City 31 26 9 22 88<br />
ZIM IBERIA 4XFP New York City 21 0 0 0 21<br />
ZIM ISRAEL 4XGX New Orleans 23 21 31 42 117<br />
ZIM ITALIA 4XGT New Orleans 69 22 39 16 146<br />
ZIM JAMAICA 4XFE New York City 21 19 52 30 122<br />
ZIM JAPAN 4XGV Baltimore 63 56 33 11 163<br />
ZIM KEELUNG 4XII Newark 0 7 3 27 37<br />
ZIM KOREA 4XGU Miami 21 12 39 24 96<br />
ZIM MONTEVIDEO V2AG7 Norfolk 22 9 11 9 51<br />
ZIM SANTOS ELRJ6 Baltimore 39 50 53 32 174<br />
ZIM SAVANNAH 4XIL Long Beach 0 19 17 2 38<br />
ZIM U.S.A. 4XFO New York City 0 0 0 5 5<br />
Totals May 35,031<br />
Jun 44,390<br />
Jul 43,822<br />
Aug 43,383<br />
Period Total 166,626
Buoy Climatological Data Summary —<br />
April through August 1998<br />
Buoy Climatological Data Summary<br />
<strong>Weather</strong> observations are taken each hour during a 20-minute averaging period, with a sample taken<br />
every 0.67 seconds. The significant wave height is defined as the average height of the highest onethird<br />
of the waves during the average period each hour. The maximum significant wave height is the<br />
highest of those values for that month. At most stations, air temperature, water temperature, wind<br />
speed and direction are sampled once per second during an 8.0-minute averaging period each hour<br />
(moored buoys) and a 2.0-minute averaging period for fixed stations (C-MAN). Contact NDBC Data<br />
Systems Division, Bldg. 1100, SSC, Mississippi 39529 or phone (601) 688-1720 for more details.<br />
MEAN MEAN MEAN SIG MAX SIG MAX SIG SCALAR MEAN PREV MAX MAX MEAN<br />
BUOY LAT LONG OBS AIR TP SEA TP WAVE HT WAVE HT WAVE HT WIND SPEED WIND WIND WIND PRESS<br />
(C) (C) (M) (M) (DA/HR) (KNOTS) (DIR) (KTS) (DA/HR) (MB)<br />
April 1998<br />
41001 34.7N 072.6W 0718 18.0 20.0 1014.4<br />
41004 32.5N 079.1W 0692 18.3 1.3 3.2 09/15 12.1 SW 30.7 30/21 1014.8<br />
41008 31.4N 080.9W 0708 18.9 19.0 1.0 2.3 28/20 11.7 S 25.3 10/08 1015.3<br />
41009 28.5N 080.2W 1426 21.9 22.1 1.3 3.2 11/19 12.5 S 29.3 11/19 1016.0<br />
41010 28.9N 078.6W 1373 22.5 24.8 1.8 4.0 12/06 14.4 SE 26.8 09/12 1016.0<br />
42001 25.9N 089.7W 0719 23.1 24.1 1.5 3.5 14/12 16.0 SE 29.0 27/10 1014.7<br />
42002 25.9N 093.6W 0716 22.3 23.1 1.4 3.5 13/19 12.6 SE 27.4 13/04 1013.4<br />
42003 25.9N 085.9W 0715 25.5 1.3 2.9 11/15 15.6 SE 33.8 30/10 1014.8<br />
42007 30.1N 088.8W 0714 20.0 20.7 0.8 2.9 29/22 12.5 SE 34.4 29/22 1014.5<br />
42019 27.9N 095.4W 0718 20.4 20.7 1.3 3.0 17/15 11.2 SE 26.8 17/13 1013.2<br />
42020 26.9N 096.7W 0714 21.3 21.3 1.4 2.9 18/18 11.8 SE 24.9 17/13 1012.7<br />
42035 29.3N 094.4W 0714 19.8 20.3 0.9 2.3 25/15 11.7 SE 26.4 29/11 1013.5<br />
42036 28.5N 084.5W 0713 20.2 20.3 1.0 3.3 11/08 11.2 SE 27.8 30/08 1016.3<br />
42039 28.8N 086.0W 0573 20.9 21.7 1.2 2.8 11/07 12.6 SE 35.9 30/03 1017.0<br />
42040 29.2N 088.3W 0711 20.2 21.0 1.2 3.0 30/03 12.2 SE 28.0 29/23 1015.7<br />
44004 38.5N 070.7W 0690 9.6 9.5 2.0 5.8 23/13 13.4 W 36.5 23/11 1013.1<br />
44005 42.9N 068.9W 0713 5.5 4.6 1.4 4.7 24/03 10.7 SW 32.4 10/10 1011.7<br />
44007 43.5N 070.2W 0718 6.5 5.6 0.9 4.1 24/04 9.9 N 31.7 24/02 1012.2<br />
44008 40.5N 069.4W 0718 6.7 5.7 1.7 5.9 10/11 12.6 SW 35.4 10/11 1012.2<br />
44009 38.5N 074.7W 0712 10.4 9.9 1.2 3.5 04/22 12.3 S 29.1 04/16 1013.1<br />
44011 41.1N 066.6W 0712 5.9 4.6 2.0 7.1 10/20 13.4 SW 35.9 10/18 1011.9<br />
44013 42.4N 070.7W 0717 7.2 5.9 0.9 4.1 24/00 9.2 SE 32.3 10/09 1011.5<br />
44014 36.6N 074.8W 0531 10.9 9.4 1.5 3.3 23/07 10.9 S 27.0 09/21 1015.0<br />
44025 40.3N 073.2W 0683 8.3 7.4 1.2 3.9 10/02 11.3 SW 34.6 10/00 1013.2<br />
45001 48.1N 087.8W 0655 3.3 2.5 0.7 2.8 13/00 10.0 SW 26.0 13/00 1016.4<br />
45002 45.3N 086.4W 0710 4.8 3.5 0.7 2.4 01/04 9.9 NE 28.0 01/02 1014.5<br />
45003 45.3N 082.8W 0296 4.5 3.3 0.4 1.4 26/12 7.0 W 17.9 26/11 1019.1<br />
45004 47.6N 086.6W 0647 3.4 2.9 0.7 3.4 17/18 10.0 SE 29.9 17/15 1016.9<br />
45005 41.7N 082.4W 0717 7.5 6.8 0.7 3.9 10/00 9.9 NE 33.0 10/00 1013.9<br />
45006 47.3N 089.9W 0676 3.8 2.2 0.8 2.7 07/21 9.0 NE 27.4 07/21 1016.4<br />
45007 42.7N 087.0W 0713 5.5 4.1 0.7 2.7 09/21 9.6 N 27.6 26/14 1014.1<br />
45008 44.3N 082.4W 0378 4.8 3.3 0.6 1.7 17/11 8.0 NE 23.5 17/11 1016.9<br />
Continued on Page 86<br />
December 1998 85
Continued from Page 85<br />
86 <strong>Mariners</strong> <strong>Weather</strong> <strong>Log</strong><br />
Buoy Climatological Data Summary<br />
MEAN MEAN MEAN SIG MAX SIG MAX SIG SCALAR MEAN PREV MAX MAX MEAN<br />
BUOY LAT LONG OBS AIR TP SEA TP WAVE HT WAVE HT WAVE HT WIND SPEED WIND WIND WIND PRESS<br />
(C) (C) (M) (M) (DA/HR) (KNOTS) (DIR) (KTS) (DA/HR) (MB)<br />
46001 56.3N 148.2W 0712 4.4 5.4 3.1 7.0 01/10 15.8 S 33.6 01/10 1004.5<br />
46002 42.5N 130.3W 0709 9.5 10.7 2.9 6.0 10/19 13.0 NW 31.9 10/10 1018.6<br />
46003 51.9N 155.9W 0164 4.2 4.6 2.3 3.5 29/09 13.8 NW 25.1 28/17 1007.7<br />
46005 46.1N 131.0W 0714 8.4 9.6 2.9 6.9 07/06 13.2 S 26.8 20/14 1018.7<br />
46011 34.9N 120.9W 0718 12.0 13.0 2.3 5.0 08/02 11.8 NW 27.8 25/04 1016.4<br />
46013 38.2N 123.3W 0683 11.0 11.9 2.6 5.2 02/00 13.7 NW 30.1 11/21 1017.3<br />
46014 39.2N 124.0W 0718 10.7 11.5 2.6 5.2 01/11 12.8 NW 28.6 30/23 1016.7<br />
46023 34.7N 121.0W 0710 12.2 13.3 2.4 4.7 01/20 14.4 NW 32.3 25/04 1017.4<br />
46045 33.8N 118.5W 0710 13.7 15.3 1.0 2.8 12/12 7.6 W 22.3 13/00 1015.7<br />
46050 44.6N 124.5W 0055 12.2 12.3 1.7 2.5 28/21 9.9 N 19.6 29/03 1012.5<br />
46054 34.3N 120.5W 0700 12.1 12.7 2.1 4.5 01/21 14.8 NW 31.9 25/06 1016.2<br />
46063 34.3N 120.7W 0056 11.7 12.3 1.7 2.2 29/08 10.1 NW 18.3 29/06 1014.1<br />
51001 23.4N 162.3W 0708 22.1 23.2 2.6 4.7 11/03 14.9 NE 24.1 12/14 1023.2<br />
51002 17.2N 157.8W 0715 23.7 24.7 2.8 4.7 11/16 17.7 NE 26.7 10/19 1019.0<br />
91328 8.6N 149.7E 0463 28.0 8.7 NE 15.5 02/05 1011.5<br />
91343 7.6N 155.2E 0714 28.2 1011.0<br />
91352 6.2N 160.7E 0434 28.1 1013.3<br />
91377 6.1N 172.1E 0468 27.9 1014.6<br />
91411 8.3N 137.5E 0173 28.9 1011.6<br />
91442 4.6N 168.7E 0713 27.9 13.6 NE 26.2 15/02 1012.1<br />
ABAN6 44.3N 075.9W 0716 7.6 5.1 4.6 N 19.3 09/20 1014.3<br />
ALSN6 40.5N 073.8W 0713 9.9 0.9 2.9 10/03 15.5 S 41.7 10/00 1013.2<br />
BLIA2 60.8N 146.9W 1422 4.1 9.5 NE 30.3 28/07 1009.0<br />
BURL1 28.9N 089.4W 0716 19.7 13.7 SE 47.2 29/01 1014.5<br />
CARO3 43.3N 124.4W 0712 9.4 8.5 N 26.7 01/02 1018.0<br />
CDRF1 29.1N 083.0W 0713 20.6 9.7 S 22.9 09/11 1016.1<br />
CHLV2 36.9N 075.7W 0714 13.1 12.1 1.0 3.9 04/21 15.6 S 44.5 04/16 1014.3<br />
CLKN7 34.6N 076.5W 0713 16.3 13.4 SW 29.8 04/21 1016.4<br />
CSBF1 29.7N 085.4W 0713 19.7 9.7 SE 29.2 22/23 1016.3<br />
DBLN6 42.5N 079.4W 0714 7.9 10.2 SW 33.1 09/22 1014.7<br />
DESW1 47.7N 124.5W 0710 8.9 8.6 NW 31.1 10/23 1017.2<br />
DPIA1 30.3N 088.1W 0711 19.5 20.8 13.2 SE 38.9 29/23 1015.4<br />
DRYF1 24.6N 082.9W 0712 23.3 23.0 11.0 SE 24.5 11/14 1014.9<br />
DSLN7 35.2N 075.3W 0714 14.8 1.8 4.4 05/05 18.3 SW 43.5 04/22 1014.1<br />
DUCN7 36.2N 075.8W 0705 14.8 0.9 2.9 05/00 13.3 S 41.1 04/20 1015.9<br />
FFIA2 57.3N 133.6W 0716 6.3 8.5 SE 24.9 05/17<br />
FPSN7 33.5N 077.6W 0710 17.7 1.4 4.1 09/19 15.9 SW 41.4 09/03 1014.2<br />
FWYF1 25.6N 080.1W 0713 23.7 24.6 16.0 SE 30.3 11/06 1017.2<br />
GDIL1 29.3N 090.0W 0713 20.5 22.8 11.5 SE 32.4 29/04 1015.0<br />
GLLN6 43.9N 076.5W 0707 6.2 10.6 SW 31.7 17/23 1014.3<br />
IOSN3 43.0N 070.6W 0712 7.3 12.5 NW 36.1 24/00 1011.9<br />
KTNF1 29.8N 083.6W 0714 19.5 10.7 S 27.6 10/00 1015.6<br />
LKWF1 26.6N 080.0W 0709 23.0 24.1 12.6 SE 25.7 11/22 1016.5<br />
LONF1 24.9N 080.9W 0718 24.1 25.0 13.7 SE 24.6 12/04 1015.9<br />
LPOI1 48.1N 116.5W 0713 7.8 6.1 4.5 S 33.6 24/01<br />
MDRM1 44.0N 068.1W 0712 5.3 1011.5<br />
MISM1 43.8N 068.9W 0714 5.4 14.2 N 40.0 24/04 1011.4<br />
MLRF1 25.0N 080.4W 0714 23.9 24.7 14.2 SE 26.6 11/03 1016.3<br />
MRKA2 61.1N 146.7W 1428 3.6 6.1 NE 20.3 28/08 1010.3<br />
NWPO3 44.6N 124.1W 0714 8.9 8.2 E 28.5 11/06 1018.1<br />
PILM4 48.2N 088.4W 0711 3.8 11.7 NE 36.8 01/04 1017.0<br />
POTA2 61.1N 146.7W 1422 3.5 10.2 NE 22.4 17/14 1008.9<br />
PTAC1 39.0N 123.7W 0715 10.1 10.6 N 27.3 12/01 1016.7<br />
PTAT2 27.8N 097.1W 0710 20.8 21.7 12.9 SE 28.9 17/12 1013.4<br />
PTGC1 34.6N 120.7W 0710 11.7 14.8 N 39.2 12/05 1017.7<br />
ROAM4 47.9N 089.3W 0561 4.9 2.6 12.1 NE 33.8 01/04 1015.6<br />
SANF1 24.5N 081.9W 0715 23.9 24.3 13.6 SE 25.8 11/06 1015.9<br />
SAUF1 29.9N 081.3W 0717 20.3 19.2 10.0 S 23.0 28/23 1016.2<br />
SBIO1 41.6N 082.8W 0710 9.0 9.7 NE 25.4 17/08 1013.8<br />
SGNW3 43.8N 087.7W 0714 6.4 8.0 10.9 N 32.6 09/17<br />
SISW1 48.3N 122.9W 0719 9.3 8.5 W 30.6 24/11 1017.6<br />
SMKF1 24.6N 081.1W 0715 24.3 25.0 15.5 SE 28.1 11/09 1016.3<br />
SPGF1 26.7N 079.0W 0708 23.1 11.0 SE 27.6 12/00 1016.1<br />
SRST2 29.7N 094.1W 0716 19.1 11.0 S 26.4 27/04 1015.2<br />
STDM4 47.2N 087.2W 0713 4.6 13.2 NE 40.9 01/04 1015.6<br />
SUPN6 44.5N 075.8W 0709 7.7 5.8 9.0 N 27.5 17/18 1013.5<br />
THIN6 44.3N 076.0W 0544 8.2<br />
TPLM2 38.9N 076.4W 0698 13.3 12.8 10.7 S 35.9 27/00 1014.5<br />
TTIW1 48.4N 124.7W 0715 8.5 9.4 SW 28.5 29/18 1017.9<br />
Continued on Page 87
Continued from Page 86<br />
Buoy Climatological Data Summary<br />
MEAN MEAN MEAN SIG MAX SIG MAX SIG SCALAR MEAN PREV MAX MAX MEAN<br />
BUOY LAT LONG OBS AIR TP SEA TP WAVE HT WAVE HT WAVE HT WIND SPEED WIND WIND WIND PRESS<br />
(C) (C) (M) (M) (DA/HR) (KNOTS) (DIR) (KTS) (DA/HR) (MB)<br />
VENF1 27.1N 082.5W 0712 21.3 23.3 10.9 S 27.3 19/14 1017.3<br />
WPOW1 47.7N 122.4W 0318 8.3 8.4 S 22.8 11/21 1014.1<br />
May 1998<br />
41001 34.7N 072.6W 0745 21.5 22.4 1011.4<br />
41002 32.3N 075.2W 0576 23.4 24.2 1.7 4.9 13/23 12.5 SW 31.9 08/09 1012.7<br />
41004 32.5N 079.1W 0730 23.0 0.9 2.5 01/00 9.1 SW 21.8 03/22 1012.2<br />
41008 31.4N 080.9W 0736 23.8 23.6 0.7 1.6 01/00 9.4 S 22.3 11/02 1013.1<br />
41009 28.5N 080.2W 1472 24.7 24.6 0.8 2.5 14/19 8.9 S 26.6 04/20 1014.3<br />
41010 28.9N 078.6W 1451 25.1 25.8 1.2 4.0 14/16 10.9 S 31.3 04/23 1014.2<br />
42001 25.9N 089.7W 0731 25.5 0.8 3.1 09/16 10.1 SE 35.2 09/15 1014.1<br />
42002 25.9N 093.6W 0741 25.2 25.5 0.8 2.6 09/12 10.6 SE 27.6 09/07 1012.8<br />
42003 25.9N 085.9W 0737 26.1 26.4 0.7 1.7 08/15 9.0 SE 23.9 27/09 1014.2<br />
42007 30.1N 088.8W 0735 25.3 25.9 0.4 1.3 10/03 9.5 SW 20.4 10/03 1013.3<br />
42019 27.9N 095.4W 0739 24.3 24.3 0.9 1.9 10/01 9.4 SE 20.0 15/01 1011.8<br />
42020 26.9N 096.7W 0740 24.8 24.6 1.0 2.2 15/01 11.1 SE 22.9 15/08 1011.0<br />
42035 29.3N 094.4W 0741 24.6 24.8 0.8 1.6 22/10 10.7 SE 21.6 09/06 1012.1<br />
42036 28.5N 084.5W 0735 24.8 25.0 0.5 1.9 10/17 6.9 SW 17.5 01/14 1015.1<br />
42039 28.8N 086.0W 0742 24.9 25.3 0.6 2.2 10/09 7.7 SW 19.2 08/08 1015.6<br />
42040 29.2N 088.3W 0735 25.0 25.6 0.6 2.1 10/06 8.8 SW 19.2 11/02 1014.8<br />
44004 38.5N 070.7W 0571 16.6 16.6 1.4 5.9 13/07 10.4 SE 29.0 12/23 1011.1<br />
44005 42.9N 068.9W 0741 8.9 7.4 1.3 4.4 13/05 10.0 S 23.9 11/10 1012.2<br />
44007 43.5N 070.2W 0734 10.7 9.0 1.0 3.1 11/16 8.6 S 25.8 12/05 1012.6<br />
44008 40.5N 069.4W 0738 10.0 8.3 1.5 4.8 12/20 10.4 SW 27.8 12/00 1012.1<br />
44009 38.5N 074.7W 0729 14.1 13.5 1.2 4.2 12/19 10.5 S 29.3 09/20 1011.1<br />
44011 41.1N 066.6W 0738 8.8 7.0 1.6 4.8 13/06 1012.7<br />
44013 42.4N 070.7W 0732 11.9 10.2 0.9 4.0 11/21 9.7 NE 27.0 10/15 1011.4<br />
44014 36.6N 074.8W 0741 14.2 12.7 1.2 4.9 13/18 9.1 S 26.0 01/18 1010.9<br />
44025 40.3N 073.2W 0705 12.2 11.1 1.2 4.0 12/18 11.0 NE 31.3 09/16 1012.0<br />
45001 48.1N 087.8W 0731 5.7 3.4 0.6 2.6 17/00 9.5 NE 25.3 17/01 1012.1<br />
45002 45.3N 086.4W 0732 9.5 7.4 0.5 1.8 16/14 8.6 NE 22.3 16/14 1011.3<br />
45003 45.3N 082.8W 0723 7.5 4.6 0.4 2.1 31/18 8.1 SE 24.9 31/17 1012.2<br />
45004 47.6N 086.6W 0733 5.6 3.5 0.5 2.1 17/06 8.8 SE 25.5 31/19 1012.9<br />
45005 41.7N 082.4W 0736 15.7 14.8 0.4 1.4 08/19 7.8 NE 20.6 31/11 1011.5<br />
45006 47.3N 089.9W 0736 6.1 2.4 0.5 2.0 08/11 9.2 E 24.5 07/16 1006.7<br />
45007 42.7N 087.0W 0736 11.3 9.2 0.5 1.6 08/22 7.8 N 25.6 31/08 1012.2<br />
45008 44.3N 082.4W 0737 9.1 6.3 0.4 2.1 31/13 8.6 N 30.3 31/11 1012.3<br />
46001 56.3N 148.2W 0734 5.9 6.4 2.4 5.5 09/05 14.5 SW 29.1 08/23 1010.1<br />
46002 42.5N 130.3W 0736 10.9 12.0 2.3 5.8 02/06 13.4 NW 28.6 02/01 1017.2<br />
46003 51.9N 155.9W 0717 5.1 5.1 2.7 6.8 06/12 15.6 NE 29.5 08/13 1012.8<br />
46005 46.1N 131.0W 0730 9.7 10.7 2.3 6.0 14/22 11.4 NW 26.8 14/12 1017.8<br />
46006 40.9N 137.5W 0688 10.5 11.3 2.5 5.7 01/21 14.6 N 29.3 01/18 1021.5<br />
46011 34.9N 120.9W 0740 13.0 13.1 1.9 3.9 02/11 12.4 NW 24.3 22/04 1015.5<br />
46013 38.2N 123.3W 0724 12.3 12.4 2.1 5.3 02/03 13.2 NW 28.2 08/23 1016.2<br />
46014 39.2N 124.0W 0741 12.1 12.5 2.0 4.5 28/17 11.4 NW 29.7 01/13 1015.3<br />
46023 34.7N 121.0W 0734 13.2 13.6 2.1 4.4 02/11 15.3 NW 28.0 01/18 1016.6<br />
46025 33.8N 119.1W 0733 15.3 16.6 1.4 3.3 02/15 7.5 W 22.7 26/11 1015.9<br />
46029 46.1N 124.5W 0589 11.5 12.6 1.9 4.4 15/06 11.3 NW 24.3 14/12 1015.6<br />
46035 56.9N 177.8W 0722 0.9 2.8 2.2 6.7 18/07 17.6 N 36.7 17/21 1002.3<br />
46045 33.8N 118.5W 0741 15.5 16.8 1.1 2.4 02/16 6.7 W 18.1 12/22 1015.2<br />
46050 44.6N 124.5W 0741 12.1 12.6 2.0 4.6 15/08 9.9 N 25.3 14/14 1015.5<br />
46053 34.2N 119.9W 0739 13.9 13.9 1.2 2.8 02/13 10.7 W 23.9 26/22 1015.5<br />
46054 34.3N 120.5W 0733 13.0 12.8 1.8 4.2 02/13 15.5 NW 25.8 21/07 1015.4<br />
46059 38.0N 130.0W 0739 13.7 2.3 4.9 01/11 13.5 NW 29.1 12/15<br />
46060 60.6N 146.8W 1478 6.5 7.4 0.6 3.2 09/22 11.7 E 39.6 09/21 1011.3<br />
46061 60.2N 146.8W 1478 6.7 7.5 1.3 5.0 10/00 11.7 SE 37.9 09/21 1011.4<br />
46062 35.1N 121.0W 0718 13.1 13.1 1.9 5.0 02/11 13.0 NW 24.9 10/04 1015.7<br />
46063 34.3N 120.7W 0734 13.5 13.5 2.1 4.5 02/11 14.7 NW 25.3 20/12 1015.5<br />
51001 23.4N 162.3W 0741 22.4 23.2 2.4 4.3 02/13 15.6 E 22.0 02/02 1021.7<br />
51002 17.2N 157.8W 0738 24.0 24.8 2.4 3.6 22/14 17.1 NE 24.6 21/09 1018.0<br />
51003 19.1N 160.8W 0741 23.8 24.7 2.3 3.4 23/20 13.5 NE 20.8 02/09 1017.8<br />
51004 17.4N 152.5W 0049 24.0 24.6 2.3 2.7 30/08 15.8 E 19.8 30/07 1018.7<br />
51028 0.0N 153.9W 0715 27.4 27.9 2.0 3.3 24/13 8.4 NE 20.8 11/10 1010.5<br />
91328 8.6N 149.7E 0474 28.3 7.9 NE 15.5 17/05 1010.1<br />
91343 7.6N 155.2E 0731 28.4 1009.9<br />
91352 6.2N 160.7E 0426 28.1 1012.0<br />
Continued on Page 88<br />
December 1998 87
Continued from Page 87<br />
88 <strong>Mariners</strong> <strong>Weather</strong> <strong>Log</strong><br />
Buoy Climatological Data Summary<br />
MEAN MEAN MEAN SIG MAX SIG MAX SIG SCALAR MEAN PREV MAX MAX MEAN<br />
BUOY LAT LONG OBS AIR TP SEA TP WAVE HT WAVE HT WAVE HT WIND SPEED WIND WIND WIND PRESS<br />
(C) (C) (M) (M) (DA/HR) (KNOTS) (DIR) (KTS) (DA/HR) (MB)<br />
91374 8.7N 171.2E 0738 27.5 6.5 NE 12.9 30/17 1011.6<br />
91377 6.1N 172.1E 0429 28.1 1013.2<br />
91411 8.3N 137.5E 0243 29.2 1009.9<br />
ABAN6 44.3N 075.9W 0743 15.1 10.1 3.8 N 19.8 31/15 1012.3<br />
ALSN6 40.5N 073.8W 0738 14.6 1.0 2.9 09/19 14.7 S 42.2 31/22 1011.9<br />
BLIA2 60.8N 146.9W 1464 6.1 7.1 NE 27.8 04/03 1012.1<br />
BURL1 28.9N 089.4W 0730 24.7 9.3 SW 22.3 09/21 1013.6<br />
BUZM3 41.4N 071.0W 0733 12.2 0.9 3.3 02/14 14.9 SW 35.1 10/23 1013.0<br />
CARO3 43.3N 124.4W 0734 11.3 8.1 N 25.6 14/17 1016.3<br />
CDRF1 29.1N 083.0W 0739 25.1 7.8 W 20.8 27/14 1014.6<br />
CHLV2 36.9N 075.7W 0740 17.6 16.4 0.8 2.8 14/01 13.3 S 37.7 05/09 1012.0<br />
CLKN7 34.6N 076.5W 0739 20.1 10.4 SW 35.8 05/04 1013.6<br />
CSBF1 29.7N 085.4W 0730 24.4 7.8 SW 22.2 11/02 1014.8<br />
DBLN6 42.5N 079.4W 0734 15.5 8.3 SW 25.6 31/21 1012.3<br />
DESW1 47.7N 124.5W 0725 11.0 6.6 NW 23.6 14/12 1014.6<br />
DISW3 47.1N 090.7W 0734 10.0 10.4 NE 33.2 05/01 1011.5<br />
DPIA1 30.3N 088.1W 0738 25.1 26.3 8.8 SW 23.9 09/22 1014.1<br />
DRYF1 24.6N 082.9W 0737 25.4 24.1 6.1 NE 24.6 05/01 1014.1<br />
DSLN7 35.2N 075.3W 0732 18.9 1.0 1.7 16/02 14.6 SW 42.2 01/13 1011.3<br />
DUCN7 36.2N 075.8W 0735 19.0 0.8 3.1 13/14 11.5 SW 31.2 12/23 1013.4<br />
FBIS1 32.7N 079.9W 0739 23.3 7.6 SW 18.0 18/04 1013.2<br />
FFIA2 57.3N 133.6W 0732 9.1 6.9 S 22.8 06/17 1013.3<br />
FPSN7 33.5N 077.6W 0724 22.0 1.1 3.6 01/06 12.5 SW 47.6 01/05 1011.4<br />
FWYF1 25.6N 080.1W 0726 26.2 26.4 11.0 S 43.9 02/00 1016.0<br />
GDIL1 29.3N 090.0W 0735 25.8 28.6 8.5 SE 20.0 10/06 1014.0<br />
GLLN6 43.9N 076.5W 0739 13.9 9.7 SE 38.8 31/16 1012.1<br />
IOSN3 43.0N 070.6W 0737 12.1 12.7 NE 30.2 11/16 1011.9<br />
KTNF1 29.8N 083.6W 0739 24.4 10.2 SW 27.8 04/15 1013.9<br />
LKWF1 26.6N 080.0W 0734 25.5 25.6 8.0 SE 24.4 05/22 1015.0<br />
LONF1 24.9N 080.9W 0737 26.8 28.6 8.3 SE 31.2 01/23 1014.8<br />
LPOI1 48.1N 116.5W 0735 12.3 10.7 6.0 S 24.7 14/00<br />
MDRM1 44.0N 068.1W 0732 8.6 1012.5<br />
MISM1 43.8N 068.9W 0736 9.1 13.7 SW 36.0 02/16 1012.1<br />
MLRF1 25.0N 080.4W 0731 26.1 26.3 8.6 SE 26.2 05/02 1015.2<br />
MRKA2 61.1N 146.7W 1449 6.1 6.0 NE 23.9 22/21 1013.1<br />
NWPO3 44.6N 124.1W 0733 11.2 8.0 N 28.8 14/17 1016.1<br />
PILM4 48.2N 088.4W 0735 7.4 11.1 NE 37.5 16/22 1013.4<br />
POTA2 61.1N 146.7W 1470 5.9 7.3 NE 23.7 24/13 1011.8<br />
PTAC1 39.0N 123.7W 0731 11.9 9.7 N 32.6 01/11 1015.4<br />
PTAT2 27.8N 097.1W 0724 24.7 26.2 13.0 SE 24.1 09/09 1011.5<br />
PTGC1 34.6N 120.7W 0734 13.0 15.5 N 29.3 17/13 1016.9<br />
ROAM4 47.9N 089.3W 0615 9.2 4.3 11.9 NE 36.1 16/18 1011.7<br />
SANF1 24.5N 081.9W 0739 26.0 25.9 7.7 E 32.5 05/01 1015.1<br />
SAUF1 29.9N 081.3W 0737 24.6 23.4 7.9 W 22.8 04/18 1014.4<br />
SBIO1 41.6N 082.8W 0733 17.3 8.1 NE 29.0 31/12 1011.2<br />
SGNW3 43.8N 087.7W 0738 13.3 11.0 N 28.1 08/18<br />
SISW1 48.3N 122.9W 0730 10.9 9.5 SW 32.1 14/17 1014.6<br />
SMKF1 24.6N 081.1W 0737 26.5 27.1 8.4 E 34.3 01/23 1015.3<br />
SPGF1 26.7N 079.0W 0734 25.8 8.4 S 24.7 05/00 1014.6<br />
SRST2 29.7N 094.1W 0730 24.7 11.7 S 21.9 03/13 1013.6<br />
STDM4 47.2N 087.2W 0738 9.4 14.2 SE 33.2 15/03 1012.1<br />
SUPN6 44.5N 075.8W 0734 15.3 11.0 6.9 N 31.9 31/18 1011.5<br />
THIN6 44.3N 076.0W 0735 15.1<br />
TPLM2 38.9N 076.4W 0730 18.6 17.7 9.4 S 25.5 10/02 1012.5<br />
TTIW1 48.4N 124.7W 0739 10.3 9.0 SW 38.9 02/07 1015.2<br />
VENF1 27.1N 082.5W 0501 23.6 23.9 8.2 NW 23.7 04/20 1015.5<br />
WPOW1 47.7N 122.4W 0711 11.8 9.5 S 26.3 15/12 1014.9<br />
June 1998<br />
41001 34.7N 072.6W 0709 24.3 24.9 1013.0<br />
41002 32.3N 075.2W 0711 26.6 26.8 1.1 2.6 16/04 11.0 SW 23.5 30/23 1013.9<br />
41004 32.5N 079.1W 0711 26.7 0.8 2.0 15/18 10.6 SW 28.8 11/00 1013.4<br />
41008 31.4N 080.9W 0709 27.2 27.0 0.6 1.5 10/06 10.4 SW 25.1 19/22 1014.5<br />
41009 28.5N 080.2W 1389 27.7 27.7 0.5 1.3 08/06 9.0 S 18.5 17/04 1016.1<br />
41010 28.9N 078.6W 0683 27.0 27.5 1.0 1.9 06/18 10.6 SW 17.9 14/04 1015.1<br />
42001 25.9N 089.7W 0713 28.0 1.0 3.4 25/14 11.7 SE 32.3 25/10 1015.0<br />
42002 25.9N 093.6W 0715 28.3 28.7 1.2 2.2 27/18 14.6 SE 25.1 27/16 1013.8<br />
Continued on Page 89
Continued from Page 88<br />
Buoy Climatological Data Summary<br />
MEAN MEAN MEAN SIG MAX SIG MAX SIG SCALAR MEAN PREV MAX MAX MEAN<br />
BUOY LAT LONG OBS AIR TP SEA TP WAVE HT WAVE HT WAVE HT WIND SPEED WIND WIND WIND PRESS<br />
(C) (C) (M) (M) (DA/HR) (KNOTS) (DIR) (KTS) (DA/HR) (MB)<br />
42003 25.9N 085.9W 0716 28.5 29.4 8.2 E 22.0 25/02 1016.0<br />
42007 30.1N 088.8W 0710 27.5 28.2 0.4 1.4 25/17 10.1 S 28.2 06/05 1015.3<br />
42019 27.9N 095.4W 0714 27.8 28.0 1.3 2.4 09/09 13.5 SE 24.5 11/07 1012.3<br />
42020 26.9N 096.7W 0713 27.9 27.6 1.3 2.3 11/08 13.5 SE 23.3 11/08 1011.5<br />
42035 29.3N 094.4W 0714 28.0 28.4 1.2 2.1 09/09 14.1 S 26.2 28/23 1013.0<br />
42036 28.5N 084.5W 0711 28.5 29.0 0.6 2.0 09/10 8.1 SW 20.0 06/11 1016.9<br />
42039 28.8N 086.0W 0716 28.5 29.2 0.6 1.6 06/12 8.3 SW 25.6 06/09 1017.6<br />
42040 29.2N 088.3W 0710 28.2 29.2 0.8 2.2 25/13 9.7 SW 30.7 25/11 1016.7<br />
44004 38.5N 070.7W 0718 19.9 20.7 1.3 3.1 14/00 11.1 W 23.3 28/06 1011.5<br />
44005 42.9N 068.9W 0716 12.1 10.4 1.1 4.1 14/22 9.4 S 31.3 27/20 1010.1<br />
44007 43.5N 070.2W 0713 13.2 12.0 0.8 4.3 14/16 8.9 S 32.8 14/16 1010.2<br />
44008 40.5N 069.4W 0719 13.5 11.8 1.2 4.5 14/12 9.4 S 28.4 14/11 1011.3<br />
44009 38.5N 074.7W 0708 19.4 18.7 0.8 2.1 28/13 9.0 S 32.1 16/03 1011.2<br />
44011 41.1N 066.6W 0717 12.8 11.1 1.3 3.9 14/22 1011.8<br />
44013 42.4N 070.7W 0714 14.2 12.4 0.6 2.7 14/14 8.0 SE 25.1 14/12 1009.4<br />
44014 36.6N 074.8W 0715 21.4 20.4 0.8 2.2 16/10 7.9 S 18.8 04/02 1011.5<br />
44025 40.3N 073.2W 0685 17.9 17.3 0.9 2.1 14/10 10.8 S 24.3 03/05 1011.2<br />
45001 48.1N 087.8W 0709 8.3 5.9 0.5 1.5 03/20 8.6 SW 19.2 02/22 1009.9<br />
45002 45.3N 086.4W 0714 14.2 13.1 0.5 3.0 01/23 8.5 S 29.0 01/20 1008.9<br />
45003 45.3N 082.8W 0706 11.9 10.3 0.5 2.1 01/01 8.4 W 24.9 01/01 1009.7<br />
45004 47.6N 086.6W 0714 8.7 6.6 0.4 1.7 12/14 8.4 W 23.7 12/14 1010.6<br />
45005 41.7N 082.4W 0714 19.5 19.7 0.4 1.4 05/08 9.0 S 25.6 26/09 1010.4<br />
45007 42.7N 087.0W 0713 15.4 14.2 0.4 2.1 02/21 7.7 S 27.6 02/17 1011.2<br />
45008 44.3N 082.4W 0563 12.1 10.7 0.5 2.2 02/22 7.6 NW 29.5 02/20 1010.7<br />
46001 56.3N 148.2W 0708 8.3 8.7 2.1 5.2 08/16 13.6 W 27.0 20/21 1017.2<br />
46002 42.5N 130.3W 0711 12.4 13.5 2.1 3.8 12/05 14.6 NW 24.5 11/15 1022.5<br />
46003 51.9N 155.9W 0646 7.1 6.8 2.1 7.9 07/19 14.2 SW 54.6 07/16 1017.5<br />
46005 46.1N 131.0W 0710 11.3 12.2 2.0 3.9 25/10 14.0 NW 23.3 24/14 1023.1<br />
46006 40.9N 137.5W 0524 12.9 13.9 1.6 2.8 25/02 11.4 N 19.2 24/16 1028.5<br />
46011 34.9N 120.9W 0719 14.3 14.3 1.7 3.7 16/23 9.2 NW 24.9 30/21 1015.5<br />
46012 37.4N 122.7W 0310 13.3 14.5 1.7 2.6 26/20 9.7 NW 19.4 30/07 1015.4<br />
46013 38.2N 123.3W 0704 12.7 12.3 1.9 4.4 16/17 11.7 NW 31.1 16/15 1015.4<br />
46014 39.2N 124.0W 0719 12.6 12.4 2.1 4.3 16/22 11.8 NW 30.9 16/17 1015.0<br />
46023 34.7N 121.0W 0701 14.3 14.4 1.7 3.6 17/06 10.9 NW 29.1 30/22 1015.9<br />
46025 33.8N 119.1W 0703 16.5 18.1 1.0 2.0 03/09 7.0 W 22.0 03/05 1015.0<br />
46027 41.9N 124.4W 0019 11.1 10.5 1.0 1.1 30/21 6.1 NW 8.0 30/09 1020.3<br />
46029 46.1N 124.5W 0716 12.9 14.1 1.8 3.7 12/18 9.7 NW 21.2 16/05 1017.6<br />
46035 56.9N 177.8W 0699 4.1 4.5 1.4 4.5 06/01 12.2 N 31.9 05/19 1009.0<br />
46041 47.4N 124.5W 0484 12.5 12.9 1.7 3.4 12/13 8.1 NW 21.0 15/12 1018.1<br />
46042 36.8N 122.4W 0310 13.6 14.4 2.1 3.4 17/23 11.5 NW 22.0 27/02 1015.8<br />
46045 33.8N 118.5W 0719 16.6 17.6 0.8 1.5 03/04 5.8 SW 12.8 03/01 1014.2<br />
46050 44.6N 124.5W 0716 13.6 13.4 1.9 4.2 12/21 10.7 N 22.2 28/06 1018.1<br />
46053 34.2N 119.9W 0716 15.0 15.5 0.9 1.9 29/01 9.9 W 24.3 02/22 1014.6<br />
46054 34.3N 120.5W 0719 14.5 13.9 1.5 3.3 30/23 13.7 NW 30.7 30/09 1014.7<br />
46059 38.0N 130.0W 0717 14.5 2.1 4.1 12/23 15.2 N 25.1 11/14<br />
46060 60.6N 146.8W 1366 10.5 10.8 0.5 1.3 08/21 7.4 E 22.9 08/03 1017.8<br />
46061 60.2N 146.8W 1429 10.4 10.5 1.0 3.4 21/11 7.6 E 27.2 21/10 1017.7<br />
46062 35.1N 121.0W 0705 14.4 14.7 1.7 4.3 17/00 10.6 NW 27.2 30/20 1015.0<br />
46063 34.3N 120.7W 0709 14.2 14.0 1.8 3.4 17/07 12.4 NW 27.2 30/07 1014.8<br />
51001 23.4N 162.3W 0717 23.8 24.7 1.9 3.5 23/02 14.6 E 22.0 22/19 1019.6<br />
51002 17.2N 157.8W 0717 24.6 25.4 2.1 3.1 25/10 15.5 NE 23.3 24/10 1016.7<br />
51003 19.1N 160.8W 0718 24.9 25.7 2.0 3.0 24/11 11.7 NE 19.2 22/20 1016.3<br />
51004 17.4N 152.5W 0715 24.4 25.0 2.1 3.2 24/15 14.8 E 23.0 22/21 1017.4<br />
51028 0.0N 153.9W 0705 25.0 25.2 1.8 3.5 11/00 10.2 E 16.7 09/09 1011.3<br />
91328 8.6N 149.7E 0452 28.3 7.2 NE 13.6 03/19 1009.6<br />
91343 7.6N 155.2E 0714 28.3 1009.4<br />
91352 6.2N 160.7E 0403 27.8 1011.7<br />
91374 8.7N 171.2E 0714 28.0 6.5 NE 16.4 25/09 1010.7<br />
91377 6.1N 172.1E 0437 28.0 1012.9<br />
91411 8.3N 137.5E 0239 28.2 1009.6<br />
ABAN6 44.3N 075.9W 0710 18.1 16.2 3.6 S 15.9 02/15 1009.7<br />
ALSN6 40.5N 073.8W 0713 18.7 0.7 2.0 15/01 14.3 W 35.2 01/00 1010.9<br />
BLIA2 60.8N 146.9W 1427 10.2 5.9 NW 19.9 21/15 1018.3<br />
BURL1 28.9N 089.4W 0708 28.1 11.8 S 30.7 27/12 1015.6<br />
BUZM3 41.4N 071.0W 0709 15.8 0.4 1.9 01/01 13.6 S 33.7 27/21 1011.5<br />
CARO3 43.3N 124.4W 0711 12.3 8.0 N 21.8 24/20 1018.6<br />
CDRF1 29.1N 083.0W 0711 28.3 8.2 W 22.0 24/01 1016.4<br />
CHLV2 36.9N 075.7W 0712 22.9 21.2 0.6 1.7 28/18 11.4 S 30.2 17/00 1012.3<br />
CLKN7 34.6N 076.5W 0712 25.5 9.7 SW 33.5 14/01 1014.1<br />
Continued on Page 90<br />
December 1998 89
Continued from Page 89<br />
90 <strong>Mariners</strong> <strong>Weather</strong> <strong>Log</strong><br />
Buoy Climatological Data Summary<br />
MEAN MEAN MEAN SIG MAX SIG MAX SIG SCALAR MEAN PREV MAX MAX MEAN<br />
BUOY LAT LONG OBS AIR TP SEA TP WAVE HT WAVE HT WAVE HT WIND SPEED WIND WIND WIND PRESS<br />
(C) (C) (M) (M) (DA/HR) (KNOTS) (DIR) (KTS) (DA/HR) (MB)<br />
CSBF1 29.7N 085.4W 0713 27.3 7.4 W 25.0 06/10 1016.8<br />
DBLN6 42.5N 079.4W 0707 18.4 9.2 SW 29.6 26/20 1010.9<br />
DESW1 47.7N 124.5W 0704 12.5 7.6 NW 25.1 15/14 1017.1<br />
DISW3 47.1N 090.7W 0708 12.9 9.2 SW 42.8 25/11 1009.8<br />
DPIA1 30.3N 088.1W 0712 27.7 29.3 8.7 SW 29.6 06/06 1016.2<br />
DRYF1 24.6N 082.9W 0697 29.1 28.9 5.9 E 16.1 23/03 1015.8<br />
DSLN7 35.2N 075.3W 0715 25.0 0.7 1.3 14/14 12.2 SW 37.4 19/20 1011.9<br />
DUCN7 36.2N 075.8W 0709 24.2 0.4 1.3 28/22 10.0 SW 30.5 16/03 1013.8<br />
FBIS1 32.7N 079.9W 0714 26.9 7.9 SW 25.2 10/18 1014.5<br />
FFIA2 57.3N 133.6W 0717 12.3 6.3 SW 20.8 14/22 1017.3<br />
FPSN7 33.5N 077.6W 0705 26.2 0.9 2.4 15/23 13.1 SW 38.7 20/00 1012.4<br />
FWYF1 25.6N 080.1W 0700 28.9 29.2 9.6 E 27.3 23/09 1017.9<br />
GDIL1 29.3N 090.0W 0712 28.4 30.9 9.7 S 24.7 25/17 1016.0<br />
GLLN6 43.9N 076.5W 0713 17.0 12.4 W 34.0 03/19 1009.7<br />
IOSN3 43.0N 070.6W 0711 14.3 12.0 SE 34.7 05/00 1009.6<br />
KTNF1 29.8N 083.6W 0704 27.4 10.7 SW 28.6 06/11 1015.9<br />
LKWF1 26.6N 080.0W 0709 28.0 28.3 7.7 SE 20.8 30/21 1016.8<br />
LONF1 24.9N 080.9W 0175 29.1 31.6 6.5 NW 13.3 02/01 1015.3<br />
LPOI1 48.1N 116.5W 0410 15.4 13.7 6.7 S 20.8 15/04 1013.3<br />
MDRM1 44.0N 068.1W 0709 11.1 1010.2<br />
MISM1 43.8N 068.9W 0714 11.3 13.7 S 38.9 14/18 1009.7<br />
MLRF1 25.0N 080.4W 0710 28.9 29.4 7.7 SE 21.2 09/05 1017.1<br />
MRKA2 61.1N 146.7W 1418 10.0 7.6 NE 20.9 25/00 1018.6<br />
NWPO3 44.6N 124.1W 0716 12.1 7.4 N 25.6 01/02 1018.7<br />
PILM4 48.2N 088.4W 0697 10.7 11.3 W 31.0 21/23 1011.2<br />
POTA2 61.1N 146.7W 1416 10.1 6.7 NE 20.5 21/16 1017.7<br />
PTAC1 39.0N 123.7W 0712 12.6 9.0 N 28.5 16/10 1015.1<br />
PTAT2 27.8N 097.1W 0702 29.4 16.3 SE 33.0 16/01 1012.0<br />
PTGC1 34.6N 120.7W 0711 13.7 14.3 N 31.7 30/09 1016.3<br />
ROAM4 47.9N 089.3W 0661 12.5 7.9 11.1 NE 32.2 19/06 1009.8<br />
SANF1 24.5N 081.9W 0715 28.9 29.3 7.1 E 21.5 10/05 1016.9<br />
SAUF1 29.9N 081.3W 0711 28.0 25.8 8.7 W 27.7 20/01 1016.0<br />
SBIO1 41.6N 082.8W 0700 20.5 9.6 NW 47.0 12/23 1010.5<br />
SGNW3 43.8N 087.7W 0714 16.6 9.1 S 31.1 02/16 1010.0<br />
SISW1 48.3N 122.9W 0713 12.0 9.4 W 38.0 16/01 1016.7<br />
SMKF1 24.6N 081.1W 0717 29.4 30.3 7.6 E 20.9 23/12 1017.1<br />
SPGF1 26.7N 079.0W 0712 28.4 7.9 SW 20.1 26/22 1016.4<br />
SRST2 29.7N 094.1W 0710 27.9 14.9 S 29.5 16/03 1014.6<br />
STDM4 47.2N 087.2W 0715 12.4 13.2 NW 30.7 12/11 1009.9<br />
SUPN6 44.5N 075.8W 0698 17.9 16.7 7.8 SW 27.3 03/18 1009.0<br />
THIN6 44.3N 076.0W 0706 17.9<br />
TPLM2 38.9N 076.4W 0711 21.8 21.7 9.5 S 26.3 02/19 1012.4<br />
TTIW1 48.4N 124.7W 0705 11.4 9.8 S 28.9 22/20 1017.6<br />
VENF1 27.1N 082.5W 0580 28.0 28.6 7.1 NW 18.6 25/00 1017.9<br />
WPOW1 47.7N 122.4W 0687 13.7 8.5 S 23.9 24/18 1016.7<br />
July 1998<br />
41001 34.7N 072.6W 0714 26.4 26.7 1.6 3.6 18/00 13.0 SW 23.9 17/23 1016.0<br />
41002 32.3N 075.2W 0734 27.7 28.1 1.5 2.9 01/06 12.6 SW 25.5 01/04 1016.3<br />
41004 32.5N 079.1W 0732 27.9 1.1 2.2 01/05 12.7 SW 24.5 01/04 1014.8<br />
41008 31.4N 080.9W 0733 28.0 28.5 0.8 1.8 13/02 12.2 SW 33.0 23/23 1015.4<br />
41009 28.5N 080.2W 1465 27.9 28.2 0.6 1.4 15/01 8.8 SW 21.6 07/22 1016.9<br />
41010 28.9N 078.6W 0778 29.1 29.7 1.0 1.6 15/17 9.0 S 20.0 22/14 1017.6<br />
42001 25.9N 089.7W 0740 29.2 0.6 3.3 02/08 8.1 E 30.1 02/07 1016.4<br />
42002 25.9N 093.6W 0740 29.2 30.0 0.8 3.0 03/09 10.3 SE 34.4 03/08 1016.3<br />
42003 25.9N 085.9W 0731 29.1 30.1 0.6 1.0 24/14 7.3 E 28.4 11/21 1016.8<br />
42007 30.1N 088.8W 0736 28.8 29.5 0.3 0.9 10/12 8.6 SW 25.5 10/21 1016.1<br />
42019 27.9N 095.4W 0735 28.8 29.3 0.8 2.8 03/17 1015.4<br />
42020 26.9N 096.7W 0740 28.8 29.0 1.0 2.3 03/20 12.1 SE 20.8 03/06 1014.7<br />
42035 29.3N 094.4W 0742 29.2 29.6 0.7 2.3 03/14 10.6 S 24.5 03/13 1015.5<br />
42036 28.5N 084.5W 0735 29.0 29.7 0.5 1.8 11/03 7.6 SW 24.5 10/12 1017.4<br />
42039 28.8N 086.0W 0735 29.3 30.4 0.5 1.9 10/22 7.8 W 23.5 12/21 1018.1<br />
42040 29.2N 088.3W 0738 29.0 30.2 0.4 1.7 03/01 7.9 W 27.4 14/18 1017.5<br />
44004 38.5N 070.7W 0740 22.7 22.7 1.1 3.0 01/06 8.8 SW 24.9 31/21 1015.1<br />
44005 42.9N 068.9W 0735 18.2 17.3 1.0 2.4 29/16 9.2 S 22.5 23/20 1012.1<br />
44007 43.5N 070.2W 0738 17.5 15.6 0.7 1.5 28/02 7.5 S 19.2 28/01 1012.2<br />
44008 40.5N 069.4W 0744 17.5 15.9 1.0 2.5 01/01 7.4 S 22.9 31/18 1014.2<br />
Continued on Page 91
Continued from Page 90<br />
Buoy Climatological Data Summary<br />
MEAN MEAN MEAN SIG MAX SIG MAX SIG SCALAR MEAN PREV MAX MAX MEAN<br />
BUOY LAT LONG OBS AIR TP SEA TP WAVE HT WAVE HT WAVE HT WIND SPEED WIND WIND WIND PRESS<br />
(C) (C) (M) (M) (DA/HR) (KNOTS) (DIR) (KTS) (DA/HR) (MB)<br />
44009 38.5N 074.7W 0732 23.2 22.7 0.8 2.4 31/16 7.6 S 24.3 31/15 1014.3<br />
44011 41.1N 066.6W 0731 16.2 14.8 1.1 3.6 01/04 6.7 S 22.0 31/21 1014.3<br />
44013 42.4N 070.7W 0735 19.1 17.2 0.4 0.9 05/21 7.2 S 19.6 01/22 1011.9<br />
44014 36.6N 074.8W 0737 25.1 25.0 0.9 2.1 31/22 9.6 SW 25.6 26/14 1014.2<br />
44025 40.3N 073.2W 0738 22.5 22.1 0.8 1.8 01/09 8.8 S 22.7 31/07 1014.5<br />
45001 48.1N 087.8W 0726 16.3 15.4 0.6 2.4 21/19 9.4 SW 26.4 21/18 1013.1<br />
45002 45.3N 086.4W 0727 19.6 19.4 0.6 2.1 27/06 9.5 S 25.6 27/06 1013.4<br />
45003 45.3N 082.8W 0729 18.6 18.3 0.5 2.0 23/21 9.4 W 25.1 23/20 1013.7<br />
45004 47.6N 086.6W 0742 16.5 15.6 0.6 2.7 21/21 8.9 W 25.8 21/20 1013.9<br />
45005 41.7N 082.4W 0740 22.9 23.7 0.4 1.6 22/13 9.1 SW 28.6 22/04 1014.4<br />
45006 47.3N 089.9W 0741 17.0 18.2 0.5 2.5 15/06 9.2 W 22.7 15/03 1018.5<br />
45007 42.7N 087.0W 0736 21.7 21.9 0.5 1.7 04/18 8.7 N 30.7 21/19 1015.7<br />
45008 44.3N 082.4W 0221 19.7 19.8 0.5 1.9 24/00 9.2 NW 22.5 27/10 1014.4<br />
46001 56.3N 148.2W 0728 11.4 12.1 1.3 2.6 20/09 9.3 SW 24.3 20/07 1013.3<br />
46002 42.5N 130.3W 0728 15.1 15.6 1.7 2.7 03/07 12.6 NE 22.3 14/11 1020.2<br />
46003 51.9N 155.9W 0712 9.4 9.4 1.6 4.0 17/07 12.1 W 28.2 16/06 1014.1<br />
46005 46.1N 131.0W 0727 14.1 14.3 1.7 3.7 16/19 11.9 NW 26.2 14/19 1020.1<br />
46006 40.9N 137.5W 0514 16.5 17.2 1.6 3.3 14/09 11.1 N 24.5 15/23 1021.7<br />
46011 34.9N 120.9W 0737 14.6 15.5 1.7 3.4 02/04 11.2 NW 25.8 01/18 1014.2<br />
46012 37.4N 122.7W 0727 13.4 13.5 1.5 3.1 03/13 8.9 NW 21.4 02/02 1015.0<br />
46013 38.2N 123.3W 0734 12.3 11.3 1.8 3.6 19/09 13.7 NW 30.7 04/01 1015.0<br />
46014 39.2N 124.0W 0741 12.7 12.5 1.7 3.3 03/09 11.4 NW 27.2 04/03 1015.1<br />
46022 40.7N 124.5W 0736 12.7 12.2 1.5 3.1 24/07 8.6 N 24.5 05/10 1017.0<br />
46023 34.7N 121.0W 0730 14.5 15.4 1.8 3.8 02/02 13.3 NW 29.1 27/20 1014.7<br />
46025 33.8N 119.1W 0728 17.8 19.4 1.1 2.0 02/05 5.9 W 15.7 26/02 1013.6<br />
46027 41.9N 124.4W 0735 12.1 11.5 1.5 3.3 03/02 6.6 NW 29.9 05/23 1016.6<br />
46029 46.1N 124.5W 0736 14.7 15.3 1.3 2.7 14/19 9.3 NW 24.3 14/18 1017.5<br />
46030 40.4N 124.5W 0721 11.6 10.3 1.6 3.2 24/10 12.3 N 22.7 02/14 1017.1<br />
46035 56.9N 177.8W 0708 7.1 7.6 1.2 3.9 31/04 11.5 SE 27.8 21/17 1012.5<br />
46041 47.4N 124.5W 0732 13.8 13.8 1.2 2.8 14/22 7.8 NW 24.1 14/18 1017.6<br />
46042 36.8N 122.4W 0736 13.6 13.7 1.7 3.3 03/12 11.9 NW 27.8 16/22 1015.2<br />
46045 33.8N 118.5W 0738 18.6 20.5 0.8 1.6 02/05 5.5 SW 12.8 05/00 1012.8<br />
46050 44.6N 124.5W 0740 15.1 15.1 1.5 3.1 21/02 9.9 N 22.3 20/18 1017.7<br />
46053 34.2N 119.9W 0735 16.9 18.0 1.0 2.2 02/03 8.9 W 22.7 29/05 1013.2<br />
46054 34.3N 120.5W 0736 15.8 16.2 1.8 3.5 02/03 15.7 NW 31.1 02/09 1013.1<br />
46059 38.0N 130.0W 0732 16.6 1.7 2.9 03/12 12.6 NW 22.0 02/16<br />
46060 60.6N 146.8W 1463 13.0 13.6 0.3 1.0 05/17 7.4 E 22.3 22/15 1015.8<br />
46061 60.2N 146.8W 1472 12.7 13.5 0.8 2.8 22/01 9.0 E 27.0 11/14 1015.2<br />
46062 35.1N 121.0W 0712 14.3 15.3 1.7 3.3 02/01 12.6 NW 29.0 02/02 1013.8<br />
46063 34.3N 120.7W 0730 14.9 15.6 1.9 3.7 02/02 15.1 NW 30.7 01/14 1013.3<br />
51001 23.4N 162.3W 0741 24.4 25.2 14.9 E 24.1 08/14 1020.1<br />
51002 17.2N 157.8W 0739 25.1 25.8 2.1 3.0 06/22 15.8 SE 21.6 14/21 1016.7<br />
51003 19.1N 160.8W 0740 25.4 26.1 1.9 3.1 07/16 13.1 NE 21.2 08/16 1017.3<br />
51004 17.4N 152.5W 0739 24.9 25.7 2.0 2.7 12/17 14.8 NE 21.3 13/04 1017.0<br />
51028 0.0N 153.9W 0719 23.9 23.7 1.7 2.8 10/04 10.2 NE 17.9 12/13 1012.0<br />
91328 8.6N 149.7E 0501 28.3 4.8 NE 11.6 05/18 1009.7<br />
91343 7.6N 155.2E 0622 28.2 1009.7<br />
91352 6.2N 160.7E 0470 27.8 1012.2<br />
91374 8.7N 171.2E 0734 27.4 5.5 NE 15.1 14/02 1010.9<br />
91377 6.1N 172.1E 0441 27.9 1013.4<br />
91411 8.3N 137.5E 0356 28.5 1009.3<br />
ABAN6 44.3N 075.9W 0741 20.8 20.9 3.5 S 13.1 21/19 1013.3<br />
ALSN6 40.5N 073.8W 0737 22.8 0.6 1.8 28/00 13.2 S 30.9 29/00 1014.1<br />
BLIA2 60.8N 146.9W 1463 12.3 6.0 NW 24.0 25/15 1016.4<br />
BURL1 28.9N 089.4W 0723 29.3 8.9 W 24.7 14/18 1016.6<br />
BUZM3 41.4N 071.0W 0727 20.3 0.4 1.2 01/11 11.3 SW 24.8 02/00 1014.4<br />
CARO3 43.3N 124.4W 0729 13.3 6.8 N 28.6 14/21 1018.2<br />
CDRF1 29.1N 083.0W 0740 28.8 7.2 W 16.9 22/00 1016.9<br />
CHLV2 36.9N 075.7W 0739 25.1 24.2 0.7 1.5 26/16 10.0 SW 27.7 31/18 1015.3<br />
CLKN7 34.6N 076.5W 0737 27.1 10.9 SW 24.9 18/02 1016.6<br />
CSBF1 29.7N 085.4W 0724 27.6 6.1 W 22.3 31/14 1017.3<br />
DBLN6 42.5N 079.4W 0730 21.8 8.4 SW 33.1 21/19 1014.8<br />
DESW1 47.7N 124.5W 0717 13.8 9.2 NW 36.4 14/22 1017.3<br />
DISW3 47.1N 090.7W 0736 18.7 9.4 SW 40.7 15/03 1014.3<br />
DPIA1 30.3N 088.1W 0733 28.6 30.3 7.7 SW 30.1 10/03 1016.8<br />
DRYF1 24.6N 082.9W 0618 29.5 30.4 8.0 E 18.7 23/07 1016.7<br />
DSLN7 35.2N 075.3W 0733 26.5 0.9 1.4 14/23 13.7 SW 29.6 09/08 1014.5<br />
DUCN7 36.2N 075.8W 0718 26.0 0.5 1.5 26/17 10.2 SW 25.7 26/15 1016.6<br />
FBIS1 32.7N 079.9W 0737 28.1 9.8 SW 19.9 14/23 1015.8<br />
Continued on Page 92<br />
December 1998 91
Continued from Page 91<br />
92 <strong>Mariners</strong> <strong>Weather</strong> <strong>Log</strong><br />
Buoy Climatological Data Summary<br />
MEAN MEAN MEAN SIG MAX SIG MAX SIG SCALAR MEAN PREV MAX MAX MEAN<br />
BUOY LAT LONG OBS AIR TP SEA TP WAVE HT WAVE HT WAVE HT WIND SPEED WIND WIND WIND PRESS<br />
(C) (C) (M) (M) (DA/HR) (KNOTS) (DIR) (KTS) (DA/HR) (MB)<br />
FFIA2 57.3N 133.6W 0551 13.1 6.5 S 30.2 16/05 1016.8<br />
FPSN7 33.5N 077.6W 0722 27.8 1.2 2.7 01/08 14.1 SW 34.0 01/07 1014.4<br />
FWYF1 25.6N 080.1W 0732 29.2 30.2 10.1 E 31.5 22/07 1018.4<br />
GDIL1 29.3N 090.0W 0733 29.5 32.0 7.7 SW 25.2 14/17 1017.0<br />
GLLN6 43.9N 076.5W 0734 21.0 11.2 SW 28.8 29/06 1013.3<br />
IOSN3 43.0N 070.6W 0736 19.8 11.5 S 24.9 29/11 1011.8<br />
KTNF1 29.8N 083.6W 0737 27.9 8.8 SW 27.9 04/02 1016.3<br />
LKWF1 26.6N 080.0W 0738 28.3 29.0 7.1 SE 19.7 07/20 1017.6<br />
LONF1 24.9N 080.9W 0627 29.5 31.1 8.1 E 24.7 04/21 1016.8<br />
MDRM1 44.0N 068.1W 0722 14.8 1012.1<br />
MISM1 43.8N 068.9W 0732 15.7 12.7 S 30.0 10/22 1011.5<br />
MLRF1 25.0N 080.4W 0727 29.2 30.4 9.1 SE 28.6 21/05 1017.6<br />
MRKA2 61.1N 146.7W 1460 11.6 7.7 NE 24.9 06/09 1016.0<br />
NWPO3 44.6N 124.1W 0726 13.5 7.5 N 23.1 21/03 1018.3<br />
PILM4 48.2N 088.4W 0729 16.7 11.7 W 32.4 21/19 1014.5<br />
POTA2 61.1N 146.7W 1459 11.8 6.5 NE 22.0 31/11 1015.6<br />
PTAC1 39.0N 123.7W 0725 12.3 10.5 N 21.3 19/06 1015.1<br />
PTAT2 27.8N 097.1W 0717 29.9 13.0 SE 22.8 03/23 1015.1<br />
PTGC1 34.6N 120.7W 0734 14.1 16.7 N 32.0 01/14 1015.0<br />
ROAM4 47.9N 089.3W 0664 17.0 14.0 7.4 SW 28.1 29/20 1013.9<br />
SANF1 24.5N 081.9W 0739 29.2 30.2 9.6 E 28.5 12/21 1017.3<br />
SAUF1 29.9N 081.3W 0731 27.9 27.8 7.4 SW 25.5 12/17 1016.9<br />
SBIO1 41.6N 082.8W 0730 23.4 8.5 SW 30.8 21/13 1014.4<br />
SGNW3 43.8N 087.7W 0739 20.7 9.0 S 21.5 04/07 1015.1<br />
SISW1 48.3N 122.9W 0728 13.1 8.7 W 28.7 11/01 1017.1<br />
SMKF1 24.6N 081.1W 0656 29.5 30.8 10.2 E 27.8 04/22 1017.5<br />
SPGF1 26.7N 079.0W 0733 29.0 6.8 SE 19.7 14/21 1017.2<br />
SRST2 29.7N 094.1W 0727 29.1 12.0 S 25.6 03/14 1016.9<br />
STDM4 47.2N 087.2W 0737 18.3 11.7 W 32.0 21/21 1013.7<br />
SUPN6 44.5N 075.8W 0730 20.7 21.3 7.1 S 17.1 01/18 1012.4<br />
THIN6 44.3N 076.0W 0723 20.5<br />
TPLM2 38.9N 076.4W 0726 25.1 25.4 9.1 S 24.5 01/00 1015.5<br />
TTIW1 48.4N 124.7W 0730 13.0 9.6 S 27.5 15/02 1017.9<br />
VENF1 27.1N 082.5W 0538 27.7 30.2 7.2 W 22.0 11/20 1018.0<br />
WPOW1 47.7N 122.4W 0723 16.2 7.6 NE 17.3 13/04 1017.0<br />
August 1998<br />
41001 34.7N 072.6W 0558 27.0 27.8 1.5 5.3 26/20 9.4 E 31.9 27/04 1017.5<br />
41002 32.3N 075.2W 0737 27.6 28.6 1.7 9.7 26/02 10.8 SW 41.2 26/03 1015.7<br />
41004 32.5N 079.1W 0710 26.9 1.3 6.2 26/04 10.4 NE 38.5 26/12 1015.3<br />
41008 31.4N 080.9W 0731 27.6 27.6 0.9 2.7 02/00 10.6 NE 24.5 02/08 1015.8<br />
41009 28.5N 080.2W 1448 28.4 28.9 1.0 4.0 25/15 8.4 SE 27.4 20/17 1016.1<br />
41010 28.9N 078.6W 1472 29.0 30.0 1.5 6.0 24/20 9.4 NE 26.8 25/18 1016.1<br />
42001 25.9N 089.7W 0738 29.3 0.6 2.8 31/22 9.4 E 31.7 20/14 1014.5<br />
42002 25.9N 093.6W 0743 29.5 30.5 0.7 3.1 31/22 9.2 E 27.2 20/19 1014.7<br />
42003 25.9N 085.9W 0738 29.0 30.2 0.5 1.6 20/08 8.0 E 24.5 05/19 1014.9<br />
42007 30.1N 088.8W 0734 28.9 30.1 0.5 1.9 21/16 8.3 E 29.0 14/17 1015.3<br />
42019 27.9N 095.4W 0741 28.8 29.8 0.7 4.4 22/04 9.1 SE 29.7 22/02 1014.3<br />
42020 26.9N 096.7W 0742 28.9 29.2 0.7 2.9 22/05 9.9 SE 26.6 21/13 1014.0<br />
42035 29.3N 094.4W 0736 29.3 30.7 0.6 3.0 21/23 8.8 S 27.8 22/01 1014.9<br />
42036 28.5N 084.5W 0738 28.9 29.9 0.5 2.0 21/03 7.3 E 26.6 20/16 1016.5<br />
42039 28.8N 086.0W 0737 28.9 30.2 0.5 2.1 21/11 7.6 E 31.3 19/12 1017.0<br />
42040 29.2N 088.3W 0734 29.0 30.3 0.6 3.0 21/18 7.9 E 26.6 19/16 1016.3<br />
44004 38.5N 070.7W 0742 23.4 23.4 1.6 6.8 29/01 11.4 NE 34.4 29/00 1017.8<br />
44005 42.9N 068.9W 0739 19.0 18.4 1.0 3.5 29/18 8.6 S 26.2 26/09 1016.9<br />
44007 43.5N 070.2W 0739 17.4 17.3 0.6 1.8 29/22 7.4 S 17.9 10/21 1017.3<br />
44008 40.5N 069.4W 0736 20.1 19.4 1.2 5.4 29/10 8.1 NE 23.9 29/13 1018.1<br />
44009 38.5N 074.7W 0738 23.8 24.4 1.1 3.6 28/17 10.9 NE 30.5 28/16 1017.1<br />
44011 41.1N 066.6W 0737 18.8 18.0 1.2 5.9 29/17 7.4 N 35.0 29/16 1018.4<br />
44013 42.4N 070.7W 0741 18.2 16.4 0.4 1.6 29/17 6.5 S 20.6 29/11 1016.7<br />
44014 36.6N 074.8W 0742 24.9 24.9 1.5 6.1 27/23 11.1 NE 37.3 28/01 1015.9<br />
44025 40.3N 073.2W 0737 22.5 22.7 1.0 3.1 29/01 8.8 S 28.0 19/06 1017.7<br />
45001 48.1N 087.8W 0733 18.8 18.9 0.6 1.7 16/20 10.3 SW 25.1 17/11 1016.0<br />
45002 45.3N 086.4W 0711 21.1 21.7 0.5 1.7 20/08 10.1 S 26.8 14/23 1015.9<br />
45003 45.3N 082.8W 0732 20.0 20.4 0.5 1.5 20/15 9.2 S 22.2 23/11 1017.0<br />
Continued on Page 93
Continued from Page 92<br />
Buoy Climatological Data Summary<br />
MEAN MEAN MEAN SIG MAX SIG MAX SIG SCALAR MEAN PREV MAX MAX MEAN<br />
BUOY LAT LONG OBS AIR TP SEA TP WAVE HT WAVE HT WAVE HT WIND SPEED WIND WIND WIND PRESS<br />
(C) (C) (M) (M) (DA/HR) (KNOTS) (DIR) (KTS) (DA/HR) (MB)<br />
45004 47.6N 086.6W 0740 18.6 18.5 0.6 1.9 17/16 9.8 S 22.7 17/16 1016.9<br />
45005 41.7N 082.4W 0739 23.0 23.8 0.4 1.4 19/02 8.6 SW 24.1 25/14 1017.0<br />
45006 47.3N 089.9W 0742 19.5 19.3 0.5 1.6 24/01 9.8 NE 29.1 29/07 1016.1<br />
45007 42.7N 087.0W 0736 22.6 23.2 0.5 2.0 16/00 9.0 S 19.6 15/23 1017.4<br />
45008 44.3N 082.4W 0740 21.0 21.1 0.5 1.9 18/08 8.9 N 24.1 18/07 1017.3<br />
46001 56.3N 148.2W 0735 12.4 13.2 2.0 8.2 31/22 12.4 W 29.3 31/04 1011.7<br />
46002 42.5N 130.3W 0741 17.3 18.1 1.5 2.6 30/19 10.5 N 20.4 23/07 1022.7<br />
46003 51.9N 155.9W 0741 11.1 11.6 2.1 5.6 31/16 15.0 W 31.7 31/14 1016.5<br />
46005 46.1N 131.0W 0735 16.2 16.9 1.4 2.5 09/07 9.6 NW 20.4 05/11 1022.8<br />
46006 40.9N 137.5W 0514 18.6 19.2 1.4 2.2 09/02 9.5 N 18.1 02/12 1024.1<br />
46011 34.9N 120.9W 0744 15.6 17.1 1.8 3.3 08/00 11.2 NW 23.5 23/23 1014.0<br />
46012 37.4N 122.7W 0735 13.6 14.5 1.7 3.2 07/14 9.4 NW 20.0 23/02 1014.8<br />
46013 38.2N 123.3W 0733 12.4 12.5 2.0 3.6 06/22 15.4 NW 29.3 07/01 1014.7<br />
46014 39.2N 124.0W 0738 12.4 11.9 2.0 3.6 07/03 13.6 NW 27.2 17/00 1014.8<br />
46022 40.7N 124.5W 0738 13.0 12.4 1.7 3.2 08/04 9.3 N 20.8 08/10 1017.2<br />
46023 34.7N 121.0W 0738 15.4 17.1 1.8 3.0 07/22 13.8 NW 26.2 23/23 1014.6<br />
46025 33.8N 119.1W 0729 19.2 20.6 1.1 1.9 04/21 5.9 W 15.2 05/00 1013.5<br />
46026 37.8N 122.8W 0287 12.7 13.7 1.4 2.3 23/04 11.8 NW 23.7 23/04 1014.5<br />
46027 41.9N 124.4W 0360 12.2 11.9 1.6 3.4 08/00 6.8 NW 32.6 07/22 1016.8<br />
46028 35.7N 121.9W 0413 14.5 15.4 2.1 3.4 29/06 16.9 NW 28.0 23/04 1013.4<br />
46029 46.1N 124.5W 0743 15.8 16.0 1.2 2.3 30/23 9.0 N 21.0 31/06 1019.5<br />
46030 40.4N 124.5W 0733 12.2 10.9 1.8 3.0 15/04 14.4 N 25.1 05/13 1017.1<br />
46035 56.9N 177.8W 0718 8.3 8.6 1.9 5.5 16/11 14.9 SW 35.8 25/02 1012.0<br />
46041 47.4N 124.5W 0740 14.4 14.0 1.1 2.2 24/02 7.2 NW 20.0 13/02 1019.8<br />
46042 36.8N 122.4W 0741 14.2 15.2 1.9 3.2 17/06 12.9 NW 25.6 29/00 1014.9<br />
46045 33.8N 118.5W 0741 19.5 20.6 0.7 1.4 19/05 4.8 SW 11.9 18/22 1012.6<br />
46050 44.6N 124.5W 0743 15.6 14.4 1.5 2.7 31/06 11.7 N 21.4 30/07 1019.3<br />
46053 34.2N 119.9W 0687 17.6 19.4 0.9 1.8 24/03 9.6 W 20.8 18/03 1013.4<br />
46054 34.3N 120.5W 0735 16.3 17.3 1.7 2.7 07/23 17.3 NW 31.1 18/01 1012.7<br />
46059 38.0N 130.0W 0739 18.4 1.7 2.7 31/22 12.1 N 20.8 24/15<br />
46060 60.6N 146.8W 1479 12.6 14.0 0.4 1.9 31/21 9.8 E 31.3 31/20 1012.7<br />
46061 60.2N 146.8W 1472 12.6 13.6 1.0 4.5 31/23 10.2 E 37.1 31/22 1012.0<br />
46062 35.1N 121.0W 0724 15.3 16.8 1.8 3.0 07/18 12.4 NW 24.9 23/19 1013.6<br />
46063 34.3N 120.7W 0739 15.8 16.8 1.9 3.1 23/16 16.0 NW 25.6 29/05 1013.0<br />
51001 23.4N 162.3W 0740 25.2 26.1 2.0 3.1 23/22 14.5 E 21.8 23/00 1018.4<br />
51002 17.2N 157.8W 0737 25.9 26.5 2.2 3.4 19/18 14.2 NE 22.2 21/02 1015.6<br />
51003 19.1N 160.8W 0574 26.0 26.7 1.8 2.8 24/02 11.4 NE 20.3 24/20 1016.3<br />
51004 17.4N 152.5W 0741 25.7 26.3 2.1 3.6 23/23 14.3 NE 20.9 24/20 1016.0<br />
51028 0.0N 153.9W 0713 23.2 23.0 2.0 3.0 04/16 10.7 E 19.4 18/10 1012.3<br />
91204 9.9N 139.7E 0512 49.5 5.6 NE 27.2 10/04 1010.0<br />
91328 8.6N 149.7E 0511 28.1 4.4 NE 21.3 27/06 1009.5<br />
91343 7.6N 155.2E 0503 28.2 1009.1<br />
91352 6.2N 160.7E 0464 27.9 1011.9<br />
91374 8.7N 171.2E 0737 27.4 4.4 NE 15.3 01/02 1010.5<br />
91377 6.1N 172.1E 0447 28.0 1013.1<br />
91411 8.3N 137.5E 0383 28.5 1009.6<br />
ABAN6 44.3N 075.9W 0741 20.7 21.4 3.6 S 14.1 18/19 1017.8<br />
ALSN6 40.5N 073.8W 0738 23.3 0.8 2.1 28/22 11.5 S 33.1 19/05 1018.0<br />
BLIA2 60.8N 146.9W 1478 11.4 8.3 N 31.3 31/16 1013.4<br />
BURL1 28.9N 089.4W 0735 29.4 8.8 E 29.9 15/21 1015.3<br />
BUZM3 41.4N 071.0W 0735 20.8 0.5 2.1 26/08 10.3 S 30.0 19/07 1018.8<br />
CARO3 43.3N 124.4W 0736 13.1 6.5 NE 20.3 28/20 1019.3<br />
CDRF1 29.1N 083.0W 0741 28.0 7.4 NE 27.7 08/00 1016.4<br />
CHLV2 36.9N 075.7W 0742 24.6 24.4 1.0 3.5 28/15 13.4 NE 71.8 28/06 1017.4<br />
CLKN7 34.6N 076.5W 0713 26.2 13.0 NE 58.6 27/05 1017.3<br />
CSBF1 29.7N 085.4W 0734 28.3 6.0 NE 21.5 07/21 1016.7<br />
DBLN6 42.5N 079.4W 0741 22.0 7.2 SW 30.2 25/17 1018.0<br />
DESW1 47.7N 124.5W 0730 14.3 9.3 NW 31.9 13/01 1019.5<br />
DISW3 47.1N 090.7W 0732 19.8 9.9 SW 23.3 17/12 1016.3<br />
DPIA1 30.3N 088.1W 0737 28.7 30.8 8.2 E 22.1 21/15 1016.2<br />
DRYF1 24.6N 082.9W 0735 29.5 30.8 7.1 E 23.3 19/20 1014.6<br />
DSLN7 35.2N 075.3W 0737 25.8 1.0 3.5 26/01 14.5 NE 63.0 27/19 1015.8<br />
DUCN7 36.2N 075.8W 0726 25.4 0.9 2.9 27/20 12.3 NE 44.9 27/20 1018.5<br />
FBIS1 32.7N 079.9W 0738 27.1 8.4 SW 23.6 20/11 1016.8<br />
December 1998 93
Meteorological Services—Observations<br />
U.S. Port Meteorological<br />
Officers<br />
Headquarters<br />
Vincent Zegowitz<br />
<strong>Voluntary</strong> <strong>Observing</strong> <strong>Ship</strong>s <strong>Program</strong><br />
Leader<br />
National <strong>Weather</strong> Service, <strong>NOAA</strong><br />
1325 East-West Hwy., Room 14112<br />
Silver Spring, MD 20910<br />
Tel: 301-713-1677 Ext. 129<br />
Fax: 301-713-1598<br />
Martin S. Baron<br />
VOS Assistant <strong>Program</strong> Leader<br />
National <strong>Weather</strong> Service, <strong>NOAA</strong><br />
1325 East-West Hwy., Room 14108<br />
Silver Spring, MD 20910<br />
Tel: 301-713-1677 Ext. 134<br />
Fax: 301-713-1598<br />
CDR. Tim Rulon<br />
GMDSS <strong>Program</strong> Manager<br />
National <strong>Weather</strong> Service, <strong>NOAA</strong><br />
1325 East-West Hwy., Room 14114<br />
Silver Spring, MD 20910<br />
Tel: 301-713-1677 Ext. 128<br />
Fax: 301-713-1598<br />
E-Mail: Timothy.Rulon@noaa.gov<br />
Mary Ann Burke, Editor<br />
<strong>Mariners</strong> <strong>Weather</strong> <strong>Log</strong><br />
3030 70th Avenue<br />
Wilson, WI 54027<br />
Tel and Fax: 715-772-3487<br />
E-Mail: wvrs@discover-net.net<br />
Atlantic Ports<br />
Robert Drummond, PMO<br />
National <strong>Weather</strong> Service, <strong>NOAA</strong><br />
2550 Eisenhower Blvd, No. 312<br />
P.O. Box 165504<br />
Port Everglades, FL 33316<br />
Tel: 954-463-4271<br />
Fax/Tel: 954-462-8963<br />
Lawrence Cain, PMO<br />
National <strong>Weather</strong> Service, <strong>NOAA</strong><br />
13701 Fang Rd.<br />
Jacksonville, FL 32218<br />
Tel: 904-741-5186<br />
Peter Gibino, PMO, Norfolk<br />
NWS-<strong>NOAA</strong><br />
94 <strong>Mariners</strong> <strong>Weather</strong> <strong>Log</strong><br />
200 World Trade Center<br />
Norfolk, VA 23510<br />
Tel: 757-441-3415<br />
Fax: 757-441-6051<br />
James Saunders, PMO<br />
National <strong>Weather</strong> Service, <strong>NOAA</strong><br />
Maritime Center I, Suite 287<br />
2200 Broening Hwy.<br />
Baltimore, MD 21224-6623<br />
Tel: 410-633-4709<br />
Fax: 410-633-4713<br />
E-mail: pmojim@erols.com<br />
PMO, New Jersey<br />
National <strong>Weather</strong> Service, <strong>NOAA</strong><br />
110 Lower Main Street, Suite 201<br />
South Amboy, NJ 08879-1367<br />
Tel: 732-316-5409<br />
Fax: 732-316-6543<br />
Tim Kenefick, PMO, New York<br />
National <strong>Weather</strong> Service, <strong>NOAA</strong><br />
110 Lower Main Street, Suite 201<br />
South Amboy, NJ 08879-1367<br />
Tel: 732-316-5409<br />
Fax: 732-316-6543<br />
Great Lakes Ports<br />
Amy Seeley, PMO<br />
National <strong>Weather</strong> Service, <strong>NOAA</strong><br />
333 West University Dr.<br />
Romeoville, IL 60441<br />
Tel: 815-834-0600 Ext. 269<br />
Fax: 815-834-0645<br />
George Smith, PMO<br />
National <strong>Weather</strong> Service, <strong>NOAA</strong><br />
Hopkins International Airport<br />
Federal Facilities Bldg.<br />
Cleveland, OH 44135<br />
Tel: 216-265-2374<br />
Fax: 216-265-2371<br />
E-Mail: George.E.Smith@noaa.gov<br />
Gulf of Mexico Ports<br />
John Warrelmann, PMO<br />
National <strong>Weather</strong> Service, <strong>NOAA</strong><br />
Int’l Airport, Moisant Field<br />
Box 20026<br />
New Orleans, LA 70141<br />
Tel: 504-589-4839<br />
James Nelson, PMO<br />
National <strong>Weather</strong> Service, <strong>NOAA</strong><br />
Meteorological Services<br />
Houston Area <strong>Weather</strong> Office<br />
1620 Gill Road<br />
Dickinson, TX 77539<br />
Tel: 281-534-2640 x.277<br />
Fax: 281-337-3798<br />
E-mail: jim.nelson@noaa.gov<br />
Pacific Ports<br />
Derek Lee Loy<br />
Ocean Services <strong>Program</strong> Coordinator<br />
NWS Pacific Region HQ<br />
Grosvenor Center, Mauka Tower<br />
737 Bishop Street, Suite 2200<br />
Honolulu, HI 96813-3213<br />
Tel: 808-532-6439<br />
Fax: 808-532-5569<br />
Robert Webster, PMO<br />
National <strong>Weather</strong> Service, <strong>NOAA</strong><br />
501 West Ocean Blvd., Room 4480<br />
Long Beach, CA 90802-4213<br />
Tel: 562-980-4090<br />
Fax: 562-980-4089<br />
Telex: 7402731/BOBW UC<br />
E-mail: bob.webster@noaa.gov<br />
Robert Novak, PMO<br />
National <strong>Weather</strong> Service, <strong>NOAA</strong><br />
1301 Clay St., Suite 1190N<br />
Oakland, CA 94612-5217<br />
Tel: 510-637-2960<br />
Fax: 510-637-2961<br />
Telex: 7402795/WPMO UC<br />
E-mail: w-wr-oak@noaa.gov<br />
Patrick Brandow, PMO<br />
National <strong>Weather</strong> Service, <strong>NOAA</strong><br />
7600 Sand Point Way, N.E.<br />
Seattle, WA 98115-0070<br />
Tel: 206-526-6100<br />
Fax: 206-526-4571 or 6094<br />
Telex: 7608403/SEA UC<br />
E-Mail: pat.brandow@noaa.gov<br />
Gary Ennen<br />
National <strong>Weather</strong> Service, <strong>NOAA</strong><br />
600 Sandy Hook St., Suite 1<br />
Kodiak, AK 99615<br />
Tel: 907-487-2102<br />
Fax: 907-487-9730<br />
Lynn Chrystal, OIC<br />
National <strong>Weather</strong> Service, <strong>NOAA</strong><br />
Box 427<br />
Continued on Page 95
Meteorological Services<br />
Continued from Page 94<br />
Valdez, AK 99686<br />
Tel: 907-835-4505<br />
Fax: 907-835-4598<br />
Greg Matzen, Marine <strong>Program</strong> Mgr.<br />
W/AR1x2 Alaska Region<br />
National <strong>Weather</strong> Service<br />
222 West 7th Avenue #23<br />
Anchorage, AK 99513-7575<br />
Tel: 907-271-3507<br />
SEAS Field<br />
Representatives<br />
Mr. Robert Decker<br />
Seas <strong>Log</strong>istics/ PMC<br />
7600 Sand Point Way N.E.<br />
Seattle, WA 98115<br />
Tel: 206-526-4280<br />
Fax: 206-526-6365<br />
Telex: 7408535<br />
E-Mail: bob.decker@noaa.gov<br />
Mr. Steven Cook<br />
<strong>NOAA</strong>-AOML<br />
United States GOOS Center<br />
4301 Rickenbacker Causeway<br />
Miami, FL 33149<br />
Tel: 305-361-4501<br />
Fax: 305-361-4366<br />
E-Mail: cook@aoml.noaa.gov<br />
Mr. Robert Benway<br />
National Marine Fisheries Service<br />
28 Tarzwell Dr.<br />
Narragansett, RI 02882<br />
Tel: 401-782-3295<br />
Fax: 401-782-3201<br />
Mr. Jim Farrington<br />
SEAS <strong>Log</strong>istics/ A.M.C.<br />
439 WestWork St.<br />
Norfolk, VA 23510<br />
Tel: 757-441-3062<br />
Fax: 757-441-6495<br />
Mr. Warren Krug<br />
Atlantic Oceanographic & Met. Lab.<br />
4301 Rickenbacker Causeway<br />
Miami, FL 33149<br />
Tel: 305-361-4433<br />
Fax: 305-361-4582<br />
Telex: 744 7600 MCI<br />
NIMA Fleet Liaison<br />
Tom Hunter, Fleet Liaison Officer<br />
ATTN: GIMM (MS D-44)<br />
4600 Sangamore Road<br />
Bethesda, MD 20816-5003<br />
Tel: 301-227-3120<br />
Fax: 301-227-4211<br />
U.S. Coast Guard AMVER<br />
Center<br />
Richard T. Kenney<br />
AMVER Maritime Relations Officer<br />
United States Coast Guard<br />
Battery Park Building<br />
New York, NY 10004<br />
Tel: 212-668-7764<br />
Fax: 212-668-7684<br />
Telex: 127594 AMVERNYK<br />
Other Port Meteorological<br />
Officers<br />
Australia<br />
Headquarters<br />
Tony Baxter<br />
Bureau of Meteorology<br />
150 Lonsdale Street, 7th Floor<br />
Melbourne, VIC 3000<br />
Tel: +613 96694651<br />
Fax: +613 96694168<br />
Melbourne<br />
Michael T. Hills, PMA<br />
Victoria Regional Office<br />
Bureau of Meteorology, 26th Floor<br />
150 Lonsdale Street<br />
Melbourne, VIC 3000<br />
Tel: +613 66694982<br />
Fax: +613 96632059<br />
Fremantle<br />
Captain Alan H. Pickles, PMA<br />
WA Regional Office<br />
1100 Hay Street, 5th Floor<br />
West Perth WA 6005<br />
Tel: +619 3356670<br />
Fax: +619 2632297<br />
Sydney<br />
Captain E.E. (Taffy) Rowlands, PMA<br />
NSW Regional Office<br />
Bureau of Meteorology, Level 15<br />
300 Elizabeth Street<br />
Sydney NSW 2000<br />
Tel:+612 92961547<br />
Fax: +612 92961589<br />
Telex: AA24640<br />
Canada<br />
Randy Sheppard, PMO<br />
Environment Canada<br />
Meteorological Services<br />
1496 Bedford Highway, Bedford<br />
(Halifax) Nova Scotia B4A 1E5<br />
902-426-6703<br />
Denis Blanchard<br />
Environment Canada<br />
100 Alexis Nihon Blvd., 3rd Floor<br />
Ville St. Laurent, (Montreal) Quebec<br />
H4M 2N6<br />
Tel: 514-283-6325<br />
D. Miller, PMO<br />
Environment Canada<br />
Bldg. 303, Pleasantville<br />
P.O. Box 21130, Postal Station “B”<br />
St. John’s, Newfoundland A1A 5B2<br />
Tel: 709-772-4798<br />
Michael Riley, PMO<br />
Environment Canada<br />
Pacific and Yukon Region<br />
Suite 700, 1200 W. 73rd Avenue<br />
Vancouver, British Columbia V6P 6H9<br />
Tel: 604-664-9136<br />
Fax: 604-664-9195<br />
E-Mail: Mike.Riley@ec.gc.ca<br />
Ron Fordyce, Supt. Marine Data Unit<br />
Rick Shukster, PMO<br />
Environment Canada<br />
Port Meteorological Office<br />
100 East Port Blvd.<br />
Hamilton, Ontario L8H 7S4<br />
Tel: 905-312-0900<br />
Fax: 905-312-0730<br />
China<br />
YU Zhaoguo<br />
Shanghai Meteorological Bureau<br />
166 Puxi Road<br />
Shanghai, China<br />
Denmark<br />
Commander Lutz O. R. Niegsch<br />
PMO, Danish Meteorological Inst.<br />
Lyngbyvej 100, DK-2100<br />
Copenhagen, Denmark<br />
Tel: +45 39157500<br />
Fax: +45 39157300<br />
United Kingdom<br />
Headquarters<br />
Capt. Stuart M. Norwell,<br />
Marine Superintendent, BD (OM)<br />
Meteorological Office, Met O (OM)<br />
Scott Building, Eastern Road<br />
Bracknell, Berks RG12 2PW<br />
Continued on Page 96<br />
December 1998 95
Meteorological Services<br />
Continued from Page 95<br />
Tel: +44-1344 855654<br />
Fax: +44-1344 855921<br />
Telex: 849801 WEABKA G<br />
Bristol Channel<br />
Captain Austin P. Maytham, PMO<br />
P.O. Box 278, Companies House<br />
CrownWay, Cardiff CF4 3UZ<br />
Tel: + 44 1222 221423<br />
Fax: +44 1222 225295<br />
East England<br />
Captain John Steel, PMO<br />
Customs Bldg., Albert Dock<br />
Hull HU1 2DP<br />
Tel: +44 1482 320158<br />
Fax: +44 1482 328957<br />
Northeast England<br />
Captain Gordon Young, PMO<br />
Able House, Billingham Reach<br />
Industrial Estate, Cleveland TS23 lPX<br />
Tel: +44 1642 560993<br />
Fax:+44 1642 562170<br />
Northwest England<br />
Captain Jim Williamson, PMO<br />
Room 313, Royal Liver Building<br />
Liverpool L3 1JH<br />
Tel:+44 151 2366565<br />
Fax: +44 151 2274762<br />
Scotland and Northern Ireland<br />
Captain Peter J. Barratt, PMO<br />
Navy Buildings, Eldon St.<br />
Greenock, Strathclyde PA16 7SL<br />
Tel: +44 1475 724700<br />
Fax: +44 1475 892879<br />
Southeast England<br />
Captain Harry Gale, PMO<br />
Trident House, 21 Berth, Tilbury Dock<br />
Tilbury, Essex RM18 7HL<br />
Tel: +44 1375 859970<br />
Fax: +44 1375 859972<br />
Southwest England<br />
Captain Douglas R. McWhan, PMO<br />
8 Viceroy House, Mountbatten Centre<br />
Millbrook Rd. East<br />
Southampton SO15 lHY<br />
Tel: +44 1703 220632<br />
Fax: +44 1703 337341<br />
France<br />
Yann Prigent, PMO<br />
Station Mét., Noveau Semaphore<br />
96 <strong>Mariners</strong> <strong>Weather</strong> <strong>Log</strong><br />
Quai des Abeilles, Le Havre<br />
Tel: +33 35422106<br />
Fax: +33 35413119<br />
P. Coulon<br />
Station Météorologique<br />
de Marseille-Port<br />
12 rue Sainte Cassien<br />
13002 Marseille<br />
Tel: +33 91914651 Ext. 336<br />
Germany<br />
Henning Hesse, PMO<br />
Wetterwarte, An der neuen Schleuse<br />
Bremerhaven<br />
Tel: +49 47172220<br />
Fax: +49 47176647<br />
Jurgen Guhne, PMO<br />
Deutscher Wetterdienst<br />
Seewetteramt<br />
Bernhard Nocht-Strasse 76<br />
20359 Hamburg<br />
Tel: 040 3190 8826<br />
Greece<br />
George E. Kassimidis, PMO<br />
Port Office, Piraeus<br />
Tel: +301 921116<br />
Fax: +3019628952<br />
Hong Kong<br />
C. F. Wong, PMO<br />
Hong Kong Observatory<br />
Unit 2613, 26/F, Miramar Tower<br />
14/F Ocean Centre<br />
1 Kimberly Road<br />
Kowloon, Hong Kong<br />
Tel: +852 2926 3100<br />
Fax: +852 2375 7555<br />
Israel<br />
Hani Arbel, PMO<br />
Haifa Port<br />
Tel: 972 4 8664427<br />
Aharon Ofir, PMO<br />
Marine Department<br />
Ashdod Port<br />
Tel: 972 8 8524956<br />
Japan<br />
Headquarters<br />
Marine Met. Div., Marine Dept.<br />
Japan Meteorological Agency<br />
1-34 Otemachi, Chiyoda-ku<br />
Meteorological Services<br />
Tokyo, 100 Japan<br />
Fax: 03-3211-6908<br />
Port Meteorological Officer<br />
Kobe Marine Observatory<br />
14-1, Nakayamatedori-7-chome<br />
Chuo-ku, Kobe, 650 Japan<br />
Fax: 078-361-4472<br />
Port Meteorological Officer<br />
Nagoya Local Meteorological Obs.<br />
2-18, Hiyori-cho, Chikusa-ku<br />
Nagoya, 464 Japan<br />
Fax: 052-762-1242<br />
Port Meteorological Officer<br />
Yokohama Local Met. Observatory<br />
99 Yamate-cho, Naka-ku,<br />
Yokohama, 231 Japan<br />
Fax: 045-622-3520<br />
Kenya<br />
Ali J. Mafimbo, PMO<br />
PO Box 98512<br />
Mombasa, Kenya<br />
Tel: +254 1125685<br />
Fax: +254 11433440<br />
Malaysia<br />
NG Kim Lai<br />
Assistant Meteorological Officer<br />
Malaysian Meteorological Service<br />
Jalan Sultan, 46667 Petaling<br />
Selangor, Malaysia<br />
Mauritius<br />
Mr. S Ragoonaden<br />
Meteorological Services<br />
St. Paul Road, Vacoas, Mauritius<br />
Tel: +230 6861031<br />
Fax: +230 6861033<br />
Netherlands<br />
John W. Schaap, PMO<br />
KNMI/PMO-Office<br />
Wilhelminalaan 10, PO Box 201<br />
3730 AE De Bilt, Netherlands<br />
Tel: +3130 2206391<br />
Fax: +3130 210849<br />
E-Mail: schaap@knmi.nl<br />
New Zealand<br />
Julie Fletcher, MMO<br />
MetService New Zealand Ltd.<br />
Continued on Page 97
Meteorological Services<br />
Continued from Page 96<br />
P.O. Box 722<br />
Wellington, New Zealand<br />
Tel: +644 4700789<br />
Fax: +644 4700772<br />
Norway<br />
Tor Inge Mathiesen, PMO<br />
Norwegian Meteorological Institute<br />
Allegaten 70, N-5007<br />
Bergen, Norway<br />
Tel: +475 55236600<br />
Fax: +475 55236703<br />
Poland<br />
Jozef Kowalewski,PMO<br />
Institute of Meteorology and Water Mgt.<br />
Maritime Branch<br />
ul.Waszyngtona 42, 81-342 Gdynia Poland<br />
Tel: +4858 6205221<br />
Fax: +4858 6207101<br />
E-mail: kowalews@stratus/imgw.gdynia.pl<br />
Saudi Arabia<br />
Mahmud Rajkhan, PMO<br />
National Met. Environment Centre<br />
Eddah<br />
Tel:+ 9662 6834444 Ext. 325<br />
Singapore<br />
Edmund Lee Mun San, PMO<br />
Meteorological Service, PO Box 8<br />
Singapore Changi Airport<br />
Singapore 9181<br />
Tel: +65 5457198<br />
Fax: +65 5457192<br />
Meteorological Services - Forecasts<br />
Headquarters<br />
Laura Cook<br />
Marine <strong>Weather</strong> Services <strong>Program</strong><br />
Manager<br />
National <strong>Weather</strong> Service<br />
1325 East-West Highway, Room 14126<br />
Silver Spring, MD 20910<br />
Tel: 301-713-1677 x. 126<br />
Fax: 301-713-1598<br />
Richard May<br />
Assistant Marine <strong>Weather</strong> Services<br />
<strong>Program</strong> Manager<br />
National <strong>Weather</strong> Service<br />
1325 East-West Highway, Room 14124<br />
Silver Spring, MD 20910<br />
Tel: 301-713-1677 x. 127<br />
Fax: 301-713-1598<br />
E-Mail: richard.may@noaa.gov<br />
U.S. NWS Offices<br />
Atlantic & Eastern Pacific<br />
Offshore & High Seas<br />
David Feit<br />
National Centers for Environmental<br />
Prediction<br />
Marine Prediction Center<br />
Washington, DC 20233<br />
Tel: 301-763-8442<br />
Fax: 301-763-8085<br />
Tropics<br />
Chris Burr<br />
National Centers for Environmental<br />
Prediction<br />
Tropical Prediction Center<br />
11691 Southwest 17th Street<br />
Miami, FL 33165<br />
Tel: 305-229-4433<br />
Fax: 305-553-1264<br />
E-Mail: burr@nhc.noaa.gov<br />
Central Pacific High Seas<br />
Hans Rosendal<br />
National <strong>Weather</strong> Service Forecast Office<br />
2525 Correa Road, Suite 250<br />
Honolulu, HI 96822-2219<br />
Tel: 808-973-5280<br />
Fax: 808-973-5281<br />
Alaska High Seas<br />
Dave Percy<br />
National <strong>Weather</strong> Service<br />
Meteorological Services<br />
South Africa<br />
C. Sydney Marais, PMO<br />
c/o <strong>Weather</strong> Office<br />
Capt Town International Airport 7525<br />
Tel: + 27219340450 Ext. 213<br />
Fax: +27219343296<br />
Gus McKay, PMO<br />
Meteorological Office<br />
Durban International Airpot 4029<br />
Tel: +2731422960<br />
Fax: +2731426830<br />
Sweden<br />
Morgan Zinderland<br />
SMHI<br />
S-601 76 Norrköping, Sweden<br />
6930 Sand Lake Road<br />
Anchorage, AK 99502-1845<br />
Tel: 907-266-5106<br />
Fax: 907-266-5188<br />
Coastal Atlantic<br />
Robert Marine<br />
National <strong>Weather</strong> Service Forecast Office<br />
P.O. Box 1208<br />
Gray, ME 04039<br />
Tel: 207-688-3216<br />
Tom Fair<br />
National <strong>Weather</strong> Service Forecast Office<br />
445 Myles Standish Blvd.<br />
Taunton, MA 02780<br />
Tel: 508-823-1900<br />
Ingrid Amberger<br />
National <strong>Weather</strong> Service Forecast Office<br />
175 Brookhaven Avenue<br />
Building NWS #1<br />
Upton, NY 11973<br />
Tel: 516-924-0499 (0227)<br />
James A. Eberwine<br />
National <strong>Weather</strong> Service Forecast Office<br />
Philadelphia<br />
Continued on Page 98<br />
December 1998 97
Meteorological Services<br />
Continued from Page 97<br />
732 Woodlane Road<br />
Mount Holly, NJ 08060<br />
Tel: 609-261-6600 ext. 238<br />
Dewey Walston<br />
National <strong>Weather</strong> Service Forecast Office<br />
44087 <strong>Weather</strong> Service Road<br />
Sterling, VA 20166<br />
Tel: 703-260-0107<br />
Neil Stuart<br />
National <strong>Weather</strong> Service Office<br />
10009 General Mahone Hwy.<br />
Wakefield, VA 23888-2742<br />
Tel: 804-899-4200 ext. 231<br />
John Elardo<br />
National <strong>Weather</strong> Service Office<br />
53 Roberts Road<br />
Newport, NC 28570<br />
Tel: 919-223-5737<br />
Doug Hoehler<br />
National <strong>Weather</strong> Service Forecast Office<br />
2015 Gardner Road<br />
Wilmington, NC 28405<br />
Tel: 910-762-4289<br />
John F. Townsend<br />
National <strong>Weather</strong> Service Office<br />
5777 South Aviation Avenue<br />
Charleston, SC 29406-6162<br />
Tel: 803-744-0303 ext. 6 (forecaster)<br />
803-744-0303 ext. 2 (marine weather<br />
recording)<br />
Andrew Shashy<br />
National <strong>Weather</strong> Service Forecast Office<br />
13701 Fang Road<br />
Jacksonville, FL 32218<br />
Tel: 904-741-5186<br />
Randy Lascody<br />
National <strong>Weather</strong> Service Office<br />
421 Croton Road<br />
Melbourne, FL 32935<br />
Tel: 407-254-6083<br />
Michael O’Brien<br />
National <strong>Weather</strong> Service Forecast Office<br />
11691 Southwest 17 Street<br />
Miami, FL 33165-2149<br />
Tel: 305-229-4525<br />
Great Lakes<br />
Daron Boyce, Senior Marine Forecaster<br />
National <strong>Weather</strong> Service Forecast Office<br />
98 <strong>Mariners</strong> <strong>Weather</strong> <strong>Log</strong><br />
Hopkins International Airport<br />
Cleveland, OH 44135<br />
Tel: 216-265-2370<br />
Fax: 216-265-2371<br />
Tom Paone<br />
National <strong>Weather</strong> Service Forecast Office<br />
587 Aero Drive<br />
Buffalo, NY 14225<br />
Tel: 716-565-0204 (M-F 7am-5pm)<br />
Tracy Packingham<br />
National <strong>Weather</strong> Service Office<br />
5027 Miller Trunk Hwy.<br />
Duluth, MN 55811-1442<br />
Tel: 218-729-0651<br />
Dave Guenther<br />
National <strong>Weather</strong> Service Office<br />
112 Airport Drive S.<br />
Negaunee, MI 49866<br />
Tel: 906-475-5782<br />
Jim Skowronski and Jill Last<br />
National <strong>Weather</strong> Service Office<br />
2485 S. Pointe Road<br />
Green Bay, WI 54313-5522<br />
Tel: 414-494-5845<br />
Thomas Zajdel<br />
National <strong>Weather</strong> Service Forecast Office<br />
Milwaukee<br />
N3533 Hardscrabble Road<br />
Dousman, WI 53118-9409<br />
Tel: 414-297-3243<br />
Fax: 414-965-4296<br />
Amy Seely<br />
National <strong>Weather</strong> Service Forecast Office<br />
333 West University Drive<br />
Romeoville, IL 60446<br />
Tel: 815-834-0673<br />
Peter Chan<br />
National <strong>Weather</strong> Service Office<br />
4899 S. Complex Drive, S.E.<br />
Grand Rapids, MI 49512-4034<br />
Tel: 616-956-7180 or 949-0643<br />
Scott Rozanski<br />
National <strong>Weather</strong> Service Office<br />
8800 Passenheim Hill Road<br />
Gaylord, MI 49735-9454<br />
Tel: 517-731-3384<br />
Bill Hosman<br />
National <strong>Weather</strong> Service Forecast Office<br />
9200 White Lake Road<br />
White Lake, MI 48386-1126<br />
Tel: 248-625-3309<br />
Fax: 248-625-4834<br />
Meteorological Services<br />
Coastal Gulf of Mexico<br />
Constantine Pashos<br />
National <strong>Weather</strong> Service Forecast Office<br />
2090 Airport Road<br />
New Braunfels, TX 78130<br />
Tel: 210-606-3600<br />
Len Bucklin<br />
National <strong>Weather</strong> Service Forecast Office<br />
62300 Airport Road<br />
Slidell, LA 70460-5243<br />
Tel: 504-522-7330<br />
Steve Pfaff, Marine Focal Point<br />
National <strong>Weather</strong> Service Forecast Office<br />
300 Pinson Drive<br />
Corpus Christi, TX 78406<br />
Tel: 512-289-0959<br />
Fax: 512-289-7823<br />
Jim Bafnall<br />
National <strong>Weather</strong> Service Office<br />
500 Airport Blvd., #115<br />
Lake Charles, LA 70607<br />
Tel: 318-477-3422<br />
Fax: 318-474-8705<br />
Eric Esbensen<br />
National <strong>Weather</strong> Service Office<br />
8400 Airport Blvd., Building 11<br />
Mobile, AL 36608<br />
Tel: 334-633-6443<br />
Fax: 334-607-9773<br />
Paul Yura/Mark Jackson<br />
National <strong>Weather</strong> Service Office<br />
20 South Vermillion<br />
Brownsville, TX 78521<br />
Robert Van Hoven<br />
National <strong>Weather</strong> Service Office<br />
Houston<br />
1620 Gill Road<br />
Dickenson, TX 77539<br />
Tel: 281-337-5074<br />
Fax: 281-337-3798<br />
Greg Mollere, Marine Focal Point<br />
National <strong>Weather</strong> Service Forecast Office<br />
3300 Capital Circle SW, Suite 227<br />
Tallahassee, FL 32310<br />
Tel: 904-942-8999<br />
Fax: 904-942-9396<br />
Dan Sobien<br />
National <strong>Weather</strong> Service Office<br />
Tampa Bay<br />
2525 14th Avenue SE<br />
Ruskin, FL 33570<br />
Continued on Page 99
Meteorological Services<br />
Continued from Page 98<br />
Tel: 813-645-2323<br />
Fax: 813-641-2619<br />
Scott Stripling, Marine Focal Point<br />
National <strong>Weather</strong> Service Office<br />
Carr. 190 #4000<br />
Carolina, Puerto Rico 00979<br />
Tel: 787-253-4586<br />
Fax: 787-253-7802<br />
Scott.Stripling@noaa.gov<br />
Coastal Pacific<br />
William D. Burton<br />
National <strong>Weather</strong> Service Forecast Office<br />
Bin C15700<br />
7600 Sand Point Way NE<br />
Seattle, WA 98115<br />
Tel: 206-526-6095 ext. 231<br />
Fax: 206-526-6094<br />
Stephen R. Starmer<br />
National <strong>Weather</strong> Service Forecast Office<br />
5241 NE 122nd Avenue<br />
Portland, OR 97230-1089<br />
Tel: 503-326 2340 ext. 231<br />
Fax: 503-326-2598<br />
National <strong>Weather</strong> Service Office<br />
4003 Cirrus Drive<br />
Medford, OR 97504<br />
Tel: 503-776-4303<br />
Fax: 503-776-4344<br />
Bill Forwood<br />
National <strong>Weather</strong> Service Office<br />
300 Startare Drive<br />
Eureka, CA 95501<br />
Tel: 707-443-5610<br />
Fax: 707-443-6195<br />
Jeff Kopps<br />
National <strong>Weather</strong> Service Forecast Office<br />
21 Grace Hopper Avenue, Stop 5<br />
Monterey, CA 93943-5505<br />
Tel: 408-656-1717<br />
Fax: 408-656-1747<br />
John Henderson<br />
National <strong>Weather</strong> Service Forecast Office<br />
520 North Elevar Street<br />
Oxnard, CA 93030<br />
Tel: 805-988-6615<br />
Fax: 805-988-6613<br />
Meteorological Services<br />
Mark Moede<br />
National <strong>Weather</strong> Service Office<br />
11440 West Bernardo Ct., Suite 230<br />
San Diego, CA 92127-1643<br />
Tel: 619-675-8700<br />
Fax: 619-675-8712<br />
Andrew Brewington<br />
National <strong>Weather</strong> Service Forecast Office<br />
6930 Sand Lake Road<br />
Anchorage, AK 95502-1845<br />
tel: 907-266-5105<br />
Dave Hefner<br />
National <strong>Weather</strong> Service Forecast Office<br />
Intl. Arctic Research Ctr. Bldg./UAF<br />
P.O. Box 757345<br />
Fairbanks, AK 99701-6266<br />
Tel: 907-458-3700<br />
Fax: 907-450-3737<br />
Robert Kanan<br />
National <strong>Weather</strong> Service Forecast Office<br />
8500 Mendenhall Loop Road<br />
Juneau, AK 99801<br />
Tel and Fax: 907-790-6827<br />
Guam<br />
Tel: 011-671-632-1010h<br />
(MWL) at $10.00 ($12.50 foreign) per year (3 issues).<br />
December 1998 99
U.S. Department of Commerce<br />
National Oceanic and Atmospheric Administration 40<br />
1315 East-West Highway<br />
Distribution Unit<br />
Silver Spring, MD 20910<br />
Attn: <strong>Mariners</strong> <strong>Weather</strong> <strong>Log</strong><br />
Address Correction Requested Book Rate<br />
OFFICIAL BUSINESS<br />
PENALTY FOR PRIVATE USE $300<br />
In this Issue:<br />
Why Are the Tides So Predictable? .................................................................................21<br />
Marine Familiarization Float on Board the<br />
S/S ARCO FAIRBANKS................................................................................................28<br />
Northeast Pacific Cooperative Drifter <strong>Program</strong> .............................................................30<br />
VOS <strong>Program</strong> Awards and Presentations Gallery..........................................................66