Volume 56, Number 3 December 2012 Photo by Denice Drass
Volume 56, Number 3 December 2012 Photo by Denice Drass
Volume 56, Number 3 December 2012 Photo by Denice Drass

You also want an ePaper? Increase the reach of your titles
YUMPU automatically turns print PDFs into web optimized ePapers that Google loves.
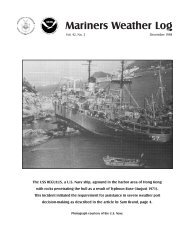
<strong>Volume</strong> <strong>56</strong>, <strong>Number</strong> 3 <strong>December</strong> <strong>2012</strong><br />
<strong>Photo</strong> <strong>by</strong> <strong>Denice</strong> <strong>Drass</strong>
<strong>December</strong> <strong>2012</strong> ~ Mariners Weather Log<br />
2<br />
Mariners Weather Log<br />
ISSN 0025-3367<br />
U.S. Department of Commerce<br />
Jane Lubchenco Ph.D.<br />
Under Secretary of Commerce for<br />
Oceans and Atmosphere<br />
National Weather Service<br />
Dr. John "Jack" L. Hayes<br />
NOAA Assistant Administrator for<br />
Weather Services<br />
Editorial Supervisor<br />
Paula M. Rychtar<br />
Layout and Design<br />
Leigh Ellis • www.EllisGS.com<br />
Articles, <strong>Photo</strong>graphs, and Letters<br />
should be sent to:<br />
Ms. Paula M. Rychtar, Editorial Supervisor<br />
Mariners Weather Log<br />
NDBC (W/OPS 51)<br />
Bldg. 3203<br />
Stennis Space Center, MS 39529-6000<br />
Phone: (228) 688-1818 Fax: (228) 688-3923<br />
E-Mail: paula.rychtar@noaa.gov<br />
Some Important Web Page Addresses:<br />
NOAA<br />
http://www.noaa.gov<br />
National Weather Service<br />
http://www.weather.gov<br />
National Data Buoy Center<br />
http://www.ndbc.noaa.gov<br />
AMVER Program<br />
http://www.amver.com<br />
VOS Program<br />
http://www.vos.noaa.gov<br />
SEAS Program<br />
http://seas.amverseas.noaa.gov/<br />
seas/seasmain.html<br />
Mariners Weather Log<br />
http://www.vos.noaa.gov/mwl.shtml<br />
Marine Dissemination<br />
http://www.nws.noaa.gov/om/marine/home.htm<br />
U.S. Coast Guard Navigation Center<br />
http://www.navcen.uscg.gov/marcomms/<br />
See these Web pages for further links.<br />
From the Editor<br />
Paula Rychtar<br />
Welcome once again to the Mariners Weather Log! <strong>December</strong> is upon us and I<br />
just cannot believe how this year flew <strong>by</strong>. As promised and to our dismay, our<br />
hurricane season was extremely active and consequently very devastating. I want<br />
to take this opportunity to thank you all for your diligence and care, providing the<br />
National Weather Service and the National Hurricane Center with quality weather<br />
observations. This most certainly helped in their ability to provide good analysis<br />
and guidance. We had two devastating hurricane events, both impacting the lives<br />
and commerce for hundreds if not thousands. Events such as these emphasize how<br />
vital marine weather observations are…and the need for accurate and timely data.<br />
Good analysis is always critical for giving adequate advance notice for watches,<br />
warnings and appropriate evacuation procedures when deemed necessary. I<br />
want to give mention to Hurricane Isaac; hitting the Gulf Coastline, Tuesday<br />
evening, September 28 th , the eve of the 7-year anniversary of Hurricane Katrina’s<br />
arrival. All of us who experienced Hurricane Katrina were very attentive and<br />
amazed of the timing with Isaac. The eye of Isaac made landfall just southwest<br />
of the mouth of the Mississippi River; Isaac then decided to move back over<br />
the water only to crawl offshore just off southeastern Louisiana before once<br />
again making landfall September 29 th , just west of Port Fourchon. Then there<br />
was Sandy. Hurricane Sandy developed late in the hurricane season and made<br />
landfall October 29 th near Atlantic City, New Jersey. Sandy is now documented<br />
as the largest Atlantic hurricane on record and the second costliest, only surpassed<br />
<strong>by</strong> Katrina in 2005. While re-writing my editors note to include the event of<br />
Hurricane Sandy, large portions of the east coast remain without power, gasoline<br />
food or shelter. Homes and businesses have simply vanished in the storm’s<br />
path. Cold weather descending upon the coast is compounding problems with<br />
a Nor’easter forecasted to hit them later this week. Please keep these people in<br />
your thoughts as they repair their lives.<br />
Our featured cover story is in celebration of the NOAA RESEARCH SHIP<br />
OREGON II. The OREGON II first set sail in 1967 and just recently celebrated<br />
her 300th expedition for the National Marine Fisheries Service. This ship is truly<br />
the workhorse of all NOAA Vessels. The size of the vessel, the smaller draft<br />
along with her design gives an advantage over most research vessels. The cost<br />
of operation on average is much lower than some of the larger NOAA ships and<br />
her ability to maneuver in the more shallow waters makes her indispensable and<br />
necessary for particular survey designs. In association with the 300 th expedition<br />
on the OREGON II, I included an article on the “Teacher at Sea” program. Steve<br />
Frantz, a teacher who got to ride on the OREGON II during the 300 th expedition<br />
gets to tell his story on his experiences from participating/volunteering on the<br />
shark Long line Survey. Our PMO Corner will spotlight our Charleston South<br />
Carolina PMO, Tim Kenefick. Tim will be sharing his time riding on the one of<br />
the maritime training ships, the EMPIRE STATE. Training the cadets is a huge<br />
undertaking and one that Tim is passionate about. His dedication to the cadets<br />
and the staff on the training ships need to be commended, as he never falters<br />
from this task.<br />
You may have noticed, we have been concentrating on instilling the new mindset<br />
that quality observations are more important than the quantity of observations.<br />
In light of that, I am including an article on this topic from none other than John<br />
Wasserman, our program manager. His article will provide guidance and insight<br />
on the need for a change of mindset in regards to quality over quantity.<br />
I would like to finish this <strong>by</strong> wishing all a wonderful<br />
holiday season. Remember to be loving, kind and<br />
thoughtful to those close to you as well as those<br />
far away.<br />
~ Paula<br />
On the cover:<br />
<strong>Photo</strong> taken <strong>by</strong> Dennis <strong>Drass</strong>.<br />
<strong>Volume</strong> <strong>56</strong>, <strong>Number</strong> 3 <strong>December</strong> <strong>2012</strong><br />
<strong>Photo</strong> <strong>by</strong> <strong>Denice</strong> <strong>Drass</strong>
Page 14<br />
Page 16<br />
NOAA SHIP OREGON II . . . . . . . . . . . . . . . . . . .4<br />
When All the Stars Align . . . . . . . . . . . . . . . . . . . .7<br />
PMO Corner . . . . . . . . . . . . . . . . . . . . . . . . . . .9<br />
A Note . . . . . . . . . . . . . . . . . . . . . . . . . . . . . 12<br />
Tributes: Randy Sheppard and Roger Bauer . . . . . . . . . 13<br />
ARCUS Clouds . . . . . . . . . . . . . . . . . . . . . . . . 14<br />
Shipwreck . . . . . . . . . . . . . . . . . . . . . . . . . . . 15<br />
Whale Sharks . . . . . . . . . . . . . . . . . . . . . . . . . 16<br />
Welcome Aboard Emma . . . . . . . . . . . . . . . . . . . 16<br />
Storm Surges During Hurricane Isaac . . . . . . . . . . . . 17<br />
Marine Debris Update. . . . . . . . . . . . . . . . . . . . . 24<br />
<strong>Photo</strong>graphs of Interest . . . . . . . . . . . . . . . . . . . . 25<br />
Departments:<br />
Marine Weather Review<br />
Mean Circulation Highlights and Climate Anomalies –<br />
May through August <strong>2012</strong> . . . . . . . . . . . . . . . . . . 26<br />
Tropical Atlantic and Tropical East Pacific Areas<br />
May through August <strong>2012</strong> . . . . . . . . . . . . . . . . . . 28<br />
North Atlantic Review:<br />
January through June <strong>2012</strong> . . . . . . . . . . . . . . . . . . 32<br />
North Pacific Review:<br />
January through June <strong>2012</strong> . . . . . . . . . . . . . . . . . . 37<br />
VOS Program<br />
VOS Program Awards . . . . . . . . . . . . . . . . . . . . 43<br />
VOS Program New Recruits:<br />
June 1 through September 30, <strong>2012</strong> . . . . . . . . . . . . . 48<br />
VOS Cooperative Ship Report:<br />
January through September <strong>2012</strong>. . . . . . . . . . . . . . . 48<br />
Points of Contact . . . . . . . . . . . . . . . . . . . . 49<br />
3<br />
<strong>December</strong> <strong>2012</strong> ~ Mariners Weather Log
NOAA Ship OregON ii<br />
<strong>December</strong> <strong>2012</strong> ~ Mariners Weather Log<br />
4<br />
NOAA ShiP OrEgON ii<br />
When the NOAA Ship OREGON II first set sail in 1967<br />
(homeport NOAA/NMFS/SEFSC/Mississippi Laboratories,<br />
Pascagoula, MS), the expectation was the vessel would have<br />
a service span of 20–25 years; not the remarkable 45 years<br />
of service the ship has completed. Globally and historically<br />
there are few research ships that can compare, and with the<br />
deployment of the 300 th expedition the OREGON II has<br />
certainly secured an honored place in the annals of scientific<br />
history. The OREGON II has logged over 10,000 days at<br />
sea and steamed more than 1,000,000 nautical miles, with<br />
projects ranging from as far south as the Amazon River<br />
Delta in Brazil, the Caribbean Sea and Gulf of Mexico, and<br />
extending north in the Atlantic Ocean to Cape Cod. With<br />
such a noteworthy and extensive record it speaks well of<br />
NOAA’s mission when considering the impact the OREGON<br />
II has had not only on fisheries research and marine science<br />
in general, but also on the lives of the many that have sailed<br />
aboard her.<br />
With the departure of the 300 th expedition (the annual<br />
red snapper/shark bottom longline survey) scheduled for<br />
July 26, <strong>2012</strong>, the OREGON II will dutifully continue its<br />
tradition of providing a research platform that is uniquely<br />
adaptable to a changing diversity of scientific objectives.<br />
The OREGON II has been the platform for many different<br />
stock assessment surveys including groundfish/shrimp,<br />
NOAA Ship OrEgON ii (circa 1967)<br />
sharks, reef fish, mammals and plankton and has deployed<br />
many types of gear such as pelagic and bottom longline gear,<br />
trawl gear(with turtle excluder devices and <strong>by</strong>catch reduction<br />
devices), plankton nets and remotely operated vehicles/traps/<br />
cameras. The OREGON II has provided NOAA’s National<br />
Weather Service’s Voluntary Observing Ship Program with<br />
well over 25,000 marine weather observations supporting<br />
many efforts; forecasting, hurricane tracking, environmental<br />
analysis, oceanography and climatology, just to identify a<br />
few. The OREGON II was used as a test bed platform for the<br />
automation of marine weather observations and has proven<br />
to be a success, thus currently sending in hourly data while<br />
underway conducting surveys. In addition, the OREGON II<br />
has been used as a training platform for numerous sea going<br />
personnel including ship captains, NOAA Corps officers and<br />
also opportunities for the NOAA Teacher at Sea Program<br />
where it was the first NOAA vessel to accommodate a teacher<br />
at sea.<br />
An example of how the vessel has had to adapt to over four<br />
decades of conducting science is best demonstrated <strong>by</strong> at-sea<br />
data collection; an activity that in 1967 was primarily a paper<br />
and pencil technology that has since transitioned to its present<br />
state-of-the-art-technology that links weatherproof on-deck<br />
data collection computers with ship computer systems that<br />
are capable of transmitting data in real time. With the possible
exceptions of providing memorable days at sea and fostering<br />
a comradeship founded in accomplishments that are their<br />
own unique reward, it is inevitable that the OREGON II has<br />
had to change as the scientific world continues to change. It<br />
is the adaptability to change that hopefully will continue to<br />
characterize the OREGON II well into the future.<br />
Pictured left to right: ENS Cassowe, Lt Miller, Captain<br />
Dave Nelson, Lt. harris and ENS Adornato<br />
Pictured is Karen Mitchell, SEFSC Vessel Coordinator,<br />
Mississippi Laboratories, presenting Captain Dave<br />
Nelson with the 300th Survey Plaque<br />
Pictured left to right: Ex-Captain Jim rowe and Captain<br />
Dave Nelson<br />
Pictured is the Crew, Officers and all the scientists/<br />
biologists involved with the NOAA ShiP OrEgON ii<br />
5<br />
NOAA Ship OregON ii<br />
<strong>December</strong> <strong>2012</strong> ~ Mariners Weather Log
NOAA Ship OregON ii<br />
<strong>December</strong> <strong>2012</strong> ~ Mariners Weather Log<br />
6<br />
Flags flying on the Oii<br />
Pictured is the OrEgON ii Crew and Officers<br />
Onlookers of the celebration and in the center with the<br />
blue shirt, Dave Jones, Port Meteorological Officer<br />
Oregon ii design for the 300th survey celebration…Design<br />
<strong>by</strong> Charles godwin and glenn Zapfe
When All The Stars Align<br />
It has been around fifteen years ago when I first heard<br />
about NOAA’s (National Oceanographic and Atmospheric<br />
Administration) Teacher At Sea program. Too busy. Too old.<br />
Too tired. All the excuses for not applying certainly applied<br />
to me. Over the years, Teacher At Sea was placed in the back<br />
of my crowded brain.<br />
In 2006, I attended a teacher workshop that granted three<br />
graduate credit hours for free. This workshop turned out to be<br />
with the GLOBE Program (Global Learning and Observation<br />
to Benefit the Environment Program). As it turned out, after<br />
a few very exciting and successful years participating in the<br />
GLOBE Program with my students, this workshop has turned<br />
out to be a career changer.<br />
While being engaged in the GLOBE program and attending<br />
a conference, it was announced that NOAA was once again<br />
a partner with the GLOBE Program; with that partnership<br />
came the opportunity to partake in the Teacher at Sea<br />
Program. Needless to say, everyone was very excited at this<br />
announcement yet I still had not brought Teacher At Sea to<br />
my frontal lobe for any consideration.<br />
The following year, the GLOBE Program office contacted<br />
me and invited me to present at the Teacher to Researcher<br />
Conference in Washington, D.C. This sounded like fun as<br />
well as a great opportunity to boast to the world about my<br />
dedicated and successful students in Akron, Ohio. At this<br />
conference I met the staff from the Teacher At Sea Program<br />
and some former Teachers At Sea. Through meeting the<br />
staff and past participants, those old thoughts of Teacher At<br />
Sea came to the surface of my memory in short order. It was<br />
determined at that point, as soon as I returned to Ohio I would<br />
promptly apply for the Teacher at Sea; to my excitement, I<br />
was selected.<br />
As a participant in the Teacher at Sea, I was able to ride on<br />
a NOAA vessel and work as a volunteer on one of many<br />
fisheries surveys collecting data particular to that survey.<br />
The survey which I was lucky enough to have participated in<br />
was the shark long-line onboard the NOAA Ship OREGON<br />
II. During my two weeks at sea on the NOAA Ship OREGON<br />
II, I couldn’t help but think of all the correlations between<br />
Teacher At Sea and the GLOBE Program. It became clear<br />
why NOAA would take such a keen interest in the GLOBE<br />
Program <strong>by</strong> becoming one of its sponsors. This is outreach<br />
at its best!<br />
As stated earlier, I was lucky enough to go out on the shark<br />
long-line survey. This survey was established 18 years ago<br />
By Steven L. Frantz<br />
This photograph of an impressive anvil at sunset was<br />
taken <strong>by</strong> Steve Frantz off of the stern of the NOAA Ship<br />
OrEgON ii.<br />
and has become the standard as well as the prime example of<br />
how successful surveys should be run. To run a successful<br />
data collection survey, the methods and protocol must be<br />
consistent in order for the data to be used as a comparable<br />
over time. In other words, the benefits to standardizing the<br />
observer data collection procedures are essential to improve<br />
global assessments of various impacts. It is for this reason<br />
that since conception of the shark long-line survey, the hooks,<br />
bait, line test and hook increments as well as all other protocol<br />
has remained the same. This protocol is the same basis for<br />
the protocols set within the GLOBE Program and their data<br />
collection process. Over the programs life of 20 years,<br />
data collection protocols were developed to enhance and<br />
insure accuracy, quality and standardization. This guidance<br />
remains steadfast for all 112 countries that participate in the<br />
GLOBE Program.<br />
HANDS-ON<br />
It goes without saying that on a NOAA research survey you<br />
will be involved in hands-on learning. The researchers and<br />
crew gave you every opportunity to be as hands-on as your<br />
comfort level allows. Some of those experiences included<br />
touching the skin of a nurse shark, tagging a sand shark, and<br />
looking at a scalloped hammerhead shark eye to eye. This<br />
was and is hands-on learning at its best!<br />
As with my hands-on data collection experience with the<br />
NOAA survey, my students are also actively engaged in<br />
hands-on activities through the GLOBE program. Through<br />
the aforementioned protocols, my students develop a research<br />
7<br />
When All The Stars Align<br />
<strong>December</strong> <strong>2012</strong> ~ Mariners Weather Log
When All The Stars Align<br />
<strong>December</strong> <strong>2012</strong> ~ Mariners Weather Log<br />
8<br />
project, then collect data in order to ascertain whether their<br />
data supports their hypothesis or not. On any given day<br />
you could see my students outside (did I mention I was in<br />
the inner city?) collecting surface, soil or air temperature,<br />
snow depth, ozone, or measuring rainfall. During end-ofyear<br />
evaluations, the hands-on aspect of data collection for<br />
the GLOBE Program is a driving factor that captivates my<br />
students.<br />
PRESENTATION OF RESULTS<br />
At the conclusion of a trip, the Teacher at Sea Program<br />
required a presentation at a professional conference and to<br />
provide a couple of lesson plans which will be posted on the<br />
Teacher At Sea website. I also created a blog during my work<br />
on the OREGON II so that my students or anyone else could<br />
follow my day to day schedule of events as well as provide<br />
the ability for interaction. If you haven’t done so yet, please<br />
visit my blog. This blog had to be vetted <strong>by</strong> the Chief Scientist<br />
and X.O. (Executive Office) of the ship to insure accuracy.<br />
Check out my blog!<br />
http://teacheratsea.wordpress.com/<strong>2012</strong>/08/06/<br />
steven-frantz-critters-at-sea-august-5-<strong>2012</strong>/<br />
Teacher at Sea<br />
http://teacheratsea.wordpress.com/<br />
My students have requirements as well, they are expected to<br />
present their research projects at science fairs and professional<br />
conferences. Last year, my students had the opportunity to<br />
present their research at five different conferences. They<br />
also present annually at the SATELLITES Geospatial<br />
and Technology Conference. Last year they presented at<br />
the AmericaView Conference in Cleveland, Ohio. One of<br />
my students was selected to present at the Annual GLOBE<br />
Program Conference in Minneapolis, Minnesota. Attendees<br />
came from 26 different countries!<br />
DATA SHARING/WORKING FOR OTHERS<br />
I found it interesting that during my Teacher At Sea<br />
experience on the OREGON II, there was a list of scientists<br />
posted with requested data. Even though we were on a shark<br />
longline survey, there were requests for tissue from other fish,<br />
parasite samples and various data for sharks. I’m sure I only<br />
saw the tip of the iceberg when it comes to the amount of data<br />
shared both within and outside NOAA.<br />
With the GLOBE Program, my students have collected<br />
data for NASA, universities, and other GLOBE Program<br />
schools. All data collected is posted to the GLOBE Program<br />
website and is available for anyone to access. We have been<br />
to conferences where other students had used my students’<br />
data. The look of disbelief and excitement all rolled into<br />
one appeared on their faces when they come running to<br />
show me someone used their data for their project. We even<br />
had a Master’s Thesis sent to us where the author used data<br />
collected <strong>by</strong> my students. We were even mentioned in a<br />
college textbook on geospatial technologies published this<br />
year.<br />
CAREERS<br />
While on the OREGON II, I was reminded many times over<br />
to not only concentrate on the scientists, but to remember<br />
the rest of the crew. It would be hard to forget the crew of<br />
the OREGON II and an oversight to not mention them. It<br />
takes the entire ship of personnel to run the survey smooth<br />
and efficient. There are so many options for a career path in<br />
regards to the marine environment without even touching on<br />
becoming a biologist/scientist. Every one of them is essential;<br />
engineers, NOAA Corps Officers, the all powerful and very<br />
important “cook” and many more...you name it. While on<br />
the ship, I know they heard it from me first hand of how<br />
wonderful I thought they were….but now they will read how<br />
wonderful I think they are. In addition to careers on the ship, I<br />
should mention there are a wide variety of careers on shore in<br />
support of these surveys. I have barely scratched the surface.<br />
In today’s world, with the ever-growing use of geospatial<br />
technologies, teachers can go over a plethora of careers<br />
available to students using that technology as well. With the<br />
GLOBE Program at my school, science is now seen as cool<br />
and being a part of the GLOBE Program is akin to being a<br />
part of the “in crowd.” The more my students are involved,<br />
the more opportunities they see as viable options for their<br />
futures. NOAA and their policy to embrace outreach such<br />
as the Teacher at Sea Program significantly impacts the world<br />
of teaching and provides a tool for instructors like no other.<br />
Keeping learning real and relevant, getting involved within<br />
a structured framework for collaborative protocols and the<br />
opportunity to grow and expand with what you know and<br />
have learned is probably the most thrilling reason for being<br />
a teacher. My ability to participate in the Teacher at Sea<br />
program, on board the NOAA Ship OREGON II, definitely<br />
enhances my ability to guide and influence my students in<br />
a positive direction towards success…and in the mean time,<br />
the kids have fun!<br />
http://www.globe.gov/<br />
BIBLIOGRAPHY<br />
Shellito, B. <strong>2012</strong>. Introduction to geospatial technologies. W.<br />
H. Freeman and Co. New York.
PMO Corner:<br />
One step forward and two steps back!<br />
You may be asking yourself, “What<br />
does that old coot mean <strong>by</strong> that?” If<br />
you’ve met me, you’re probably saying<br />
to yourself “he didn’t take his medicines<br />
this morning”. Well, that could very<br />
well be true. Regardless, old coots such<br />
as I know a lot in the way of marine<br />
weather observing and this article deals<br />
with “going back” to “old known”<br />
successful ways of teaching weather<br />
observing and meteorology. So it’s not<br />
the lack of proper medication, it is “old<br />
coot” teaching style. You need to pay<br />
attention.<br />
After two dozen years in the United<br />
States Navy, you’d have thought I<br />
would have had enough of going to<br />
sea. This year, I sailed on the training<br />
ship, EMPIRE STATE with SUNY<br />
Maritime for 75 days. This year, as in<br />
the last three, Master Captain Richard<br />
Smith and I have taken those critical<br />
steps backwards, to ensure that the<br />
midshipmen are learning the basics of<br />
weather observing. We provided them<br />
with the opportunity of producing<br />
weather observations <strong>by</strong> hand using<br />
pencil, weather observing handbook<br />
No. 1 and the Weather Service Form<br />
By Tim Kenefick, NOAA – PMO – Charleston, SC<br />
B-81. Yes, that is two steps back in<br />
many people’s minds, but read on!<br />
Captain Smith, who has been the<br />
Master of the EMPIRE STATE<br />
since the year 2000, was a Marine<br />
Environmental Science major when<br />
he graduated. His interest in weather,<br />
especially the accuracy and timeliness<br />
of the observations, is high on his list<br />
of priorities. I’ve done my best to<br />
teach the students to do their surface<br />
observations and to utilize the computer<br />
to reduce the paperwork and improve<br />
their accuracy. When Captain Smith<br />
A good view of the training ship EMPirE STATE at gibraltar Naval Station. This photo was taken from the top of the rock!<br />
9<br />
pMO Corner<br />
<strong>December</strong> <strong>2012</strong> ~ Mariners Weather Log
pMO Corner<br />
<strong>December</strong> <strong>2012</strong> ~ Mariners Weather Log<br />
10<br />
PMO Tim Kenefick with Chief Baker, Cristina Zvoristaneau<br />
or I started asking the students about the different items of<br />
the weather observation, it became apparent that the average<br />
student was just punching buttons on the computer to “get the<br />
job done” without much understanding or thought behind the<br />
task. Three years ago Captain Smith recommended that we<br />
reverse the course on how the students observe record and<br />
transmit the OBS, because it would cause the cadets to have<br />
to “open the book and read”. In doing so, they search from<br />
front to back in the handbook for the single item in question,<br />
consequently learning observing practices that they didn’t<br />
know before. (Note I said BOOK and not Code Card. Code<br />
Cards are only suitable as a reminder for an experienced<br />
mate, but not for someone to learn with.).<br />
For the past three summer sea terms with SUNY Maritime<br />
that is how I have instructed the midshipmen. I have provided<br />
training and teaching, starting with the bare basics; using the<br />
long form (B-81). Has it been successful? I do so vouch for<br />
the positive aspects of it. They are basically forced to looking<br />
things up in the handbook and relearning things that they<br />
may have been taught in a prior class a year or two earlier.<br />
Reading and browsing the book makes retention and recall<br />
more probable. With practice, the cadets who take around<br />
an hour to initially produce a weather observation is reduced<br />
to a respectful 20 to 30 minutes.<br />
The rules were laid out early. The observation has to be<br />
checked over <strong>by</strong> the Mate of the Watch, Captain Smith, or I<br />
before the observation could be transmitted. There is always<br />
one cadet, who thinks they can do it all <strong>by</strong> themselves. One<br />
particular cadet sent an observation which indicated it was<br />
the 94th day in July, and the 52 nd hour of the day, among the<br />
grossest errors. For those special observations, I created the<br />
“Wall of Shame”. That particular observation made center<br />
stage indicated <strong>by</strong> the greatest amount of PINK highlighter.<br />
I also took the time to do a refresher for the Mates on Watch<br />
to ensure they understand what each part of the message<br />
means. Many haven’t done an observation in a couple of<br />
years, and although they understand weather and can identify<br />
everything, the coding is one thing that they hadn’t kept up<br />
with.<br />
Yes, it seems like it is a step back into the mid 90’s or even<br />
before. Often the older ways are a better way for the students<br />
to learn. I know it is akin to rote learning of multiplication<br />
tables as opposed to using a hand held calculator; but it is a<br />
proven method of success in learning. It causes the student to<br />
look things up and in doing so; he/she will course over other<br />
items which will subsequently be retained. When a cadet<br />
least expects it, they will recall an item from their browsing<br />
of the handbook and what a great boost of confidence and<br />
motivation! I observed this personally with some of the cadets<br />
on EMPIRE STATE, and with time they were better able<br />
to identify clouds, “read” the winds and waves, plus many<br />
other of the little things that go into a proper and complete<br />
weather observation. One thing I like to emphasize to all<br />
the students and mates taking weather observations, it is not<br />
like riding a bike. It is a learned practice, which requires<br />
repetition to do and do well. It is akin to shooting stars<br />
or sun lines. Even in these days with GPS systems, many<br />
Mates still perform celestial reductions to keep their abilities<br />
sharp. It is no different with weather observations. You<br />
have to practice observing daily. Taking time to look at the<br />
clouds and identify the types and height should be practiced<br />
daily. Mentally going over your present and past weather<br />
is helpful to keep sharp. While just sitting back on a beach<br />
and gazing over the surf, these practices keep you mindful.<br />
Remembering Buys Ballots Law as well as looking at the<br />
sky to determine where the low pressure is located in regards<br />
to your location, and the weather you are expecting in the<br />
scheme of things.<br />
For the mate at sea, weather reporting is part of the situational<br />
awareness while on watch. Today, with the reduced<br />
number of personnel on ships, the mate frequently has to<br />
multitask. This includes but not limited to; taking the weather<br />
observation, transmitting it on the INMARSAT “C” or via<br />
email, answering the radio, checking the radars, and plotting<br />
his position on the chart. This is usually done with no one<br />
else on the bridge, in the middle of the night. I know it takes<br />
time, but each weather observation is a valuable part in the<br />
big picture. Often it is one or two “at sea” observations which
may cause a forecaster to rethink an analysis and forecast<br />
in that specific area. Yes the earth’s surface is 70 percent<br />
water, but the weather observations received from ships are<br />
less than 5 percent of the surface observations at any one<br />
time. The ratio does not favor the mariner; only with better<br />
training and their understanding of the “how’s” and “why’s”<br />
of the observation can the puzzle be put together in order to<br />
make good sense of why taking the time to provide a weather<br />
observation matters. Part of the essential training should<br />
provide the cadet or Mate of how and why it fits into the big<br />
picture. I provide a good explanation of the surface analysis,<br />
then the follow-on steps of the forecasts. By doing so, it all<br />
comes together and supports the goal of the ship. Protecting<br />
life, property and commerce; giving the ship the prospect of<br />
arriving to their destination on time with no loss of cargo, and<br />
the safety and comfort of the crew under full consideration.<br />
When they can see how it all works, they start to take an<br />
interest in it.<br />
What is the step forward? The U.S. Voluntary Observing Ship<br />
Program has begun upgrading and improving the program.<br />
In the past, NOAA/NWS has been printing and distributing<br />
the observation manuals, (WSOH1) and the cost of this has<br />
risen almost exponentially. Cost of printing is one factor, but<br />
paper consumption and thinking “greener” is another. One<br />
thing I have learned is that many of the Maritime Academies<br />
as well as other colleges and universities, are looking to<br />
going to electronic books in the next few years. There were<br />
a few students I came across who had their complete set of<br />
Bowditch Tables electronically on their laptops, I-Pads and or<br />
Kindles. I even had one student who had the Weather Service<br />
Observing Handbook <strong>Number</strong> 1, on his I-PAD. All of our<br />
resources for marine observations are available on the VOS<br />
information website. Each of the maritime service academies<br />
will receive two copies of the WSOH1 it in PDF Format. The<br />
one is for them to download to a computer ashore, from which<br />
the students may acquire it for free. The other is for doing<br />
the same on the ship. I know this will cause the students to<br />
have better posture as it will be one to two pounds less for<br />
them to tote in their backpacks, plus they will have their own<br />
individual copy of the WSOH1 to do their “homework” with.<br />
Due to the size of the Dew Point Table, it is no longer included<br />
in the WS Observing Handbook <strong>Number</strong> 1. Bowditch does<br />
provide this table as well as the computation. These are easily<br />
obtained on-line and while using provided software such as<br />
SEAS or TurboWIN, these computations are done for you.<br />
Other than that, did I learn anything at sea this last summer?<br />
Oh yes, orcas, pilot whales, seals and porpoises don’t jump<br />
out of the water to take fish out of your hand in the open<br />
ocean, only at Sea World!<br />
18 NM off the northwest coast of iceland. Less than 5kts of wind and hardly a cloud in the sky. Air Temp 20C, Water 2C<br />
11<br />
pMO Corner<br />
<strong>December</strong> <strong>2012</strong> ~ Mariners Weather Log
Note<br />
<strong>December</strong> <strong>2012</strong> ~ Mariners Weather Log<br />
12<br />
A Note<br />
I want to start off <strong>by</strong> saying hello and thank you for all your<br />
support of the Voluntary Observing Ship (VOS) program.<br />
The program continues to be a great success thanks to all<br />
the mariners out there that are participating in the program.<br />
Through the years, the VOS program has been “numbers<br />
based”. In essence, you send a lot of observations, we award<br />
the ships accordingly. Awards and accolades have been given<br />
to the ships that have taken the most observations based on<br />
numbers alone. This was a very simple and objective way of<br />
distributing awards, prior to our abilities to scrutinize data<br />
quality.<br />
The “numbers” method was unfair to ships that had different<br />
and or limited sea time missions as they weren’t “underway”<br />
as often. Although their sea days were not so extensive,<br />
they were taking accurate observations religiously while<br />
underway. The “numbers” method of awards also inspired<br />
some friendly and sometimes not so friendly competition<br />
throughout the program, which in turn, has bolstered the<br />
numbers even higher. We were certainly happy about the<br />
results until we took a closer look at the data. We found<br />
that in the race for awards or recognitions some less than<br />
optimum results. It is these that I would like to bring to the<br />
reader’s attention.<br />
Some of the things we found may be construed as “cheating<br />
or gaming” the system. We found ships that were not only<br />
sending in the same observation over and over again….some<br />
were sending in the same observation every 10 minutes<br />
in an effort to increase their numbers. This unnecessary,<br />
unwarranted practice is a waste of resources and money.<br />
I know some of you are thinking, “Well the weather doesn’t<br />
change that much so it looks like we are sending the same<br />
observation every hour.” This leads me to my next issue…..<br />
an alarming number of ships have started to round off the<br />
observed values and report them to the nearest whole degree<br />
and whole millibar. This is not what the code requires and<br />
this may be the reason the observation “appears” to never<br />
change.<br />
Another issue we tend to see quite often is ships that have<br />
been issued a full complement of weather equipment <strong>by</strong> the<br />
PMO, but only report ships position and temperature. While<br />
this is useful information, it takes much less effort to do<br />
than ships that are taking a full coded observation. Regular<br />
incomplete observations don’t warrant a full complement of<br />
weather equipment.<br />
By John Wasserman<br />
The motto for our program has always been: Only YOU know<br />
the weather at your position. Report it at 0000, 0600, 1200,<br />
1800 UTC to NOAA’s National Weather Service. We have<br />
asked for accurate weather observations to be transmitted<br />
every six hours. Some of the ships have started taking<br />
observations every hour, this is great and we appreciate the<br />
extra effort! If you want to and have the time to transmit<br />
hourly observations and you can do so without sacrificing<br />
quality then we (of course) support that. Keep in mind that<br />
transmitting a poor observation can be more harmful than<br />
no data at all.<br />
Quality over quantity…as we press forward into 2013 we<br />
will be making some changes in how the ships observations<br />
are evaluated and how awards will be given out. Starting<br />
1/1/2013 Awards will not be solely based on number of<br />
observations; we will also be putting a great deal of emphasis<br />
on quality. In the past we have capped the number of awards<br />
at approximately 100…we will no longer do this. We believe<br />
as quality of observations go up; we will be able to distribute<br />
more awards to more deserving ships.<br />
We will be looking more closely at the following:<br />
How complete the observation is. (are all elements that can<br />
be observed, being observed?)<br />
Is the code being followed? Are elements such as pressure,<br />
temperature and dew point being taken and reported to the<br />
nearest tenth?<br />
The timeliness of the observation, we understand that<br />
some Sat-C systems are set up to transmit and receive only<br />
a few times a day, this will also be taken into consideration.<br />
But “attachments” in an email cannot be processed unless<br />
someone happens to grab the unprocessable files, notices<br />
that there is an attachment, extracts your “attachment” and<br />
resends it “properly”. Usually <strong>by</strong> then it is too late to even be<br />
used for model guidance. Sometimes those observations are<br />
received 2-4 hours late, sometimes even later.<br />
So to the observer…. There may be some bad habits that have<br />
developed as mentioned earlier in this missive that need to be<br />
broken. If you have any questions about the code or weather<br />
observations in general, feel free to contact your PMO or us<br />
at vos@noaa.gov. Also if you are interested in seeing what<br />
your ship is sending out and what can be done to improve<br />
the quality, again feel free to contact us. We are hoping to<br />
change the mindset of the entire US program and realize this<br />
may take time. We are happy to help in any way that we can.
Tribute: PMO ronald Douglas “randy”<br />
Sheppard<br />
Tribute: roger Bauer — 1939 to <strong>2012</strong><br />
Back in the dawn of time (oceanographically speaking)<br />
when the oceanographic community was beginning to<br />
evolve from analog to digital systems Roger Bauer created<br />
a company called Compass Systems. He along with the<br />
dedicated support of his long time colleague Margaret<br />
Robinson developed quality control, quality assurance and<br />
data processing techniques to digitize the huge Mechanical<br />
Bathythermograph data sets then being stored and archived<br />
<strong>by</strong> the U.S. Navy, NODC, many different countries and<br />
several large Oceanographic institutions. Those techniques<br />
are still in use today. That worked led to the creation of<br />
processes that related to developing and accessing databases<br />
for MBT, XBT and other marine observations. Because<br />
of that pioneering work large databases of surface and<br />
subsurface temperature data could be merged and used more<br />
effectively for spatial and long-term time series analysis<br />
that contributed immensely to ENSO (El Nino Southern<br />
Oscillation) and global climate change studies.<br />
It is with profound sadness that<br />
we announce the passing of Port<br />
Meteorological Officer, Randy<br />
Sheppard, who was an employee of<br />
Environment Canada for 32 years.<br />
Randy was one of the lucky ones who<br />
loved his job and he will be sorely<br />
missed.<br />
Roger was a great friend and cared about our projects and us.<br />
It was great to have a person on the “out side” to watch over<br />
us and tell us when we were about to do something really<br />
dumb or miss out on doing something smart and offer us a<br />
path back to logic.<br />
He was missed when he retired and will be missed even more<br />
now and he was a great fisherman.<br />
~ Steve Cook<br />
13<br />
Tribute<br />
<strong>December</strong> <strong>2012</strong> ~ Mariners Weather Log
ArCUS Clouds<br />
<strong>December</strong> <strong>2012</strong> ~ Mariners Weather Log<br />
14<br />
ArCUS Clouds<br />
Chief Mate, Cezary Poninski , of the M/V OCEAN GIANT<br />
took these impressive photos of an arcus cloud on April 9th<br />
<strong>2012</strong>, in the eastern part of the Black Sea. Thunderstorms<br />
are sometimes accompanied <strong>by</strong> an arcus cloud. There are<br />
two types of arcus clouds; a shelf cloud and a roll cloud.<br />
These types of clouds are usually associated with the leading<br />
edge of a thunderstorm outflow. Cold air rushes out of a<br />
downdraft and lifts warmer air in front of the storm complex<br />
up to condensation level, making both a fascinating and<br />
menacing sight while it is approaching at high velocity. In<br />
the absence of thunderstorms, this can be formed <strong>by</strong> outflows<br />
of cold air from a sea breeze. The photographs taken <strong>by</strong> C/M<br />
Poninski are of the “roll type” variety. A low, horizontal,<br />
tube shaped , and a relatively rare type of arcus cloud. The<br />
roll cloud, are a solitary wave called a “soliton”, which is a<br />
wave that has a single crest and moves without changing<br />
shape or speed.<br />
<strong>Photo</strong>s <strong>by</strong> Cezary Poninski<br />
Pictured is Bosun Joseph Casalino
ShiPWrECK: Montrose<br />
It was 50 years ago this past summer<br />
that a collision in the Detroit River<br />
sank the two year old British freighter<br />
MONTROSE. The vessel, on its fifth<br />
trip to the Great Lakes, settled on its<br />
side directly beneath the Ambassador<br />
Bridge that links Windsor, Ontario, and<br />
Detroit, Michigan.<br />
The saltwater ship, enroute from<br />
Marseilles, France, to Chicago, had<br />
just cleared the Detroit Terminal Dock<br />
when it met up with the barge ABL<br />
502, pushed <strong>by</strong> the tug B.H. BECKER.<br />
The barge was downbound and loaded<br />
with cement clinker when the accident<br />
occurred on July 30, 1962.<br />
MONTROSE, shown in the Welland<br />
Canal on May 13, 1961, thanks to a<br />
photo <strong>by</strong> Robert A. Zeleznik, sustained<br />
significant damage. It gradually settled<br />
and then rolled on its side in the busy<br />
waterway. All 41 on board were<br />
rescued.<br />
Refloating the sunken ship was essential<br />
and it was raised on November 9, 1962.<br />
During salvage operations an acetylene<br />
cutting torch set off an explosion of<br />
fumes in the hull and three workers<br />
were injured.<br />
The refloated freighter was towed to<br />
Toledo on November 19 and spent<br />
the winter at the shipyard undergoing<br />
repairs. It returned to service in<br />
the spring of 1963 as CONCORDIA<br />
By Skip Gillham<br />
LAGO. The ship was now owned <strong>by</strong><br />
Norwegian interests and operated under<br />
the flag of that country.<br />
The 440 foot long <strong>by</strong> 59 foot wide<br />
vessel left the Great Lakes and never<br />
returned. It later moved to Greek<br />
registry and then became the LAGO in<br />
1981. It cleared Colombo, Sri Lanka,<br />
on May 16, 1982, for the scrapyard at<br />
Gadani Beach, Pakistan, and work<br />
on dismantling the hull got underway<br />
there <strong>by</strong> Tawakkal Ltd. on November<br />
17, 1982.<br />
The tug B.H. BECKER dated from<br />
1918 and had been built at Buffalo, NY<br />
as C.C. CANFIELD. This ship became<br />
the JENNY LYNN in 1984 and is still<br />
around, although in perilous condition.<br />
The vessel sank at Cheboygan, MI<br />
on July 31, 2010, and, at this writing<br />
was still on the bottom while officials<br />
debated who was responsible to remove<br />
the hulk. JENNY LYNN (left) is<br />
shown on the bottom off Cheboygan in<br />
a photo <strong>by</strong> Jon Michaels.<br />
15<br />
Shipwreck<br />
<strong>December</strong> <strong>2012</strong> ~ Mariners Weather Log
Whale Sharks<br />
<strong>December</strong> <strong>2012</strong> ~ Mariners Weather Log<br />
16<br />
Whale Sharks<br />
In our April <strong>2012</strong> issue of the MWL, we featured an article on<br />
the observer-based whale shark research in the northern Gulf of<br />
Mexico. This past September, I received an email from the Noble Oil<br />
Platform, AMOS RUNNER, which included photographs of whale<br />
sharks along the rig. This rig is located in the prime area of research,<br />
SE from the mouth of the Mississippi River in the northern Gulf<br />
of Mexico. In addition, September approaches the timeframe that<br />
sightings of these magnificent creatures are uncommon and should<br />
be reported to provide data for the University of Southern Mississippi<br />
Gulf Coast Research Laboratory’s Whale Shark Sightings Survey.<br />
This prompted me to send out a reminder to all on the importance of<br />
reporting sightings as well as giving you all the contact information<br />
for quick reference to do so.<br />
To Report a Sighting:<br />
Please complete the survey at<br />
http://www.usm.edu/gcrl/whaleshark<br />
or email: whalesharksurvey@gmail.com<br />
Include:<br />
• Time and duration of encounter<br />
• Location (GPS coordinates)<br />
• Approximate size and number of individuals<br />
• Observed behavior<br />
• Associated species<br />
• If possible, photographs of the spot pattern behind left gills<br />
<strong>Photo</strong>s <strong>by</strong> Lloyd Marine, Barge Engineer for Noble Amos Runner<br />
A warm welcome to our newest<br />
Port Meteorological Officer Emma<br />
Steventon. Emma is the newest of<br />
the PMOS for the United Kingdom<br />
and her area of responsibility will<br />
encompass Edinburgh Scotland.<br />
her contact information can be<br />
found in the back of the MWL.<br />
Welcome Aboard Emma!!!
Storm Surges During hurricane isaac<br />
ABSTRACT:<br />
From August 27 through 30, <strong>2012</strong>, when Hurricane Isaac was<br />
over the Gulf of Mexico, storm surges occurred along most<br />
U. S. Gulf coast. It is shown that on the right-hand side of the<br />
storm track from Florida to the mouth of Mississippi River,<br />
positive surges or setups prevailed whereas from southwest<br />
coast of Louisiana to the upper Texas coast, negative surges<br />
or set-downs occurred. It is found that these surges can<br />
be explained physically <strong>by</strong> the wind stress forcing or the<br />
wind speed squared. Verifications of these relationships<br />
indicate that the correlation coefficient for the setup is 0.97<br />
in the Mississippi Sound and for the set-down 0.84 along<br />
the southwest coast of Louisiana, respectively. Examples for<br />
using these formulas are provided.<br />
1. Introduction<br />
For a category one hurricane, Isaac was a large and slowmoving<br />
tropical cyclone. The size of Isaac near its landfall<br />
is shown in Fig. 1. From August 27 through 30, <strong>2012</strong>, storm<br />
surges produced <strong>by</strong> Isaac could be felt along the U. S. Gulf<br />
of Mexico coast from Florida to Texas. The purposes of this<br />
study are first to characterize these surges along the open<br />
coast, and then to provide some physical explanation for the<br />
reasons for these surges. Since there are many ports along the<br />
Gulf coast, knowledge of storm surge caused <strong>by</strong> a tropical<br />
cyclone should be useful. Meteorological and Oceanographic<br />
(met-ocean) data used in this study are available online from<br />
National Data Buoy Center (NDBC) and National Ocean<br />
Service (NOS).<br />
2. Storm Surges along the Coast<br />
Storm surges consist of positive (setup) and/or negative<br />
(set-down) surge. When the water level at the shoreline is<br />
rising (or lowering), we say the surge is positive (or negative).<br />
Examples of setup or set-down in New York Harbor during<br />
Hurricane Irene in 2011 are provided in the August issue of<br />
this journal <strong>by</strong> Hsu (<strong>2012</strong>).<br />
Figs. 2 and 3 show the met-ocean data analyses for storm<br />
surges at Naples, FL during Isaac (for station location of<br />
NPSF1, see www.ndbc.noaa.gov). Note that the storm surge<br />
is represented <strong>by</strong> the green and the storm tide <strong>by</strong> red. It is<br />
clear that when the wind blew from land to the sea, set-down<br />
occurred. On the other hand, setup prevailed when the wind<br />
blew from sea to the land. According to Hsu (<strong>2012</strong>), both<br />
setup and set-down are related to the wind stress which can<br />
be represented <strong>by</strong> the wind speed squared. This can be seen<br />
that when the weaker wind blew from land to the sea, the<br />
By Professor S. A. Hsu, Coastal Studies Institute, Louisiana State University<br />
Email: sahsu@lsu.edu<br />
set-down (approximately 2 ft.) is smaller than setup (about 4<br />
ft.) because of stronger onshore wind.<br />
Storm surge and wind characteristics at Pensacola, FL<br />
(NDBC Station PCLF1) are shown in Figs. 4 and 5,<br />
respectively. It is seen that while the set-down was only 0.5 ft.,<br />
Fig.1. hurricane isaac near its landfall in Louisiana<br />
(image courtesy of the Earth Scan Lab at Louisiana State<br />
University, see www.esl.lsu.edu).<br />
17<br />
hurricane isaac<br />
<strong>December</strong> <strong>2012</strong> ~ Mariners Weather Log
hurricane isaac<br />
<strong>December</strong> <strong>2012</strong> ~ Mariners Weather Log<br />
18<br />
there were 3.5 ft. setups. Since the local<br />
wind speed did not exceed 20 knots, the<br />
over-water wind speed further offshore<br />
must be higher.<br />
Because of the storm track and the<br />
geographic setting of Mississippi Sound<br />
and surrounding waters, both Stations at<br />
WYCM6 and SHBL1 experienced high<br />
wind speeds and storm surges as shown<br />
in Figs.6 through 9.<br />
Fig.6 shows that there were<br />
approximately 8 ft. positive surge and<br />
10 ft. storm tides at Bay Waveland Yacht<br />
Club, MS. At Shell Beach, LA, both<br />
positive surge and storm tides were<br />
11 ft. (Fig.8). During the period from<br />
August 27 through 30 when Isaac was<br />
over the Gulf of Mexico, there were no<br />
set-down or negative surges measured<br />
at WYCM6 and SHBL1. At WYCM6,<br />
the wind speed and gust were over 45<br />
and 55 knots, respectively (Fig.7), and<br />
at SHBL1, they were 55 and 70 knots,<br />
respectively (Fig.9). Note that these<br />
positive surges can propagate into<br />
near<strong>by</strong> Lake Pontchartrain and Lake<br />
Maurepas. They can also block or<br />
prohibit the drainage of large runoff due<br />
to heavy rainfall from many streams.<br />
This phenomenon can cause widespread<br />
coastal flooding.<br />
Characteristics of storm surges, wind<br />
speed and direction, wind gust, and<br />
atmospheric pressure near the center of<br />
Isaac are provided in Figs.10 through 12<br />
for PSTL1 and Figs.13 through 15 for<br />
GISL1, respectively. Notice that during<br />
the passage of the center, wind direction<br />
changed swiftly from northerly to<br />
southerly. At the same time, wind<br />
speed decreased and then increased<br />
rapidly. Storm surge and storm tide<br />
peaked approximately 3.8 ft. and 4.5 ft.,<br />
respectively. Similar condition occurred<br />
at Grand Isle, LA, where storm surge<br />
and storm tide reached 4.2 and 5.7 ft.,<br />
respectively. Note that the minimum<br />
sea-level pressure was 970 millibar<br />
(mb) at both locations. Note also that<br />
at both locations, the sustained wind<br />
speed and gust reached 60 and 80 knots,<br />
respectively.<br />
Fig.2. Storm surges at Naples, FL during isaac.<br />
Fig.3.Wind direction, speed, and wind gust at Naples, FL during isaac.<br />
Fig.4. Storm surges at Pensacola, FL during isaac.
Fig.5. Wind direction, speed, and wind gust at Pensacola, FL during isaac.<br />
Fig.6. Storm surges at Bay Waveland Yacht Club, MS during isaac.<br />
Fig.7. Wind direction, speed, and wind gust at Bay Waveland Yacht Club, MS<br />
during isaac.<br />
Because the track of Isaac in the Gulf<br />
of Mexico is approximately straight<br />
line between Florida Strait and the<br />
mouth of Mississippi River (see Fig.1),<br />
the coastal region west of this track<br />
should experience negative surge or<br />
set-down. This phenomenon is shown<br />
in Figs.16 and 18 for Freshwater<br />
Canal Locks (FRWL1), LA and<br />
Galveston Bay Entrance (GNJT2),<br />
TX respectively. Notice that setdowns<br />
prevailed when the wind blew<br />
persistently from land toward the sea<br />
prior to Isaac’s landfall.<br />
3. Physical Explanations<br />
According to Hsu et al (1997), the<br />
setup (S) is related to wind<br />
Stress, fetch along the wind direction,<br />
water depth along the fetch, and<br />
others. They found that for rapid<br />
estimation of S, the most important<br />
contribution is the wind stress such<br />
that<br />
S = K V^2 (1)<br />
Where K is a coefficient and V is the<br />
wind speed.<br />
During Hurricane Irene in 2011,<br />
Equation (1) was verified <strong>by</strong> Hsu<br />
(<strong>2012</strong>) for operational applications.<br />
Similarly, in order to estimate the<br />
storm surges induced <strong>by</strong> Isaac, Figs.20<br />
and 21 are provided. The positive<br />
surge or setup is based on the metocean<br />
data at SHBL1 since the highest<br />
water-level rise was recorded at this<br />
station as shown in Fig.20. Notice<br />
that 6-minute met-ocean datasets<br />
from 8:54 LST on August 27 through<br />
23:36 on August 28 are employed for<br />
this analysis (see Fig.20). The negative<br />
surge is based on FRWL1 where the<br />
lowest water level occurred. Again,<br />
6-minute datasets from 20:06LST<br />
on August 28 through 12:54 on 29<br />
August are used for this analysis as<br />
provided in Fig.21. The relationship<br />
between set-down and the wind stress<br />
is illustrated in Fig.21 as an example.<br />
It is found that from Figs.20 and<br />
21over 90 per cent of the variation for<br />
setup and 70 % for set-down can be<br />
19<br />
hurricane isaac<br />
<strong>December</strong> <strong>2012</strong> ~ Mariners Weather Log
hurricane isaac<br />
<strong>December</strong> <strong>2012</strong> ~ Mariners Weather Log<br />
20<br />
explained <strong>by</strong> the contribution of wind<br />
stress which can be represented <strong>by</strong><br />
the wind speed squared. These results<br />
are very similar to those found during<br />
Irene when it affected the New York<br />
Harbor proper as provided in Hsu<br />
(<strong>2012</strong>). Therefore, for operational<br />
applications, we have, for positive<br />
surge or setup,<br />
S = 0.0041 V^2 (2)<br />
With R^2 = 0.93 or the correlation<br />
coefficient R = 0.97,<br />
Whereas, for negative surge or<br />
set-down,<br />
S = - 0.0029 V^2 (3)<br />
With R^2 = 0.71 or R = 0.84.<br />
The unit for S is in feet and V in<br />
knots.<br />
4. Conclusions<br />
Characteristics of the storm surge<br />
along the U.S. Gulf of Mexico coast<br />
during Hurricane Isaac in <strong>2012</strong> have<br />
been analyzed. It is shown that, in<br />
general, on the right-hand side of the<br />
storm track or east of the Mississippi<br />
River Delta, positive surge or setup<br />
prevailed. Negative surge or set-down<br />
occurred mainly on the left-hand<br />
side or west of the track as expected.<br />
However, it is surprising to find that<br />
the correlation coefficient between<br />
setup and the wind stress is 97%<br />
and that between set-down and the<br />
wind stress is 84%. If one accepts<br />
these high correlation coefficients,<br />
equations provided in Figs.20 and<br />
21 should be useful for operational<br />
applications. However, since<br />
storm surges are mainly localized<br />
phenomena, caution should be used<br />
to extend these equations beyond its<br />
general location.<br />
Fig.8. Storm surges at Shell Beach, LA during isaac.<br />
Fig.9. Wind direction, speed, and wind gust at Shell Beach, LA during isaac.<br />
Fig.10. Storm surges at Pilots Station East, SW Pass, LA during isaac.
Fig.11. Wind direction, speed, and wind gust at Pilots Station East, SW pass,<br />
LA during isaac.<br />
Fig.12. Atmospheric pressure reading at Pilots Station East, SW Pass, during<br />
isaac.<br />
Fig.13. Storm surges at grand isle, LA during isaac.<br />
Acknowledgments:<br />
Many thanks go to NDBC and NOS of<br />
NOAA for providing essential<br />
Datasets needed for this study.<br />
References:<br />
Hsu, S. A., J.M. Grymes, III, and Z.<br />
Yan, 1997: A simplified<br />
hydrodynamic formula for estimating<br />
the wind-driven flooding<br />
in the Lake Pontchartrain-Amite River<br />
Basin, National Weather<br />
Digest, Vol. 21, No.4, pp.18-22.<br />
Hsu, S. A. <strong>2012</strong>: Storm surges in<br />
New York Harbor during Hurricane<br />
Irene. Mariners Weather Log, vol.,<br />
<strong>56</strong>, number 2, pp.7-11, August <strong>2012</strong>,<br />
available online at www.vos.noaa.gov/<br />
mwl.shtml.<br />
21<br />
hurricane isaac<br />
<strong>December</strong> <strong>2012</strong> ~ Mariners Weather Log
hurricane isaac<br />
<strong>December</strong> <strong>2012</strong> ~ Mariners Weather Log<br />
22<br />
Fig.14. Wind direction, speed, and wind gust at grand isle, LA during isaac.<br />
Fig.15. Atmospheric pressure reading at grand isle, LA during isaac.<br />
Fig.16. Storm surges at Freshwater Canal Locks, LA during isaac.
Fig.17. Wind direction, speed, and wind gust at Freshwater Canal Locks, LA<br />
during isaac.<br />
Fig.18. Storm surges at galveston Bay Entrance, TX during isaac.<br />
Fig.19. Wind direction, speed, and wind gust at galveston Bay Entrance, TX<br />
during isaac.<br />
23<br />
hurricane isaac<br />
<strong>December</strong> <strong>2012</strong> ~ Mariners Weather Log
Marine Debris Update<br />
<strong>December</strong> <strong>2012</strong> ~ Mariners Weather Log<br />
24<br />
Marine Debris Update<br />
The NOAA Marine Debris Program continues to request<br />
reports of at-sea and shoreline sightings of suspected Japan<br />
tsunami marine debris to DisasterDebris@noaa.gov. All<br />
reports are catalogued <strong>by</strong> Marine Debris Program staff, with<br />
significant sightings being shared with the proper response<br />
agency. During September <strong>2012</strong>, the Marine Debris Program<br />
received 17 total reports, seven of which were reports of items<br />
floating at sea.<br />
A floating dock that was spotted <strong>by</strong> some fishermen off the coast of Molokai, hawaii.<br />
By Anna Manyak
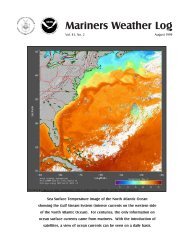
<strong>Photo</strong>graphs of interest<br />
This photo was taken on the NOAA ShiP gOrDON gUNTEr, August 29, <strong>2012</strong> at 6pm off the coast of Texas<br />
(28 degrees 30 'N -094 degrees 30'W) During hurricane isaac event.<br />
<strong>Photo</strong> <strong>by</strong> <strong>Denice</strong> <strong>Drass</strong>, Marine Biologist, Pascagoula Marine Fisheries Laboratory.<br />
The Suomi NPP Satellite caught this image of hurricane Sandy October 25, just as it passed over Cuba.<br />
Credit: NOAA/NASA/gSFC/SuomiNPP<br />
25<br />
<strong>December</strong> <strong>2012</strong> ~ Mariners Weather Log
Mean Circulation<br />
<strong>December</strong> <strong>2012</strong> ~ Mariners Weather Log<br />
26<br />
Mean Circulation highlights and Climate<br />
Anomalies<br />
May through August <strong>2012</strong><br />
All anomalies reflect departures from the 1981-2010 base<br />
period.<br />
May-June <strong>2012</strong><br />
May 500-hPa heights were above-average over the eastern<br />
North Pacific Ocean middle latitudes, the Canadian<br />
Archipelago, the Davis Strait, from northeastern North<br />
America to the North Atlantic Ocean just south of Greenland,<br />
and over Russia and eastern Siberia. Below-average heights<br />
were observed over Alaska, the eastern North Atlantic Ocean,<br />
the Greenland Sea, and the Taimyr Peninsula Figure 1. The<br />
sea-level pressure (SLP) pattern mirrors the 500-hPa pattern.<br />
Figure 2.<br />
June 500-hPa heights were above-average from the Bering<br />
Sea southward to about 35 0 N, from Labrador to Greenland,<br />
over north-central Russia and the Kara Sea, and from the<br />
Caspian and Black Seas westward across the Mediterranean<br />
Sea. Below-average heights ran from northern Europe across<br />
the northern North Atlantic Ocean Figure 3. The SLP pattern<br />
featured a high over much of the eastern Arctic with an<br />
elongated low to the south. Figure 4.<br />
The Tropics<br />
Near-average sea surface temperature (SST) across the central<br />
and east-central equatorial Pacific heralded ENSO-neutral<br />
conditions continued during May-June. SSTs in the eastern<br />
equatorial Pacific continued to be warmer-than-average.<br />
The depth of the 20C isotherm (thermocline) remained<br />
near-average in the east-central equatorial Pacific and aboveaverage<br />
in the eastern equatorial Pacific. Equatorial low-level<br />
easterly winds remained slightly above-average over the<br />
central and west-central equatorial Pacific. Enhanced<br />
convection was seen across Indonesia.<br />
July-August <strong>2012</strong><br />
The 500-hPa circulation pattern during July <strong>2012</strong> featured<br />
below-average heights from the British Isles across the<br />
Norwegian, Barents, Kara, Laptev, East Siberian and Chukchi<br />
By Ed O’Lenic, Meteorologist, Chief, Operations Branch,<br />
Climate Prediction Center NCEP/NWS/NOAA<br />
Seas. This region was bounded on either side <strong>by</strong> anomalously<br />
high heights over northern sections of the Eastern Hemisphere<br />
and North America Figure 5. The sea-level pressure and<br />
anomaly map (Figure 6) shows a similar surface low feature,<br />
but with less extensive high pressure features.<br />
The month of August was characterized <strong>by</strong> above-average<br />
heights over the Eastern Arctic, west-central North America,<br />
the northwestern North Pacific Ocean, and sections of<br />
southern Europe and central Russia Figure 7. The SLP<br />
and anomaly field (Figure 8) largely mirrored the middle<br />
tropospheric circulation pattern.<br />
Severe weather and climate<br />
May: CONUS snow cover 3 rd smallest on record; northwest<br />
Oregon’s wettest spring on record; tropical storms Alberto<br />
and Beryl affected southeastern CONUS; the Whitewater-<br />
Baldy Fire burned 210,000 acres, New Mexico’s largest<br />
fire-ever; Alaska spring temperatures were 2.7 0 F cooler<br />
than normal, seasonal precipitation was 10.5 percent above<br />
average; Hawaiian Islands drought area rose (Reference 1).<br />
June: Drought spread, intensified over central CONUS,<br />
wildfires destroyed homes in Colorado and Wyoming, and<br />
contributed to a derecho moving quickly from Illinois to<br />
Virginia, knocking out power to 3.4 million; tropical storm<br />
Deb<strong>by</strong> dropped 12+ inches of rain in Florida.(Reference 2).<br />
July: Alaska’s wettest on record; near-record low flow in the<br />
lower Mississippi River; active monsoon in the Southwest;<br />
63% of CONUS in drought; Long Draw Fire burns <strong>56</strong>0,000<br />
acres in eastern Oregon, that state’s largest fire since 1840s<br />
(Reference 3).<br />
August: 63% of CONUS in drought; Wyoming and<br />
Colorado’s warmest summer-ever; Wyoming and Nebraska’s<br />
driest summer; 3.6 million acres burned in western and<br />
central CONUS, an August record; Hurricane Isaac hits<br />
Louisiana with up to 20 inches of rain/flooding (Reference 4).<br />
The Tropics<br />
ENSO-neutral conditions continued during July and August
<strong>2012</strong>. Sea surface temperature (SST)<br />
anomalies increased across the central and<br />
east-central equatorial Pacific, and SSTs<br />
in the eastern equatorial Pacific remained<br />
warmer-than-average during the period.<br />
The depth of the 20C isotherm (thermocline)<br />
remained near-average in the east-central<br />
equatorial Pacific and above-average in the<br />
eastern equatorial Pacific. Equatorial lowlevel<br />
easterlies were slightly enhanced over<br />
the west-central equatorial Pacific and weaker<br />
than average across the east-central equatorial<br />
Pacific.<br />
REFERENCES<br />
1. http://www.ncdc.noaa.gov/sotc/<br />
national/<strong>2012</strong>/5<br />
2. http://www.ncdc.noaa.gov/sotc/<br />
national/<strong>2012</strong>/6<br />
3. http://www.ncdc.noaa.gov/sotc/<br />
national/<strong>2012</strong>/7<br />
4. http://www.ncdc.noaa.gov/sotc/<br />
national/<strong>2012</strong>/8<br />
Much of the information used in this article<br />
originates from the Climate Diagnostics<br />
Bulletin archive:<br />
(http://www.cpc.ncep.noaa.gov/products/<br />
CDB/CDB_Archive_html/CDB_archive.<br />
shtml)<br />
Caption for 500 hPa heights and<br />
Anomalies: Figures 1,3,5,7<br />
Northern hemisphere mean and<br />
anomalous 500-hPa geopotential height<br />
(CDAS/reanalysis). Mean heights are<br />
denoted <strong>by</strong> solid contours drawn at an<br />
interval of 6 dam. Anomaly contour interval<br />
is indicated <strong>by</strong> shading. Anomalies are<br />
calculated as departures from the 1981-<br />
2010 base period monthly means.<br />
Caption for Sea-Level Pressure and<br />
Anomaly: Figures 2,4,6,8<br />
Northern hemisphere mean and<br />
anomalous sea level pressure (CDAS/<br />
reanalysis). Mean values are denoted <strong>by</strong><br />
solid contours drawn at an interval of 4<br />
hPa. Anomaly contour interval is indicated<br />
<strong>by</strong> shading. Anomalies are calculated<br />
as departures from the 1981-2010 base<br />
period monthly means.<br />
Figure 1<br />
Figure 3<br />
Figure 5<br />
Figure 7<br />
Figure 2<br />
Figure 4<br />
Figure 6<br />
Figure 8<br />
27<br />
Mean Circulation<br />
<strong>December</strong> <strong>2012</strong> ~ Mariners Weather Log
Tropical Atlantic and Tropical east pacific Areas<br />
<strong>December</strong> <strong>2012</strong> ~ Mariners Weather Log<br />
28<br />
Tropical Atlantic and Tropical East Pacific Areas<br />
May through August <strong>2012</strong><br />
Pre and Post Deb<strong>by</strong> Gale Events<br />
Prior to the development of Tropical Storm Deb<strong>by</strong>, TAFB<br />
issued a gale warning at 1200 UTC 23 Jun for 6 hours in<br />
association with Deb<strong>by</strong>’s precursor low in the eastern portion<br />
of the Gulf of Mexico. Figure 1 shows the high resolution<br />
(12.5 km) Met-Op ASCAT scatterometer wind retrieval from<br />
1600 UTC 23 June overlaid onto visible satellite imagery<br />
from that morning. During this pre-tropical cyclone phase of<br />
Deb<strong>by</strong>, the low was rather broad, a pattern not too often seen<br />
in the Gulf of Mexico portion of TAFB’s marine domain. The<br />
large wind field associated with the broad low was confined<br />
By Jorge Aguirre-Echevarria and Dan Mundell<br />
Tropical Analysis and Forecast Branch,<br />
National Hurricane Center, Miami, Florida,<br />
NOAA National Centers for Environmental Prediction<br />
Table 1. Non-tropical cyclone warnings issued for the subtropical and tropical Atlantic Ocean,<br />
including the Gulf of Mexico and Caribbean Sea between 1 May and 31 August <strong>2012</strong>.<br />
Onset Region<br />
Peak Wind<br />
Speed<br />
Gale<br />
Duration<br />
Weather Forcing<br />
00 UTC 23 Jun gulf of Mexico 35 kt 24 hr Low<br />
12 UTC 27 Jun SW N Atlantic 35 kt 12 hr Low<br />
12 UTC 28 Jun Caribbean Sea 35 kt 6 hr Pressure gradient<br />
Figure 1. Visible satellite imagery with high resolution<br />
ASCAT winds from around 1600 UTC 23 Jun showing<br />
minimal gale force winds (red flags) in the eastern<br />
semicircle of the pre-tropical cyclone Deb<strong>by</strong> gale center.<br />
Note the light winds near and around the elongated center.<br />
to the eastern semicircle where the ASCAT pass confirmed<br />
these winds. This is also where the deep convection,<br />
far removed from the system center, was located. These<br />
characteristics defined the low as a rather disorganized hybrid<br />
system, similar to systems of monsoon origin more common<br />
in the West Pacific basin. With the low characterized as such,<br />
the Dvorak (Dvorak, 1984) classification technique used to<br />
estimate the intensity of tropical cyclones based on satellite<br />
imagery was applied with difficulty. With deep convection<br />
and gale force winds far removed from the center, winds<br />
near and at the center were rather light adding to the unique<br />
aspect of the broad low. The ship Carnival Destiny (C6FN4)<br />
happened to be sailing from northwest to southeast across<br />
the Gulf during the period the gale warning was in effect.<br />
The ship was very instrumental in providing vital wind data<br />
during this time with reports of 37 kts in the overnight hours<br />
of 22 Jun with a peak wind gust of 37 kts near 27N92W and<br />
winds of 30-35 kts near 22N86W at 1200 UTC 23 Jun. In<br />
addition, the ship Overseas Houston (WWAA) reported a<br />
peak gust of 39 kts near 28N85W at 1800 UTC 23 Jun and 37<br />
kts near 27.5N84.5W at 2300 UTC 23 Jun. Quality control of<br />
these ship reports indicated that they were a few kts too high.<br />
The 12 UTC 23 Jun NWS Unified Surface Analysis (USA)<br />
shown in (Figure 2) clearly depicted the broad cyclonic<br />
circulation associated with the low. By 2100 UTC 23 Jun<br />
the broad structured low was upgraded to Tropical Storm<br />
Deb<strong>by</strong>. Once Deb<strong>by</strong> moved northeastward across northcentral<br />
Florida and into the far northwest portion of TAFB’s<br />
Atlantic Ocean domain near 29N78W on 27 Jun it was<br />
downgraded to a post-tropical low at 2100 UTC that same<br />
day as it no longer qualified to be classified as a tropical<br />
system (Figure 3). However, a tight enough pressure gradient
to the northeast and east of the post-tropical cyclone low was<br />
enough to allow for gale force winds of 30-35 kts to materialize<br />
in those quadrants as a low level baroclinic zone had begun<br />
to impact it. The gale force winds lasted through 0600 UTC<br />
28 Jun in TAFB’ s Atlantic forecast area of responsibility<br />
(AOR), at which time the gale warning was lowered. The ship<br />
Carnival Fascination (C6FM9) near 27N79W along with<br />
ship Veracruz Express (ZCDJ2) just north of the area near<br />
32N69.5W made several reports of gale force winds, in the<br />
general range of 30-35 kts just prior to 2100 UTC on 27 Jun.<br />
The following morning, the oceanographic research ship,<br />
NOAA Pisces (WTDL) made a few reports of 30 to 35 kts<br />
near 26N72W just prior to the low undergoing weakening as<br />
it became more involved with the low level baroclinic zone.<br />
The low continued to track northeastward, and was north of<br />
the forecast area near 32N73W <strong>by</strong> 1200 UTC 28 Jun (Figure<br />
4) with winds down to 30 kts as it became more involved with<br />
the cold front associated with the low level baroclinic zone.<br />
Figure 2. National Weather Service USA from 1200 UTC<br />
23 Jun <strong>2012</strong> showing the pre-Deb<strong>by</strong> low pressure system.<br />
Figure 3. National Weather Service USA from 1200 UTC<br />
27 Jun <strong>2012</strong> showing the post-tropical cyclone.<br />
Figure 4. National Weather Service USA from 1200 UTC<br />
28 Jun depicting low pressure, formerly the post tropical<br />
gale low, involved with the surface cold front.<br />
Caribbean Sea Gale Event<br />
There was only one very short-lived Southwest Caribbean Sea<br />
gale event that commenced on 12 UTC Jun 28 in the favorable<br />
climatological area of strongest trade winds found in the SW<br />
sector of the Caribbean Sea south of 14N to the coasts of<br />
Colombia and northwestern Venezuela. This particular event<br />
was confined to between 73W and 76W. The tight pressure<br />
gradient between high pressure over the sub-tropics and low<br />
pressure across the Colombian basin initiated NE to E 30-35<br />
kts winds across that region of the Caribbean. An observation<br />
from the freighter ship Demeter (A8KM6) located near the<br />
coast of Colombia reported northeast winds of 35 kts at 18<br />
UTC Jun 28 (Figure 5). The gale winds diminished to below<br />
gale force just after 18 UTC on the same day as the pressure<br />
gradient weakened due to the high pressure breaking down<br />
in response to the eastward advancement of the post gale low<br />
from former Tropical Storm Deb<strong>by</strong>, and an associated cold<br />
front over the northwest part of the TAFB’s Atlantic forecast<br />
area.<br />
Figure 5. National Weather Service USA valid at 1800 UTC<br />
28 Jun. Note the 35 kt wind observation from the ship<br />
Demeter ( A8KM6) near the coast of Colombia.<br />
29<br />
Tropical Atlantic and Tropical east pacific Areas<br />
<strong>December</strong> <strong>2012</strong> ~ Mariners Weather Log
Tropical Atlantic and Tropical east pacific Areas<br />
<strong>December</strong> <strong>2012</strong> ~ Mariners Weather Log<br />
30<br />
Table 2. Non-tropical cyclone warnings issued for the subtropical and tropical eastern North Pacific<br />
between 1 May and 31 August <strong>2012</strong>.<br />
Onset Region<br />
Peak Wind<br />
Speed<br />
Gale Duration Weather Forcing<br />
0300 UTC 14 May Gulf of Tehuantepec 40 kt 15 hr Pressure Gradient<br />
0300 UTC 22 May Gulf of Tehuantepec 40 kt 12 hr Pressure Gradient<br />
Eastern North Pacific Ocean<br />
Gales and significant wave events are almost exclusively<br />
attributed to tropical systems across the tropical eastern<br />
North Pacific during the summer months. Two significant<br />
non-tropical warning events were documented primarily<br />
<strong>by</strong> scatterometer data due to the lack of supporting ship<br />
observations in the May through August <strong>2012</strong> time period.<br />
Table 2 provides details on these brief gale events.<br />
Late Season Gulf of Tehuantepec Gales<br />
Gulf of Tehuantepec cold season wind events typically end<br />
<strong>by</strong> the first week of April. However, in mid May <strong>2012</strong>, there<br />
were two occurrences of unusually strong late season winds<br />
that briefly surged to gale force lasting 15 hours or less.<br />
Typical cold season Gulf of Tehuantepec wind events are<br />
initiated <strong>by</strong> strong northerly winds across the western Gulf of<br />
Mexico. This strong flow, which advects cold air southward,<br />
is supported <strong>by</strong> a steep pressure gradient between strong high<br />
pressure over Mexico or southern Texas and lower pressure<br />
over the Pacific Ocean south of Mexico. Funneling of the<br />
wind from the Gulf of Mexico into the eastern North Pacific<br />
Ocean is due to terrain variations over southern Mexico, and<br />
is most pronounced across the Isthmus of Tehuantepec. These<br />
events were atypical due to the existence of a broad area of<br />
low pressure associated with an active early season monsoon<br />
trough in the eastern North Pacific Ocean, which helped<br />
initiate two tropical cyclones in May (Tropical Storm Aletta<br />
and Hurricane Bud). As a result, moderate high pressure over<br />
southern Texas around 1020 hPa created enough of a pressure<br />
gradient across the region in each case to initiate gale force<br />
winds surging into the Gulf of Tehuantepec.<br />
The first gale event commenced around 0300 UTC May 14th.<br />
A ridge of high pressure west of a cold front in the central<br />
Gulf of Mexico extended southward from a 1024 hPa high<br />
in Texas along the east coast of Mexico, while a weak trough<br />
was located over the Bay of Campeche and a broad monsoon<br />
trough was across the eastern North Pacific (Figure 6). In<br />
the early morning hours of May 14th, winds increased to 20<br />
kts at Salina Cruz.<br />
Figure 6. National Weather Service Unified Surface<br />
Analysis (USA) chart from 1800 UTC 13 May <strong>2012</strong>,<br />
centered on southern Mexico and Central America.<br />
Moderate high pressure was building into southern<br />
Mexico, toward the Isthmus of Tehuantepec.<br />
An Advanced Scatterometer (ASCAT) pass at 0310 UTC<br />
showed an unexpected increase in surface winds compared<br />
to the previous pass, with a narrow swath of 35 kts. Based on<br />
these data, a gale warning was immediately issued (Figure<br />
7). An Oceansat-2 Scatterometer (OSCAT) pass nearly 3<br />
hours later indicated peak winds of 40 kts in the Gulf of<br />
Tehuantepec (Figure 8), while a subsequent ASCAT pass<br />
at 1542 UTC showed winds had fallen below gale force,<br />
but strong to near-gale winds extending more than 200 km<br />
downstream from the Isthmus of Tehuantepec (Figure 9).<br />
This anticyclonically curved plume of high winds eventually<br />
became entrained into the north semicircle of the circulation<br />
associated with Tropical Storm Aletta.<br />
Figure 7. ASCAT wind retrieval from 14 May <strong>2012</strong> at 0310<br />
UTC shows the onset of gale force winds over the Gulf of<br />
Tehuantepec.
Figure 8. OSCAT wind retrieval from 14 May <strong>2012</strong> at<br />
0551 UTC shows peak winds of 40 kts in the gulf of<br />
Tehuantepec.<br />
Figure 9. ASCAT wind retrieval from 14 May <strong>2012</strong> at<br />
1542 UTC shows a large area of 25 to 30 kts extending<br />
downstream from the Gulf of Tehuantepec in response to<br />
the gale wind event earlier in the day.<br />
The second gale event was similar in many respects to the one<br />
a week earlier. A ridge of high pressure extended southward<br />
along the coast of Mexico into the Isthmus of Tehuantepec<br />
from a 1019 hPa high in the Gulf of Mexico near Corpus<br />
Christi, Texas. A trough of low pressure extended from a<br />
low in the Gulf of Honduras to Tropical Depression TWO-E,<br />
with an estimated pressure of 1005 hPa, in the eastern North<br />
Pacific (Figure 10).<br />
Figure 10. National Weather Service USA chart from<br />
0000 UTC 22 May <strong>2012</strong>, centered on southern Mexico<br />
and Central America. High pressure in southern Mexico<br />
and a deep trough of low pressure extending WSW from<br />
Guatemala increased the pressure gradient near the<br />
Isthmus of Tehuantepec.<br />
The resulting pressure gradient across the Chivela pass<br />
initiated gale force winds spilling into the Gulf of Tehuantepec<br />
during the early morning hours of May 22nd. A gale warning<br />
was issued for 0300 UTC based on the expected onset of 35<br />
kt winds from Global Forecast System (GFS) model guidance<br />
over the previous day or so. An OSCAT pass at 0551 UTC<br />
documented a small area of 35 kts in the Gulf of Tehuantepec<br />
(Figure 11).<br />
Figure 11. ASCAT wind retrieval from 22 May <strong>2012</strong> at<br />
0551 UTC shows the swath of gale force winds to 40 kts<br />
in the gulf of Tehuantepec.<br />
The passenger cruise ship Celebrity Millennium (9HJF9)<br />
transiting the Gulf of Tehuantepec on 22 May reported 43<br />
kts sustained winds at 1400 UTC near 14.7N 94.7W . A<br />
subsequent OSCAT pass at 1807 UTC indicated peak winds<br />
had diminished to around 30 kts.<br />
REFERENCES<br />
Dvorak, V., 1984: Tropical cyclone intensity analysis using<br />
satellite data. NOAA Tech. Report NESDIS 11. Available<br />
from NOAA/NESDIS, 5200 Auth Rd., Washington DC,<br />
20233, 47pp.<br />
31<br />
Tropical Atlantic and Tropical east pacific Areas<br />
<strong>December</strong> <strong>2012</strong> ~ Mariners Weather Log
North Atlantic Area<br />
<strong>December</strong> <strong>2012</strong> ~ Mariners Weather Log<br />
32<br />
Marine Weather review – North Atlantic Area<br />
January to June <strong>2012</strong><br />
introduction<br />
The period of January to March<br />
featured an active winter pattern with an<br />
energetic southwest to northeast storm<br />
track established in a continuation of<br />
the previous season’s pattern. The<br />
numbers of hurricane force lows were<br />
highest in January and March with six<br />
and five, respectively, with February<br />
featuring four such cyclones forming.<br />
The numbers, however, were down<br />
from the ten occurring in the very<br />
active <strong>December</strong> 2011 (Reference 1).<br />
In the past the maximum frequency<br />
of hurricane force lows in the North<br />
Atlantic has been found to occur in<br />
January (Sienkiewicz and Von Ahn,<br />
2005). Several cyclones developed<br />
central pressures in the 950s or below<br />
during these three months including<br />
the deepest, at 944 mb, passing near<br />
Iceland early in March. The numbers of<br />
hurricane force systems then dropped<br />
to two in April and to none in the late<br />
spring and early summer months of<br />
May and June when such cyclones<br />
are relatively rare. Tropical activity<br />
affecting in OPC’s marine area north of<br />
31N consisted of three named cyclones<br />
which formed outside the tropics in<br />
OPC’s southwestern waters in late May<br />
and June, described below. One of these<br />
briefly developed minimal hurricane<br />
strength, and another re intensified as<br />
a strong post tropical low out over the<br />
central North Atlantic in early June.<br />
TROPICAL ACTIVITY<br />
Tropical Storm Alberto: The first<br />
named tropical cyclone of <strong>2012</strong><br />
originated as a non tropical low near the<br />
southwest end of a stationary front near<br />
31N 78W on the afternoon of May 18 th<br />
and became subtropical early on the<br />
By George P. Bancroft<br />
Ocean Forecast Branch, Ocean Prediction Center, College Park, MD<br />
NOAA National Center for Environmental Prediction<br />
19 th before becoming Tropical Storm<br />
Alberto the following evening near<br />
32N 78.5W with maximum sustained<br />
winds of 45 kts. Alberto then drifted<br />
southwest over the following day<br />
and slowly weakened before drifting<br />
northeast on the 21 st and weakening to<br />
a tropical depression near 31N 76.5W<br />
late on the 21 st and to a remnant low on<br />
the evening of the 22 nd . The remains<br />
of Alberto then dissipated north of<br />
Bermuda late on May 23rd.<br />
Tropical Storm Beryl: The second<br />
named tropical cyclone of <strong>2012</strong><br />
originated as a non tropical gale near<br />
31N 75W with a 1009 mb central<br />
pressure at 1800 UTC May 25 and<br />
drifted north, becoming subtropical<br />
storm Beryl the following evening with<br />
maximum sustained winds of 40 kts.<br />
Beryl then drifted southwest, passing<br />
south of OPC’s southern boundary<br />
of 31N on the night of the 26 th and<br />
intensifying into a 60 kts tropical storm<br />
before moving onshore over northern<br />
Florida on the night of the 27 th . The<br />
Carnival Pride (H3VU) near 34N<br />
76W reported east winds of 45 kts at<br />
1500 UTC on the 26 th . At 2000 UTC<br />
May 25 the buoy 41002 (31.9N 74.8W)<br />
reported southeast winds of 33 kts with<br />
gusts to 45 kts and 4.0 meter seas (13<br />
feet), and highest seas 4.5 meters (15<br />
feet) one hour later. Beryl weakened<br />
to a tropical depression while moving<br />
inland over the southeastern states on<br />
the 28 th and 29 th . Beryl then lost tropical<br />
characteristics as it emerged off the<br />
North Carolina coast as a post tropical<br />
gale force low <strong>by</strong> 2100 UTC May 30<br />
(Figure 1). Post tropical Beryl then<br />
maintained central pressures near 1000<br />
mb while tracking east northeast and<br />
then rapidly intensified after passing<br />
300 nm south of the Grand Banks on<br />
June 2 nd while turning more north. The<br />
second part of Figure 1 shows extratropical<br />
Beryl as it re intensified into a<br />
storm force low. The cyclone developed<br />
a lowest central pressure of 969 mb near<br />
50N 35W six hours later as it began to<br />
turn westward, and became the deepest<br />
cyclone of May and June period in<br />
terms of central pressure. The visible<br />
satellite image in Figure 2 reveals an<br />
intense circulation of cloud bands<br />
around a well defined center. Although<br />
the cyclone has the frontal features of<br />
an extra-tropical low as seen in Figures<br />
1 and Figure 2, the OSCAT image of<br />
the cyclone near maximum intensity<br />
(Figure 3) reveals a band of strongest<br />
winds to 55 kts close to a well defined<br />
center, a feature of tropical cyclones.<br />
Post tropical Beryl subsequently<br />
weakened while moving west and then<br />
south later on the 3 rd and its top winds<br />
diminished to gale force. The system<br />
became absorbed <strong>by</strong> a developing low<br />
passing to the south late on the 5 th .<br />
Hurricane Chris: A non tropical low<br />
which became Chris is shown in the first<br />
part of Figure 4 as a non-tropical gale<br />
south of Newfoundland with dissipating<br />
frontal features. The low was upgraded<br />
to Tropical Storm Chris at 2100 UTC<br />
June 19 <strong>by</strong> the National Hurricane<br />
Center with maximum sustained winds<br />
of 40 kts. The second part of Figure<br />
4 shows Chris two days later as a<br />
tropical storm at the 1200 UTC analysis<br />
time but accompanied <strong>by</strong> a text label<br />
indicating upgrade to a 65 kts hurricane<br />
at the 1500 UTC advisory time. Chris<br />
then weakened to a tropical storm six<br />
hours later while turning north, and<br />
continued weakening the following day<br />
before becoming a post tropical gale<br />
just south of the Grand Banks at 1800<br />
UTC June 22. The remains of Chris,
like Beryl before, became absorbed <strong>by</strong><br />
another low passing to the south late<br />
on the 23 rd .<br />
Other Significant Events of<br />
the Period<br />
North Atlantic Storm, January 1-4:<br />
The first significant event of the period<br />
originated as a low pressure wave<br />
near New England late on <strong>December</strong><br />
31 st and became a storm south of the<br />
island of Newfoundland at 1800 UTC<br />
January 1 st (Figure 5). At that time<br />
the hurricane force conditions near<br />
Greenland in the first part of Figure<br />
5 were associated with a low pressure<br />
system which passed east of Greenland<br />
late in <strong>December</strong>, covered in a previous<br />
Marine Weather Summary (Reference<br />
1). The cyclone tracked northeast<br />
over the North Atlantic on the night<br />
of the 1 st and on the 2 nd and intensified<br />
rapidly over the northeastern waters,<br />
becoming a hurricane force low in the<br />
North Sea on January 3 rd (second part<br />
of Figure 5). The central pressure fell<br />
32 mb in the twenty four hour period<br />
ending at 1200 UTC on the 3 rd , when<br />
the cyclone developed a lowest central<br />
pressure of 9<strong>56</strong> mb. The buoy 63118<br />
(59.1N 1.6E) reported northwest winds<br />
of 72 kts and 4.5 meter seas (15 feet)<br />
at 1800 UTC on the 3 rd . Buoy 62147<br />
(57.8N 0.9W) reported northwest winds<br />
of 60 kts and 6.0 meter seas (20 feet) at<br />
1400 UTC on the 3 rd . To the east buoy<br />
62146 (57.2N 2.1E) reported seas of 9.5<br />
meters (31 feet) six hours later. The<br />
cyclone subsequently passed inland<br />
over southern Norway on the night of<br />
the 3 rd .<br />
North Atlantic Storm, January 3-7: A<br />
wave of low pressure near 36N 66W at<br />
1200 UTC January 3rd moved northeast<br />
and briefly developed hurricane force<br />
winds with a 978 mb center passing<br />
near the island of Newfoundland on<br />
the afternoon of the 4 th . Hibernia<br />
Platform (VEP717, 46.7N 48.7W)<br />
reported southwest winds of 65 kts<br />
and 4.5 meter seas (15 feet) at 0000<br />
UTC on the 5 th (anemometer height<br />
139 m). Buoy 44139 (44.2N 57.0W)<br />
reported west winds of 50 kts and 5.5<br />
meter seas (18 feet) at 1800 UTC on<br />
the 4 th , and 7.5 meter seas (24 feet) one<br />
hour later. Buoy 44138 (44.3N 53.5W)<br />
reported west winds of 45 kts and 9.0<br />
meter seas (30 feet) at 2000 UTC on<br />
the 4 th . The cyclone moved out over the<br />
North Atlantic and developed a lowest<br />
central pressure of 964 mb as a storm<br />
force low in the Labrador Sea early on<br />
the 5 th before beginning to weaken and<br />
passing between Greenland and Iceland<br />
on the 6 th and northeast of Iceland on<br />
the 7 th . The ship BATEU08 (59N 6W)<br />
encountered northwest winds of 50 kts<br />
at 0900 UTC on the 7 th , and one hour<br />
prior to this buoy 64045 (59.2N 11.7W)<br />
reported 10.0 meter seas (33 feet).<br />
North Atlantic Storm, January 6<br />
10: The next low pressure system<br />
moved from the northern Gulf of St.<br />
Lawrence late on January 5 th to the<br />
northern Labrador Sea late on the 6 th ,<br />
where it developed storm force winds,<br />
and to east of Greenland <strong>by</strong> 1800<br />
UTC on the 8 th , where it developed<br />
hurricane force winds and a central<br />
pressure of 966 mb. The cyclone<br />
stalled in the east Greenland waters on<br />
the 9 th and spawned a new center near<br />
Iceland later that day. A European<br />
scatterometer pass (ASCAT) at 2208<br />
UTC on the 9 th revealed a swath of 50<br />
to 55 kts winds from near Greenland<br />
to south of Iceland, similar to Figure<br />
17 for the early March 944 mb low but<br />
not as strong. The second low center<br />
then weakened to a gale northeast of<br />
Iceland on the 10 th while the primary<br />
low passed north through the Denmark<br />
Strait.<br />
Western North Atlantic Storm,<br />
January 10-13: The initial<br />
development of this hurricane force<br />
low over a twenty four hour period is<br />
depicted in Figure 6. It originated as<br />
a frontal wave of low pressure off the<br />
southeastern U.S. coast on the 22 nd . The<br />
central pressure fell 28 mb during this<br />
initial rapid intensification. Figure 7<br />
reveals winds of 50 to 70 kts around the<br />
low center except the east side from an<br />
Indian scatterometer (OSCAT), offering<br />
coverage similar to that of QuikSCAT<br />
which went out of service in November<br />
2009. The cyclone then passed<br />
northeast across the Grand Banks on<br />
the 11 th and developed a lowest central<br />
pressure of 962 mb south of Greenland<br />
near 57N 47W at 1200 UTC on the 12 th .<br />
Hibernia Platform VEP717 (46.7N<br />
48.7W) reported west winds of 75 kts<br />
at its anemometer height of 139 m at<br />
2100 UTC on the 11 th and seas of 7.0<br />
meters (23 feet) three hours later. The<br />
Atlantic Cartier (SCKB) near 47N<br />
43W encountered west winds of 45 kts<br />
and 11.5 meter seas (37 feet) at 1800<br />
UTC on the 12 th . The ship BATEU08<br />
(61N 48W) reported east winds of 50<br />
kts at 0900 UTC on the 12 th . Buoy<br />
44140 (42.9N 51.9W) reported west<br />
winds 47 kts with gusts to 60 kts and<br />
6.5 meter seas (21 feet) at 1400 UTC<br />
January 11 th , and highest seas 7.5 meters<br />
(25 feet) two hours later. The cyclone<br />
then moved across southern Greenland<br />
and weakened to a storm force low late<br />
on the 12 th and then passed through the<br />
Denmark Strait as a gale <strong>by</strong> the 14 th .<br />
Northeastern Atlantic Storm,<br />
January 17 19: This cyclone developed<br />
from a complex of low pressure waves<br />
over the central waters well south of<br />
Greenland and tracked northeast toward<br />
Iceland, with rapid intensification<br />
occurring east of 30W. The central<br />
pressure fell 33 mb in the twenty<br />
four hour period ending at 0000 UTC<br />
January 18 resulting in the hurricane<br />
force low near Iceland in Figure 8. Near<br />
this time an OSCAT pass revealed an<br />
area of westerly winds to 75 kts south of<br />
Iceland (Figure 9). By comparison, an<br />
ASCAT pass from 2241 UTC January<br />
17 showed winds as high as 65 kts in<br />
the same area. The system developed a<br />
lowest central pressure of 9<strong>56</strong> mb while<br />
passing east of Iceland six hours later.<br />
The Federal Saguenay (8PNQ) near<br />
58N 9W reported west winds of 45 kts<br />
and 12.8 meter seas (42 feet) at 1200<br />
UTC on the 18 th . Buoy 64045 (59.2N<br />
11.7W) reported southwest winds of 45<br />
kts with gusts to 62 kts and 8.0 meter<br />
seas (26 feet) at 0500 UTC on the 18 th ,<br />
and 11.6 meter seas (38 feet) six hours<br />
later. The cyclone then weakened to<br />
a gale northeast of Iceland on the 19 th .<br />
33<br />
North Atlantic Area<br />
<strong>December</strong> <strong>2012</strong> ~ Mariners Weather Log
North Atlantic Area<br />
<strong>December</strong> <strong>2012</strong> ~ Mariners Weather Log<br />
34<br />
OBSERVATION POSITION DATE/TIME (UTC) WIND SEA(m/f)<br />
Singelgracht (PCGM) 37N 64W<br />
37N 66W<br />
North Atlantic Storm, January 22-<br />
25: A developing low passed northeast<br />
across Atlantic Canada late on January<br />
20 th and on the 21 st and became a storm<br />
with a lowest central pressure of 978<br />
mb in the northern Labrador Sea on the<br />
night of the 22 nd . The cyclone re formed<br />
east of southern Greenland on the 23 rd ,<br />
where it briefly developed hurricane<br />
force winds late on the 23 rd . The Irena<br />
Artica (BATEU05) encountered north<br />
winds of 50 kts near 59N 42W at 1200<br />
UTC on the 24 th . The low pressure<br />
system then drifted southeast and<br />
slowly weakened over the following<br />
two days and dissipated west of Ireland<br />
on the 25 th .<br />
North Atlantic Storm, February 2-6:<br />
A frontal wave of low pressure moved<br />
off the mid Atlantic coast of the U.S. on<br />
the morning of February 2 and rapidly<br />
intensified, with the central pressure<br />
falling 32 mb in the twenty four hour<br />
period ending at 1800 UTC on the 3 rd .<br />
The cyclone continued to intensify over<br />
the following two days while it lifted<br />
to the north northeast. The system<br />
developed two periods of hurricane<br />
03/1200<br />
03/1800<br />
force conditions, one late on the 3 rd<br />
when it was south of Newfoundland and<br />
the other on the 5 th when it was over<br />
the Labrador Sea (Figure 10). Some<br />
notable reports from ships and buoys<br />
in this event are listed in Table 1. After<br />
reaching peak intensity on the 5 th the<br />
cyclone weakened rapidly near the<br />
southern tip of Greenland late on the<br />
6 th and on the 7 th , before dissipating <strong>by</strong><br />
the 8 th .<br />
North Atlantic Storm, February<br />
8-10: Figure 11 depicts the rapid<br />
initial development of this hurricane<br />
force storm over the southwestern<br />
waters over a twenty four hour period,<br />
when the central pressure dropped<br />
28 mb. In spite of the relatively high<br />
central pressure in this event, the<br />
cyclone’s compact circulation resulted<br />
in hurricane force winds to 70 kts as<br />
detected <strong>by</strong> OSCAT imagery (Figure<br />
12) around the southwest and west sides<br />
of the low. The Sea-Land Champion<br />
(WKAU) near 46N 57W reported<br />
north winds of 50 kts at 0600 UTC on<br />
the 10 th . Hibernia Platform (VEP717,<br />
46.7N 48.7W) reported west winds of<br />
NW 60<br />
NW 50<br />
Sol Do Brasil (ELOQ4) 39N 64W 03/1800 NE 50<br />
4.5/15<br />
7.6/25<br />
Adrian Maersk (OXLD2) 38.5N 46W<br />
39N 43W<br />
03/1800 NE 50 7.6/25<br />
President Polk (WRYD) 42N 55W 04/0600 N 55 8.8/29<br />
Integrity (WDC6925) 36N 43W 04/1200 SW 65 7.6/25<br />
Washington Express<br />
(WDD3826)<br />
39N 41W 04/1200 SW 50 5.0/16<br />
Hibernia Platform (VEP717) 46.7N 48.7W 04/2100<br />
05/0000<br />
05/0300<br />
Buoy 44140 43.8N 51.5W 04/0900<br />
04/1100<br />
NW 65<br />
W 55<br />
W 55<br />
NW 45 G58<br />
Maximum<br />
6.5/21<br />
6.5/21<br />
7.0/23<br />
6.5/21<br />
8.0/26<br />
Buoy 44138 44.3N 53.6W 04/0600 N 41 G52 7.5/25<br />
Table 1. Selected ship and buoy observations taken during passage of North Atlantic storm, February 26, <strong>2012</strong>.<br />
65 kts and 6.5 meter seas (21 feet) at<br />
2100 UTC on the 10 th . The buoy 44141<br />
(43.0N 58.0W) reported northwest<br />
winds 47 kts with gusts to 62 kts and<br />
7.0 meter seas (23 feet) at 0400 UTC on<br />
the 10 th . The cyclone tracked northeast<br />
toward Iceland and gradually weakened<br />
beginning on the 10 th and its top winds<br />
diminished to gale force <strong>by</strong> the 11 th .<br />
The gale force low then turned east<br />
along 65N on February 12 th and moved<br />
inland over Norway the next day.<br />
North Atlantic Storm, February<br />
19-23: Developing low pressure<br />
moved off the southeast U.S. coast on<br />
the afternoon of February 19 th and<br />
developed hurricane force winds with<br />
a 968 mb center over the central waters<br />
near 42N 46W two days later. A high<br />
resolution ASCAT pass from 1200 UTC<br />
on the 22 nd revealed winds 50 to 60 kts<br />
in the south semicircle of the low center<br />
similar to those of Figure 14 for the next<br />
event except not quite as strong. The<br />
Kaveri Spirit (C6WK2) near 37N 44W<br />
reported south winds of 45 kts and 11.3<br />
meter seas (37 feet) at 1700 UTC on the<br />
21 st . Thirteen hours later the Porto
(A8UN3) encountered northwest winds<br />
of 50 kts and 5.5 meter seas (18 feet).<br />
The cyclone moved northeast with its<br />
top winds diminishing to storm force<br />
on the afternoon of the 22 nd . After<br />
reaching Iceland twenty four hours later<br />
the storm turned east along 65N and<br />
moved inland over Norway the next day.<br />
The Mary Artica (BATEU00) near<br />
62N 7W reported west winds of 50 kts<br />
at 0200 UTC on the 24 th .<br />
North Atlantic Storm, February<br />
28-March 4: Figure 13 depicts the<br />
development of a hurricane force<br />
low over the northern waters from a<br />
complex low southeast of Nova Scotia.<br />
The southern low took over and rapidly<br />
deepened after passing 50W with the<br />
central pressure falling 33 mb in the<br />
twenty four hour period ending at<br />
0600 UTC March 1 st , with the cyclone<br />
developing its lowest central pressure<br />
at that time. The high resolution (25<br />
km) ASCAT image in Figure 14 reveals<br />
numerous wind barbs of 50 to 60 kts in<br />
the south semicircle of the low and some<br />
65 kts winds. The Tyco Responder<br />
(V7CY9) near 41N 59W reported<br />
northwest winds of 50 kts and 6.5 meter<br />
seas (21 feet) at 0000 UTC February<br />
29 th . The Sea-Land Eagle (WKAE)<br />
near 50N 45W reported west winds of<br />
50 kts and 6.5 meter seas at 1200 UTC<br />
March 1 st , and the London Senator<br />
(DEDM) encountered northeast winds<br />
of 60 kts near <strong>56</strong>N 37W six hours later.<br />
The cyclone maintained hurricane<br />
force winds from late on the 29 th until<br />
early on March 2 when it passed east<br />
of Greenland. The system remained<br />
in the east Greenland waters on the 2 nd<br />
and 3 rd before weakening rapidly late on<br />
the 3 rd and passing northeast of Iceland<br />
on the 4 th .<br />
North Atlantic Storms, March 3-8:<br />
Three hurricane force lows developed<br />
in rapid succession during this most<br />
active period of the first six months of<br />
<strong>2012</strong>. The first originated over New<br />
England on March 3 rd and moved to<br />
near Greenland late on the 4th<br />
(Figure 15) and to the east Greenland<br />
waters on the 5 th where it stalled through<br />
the 8 th and maintained hurricane force<br />
west to northwest winds in a swath off<br />
the coast of southern Greenland (Figure<br />
17) from late on the 5 th into the 8 th . The<br />
cyclone developed a central pressure<br />
as low as 952 mb at 0600 UTC on the<br />
6 th , the second deepest of the period.<br />
The system then weakened late on the<br />
8 th and passed north of Iceland on the<br />
9 th . The second cyclone is shown as<br />
a low pressure wave off the U.S. mid<br />
Atlantic in Figure 15 and two days later<br />
northeast of Iceland with the center<br />
off the chart at 67N 14W with a 944<br />
mb center (Figure 16), when it briefly<br />
developed hurricane force winds. This<br />
was the deepest cyclone of the six month<br />
period and the only one with a central<br />
pressure below 950 mb. The central<br />
pressure dropped 34 mb in the twenty<br />
four hour period ending at 1800 UTC on<br />
the 6 th . The British Kestrel (MGRL4)<br />
near 40N 51W reported southwest<br />
winds of 45 kts and 5.2 meter seas (17<br />
feet) at 1800 UTC on the 5 th then the low<br />
center was near Newfoundland. The<br />
third event was a low moving off the<br />
mid Atlantic coast of the U.S. at 1800<br />
UTC March 5 th and briefly developing<br />
hurricane force winds south of the<br />
island of Newfoundland late on the 6 th<br />
(Figure 16). The compact circulation<br />
of this cyclone was able to develop such<br />
winds while surrounded <strong>by</strong> strong high<br />
pressure especially to the west, with a<br />
relatively modest central pressure of<br />
995 mb. The lowest central pressure<br />
was 988 mb six hours later, a drop of 24<br />
mb over twenty four hours. The buoy<br />
44141 (43.0N 58.0W) reported northwest<br />
winds of 47 kts with gusts to 64 kts at<br />
2300 UTC on the 6 th , and highest seas<br />
7.5 meters (25 feet) eleven hours later.<br />
Buoy 44140 (42.9N 51.9W) reported<br />
southwest winds 43 kts with gusts to 58<br />
kts at 0700 UTC on the 7 th and highest<br />
seas of 10.0 meters (33 feet) one hour<br />
later. The cyclone subsequently moved<br />
across the Grand Banks and then out<br />
over the central North Atlantic late on<br />
the7th and weakened as a new center<br />
formed to the northeast and moved<br />
toward Iceland.<br />
North Atlantic Storm, March 11-<br />
13: The development of this cyclone<br />
from a flat low pressure wave off<br />
Newfoundland over a thirty six hour<br />
period is depicted in Figure 18. The<br />
central pressure fell an impressive 36<br />
mb in the final twenty four hour period<br />
and the low center was at maximum<br />
intensity in the second part of Figure<br />
18. At 1000 UTC March 11 the ship<br />
BATEU01 (46N 49W) encountered<br />
northwest winds of 50 kts. In an area<br />
lacking surface observations, the<br />
ASCAT image in Figure 19 shows<br />
winds to 55 kts on the south side of<br />
the cyclone and up to 60 kts northwest<br />
of the occluded front apparent on the<br />
image. The system then moved into<br />
the east Greenland waters <strong>by</strong> the 13 th<br />
and began to weaken, with the center<br />
passing north of the area <strong>by</strong> the 14 th .<br />
Central North Atlantic Storm,<br />
March 21 24: Blocking high pressure<br />
developing over Europe forced the<br />
next major storm to move slowly and<br />
erratically with Figure 20 showing a<br />
hurricane force low developing from the<br />
merging of southern and northern lows.<br />
The consolidated center then deepened<br />
slowly over the next two days while<br />
making a cyclonic loop to the northwest,<br />
reaching a lowest pressure of 952 mb<br />
near 51N 43W at 0600 UTC March 24.<br />
An ASCAT pass from 2352 UTC on the<br />
21 st revealed winds 50 to 60 kts around<br />
the southwest and west sides. The<br />
Porto (44N 43W) reported northwest<br />
winds of 62 kts at 2100 UTC on the<br />
21 st , and northwest winds of 60 kts and<br />
10.0 meter seas (33 feet) near 43N 39W<br />
nine hours later. The ship BAREU12<br />
(48N 39W) encountered west winds of<br />
45 kts and 12.8 meter seas (42 feet) at<br />
1200 UTC on the 22 nd . The cyclone<br />
then drifted northeast and weakened<br />
on the 24 th before becoming absorbed<br />
<strong>by</strong> a low to the north <strong>by</strong> the 25 th .<br />
Southwestern North Atlantic Storm,<br />
April 2-4: Figure 21 shows the<br />
development of low pressure off the mid<br />
Atlantic coast of the U.S. into a storm<br />
south of Newfoundland at 1200 UTC<br />
April 3 rd . The low developed a lowest<br />
pressure of 966 mb eighteen hours<br />
35<br />
North Atlantic Area<br />
<strong>December</strong> <strong>2012</strong> ~ Mariners Weather Log
North Atlantic Area<br />
<strong>December</strong> <strong>2012</strong> ~ Mariners Weather Log<br />
36<br />
later with the center near 44N 54W.<br />
The Nedlloyd Maxima (A8JR6) near<br />
40N 59W reported northwest winds of<br />
50 kts and 9.8 meter seas (32 feet) at<br />
2100 UTC on the 3 rd . The Sea-Land<br />
Mercury (WKAW) encountered seas<br />
of 10.4 meters (34 feet) along with<br />
northwest winds of 35 kts near 40N<br />
58W twelve hours later. Blocked <strong>by</strong><br />
high pressure to the east, the cyclone<br />
lifted north across Newfoundland on<br />
the 4 th and weakened before becoming<br />
absorbed <strong>by</strong> another cyclone to the east<br />
<strong>by</strong> the 6 th .<br />
North Atlantic Storm, April 14-<br />
15: Low pressure moved off the mid<br />
Atlantic coast of the U.S. early on<br />
April 11 th and moved to near the island<br />
of Newfoundland on the 13 th before<br />
intensifying into a hurricane force low<br />
south of Greenland late on the 14 th<br />
(Figure 22). A high resolution ASCAT<br />
pass near the time of the second part<br />
of Figure 22 showed northeast winds<br />
to 70 kts north of the occluded front<br />
where the flow is channeled against<br />
the southern tip of Greenland. This<br />
was the last non tropical hurricane<br />
force event of the period. The cyclone<br />
subsequently slowed down southeast<br />
of Greenland and weakened late on<br />
the 15 th before moving southeast and<br />
becoming absorbed <strong>by</strong> the 17 th .<br />
Northeastern Atlantic Storm,<br />
May 12-14: Figure 23 shows the<br />
development of an unseasonably deep<br />
storm center north of Great Britain<br />
from a low pressure wave near 60N<br />
36W over a thirty six hour period. This<br />
was almost as deep as the post tropical<br />
storm Beryl described above. The<br />
central pressure dropped 33 mb in the<br />
twenty four hour period ending at 1200<br />
UTC on the 13 th , as rapid a drop as in<br />
some of the winter storms. The buoy<br />
63057 (59.2N 1.5E) reported southwest<br />
winds of 50 kts at 0200 UTC on the 14 th ,<br />
and seas up to 6.0 meters (20 feet) four<br />
hours later. The Stena Carron (2BKQ8)<br />
near 61N 3W encountered northwest<br />
winds of 35 kts and 8.2 meter seas<br />
(27 feet). The cyclone subsequently<br />
weakened and moved through the<br />
Norwegian Sea as a gale on the 15 th .<br />
Central North Atlantic Storm, May<br />
30-31: The low pressure complex<br />
seen over the central waters in the<br />
first part of Figure 24 consolidated<br />
into one 976 mb low near 50N 34W <strong>by</strong><br />
1200 UTC on the 31 st with the 990 mb<br />
low coming from the west absorbing<br />
the others. This became the southern<br />
low with storm conditions seen in the<br />
second part of Figure 24. The Kiel<br />
Express (DEHZ) reported southeast<br />
winds 45 kts near 49N 27W at 0600<br />
UTC on the 31 st , and 5.8 meter seas<br />
(19 feet) three hours later. Figure 25 is<br />
an OSCAT image of the consolidating<br />
cyclone circulation containing storm<br />
force winds. Weakening of this slow<br />
moving system followed on the 31 st<br />
as the system drifted to the west and<br />
became absorbed <strong>by</strong> the intensifying<br />
post tropical Beryl turning north toward<br />
it early on June 3rd.<br />
Northeastern Atlantic Storm, June<br />
14-15: A low pressure wave near<br />
Bermuda early on June 9 th moved<br />
northeast and intensified as it turned<br />
north toward Ireland late on the 13 th<br />
and the 14 th , becoming a storm force<br />
low near 50N 12W with a lowest central<br />
pressure of 984 mb at 1800 UTC on the<br />
14 th . The system drifted to the north<br />
and weakened to a gale near Ireland on<br />
the 15 th , before turning northeast and<br />
dissipating in the North Sea on the 17 th .<br />
Buoy 62023 (51.4N 7.9W) reported<br />
southwest winds of 39 kts with gusts to<br />
49 kts at 1800 UTC on the 15 th , and seas<br />
of 5.5 meters (18 feet) seven hours later.<br />
rEFErENCES<br />
Bancroft, George, Marine Weather<br />
Review – North Atlantic Area July to<br />
<strong>December</strong> 2011, Mariners Weather<br />
Log, Vol. <strong>56</strong>, No. 2, August <strong>2012</strong>.<br />
ASCAT Users Manual,<br />
http://www.knmi.nl/scatterometer/<br />
publications/pdf/ASCAT_Product_<br />
Manual.pdf<br />
Von Ahn, Joan. and Sienkiewicz, Joe,<br />
Hurricane Force Extratropical Cyclones<br />
Observed Using QuikSCAT Near Real<br />
Time Winds, Mariners Weather Log,<br />
Vol. 49, No. 1, April 2005.<br />
Sienkiewicz, Joe and Chesneau, Lee,<br />
Mariner’s Guide to the 500 Millibar<br />
Chart, Mariners Weather Log, Vol. 52,<br />
No. 3, <strong>December</strong> 2008.<br />
http://manati.star.nesdis.noaa.gov/<br />
products.php
Marine Weather Review – North Pacific Area<br />
January to June <strong>2012</strong><br />
introduction<br />
The most active storm track during<br />
the period was from the western<br />
North Pacific Northeastward, with<br />
the cyclones passing near or south<br />
of the Aleutian Islands on their way<br />
toward the Gulf of Alaska with some<br />
originating in the central or eastern<br />
waters before tracking northeast<br />
toward the Canadian coast or Southeast<br />
Alaska. A blocking pattern in early<br />
April forced two intense cyclones<br />
near Japan to instead turn north into<br />
the Sea of Okhotsk where they stalled<br />
and weakened. In a continuation<br />
of the active pattern of the previous<br />
two months, ten cyclones developed<br />
hurricane force winds in January. The<br />
three hurricane force events of April<br />
occurred early in the month with one<br />
producing the highest winds seen in<br />
scatterometer data during the six month<br />
period, near Japan. The only hurricane<br />
force low to occur during May and June<br />
had tropical origins (Typhoon Mawar<br />
early in June). Mawar was one of three<br />
tropical systems to re-curve into the<br />
mid latitude westerly’s off Japan before<br />
becoming extratropical during late May<br />
and June.<br />
Tropical Activity<br />
Typhoon Sanvu. Sanvu moved<br />
northwest to appear on OPC’s<br />
radiofacsimile analysis charts late on<br />
May 22, passing near 17N 140E at 0600<br />
UTC on the 23 rd as an intensifying<br />
tropical storm with maximum sustained<br />
winds of 55 kts. Sanvu became a<br />
typhoon at 1800 UTC on the 23 rd and<br />
reached maximum strength near 22N<br />
139E with sustained 80 kts winds while<br />
beginning a turn to the northeast into<br />
the mid latitude westerly’s. The cyclone<br />
By George P. Bancroft<br />
Ocean Forecast Branch, Ocean Prediction Center, College Park, MD<br />
NOAA National Center for Environmental Prediction<br />
then slowly weakened, becoming a<br />
strong tropical storm at 1800 UTC on<br />
the 26 th while passing near 26N 1144E.<br />
Sanvu then merged with the southwest<br />
end of a trailing frontal zone and<br />
became a post tropical gale force low<br />
near 29N 149E at 1200 UTC on the 27 th .<br />
At that time the Ever Divine (9V79<strong>56</strong>)<br />
to the north near 32N 149E reported<br />
northeast winds of 40 kts and 9.0 meter<br />
seas (30 feet). The remains of Sanvu<br />
then moved northeast and dissipated<br />
near 35N 165E early on May 30.<br />
Typhoon Mawar: Northeastward<br />
moving Mawar passed south of Japan<br />
near 29N 135E as a weakening typhoon<br />
with maximum sustained winds of<br />
65 kts 1200 UTC June 5. Mawar<br />
weakened to a tropical storm six hours<br />
later before transitioning into an intense<br />
post tropical low with hurricane force<br />
winds and frontal features as depicted<br />
in Figure 1. The London Express<br />
(DPLE) near 33N 136E reported<br />
northeast winds of 55 kts at 1800 UTC<br />
on the 5 th when Mawar was still a<br />
tropical storm. The infrared satellite<br />
image in Figure 2 shows Mawar near<br />
maximum intensity as a post tropical<br />
low. It displays the cloud features<br />
found in an extratropical low such a<br />
comma head and tail (occlusion and<br />
trailing front) but also a semicircular<br />
central dense cloud feature around the<br />
north side of a partial eye like feature<br />
near 40N 151E as Post tropical Mawar<br />
retains some tropical like features.<br />
Figure 3 is a 25 km OSCAT image of<br />
winds around Mawar about thirteen<br />
hours after it became post tropical. The<br />
strongest winds still appear in close to<br />
the center, a tropical like feature. There<br />
are 70 kts wind appearing among<br />
data that is not rain flagged (white).<br />
Post tropical Mawar then moved east<br />
northeast and began to weaken with its<br />
top winds lowering to storm force 0600<br />
UTC on the 7 th and to gale force twenty<br />
four hours later. At 0600 UTC on the<br />
7 th a vessel with the SHIP callsign near<br />
41N 150E reported north winds of 60<br />
kts and 9.5 meter seas (31 feet). The<br />
weakening cyclone then passed west<br />
of the Aleutian Islands early on the 10 th<br />
before dissipating in the western Bering<br />
Sea on June 13.<br />
Tropical Storm Guchol: Guchol<br />
passed near 32N 135E just south of<br />
Japan as a northeastward moving<br />
weakening tropical storm at 0600<br />
UTC June 19 with maximum sustained<br />
winds of 55 kts. Guchol moved inland<br />
over Japan shortly thereafter and<br />
became a post tropical storm force low<br />
north of Tokyo near 37N 140E with a<br />
985 mb central pressure at 1800 UTC<br />
on the 19 th , and then passed offshore<br />
with winds weakening to gale force the<br />
following night. At 1200 UTC on the<br />
19 th with Tropical Storm Guchol over<br />
western Japan, the ship DHDE near<br />
34N 141E reported south winds of 45<br />
kts. The Antwerpen (VRBK6) near<br />
35.5N 140E encountered southwest<br />
winds of 60 kts and 4.3 meter seas (14<br />
feet) three hours later. Post tropical<br />
Guchol continued to weaken slowly on<br />
the 20 th and the 21 st and dissipated near<br />
44N 147E late on the 21 st .<br />
Other Significant Weather of the<br />
Period<br />
Western North Pacific Storm,<br />
January 2-4: The first hurricane<br />
force low of the January to June period<br />
formed from southern low pressure<br />
system absorbing a northern system<br />
over a twenty four hour period as<br />
depicted in Figure 4. The central<br />
37<br />
North pacific Area<br />
<strong>December</strong> <strong>2012</strong> ~ Mariners Weather Log
North pacific Area<br />
<strong>December</strong> <strong>2012</strong> ~ Mariners Weather Log<br />
38<br />
introduction<br />
OBSERVATION POSITION DATE/TIME (UTC) WIND SEA(m/f)<br />
Overseas Joyce (V7NV4) 37N 147E<br />
38N 149E<br />
The most active storm track during<br />
the period was from the western<br />
North Pacific Northeastward, with<br />
the cyclones passing near or south<br />
of the Aleutian Islands on their way<br />
toward the Gulf of Alaska with some<br />
originating in the central or eastern<br />
waters before tracking northeast<br />
toward the Canadian coast or Southeast<br />
Alaska. A blocking pattern in early<br />
April forced two intense cyclones<br />
near Japan to instead turn north into<br />
the Sea of Okhotsk where they stalled<br />
and weakened. In a continuation<br />
of the active pattern of the previous<br />
two months, ten cyclones developed<br />
hurricane force winds in January. The<br />
three hurricane force events of April<br />
occurred early in the month with one<br />
producing the highest winds seen in<br />
scatterometer data during the six month<br />
period, near Japan. The only hurricane<br />
force low to occur during May and June<br />
had tropical origins (Typhoon Mawar<br />
early in June). Mawar was one of three<br />
tropical systems to re-curve into the<br />
mid latitude westerly’s off Japan before<br />
becoming extratropical during late May<br />
and June.<br />
Tropical Activity<br />
11/1800<br />
12/0000<br />
Typhoon Sanvu. Sanvu moved<br />
northwest to appear on OPC’s<br />
radiofacsimile analysis charts late on<br />
May 22, passing near 17N 140E at 0600<br />
UTC on the 23 rd as an intensifying<br />
tropical storm with maximum sustained<br />
winds of 55 kts. Sanvu became a<br />
typhoon at 1800 UTC on the 23 rd and<br />
reached maximum strength near 22N<br />
139E with sustained 80 kts winds while<br />
beginning a turn to the northeast into<br />
the mid latitude westerly’s. The cyclone<br />
then slowly weakened, becoming a<br />
strong tropical storm at 1800 UTC on<br />
the 26 th while passing near 26N 1144E.<br />
Sanvu then merged with the southwest<br />
end of a trailing frontal zone and<br />
became a post tropical gale force low<br />
near 29N 149E at 1200 UTC on the 27 th .<br />
At that time the Ever Divine (9V79<strong>56</strong>)<br />
to the north near 32N 149E reported<br />
northeast winds of 40 kts and 9.0 meter<br />
seas (30 feet). The remains of Sanvu<br />
then moved northeast and dissipated<br />
near 35N 165E early on May 30.<br />
Typhoon Mawar: Northeastward<br />
moving Mawar passed south of Japan<br />
near 29N 135E as a weakening typhoon<br />
NW 50<br />
NW 50<br />
MOL Innovation (9VVP) 46N 153E 12/1200 W 50<br />
Hanjin Philadelphia (A8CN8) 53N 174E<br />
55N 178E<br />
Othello (SBLW)<br />
SHIP<br />
SHIP<br />
47N 154E<br />
<strong>56</strong>N 166E<br />
<strong>56</strong>N 164E<br />
12/1800<br />
13/0600<br />
12/1800<br />
12/1800<br />
14/0000<br />
Buoy 46070 55.1N 175.3E 13/0100<br />
Buoy 46072 51.7N 172.2W<br />
13/0200<br />
13/2100<br />
14/0100<br />
SE 50<br />
SE 45<br />
S 50<br />
NE 55<br />
SE 39 G49<br />
Peak gust 52<br />
Maximum<br />
SE 35 G45<br />
Peak gust 49<br />
Maximum<br />
Table 1. Selected ship and buoy observations taken during Northwestern Pacific Storm, January 11-14.<br />
9.8/32<br />
8.2/27<br />
7.9/26<br />
8.5/28<br />
6.5/21<br />
6.5/21<br />
9/0/30<br />
10.5/34<br />
7.5/25<br />
8.5/28<br />
with maximum sustained winds of<br />
65 kts 1200 UTC June 5. Mawar<br />
weakened to a tropical storm six hours<br />
later before transitioning into an intense<br />
post tropical low with hurricane force<br />
winds and frontal features as depicted<br />
in Figure 1. The London Express<br />
(DPLE) near 33N 136E reported<br />
northeast winds of 55 kts at 1800 UTC<br />
on the 5 th when Mawar was still a<br />
tropical storm. The infrared satellite<br />
image in Figure 2 shows Mawar near<br />
maximum intensity as a post tropical<br />
low. It displays the cloud features<br />
found in an extratropical low such a<br />
comma head and tail (occlusion and<br />
trailing front) but also a semicircular<br />
central dense cloud feature around the<br />
north side of a partial eye like feature<br />
near 40N 151E as Post tropical Mawar<br />
retains some tropical like features.<br />
Figure 3 is a 25 km OSCAT image of<br />
winds around Mawar about thirteen<br />
hours after it became post tropical. The<br />
strongest winds still appear in close to<br />
the center, a tropical like feature. There<br />
are 70 kts wind appearing among<br />
data that is not rain flagged (white).<br />
Post tropical Mawar then moved east<br />
northeast and began to weaken with its<br />
top winds lowering to storm force 0600
UTC on the 7 th and to gale force twenty<br />
four hours later. At 0600 UTC on the<br />
7 th a vessel with the SHIP callsign near<br />
41N 150E reported north winds of 60<br />
kts and 9.5 meter seas (31 feet). The<br />
weakening cyclone then passed west<br />
of the Aleutian Islands early on the 10 th<br />
before dissipating in the western Bering<br />
Sea on June 13.<br />
Tropical Storm Guchol: Guchol<br />
passed near 32N 135E just south of<br />
Japan as a northeastward moving<br />
weakening tropical storm at 0600<br />
UTC June 19 with maximum sustained<br />
winds of 55 kts. Guchol moved inland<br />
over Japan shortly thereafter and<br />
became a post tropical storm force low<br />
north of Tokyo near 37N 140E with a<br />
985 mb central pressure at 1800 UTC<br />
on the 19 th , and then passed offshore<br />
with winds weakening to gale force the<br />
following night. At 1200 UTC on the<br />
19 th with Tropical Storm Guchol over<br />
western Japan, the ship DHDE near<br />
34N 141E reported south winds of 45<br />
kts. The Antwerpen (VRBK6) near<br />
35.5N 140E encountered southwest<br />
winds of 60 kts and 4.3 meter seas (14<br />
feet) three hours later. Post tropical<br />
Guchol continued to weaken slowly on<br />
the 20 th and the 21 st and dissipated near<br />
44N 147E late on the 21 st .<br />
Other Significant Weather of the<br />
Period<br />
Western North Pacific Storm,<br />
January 2-4: The first hurricane<br />
force low of the January to June period<br />
formed from southern low pressure<br />
system absorbing a northern system<br />
over a twenty four hour period as<br />
depicted in Figure 4. The central<br />
pressure fell 40 mb during this period.<br />
Rapid or explosive intensification is<br />
considered to be 24 mb in twenty four<br />
hours and is latitude dependent. The<br />
cyclone developed a lowest central<br />
pressure of 960 mb near 43N 155E at<br />
1200 UTC January 3. The Hanjin<br />
Copenhagen (DHDM) reported east<br />
winds of 45 kts and 4.5 meter seas (15<br />
feet) near 48N 154E at 0600 UTC on<br />
the 3 rd . The high resolution ASCAT<br />
image in Figure 5 reveals winds to 60<br />
kts on the south side of the cyclone<br />
but since this is only a partial view of<br />
the circulation the image could miss<br />
the highest winds. Actual winds are<br />
likely at least 65 kts due to the low<br />
bias of ASCAT winds. The cyclone<br />
subsequently moved northeast on the<br />
3 rd and turned more southeast on the 4 th<br />
while weakening, and then dissipated<br />
well south of the western Aleutians late<br />
on the 7 th .<br />
Northeastern Pacific Storm, January<br />
3-4: This short lived event consisted<br />
of a developing low pressure wave near<br />
40N 140W at 1800 UTC on January<br />
3 moving rapidly north northeast and<br />
briefly becoming a hurricane force<br />
low near 52N 135W with a 978 mb<br />
central pressure twelve hours later<br />
before moving inland over Southeast<br />
Alaska and northwestern Canada on<br />
the morning of the 4 th . A vessel with<br />
the SHIP callsign reported south winds<br />
of 50 kts near 55N 134W at 1200 UTC<br />
on the 4 th . Many of the Canadian<br />
buoys east of the low reported south to<br />
southeast winds 35 to 41 kts with gusts<br />
as high as 51 kts. The buoy 46185<br />
(52.4N 129.8W) reported seas up to 7.5<br />
meters (25 feet) at 0800 UTC on the 4 th .<br />
North Pacific Storm, January 4-9:<br />
A developing low pressure system<br />
moved from near Japan late on January<br />
3rd to the central waters on the 6 th and<br />
the northern Gulf of Alaska on the<br />
9 th , where it dissipated. The cyclone<br />
developed hurricane force winds with<br />
the low center as it passed near 44N<br />
178W at 0600 UTC on the 6 th with a 965<br />
mb central pressure. The low center<br />
developed a lowest central pressure of<br />
960 mb near 51N 157W at 1200 UTC<br />
on the 7 th before beginning a weakening<br />
trend. The Hanjin Copenhagen<br />
(DHDM) near 55N 159W reported<br />
north winds of 70 kts and 7.3 meter seas<br />
(24 feet) at that time, while the Cosco<br />
Shenzhen (A8GF4) encountered north<br />
winds of 55 kts and 8.5 meter seas (28<br />
feet) at 54N 161W. The buoy 46075<br />
(54.0N 160.8W) reported north winds<br />
of 40 kts and 8.2 meter seas (27 feet),<br />
also at that time.<br />
Northwestern Pacific Storm, January<br />
11-14: A southern low pressure<br />
system seen in the first part of Figure<br />
6 explosively deepened over the next<br />
twenty four hours while absorbing<br />
two lows to the north, with the central<br />
pressure falling 48 mb, the highest rate<br />
of intensification of any cyclone in both<br />
the North Pacific and the North Atlantic<br />
during the six month period. Figure 7<br />
is a 500 mb analysis valid at the start<br />
of this rapid development, showing a<br />
short wave trough and 100 kts wind<br />
maximum and also diverging winds<br />
ahead of the trough supporting this<br />
development. More information on the<br />
use of the 500 mb chart may be found<br />
in the References (Sienkiewicz and<br />
Chesneau, 2008). The second part of<br />
Figure 6 shows the cyclone at maximum<br />
intensity, 944 mb (27.88 inches). This<br />
was the deepest cyclone of the period<br />
in the North Pacific and one of three<br />
with central pressures in the 940s. The<br />
ASCAT imagery in Figure 8 reveals a<br />
swath of west to northwest winds 50<br />
to 75 kts in the southwest semicircle<br />
of the low and winds to 55 kts to the<br />
east. Some notable ship and buoy<br />
observations during this event are listed<br />
in Table 1. The cyclone subsequently<br />
made a cyclonic loop to the west and<br />
39<br />
North pacific Area<br />
<strong>December</strong> <strong>2012</strong> ~ Mariners Weather Log
North pacific Area<br />
<strong>December</strong> <strong>2012</strong> ~ Mariners Weather Log<br />
40<br />
then south while weakening, and then<br />
dissipated near the Kurile Islands on<br />
the 15 th .<br />
Eastern North Pacific Storm,<br />
January 18: A primary gale force<br />
low well offshore from the U.S. Pacific<br />
Northwest coast of the U.S. spawned a<br />
secondary low on the associated front<br />
approaching the coast on the night of<br />
January 17 th . At 1200 UTC on the 18 th<br />
the secondary low was near 46N 130W<br />
and moving northeast with hurricane<br />
force conditions near the coast to the<br />
east. The low and front moved onshore<br />
later that day and winds diminished.<br />
The Tokyo Express (DGTX) reported<br />
south winds of 45 kts and 10.7 meter<br />
seas (35 feet) near 43N 125W at 1800<br />
UTC on the 18 th . The Cape Arago<br />
C/MAN station (CARO3, 43.3N<br />
124.3W) reported south winds of 45<br />
kts with gusts to 58 kts at 1400 UTC<br />
on the 18 th and a peak gust of 69 kts<br />
at 0000 UTC on the 19 th . Buoy 46050<br />
(44.2N 124.6W) at 1500 UTC on the<br />
18 th reported south winds of 40 kts<br />
with gusts to 51 kts and 8.5 meter seas<br />
(28 feet). Three hours later that buoy<br />
reported 9.0 meter seas (30 feet).<br />
Eastern North Pacific Storm,<br />
January 19-21: A 1000 mb frontal<br />
wave of low pressure formed near 30N<br />
160E early on January 17th and moved<br />
to the central waters on the night of<br />
the 18 th while rapidly developing into<br />
a storm force low near 39N 165W with<br />
a 976 mb central pressure. The system<br />
gradually intensified further over the<br />
next two days while moving into the<br />
Gulf of Alaska and slowing (Figure<br />
9). The cyclone briefly developed<br />
hurricane force winds late on the 20 th<br />
before drifting north and weakening,<br />
and dissipating in the northeast Gulf<br />
of Alaska early on the 22 nd . At 0000<br />
UTC on the 20 th the APL Philippines<br />
(WCX 8884) near 40N 155W reported<br />
southwest winds of 55 kts and 13.4<br />
meter seas (44 feet). At 2000 UTC on<br />
the 20 th the Polar Resolution (WDJK)<br />
encountered east winds of 60 kts and<br />
12.2 meter seas (40 feet). Four hours<br />
later the North Star (KIYI) reported<br />
east winds of 50 kts and 12.0 meter<br />
seas (39 feet). Then the Hanjin<br />
Copenhagen (DHDM) near 54N 143W<br />
at 1800 UTC on the 21 st encountered<br />
northwest winds of 60 kts and 9.0 meter<br />
seas (30 feet).<br />
Eastern North Pacific Storm,<br />
January 21-22: Low pressure formed<br />
near 34N 175E with a 996 mb pressure<br />
early on January 19th and moved to<br />
42N 157W as the 993 mb developing<br />
storm two days later (Figure 9). The<br />
cyclone deepened <strong>by</strong> 24 mb over the<br />
next twenty four hours and briefly<br />
developed hurricane force winds <strong>by</strong><br />
1800 UTC on the 22 nd off Vancouver<br />
Island. Figure 10 shows a compact<br />
system just prior to moving inland<br />
over British Columbia. Figure 11 is<br />
a high resolution ASCAT image with<br />
parts of two passes showing winds to<br />
60 kts south of the center and also in the<br />
southeast flow near Vancouver Island.<br />
The Sea-Land Intrepid (WDB9949)<br />
near 46N 135W reported northwest<br />
winds of 60 kts at 1200 UTC on the<br />
22 nd . The Maui (WSLH) encountered<br />
southeast winds of 50 kts and 8.2 meter<br />
seas (27 feet) near 48N 125W at 1800<br />
UTC on the 22 nd . Buoy 46207 (50.9N<br />
129.9W) reported southeast winds of 43<br />
kts with gusts to <strong>56</strong> kts at 1800 UTC on<br />
the 22 nd and seas as high as 9.5 meters<br />
(31 feet) three hours later. Buoy 46206<br />
(48.8N 126.0W) reported southwest<br />
winds of 43 kts with gusts to 60 kts at<br />
0000 UTC on the 23 rd and seas as high<br />
as 8.5 meters (28 feet).<br />
North Pacific Storms, January<br />
21-25: A gale force low near 29N<br />
161E (Figure 9) move northeast and<br />
intensified into the 968 mb hurricane<br />
force low 39N 173W shown in Figure<br />
10. The central pressure fell 30 mb in<br />
the twenty four hour period ending at<br />
0000 UTC on the 23 rd . At 1200 UTC on<br />
the 23 rd the cyclone developed a lowest<br />
central pressure of 962 mb near 41N<br />
169W. An ASCAT high resolution pass<br />
from 0637 UTC on the 23 rd showed a<br />
partial view of the south side of the<br />
cyclone with southwest winds to 60 kts.<br />
Twenty four hours later, there were two<br />
hurricane force lows with the primary<br />
low 47N 148W with a 966 mb central<br />
pressure and a secondary center to the<br />
northeast near 54N 135W with a 964<br />
mb pressure. Both weakened on the<br />
24 th with the second center becoming<br />
absorbed and the main low moving<br />
inland over Southeast Alaska <strong>by</strong> the<br />
25 th . The Canadian buoy 46185 (52.4N<br />
129.8W) reported southeast winds of 47<br />
kts with gusts to 60 kts at 1000 UTC<br />
on the 24 th and highest seas 10.5 meters<br />
(34 feet) two hours later. Buoy 46004<br />
(50.9N 136.1W) reported west winds 47<br />
kts with gusts to 62 kts at 0200 UTC on<br />
the 25 th and seas reaching 9.0 meters (30<br />
feet) four hours later.<br />
North Pacific Storm, January 26-29:<br />
The next major storm was a developing<br />
cyclone that moved from off Japan on<br />
the 24 th east northeast and developed<br />
hurricane force winds mainly over<br />
the western waters, with the center<br />
developing a lowest central pressure of<br />
952 mb near 44N 165E at 1200 UTC on<br />
the 27 th . The central pressure dropped<br />
35 mb in the twenty four hour period<br />
ending at 0600 UTC on the 27 th . A<br />
WINDSAT image from 1941 UTC on<br />
the 27 th revealed west winds to 60 kts<br />
in a partial coverage of the south side of<br />
the cyclone. See Reference 5 for more<br />
information on WINDSAT and other
satellite wind products. The system<br />
reached the central Aleutians late on the<br />
29 th but <strong>by</strong> then its winds were down to<br />
gale force. It passed south of the eastern<br />
Aleutians on February 1 and became<br />
absorbed <strong>by</strong> low pressure passing to<br />
the east.<br />
North Pacific Storm, February 9-11:<br />
The development of the second most<br />
intense cyclone of the period from a<br />
weak low pressure wave over a thirty<br />
six hour period is depicted in Figure<br />
12. During the first twenty four<br />
hours the central pressure dropped<br />
43 mb. Hurricane force conditions<br />
accompanied the low mainly on the<br />
10 th . Figure 13 is an ASCAT image<br />
near the time of maximum intensity<br />
showing winds to 60 kts in a partial<br />
view of the south side of the circulation.<br />
The ship A8HS4 near 36N 167W<br />
reported southwest winds of 50 kts and<br />
9.0 meter seas (30 feet) at 1200 UTC on<br />
the 10 th . At 1000 UTC on the 11 th the<br />
ship KF001 (55N 159W) encountered<br />
east winds of 50 kts. The cyclone<br />
subsequently originating in the far<br />
southern waters near the dateline early<br />
on February 5th, this cyclone developed<br />
a compact circulation with hurricane<br />
force winds on the 6 th near 36N 166W<br />
with a 976 mb central pressure.<br />
ASCAT imagery from 2157 UTC on the<br />
6 th revealed some 50 kts wind retrievals<br />
south of the center near 33N 164W. The<br />
cyclone subsequently weakened while<br />
approaching southwestern Alaska on<br />
the 11 th and dissipated inland on the 12 th .<br />
North Pacific Storm, February 12-<br />
15: The rapid development of this<br />
cyclone over a twenty four hour period<br />
is displayed in Figure 14. Like the<br />
January 944 mb low in the northwestern<br />
Pacific this low deepened 48 mb in<br />
twenty four hours and attained the<br />
same lowest pressure, but it occurred in<br />
a different part of the Pacific. OSCAT<br />
imagery in Figure 15 reveals a relatively<br />
compact circulation with highest winds<br />
70 kts south of the low and some storm<br />
force winds ahead of the occluded front<br />
on the north side. The Green Ridge<br />
(WZZF) encountered southwest winds<br />
of 55 kts near 38N 174W at 1100 UTC<br />
on the 13 th . Hurricane force winds<br />
lasted from the 13 th to early on the 14 th .<br />
Satellite radar altimeter imagery in<br />
Figure 16 has a center pass through the<br />
storm and includes a significant wave<br />
height of almost 49 feet (14.9 meters)<br />
near 45N 170W on the south side of the<br />
cyclone. The cyclone then stalled and<br />
weakened near the eastern Aleutians on<br />
the 15 th and 16 th before dissipating late<br />
on the 16 th .<br />
North Pacific and Bering Sea Storm,<br />
February 23-26: This event originated<br />
as a wave of low pressure over Japan<br />
late on February 22. It moved over<br />
the northwestern Pacific waters east<br />
of the Kurile Islands where it briefly<br />
developed hurricane force winds on the<br />
24 th and a lowest central pressure of 962<br />
mb at 1800 UTC on the 24 th . A high<br />
resolution ASCAT image from 1057<br />
UTC on the 24 th revealed west winds to<br />
60 kts in a partial view of the south side<br />
of the cyclone and was similar to Figure<br />
13 for the February 9-11 storm. The<br />
Hanjin Philadelphia (A8CN8) near<br />
53N 173E reported southeast winds of<br />
50 kts and 5.2 meter seas (17 feet) at<br />
1800 UTC on the 24 th . The buoy 46070<br />
(55.1N 175.3E) reported northeast<br />
winds 43 kts with gusts to 54 kts at<br />
1500 UTC February 25 and seas up to<br />
10.0 meters (33 feet) seven hours later.<br />
The cyclone subsequently weakened<br />
slowly and expanded in area, passed<br />
through the southern Bering Sea as a<br />
gale force low on the 26 th and then re<br />
formed in the northern Gulf of Alaska<br />
on the 27 th before dissipating at the end<br />
of the month.<br />
Northeastern Pacific Storm, March<br />
7-9: A stalled gale force low in the<br />
southeastern waters near 34N 153W at<br />
0600 UTC March 6th was allowed to<br />
lift to the north-northeast as a ridge to<br />
the north weakened. The low rapidly<br />
intensified and moved to 49N 145W<br />
with a 980 mb center and hurricane<br />
force winds at 1200 UTC on the 8 th .<br />
The central pressure fell 30 mb in the<br />
preceding twenty four hours. High<br />
resolution ASCAT imagery from<br />
2023 UTC on the 8 th revealed a swath<br />
of west winds 50 kts south of the low.<br />
The M/V Manukai (WRGD) reported<br />
northwest winds of 50 kts and 6.7 meter<br />
seas (22 feet) near 46N 152W at 0000<br />
UTC on the 8 th , followed <strong>by</strong> a report<br />
of seas 11.6 meters (38 feet) near 45N<br />
149W six hours later. The Alaskan<br />
Navigator (WDC6644) near 51N 137W<br />
encountered southwest winds of 50 kts<br />
and 8.5 meter seas (28 feet) at 0000<br />
UTC on the 9 th . The cyclone weakened<br />
beginning late on the 8 th and dissipated<br />
near 60N 147W March 9th.<br />
North Pacific and Bering Sea Storm,<br />
March 9-13: Figure 17 depicts the<br />
development of this cyclone over<br />
a 48 hour period. It was already a<br />
storm when passing east of Japan and<br />
developed hurricane force winds late<br />
on the 11 th as the center passed near<br />
49N 165E. A 25 km ASCAT pass<br />
from 1007 UTC on the 12 th , close to<br />
the time of maximum intensity, shows<br />
winds to 60 kts on the south side and is<br />
similar in appearance to Figure 13 for<br />
the February 9-11 event. The Moran<br />
(4XIM) near 54N 164E reported north<br />
winds of 55 kts and 12.5 meter seas (41<br />
feet) at 0600 UTC March 12th, while<br />
the APL China (WDB3161) near 52.5N<br />
165E encountered north winds of 50<br />
kts and 10.7 meter seas (35 feet). The<br />
Kobe Express (DGSE) near 35N 144E<br />
41<br />
North pacific Area<br />
<strong>December</strong> <strong>2012</strong> ~ Mariners Weather Log
North pacific Area<br />
<strong>December</strong> <strong>2012</strong> ~ Mariners Weather Log<br />
42<br />
reported northeast winds of 55 kts and<br />
9.8 meter seas (32 feet) at 0600 UTC on<br />
the 10 th . Buoy 46035 (57.1N 177.8W)<br />
reported east winds of 45 kts with gusts<br />
to 54 kts at 1200 UTC on the 12 th and,<br />
eleven hours later, seas reaching 8.0<br />
meters (26 feet). The system turned<br />
toward the east and weakened while<br />
crossing the southern Bering Sea on the<br />
12 th and 13 th then dissipated in the Gulf<br />
of Alaska on the 14 th .<br />
Northeastern Pacific Storm, March<br />
18-20: The development of this<br />
cyclone over a thirty six hour period is<br />
shown in Figure 18. The second part<br />
of Figure 18 shows the hurricane force<br />
low at maximum intensity in terms<br />
of pressure. The Overseas Boston<br />
(WJBU) near 51N 133W reported south<br />
winds of 60 kts and 8.5 meter seas (28<br />
feet) at 0600 UTC on the 20 th , followed<br />
<strong>by</strong> a report of northwest winds 70 kts<br />
near 50N 132W six hours later. The<br />
Horizon Anchorage (KGTX) near 49N<br />
129W encountered seas of 11.9 meters<br />
(39 feet) along with southwest winds 35<br />
kts at 1800 UTC March 20. The buoy<br />
46036 (48.4N 133.9W) reported west<br />
winds of 43 kts with gusts to 54 kts at<br />
0900 UTC on the 20 th , and one hour<br />
prior, seas as high as 11.5 meters 38<br />
feet). The cyclone then moved onshore<br />
over Southeast Alaska and weakened<br />
rapidly late on the 20 th .<br />
Eastern North Pacific Storm,<br />
March 29-31: The first is shown fully<br />
developed as a hurricane force low<br />
off Northern California in Figure 19.<br />
It originated in the Sea of Okhotsk on<br />
the 24 th and tracked southeast and then<br />
east across the North Pacific and did<br />
not intensify until it crossed 160W. It<br />
is at maximum intensity in Figure 19.<br />
A 25 km OSCAT image 0914 UTC<br />
reveals northwest winds to 70 kts on<br />
the southwest side of the low and winds<br />
as high as 55 kts ahead of the occluded<br />
front. The Ever Diamond (3FQJ8) near<br />
38N 160W reported northwest winds<br />
of 45 kts and 8.5 meter seas (28 feet) at<br />
0300 UTC on the 30 th . The ship WRTF<br />
(44N 129W) encountered east winds<br />
of 55 kts at 0900 UTC on the 31 st . The<br />
cyclone then moved inland over Oregon<br />
and weakened on the night of the 31 st .<br />
North Pacific Storm, March 30-April<br />
2: This major storm was the most<br />
intense in the eastern Pacific during<br />
the period. It originated near 30N 159E<br />
at 1800 UC March 29 and tracked east<br />
northeast and developed storm force<br />
winds after crossing 180W. Figure<br />
19, Figure 20 and Figure 21 show the<br />
final forty eight hours of development.<br />
The central pressure dropped 38 mb in<br />
the twenty four hour period ending at<br />
0600 UTC April 2nd. High resolution<br />
ASCAT data from a 2026 UTC April<br />
1st pass showed winds 50 to 60 kts in<br />
the south semicircle. The Westwood<br />
Columbia (C6SI4) reported east winds<br />
of 55 kts near 53N 138W at 0500 UTC<br />
April 2nd. The Nighthawk (V7VR4)<br />
near 52N 136W encountered southwest<br />
winds of 50 kts and 10.4 meter seas (34<br />
feet). The Polar Resolution (WDJK)<br />
reported south winds of 50 kts and 11.3<br />
meter seas (37 feet). After reaching peak<br />
intensity the cyclone drifted toward<br />
Southeast Alaska and weakened to a<br />
gale <strong>by</strong> early on the 3 rd and then turned<br />
southeast and dissipated southwest of<br />
Vancouver Island on the 5 th .<br />
Western North Pacific Storm, April<br />
2 4: A rapidly intensifying low moved<br />
northeast across the Sea of Japan and<br />
northern Japan late on April 2 nd and on<br />
the 3 rd , reaching a peak intensity of 9<strong>56</strong><br />
mb in the southern Sea of Okhotsk at<br />
0600 UTC on the 4 th . Also see Figure<br />
22. The central pressure dropped 30 mb<br />
in the twenty four hour period ending<br />
at 0000 UTC on the 4 th . The OSCAT<br />
image in Figure 23 shows some wind<br />
vectors up to 80 kts in the Sea of Japan,<br />
the highest seen during this period<br />
in OSCAT imagery. The Sea-Land<br />
Charger (WDB9948) near 37N 146E<br />
reported seas of 10.4 meters (34 feet)<br />
at 1700 UTC April 3rd. The Lutoga<br />
(UFLC) reported west winds of 60 kts<br />
near 45N 145E at 1200 UTC on the<br />
4 th . The Admiral Makarov (UGSN)<br />
encountered northwest winds of 60 kts<br />
near 50N 141E at 0000 UTC on the 5 th .<br />
The cyclone lingered over the southern<br />
Sea of Okhotsk from the 5 th into the<br />
7 th while weakening and then moved<br />
east and dissipated near the western<br />
Aleutians <strong>by</strong> the 9 th .<br />
Northeastern Pacific Storms, May<br />
5 6 and 11 12: A developing wave of<br />
low pressure near 34N 174W at 0000<br />
UTC on the 4 th moved northeast and<br />
briefly developed storm force winds in<br />
the Gulf of Alaska as it intensified into<br />
a 994 mb low near 57N 145W at 1200<br />
UTC on the 6 th before weakening inland<br />
the following night. The Prince of<br />
Wales (WDA6378) reported southeast<br />
winds of 50 kts and 2.5 meter seas (8<br />
feet) near 55.4N 132.1W at 1800 UTC on<br />
the 6 th . At 0000 UTC May 11 th another<br />
developing wave formed near 42N<br />
155W and briefly became a storm near<br />
<strong>56</strong>N 140W with a 996 mb center at 0600<br />
UTC on the 12 th before moving inland<br />
the following morning. Buoy 46083<br />
(58.2N 138.0W) reported a southeast<br />
wind of 37 kts with gusts to 51 kts at<br />
1300 UTC on the 12 th and seas as high<br />
as 6.5 meters (21 feet) six hours later.<br />
At 1600 UTC on the 12 th the same buoy<br />
reported a southeast wind of 39 kts.
VOS Program Awards<br />
Norwegian Jade won a 2011 VOS Award with an outstanding total of 1,468 valuable marine observations! This was a<br />
new ship’s record and their 3rd consecutive VOS Award.<br />
in the photo<br />
1st Officer - robert hammerin<br />
St. Captain - Jonas Kruger<br />
Ch. Officer - Niklas Nordlund<br />
2nd Officer - ray Flores<br />
2nd Officer - restituto Padilla<br />
Captain - Mikael hilden<br />
3rd Officer - Santiago Filevich<br />
1st Officer/Navigation - ricardo Anguizola<br />
VOS Award for the Norwegian Spirit:<br />
pictured left to right:<br />
2nd Officer Collen Engada,<br />
2nd Officer Edler Bongo,<br />
1st Officer Safety Eduardo Peralta<br />
and 3rd Officer Pio Punzalan.<br />
PMO Dave Jones, Navigator Dennis reddy<br />
and Staff Captain Matko Candrlic<br />
43<br />
VOS program Awards<br />
<strong>December</strong> <strong>2012</strong> ~ Mariners Weather Log
VOS program Awards<br />
<strong>December</strong> <strong>2012</strong> ~ Mariners Weather Log<br />
44<br />
VOS Program Awards<br />
Captain Barry Costanzi and<br />
1/O Steve itson, not pictured<br />
2/O Paul grepo and 3/O Jack<br />
Walker of the horizon reliance<br />
receive the 2011 VOS award<br />
in recognition of outstanding<br />
performance in the Voluntary<br />
Observing Ship program of the<br />
United States of America.<br />
Discoverer Clear Leader:<br />
From left to right:<br />
Capt. John Anderson<br />
PMO New Orleans Dave Jones<br />
Senior DPO Marty White<br />
3rd Mate Clyde Myers<br />
3rd Mate Chris Lafrenaye<br />
Cadet Jeff Lencioni<br />
2nd Mate Bill Kelleher
VOS Program Awards<br />
Captain McCarthy, 1/O Chris Luck and Eric Sinkevitch receiving the 2011 VOS award in recognition of hOriZON<br />
SPiriT’s outstanding performance in the Voluntary Observing Ship program.<br />
Also pictured receiving the 2011 VOS award for the<br />
horizon Spirit, 2/M Chris groark<br />
45<br />
VOS program Awards<br />
<strong>December</strong> <strong>2012</strong> ~ Mariners Weather Log
VOS program Awards<br />
<strong>December</strong> <strong>2012</strong> ~ Mariners Weather Log<br />
46<br />
VOS Program Awards<br />
Congratulations go out to the MAUNAWiLi for their outstanding performance, receiving the 2011 VOS award.<br />
Pictured from left to right:<br />
William Palmer, PMO Brian holmes, 1/O Dawai Chang<br />
Not pictured: Captain Brian McNamara, 2/O gary Frame and 3/O Kyra Moon<br />
Cargo Ship Optimana won<br />
a 2011 VOS Award with<br />
an excellent total of 849<br />
marine observations! They<br />
have a worldwide itinerary.<br />
This was a new ship’s<br />
record.<br />
Starting from left:<br />
3/O gilbert Cometa,<br />
C/M robert O. Omlas<br />
CaptainOrlando D. Manicio<br />
2/O ronald ian A. Juntado
VOS Program Awards<br />
Maerski Utah crew.<br />
Pictured are, from right to left:<br />
Captain robert Sienel, Deck Cadet Joshua Asaro, Chief Mate<br />
Matthew Bakis, 2nd Mate Bruce Forbush, 3rd Mate Sea Chan.<br />
47<br />
VOS program Awards<br />
<strong>December</strong> <strong>2012</strong> ~ Mariners Weather Log
VOS program New recruits<br />
<strong>December</strong> <strong>2012</strong> ~ Mariners Weather Log<br />
48<br />
National Weather Service<br />
VOS Program New recruits:<br />
June 1 through September 30, <strong>2012</strong><br />
Ship Name Call SigN<br />
Affinity 9VDT5<br />
Algocanada CFN5193<br />
Am Point Lisas A8XD2<br />
American Courage WDD2879<br />
APL holland 9VKQ2<br />
APL Oman 9VMJ4<br />
Atlantic hope VrDT5<br />
Axel Maersk OUUY2<br />
Bergamot Ace ZgAS5<br />
Clementine Maersk OUQK2<br />
Davidson 5NLQ<br />
Eagle Kuching 9V8132<br />
Fennica OJAD<br />
glen Canyon Bridge 3EFD9<br />
global Spirit ELTL3<br />
harvey Explorer WDB4217<br />
John B. Aird VCYP<br />
Kaan Kalkavan TCTX2<br />
Maersk Texas WMLF<br />
Marvellous VrJi2<br />
Ship Name Call SigN<br />
McKee Sons WCZ9703<br />
MOL Majesty V7SV4<br />
MOL Modern V7V<strong>56</strong><br />
MOL Motivator V7Vg6<br />
Nordica OJAE<br />
NYK Artemis hOVU<br />
NYK rosa 3FJM9<br />
Ocean giant WDg4379<br />
ranger WBN5979<br />
Sisuaq WDg2721<br />
Star Kirkenes LAhr7<br />
Tawa Arrow 3ErO4<br />
Tiger 9hA2271<br />
TOr Viking ii SLiT<br />
Tug Michigan WDF5344<br />
Unique guardian VrJM6<br />
Vega Dream 7JhY<br />
Yorktown WDg3446<br />
Zim Yokohama A8MY4<br />
The Cooperative Ship reports can now<br />
be found online <strong>by</strong> clicking here.
Points of Contact<br />
U.S. Port Meteorological<br />
Officers<br />
HEADqUARTERS<br />
John Wasserman<br />
Voluntary Observing Ship Program<br />
Manager<br />
National Data Buoy Center<br />
Building 3203<br />
Stennis Space Center, MS 39529-6000<br />
Tel: 228-688-1818<br />
Fax: 228-688-3923<br />
E-mail: john.wasserman@noaa.gov<br />
Paula Rychtar<br />
Voluntary Observing Ship Operations<br />
Manager<br />
National Data Buoy Center<br />
Building 3203<br />
Stennis Space Center, MS 39529-6000<br />
Tel: 228-688-1457<br />
Fax: 228-688-3923<br />
E-mail: paula.rychtar@noaa.gov<br />
ATlANTIC PORTS<br />
David Dellinger, PMO<br />
National Weather Service, NOAA<br />
2550 Eisenhower Blvd, Suite 312<br />
P.O. Box 350067<br />
Port Everglades, FL 33335<br />
Tel: 954-463-4271<br />
Fax: 954-462-8963<br />
E-mail: david.dellinger@noaa.gov<br />
Robert Niemeyer, PMO<br />
National Weather Service, NOAA<br />
13701 Fang road<br />
Jacksonville, FL 32218-7933<br />
Tel: 904-741-5186 Ext. 117<br />
Fax: 904-741-0078<br />
E-mail: rob.niemeyer@noaa.gov<br />
Tim Kenefick, PMO<br />
NOAA Coastal Services Center<br />
2234 South hobson Avenue<br />
Charleston, SC 29405-2413<br />
Tel: 843-709-0102<br />
Fax: 843-740-1289<br />
E-mail: timothy.kenefick@noaa.gov<br />
Peter Gibino, PMO<br />
National Weather Service, NOAA<br />
4034-B geo. Wash. Mem. hwy.<br />
Yorktown, VA 23692-2724<br />
Tel: 757-617-0897<br />
Fax: 757-877-9<strong>56</strong>1<br />
E-mail: peter.gibino@noaa.gov<br />
lori Evans, PMO<br />
National Weather Service, NOAA<br />
Maritime Center i, Suite 287<br />
2200 Broening highway<br />
Baltimore, MD 21224-6623<br />
Tel: 443-642-0760<br />
Fax: 410-633-4713<br />
E-mail: lori.evans@noaa.gov<br />
Jim luciani, PMO<br />
New York/New Jersey<br />
National Weather Service, NOAA<br />
110 Main Street, Suite 201<br />
South Amboy, NJ 08879-1367<br />
Tel: 908-217-3477<br />
Fax: 732-316-7643<br />
E-mail: james.luciani@noaa.gov<br />
GREAT lAKES PORTS<br />
Ron Williams, PMO<br />
National Weather Service, NOAA<br />
5027 Miller Trunk highway<br />
Duluth, MN 55811-1442<br />
Tel 218-729-0651<br />
Fax 218-729-0690<br />
E-mail: ronald.williams@noaa.gov<br />
GUlF OF MExICO PORTS<br />
VACANT<br />
PMO New Orleans<br />
62300 Airport rd.<br />
Slidell, LA 70460-5243<br />
Tel:<br />
Fax:<br />
E-mail:<br />
Chris Fakes, PMO<br />
National Weather Service, NOAA<br />
1353 FM646<br />
Suite 202<br />
Dickinson, TX 77539<br />
Tel: 281-534-2640 Ext. 277<br />
Fax: 281-534-4308<br />
E-mail: chris.fakes@noaa.gov<br />
PACIFIC PORTS<br />
Derek leeloy, PMO<br />
Ocean Services Program Coordinator<br />
National Weather Service Pacific region<br />
hQ<br />
grosvenor Center, Mauka Tower<br />
737 Bishop Street, Suite 2200<br />
honolulu, hi 96813-3201<br />
Tel: 808-532-6439<br />
Fax: 808-532-5<strong>56</strong>9<br />
E-mail: derek.leeloy@noaa.gov<br />
Brian Holmes, PMO<br />
National Weather Service, NOAA<br />
501 West Ocean Blvd., room 4480<br />
Long Beach, CA 90802-4213<br />
Tel: <strong>56</strong>2-980-4090<br />
Fax: <strong>56</strong>2-436-1550<br />
E-mail: brian.holmes@noaa.gov<br />
VACANT<br />
National Weather Service, NOAA<br />
1301 Clay Street, Suite 1190N<br />
Oakland, CA 94612-5217<br />
Tel: 510-637-2960<br />
Fax: 510-637-2961<br />
E-mail:<br />
Matt Thompson, PMO<br />
National Weather Service, NOAA<br />
7600 Sand Point Way, N.E.,<br />
BiN C15700<br />
Seattle, WA 98115-6349<br />
Tel: 206-526-6100<br />
Fax: 206-526-6904<br />
E-mail: matthew.thompson@noaa.gov<br />
Richard Courtney, PMO<br />
National Weather Service, NOAA<br />
600 Sandy hook Street, Suite 1<br />
Kodiak, AK 99615-6814<br />
Tel: 907-487-2102<br />
Fax: 907-487-9730<br />
E-mail: richard.courtney@noaa.gov<br />
VACANT<br />
National Weather Service<br />
NOAA,<br />
Box 427<br />
Valdez, AK 99686-0427<br />
Tel:<br />
Fax:<br />
E-mail:<br />
larry Hubble, PMO<br />
National Weather Service Alaska region<br />
222 West 7th Avenue #23<br />
Anchorage, AK 99513-7575<br />
Tel: 907-271-5135<br />
Fax: 907-271-3711<br />
E-mail: larry.hubble@noaa.gov<br />
49<br />
points of Contact<br />
<strong>December</strong> <strong>2012</strong> ~ Mariners Weather Log
points of Contact<br />
<strong>December</strong> <strong>2012</strong> ~ Mariners Weather Log<br />
50<br />
U.S. Coast<br />
Guard AMVER<br />
Center<br />
Ben Strong<br />
AMVEr Maritime relations Officer, United<br />
States Coast guard<br />
Battery Park Building<br />
New York, NY 10004<br />
Tel: 212-668-7762<br />
Fax: 212-668-7684<br />
E-mail: bmstrong@batteryny.uscg.mil<br />
SEAS Field<br />
Representatives<br />
AOMl SEAS PROGRAM<br />
MANAGER<br />
Dr. Gustavo Goni<br />
AOML<br />
4301 rickenbacker Causeway<br />
Miami, FL 33149-1026<br />
Tel: 305-361-4339<br />
Fax: 305-361-4412<br />
E-mail: gustavo.goni@noaa.gov<br />
DRIFTER PROGRAM MANAGER<br />
Dr. Rick lumpkin<br />
AOML/PhOD<br />
4301 rickenbacker Causeway<br />
Miami, FL 33149-1026<br />
Tel: 305-361-4513<br />
Fax: 305-361-4412<br />
E-mail: rick.lumpkin@noaa.gov<br />
ARGO PROGRAM MANAGER<br />
Dr. Claudia Schmid<br />
AOML/PhOD<br />
4301 rickenbacker Causeway<br />
Miami, FL 33149-1026<br />
Tel: 305-361-4313<br />
Fax: 305-361-4412<br />
E-mail: claudia.schmid@noaa.gov<br />
GlOBAl DRIFTER PROGRAM<br />
Shaun Dolk<br />
AOML/PhOD<br />
4301 rickenbacker Causeway<br />
Miami, FL 33149-1026<br />
Tel: 305-361-4446<br />
Fax: 305-361-4366<br />
E-mail: shaun.dolk@noaa.gov<br />
NORTHEAST ATlANTIC SEAS<br />
REP.<br />
Jim Farrington<br />
SEAS Logistics/AMC<br />
439 West York Street<br />
Norfolk, VA 23510<br />
Tel: 757-441-3062<br />
Fax: 757-441-6495<br />
E-mail: james.w.farrington@noaa.gov<br />
SOUTHWEST PACIFIC SEAS REP.<br />
Carrie Wolfe<br />
Southern California Marine institute<br />
820 S. Seaside Avenue<br />
San Pedro, Ca 90731-7330<br />
Tel: 310-519-3181<br />
Fax: 310-519-1054<br />
E-mail: cwolfe@csulb.edu<br />
SOUTHEAST ATlANTIC SEAS REP.<br />
Francis Bringas<br />
AOML/gOOS Center<br />
4301 rickenbacker Causeway<br />
Miami, FL 33149-1026<br />
Tel: 305-361-4332<br />
Fax: 305-361-4412<br />
E-mail: francis.bringas@noaa.gov<br />
PACIFIC NORTHWEST SEAS REP.<br />
Steve Noah<br />
SEAS Logistics/PMC<br />
Olympic Computer Services, inc.<br />
Tel: 360-385-2400<br />
Cell: 425-238-6501<br />
E-mail: snoah@olycomp.com or karsteno@aol.com<br />
Other Port<br />
Meteorological<br />
Officers<br />
ARGENTINA<br />
Mario J. Garcia<br />
Jefe del Dto. redes<br />
Servicio Meteorlógico Nacional<br />
25 de Mayo 658 (C1002ABN)<br />
Buenos Aires<br />
Argentina<br />
Tel: +54-11 4514 1525<br />
Fax: +54-11 5167 6709<br />
E-mail: garcia@meteofa.mil.ar<br />
AUSTRAlIA<br />
Head Office<br />
Graeme Ball, Mgr.<br />
PMO Coordinator<br />
Marine Operations group<br />
Bureau of Meteorology<br />
gPO Box 1289<br />
Melbourne, ViC 3001, Australia<br />
Tel: +61-3 9669 4203<br />
Fax: +61 3 9669 4168<br />
E-mail: smmo@bom.gov.au<br />
group E-mail: marine_obs@bom.gov.au<br />
Fremantle<br />
Craig Foster, PMA<br />
Port Meteorological Officer Fremantle,<br />
Bureau of Meteorology<br />
PO Box 1370<br />
Perth, WA 6872, Australia<br />
Tel: +61-8 9263 2292<br />
Fax: +61 8 9263 2297<br />
E-mail: pma.fremantle@bom.gov.au<br />
Melbourne<br />
Brendan Casey, PMA<br />
c/o Bureau of Meteorology<br />
Port Meteorological Officer Melbourne,<br />
Bureau of Meteorology, gPO Box 1289<br />
Melbourne, ViC 3001, Australia<br />
Tel: +61-3 9669 4236<br />
Fax: +61-3 9669 4168<br />
E-mail: pma.melbourne@bom.gov.au
Sydney<br />
Matt Dunn, PMO<br />
c/o Bureau of Meteorology<br />
Port Meteorological Officer Sydney,<br />
Bureau of Meteorology, gPO Box 413<br />
Darlinghurst, NSW 1300<br />
Australia<br />
Tel: +61 2 9296 1553<br />
Fax: +61 2 9296 1648<br />
E-mail: pma.sydney@bom.gov.au<br />
CANADA<br />
Canadian Headquarters<br />
Gerie lynn lavigne, life Cycle Manager<br />
Marine Networks, Environment Canada<br />
Surface Weather, Climate and Marine<br />
Networks<br />
4905 Dufferin Street<br />
Toronto, Ontario<br />
Canada M3h 5T4<br />
Tel: +1-416 739 4<strong>56</strong>1<br />
Fax: +1-416 739 4261<br />
E-mail: gerielynn.lavigne@ec.gc.ca<br />
British Columbia<br />
Bruce lohnes, Monitoring Manager<br />
Environment Canada<br />
Meteorological Service of Canada<br />
140-13160 Vanier Place<br />
richmond, British Columbia V6V 2J2<br />
Canada<br />
Tel: +1-604-664-9188<br />
Fax: +1604-664-4094<br />
E-mail: _bruce.lohnes@ec.gc.ca<br />
Newfoundland<br />
Andrew Dwyer, PMO<br />
Environment Canada<br />
6 Bruce Street<br />
St John’s, Newfoundland A1N 4T3<br />
Canada<br />
Tel: +1-709-772-4798<br />
Fax: +1-709-772-5097<br />
E-mail: andre.dwyer@ec.gc.ca<br />
Nova Scotia<br />
Martin Maclellan<br />
A/Superintendent Port Meteorology &<br />
Data<br />
Buoy Program<br />
Environment Canada<br />
275 rocky Lake rd, Unit 8B<br />
Bedford, NS<br />
B4A 2T3<br />
Office: (902) 426-6616<br />
Cell: (902) 483-3723<br />
Fax: (902) 426-6404<br />
Ontario<br />
Tony Hilton, Supervisor PMO;<br />
Rick Shukster, PMO &<br />
Roland Kleer, PMO<br />
Environment Canada<br />
Meteorological Service of Canada<br />
100 East Port Blvd.<br />
hamilton, Ontario L8h 7S4 Canada<br />
Tel: +1-905 312 0900<br />
Fax: +1-905 312 0730<br />
E-mail: tony.hilton@ec.gc.ca<br />
roland.kleer@ec.gc.ca<br />
rick.shukster@ec.gc.ca<br />
Quebec<br />
Erich Gola, PMO<br />
Meteorological Service of Canada<br />
Quebec region<br />
Service météorologique du Canada<br />
Environnement Canada<br />
800 rue de la gauchetière Ouest, bureau<br />
7810<br />
Montréal (Québec) h5A 1L9 Canada<br />
Tel: +1-514 283-1644<br />
Cel: +1-514 386-8269<br />
Fax: +1-514 496-1867<br />
E-mail: erich.gola@ec.gc.ca<br />
CHINA<br />
YU Zhaoguo<br />
Shanghai Meteorological Bureau<br />
166 Puxi road<br />
Shanghai, China<br />
CROATIA<br />
Port of Split<br />
Captain Zeljko Sore<br />
Marine Meteorological Office-Split<br />
P.O. Box 370<br />
glagoljaska 11<br />
hr-21000 Split<br />
Croatia<br />
Tel: +385-21 589 378<br />
Fax: +385-21 591 033 (24 hours)<br />
E-mail: sore@cirus.dhz.hr<br />
Port of Rijeka<br />
Smiljan Viskovic<br />
Marine Meteorological Office-rijeka<br />
riva 20<br />
hr-51000 rijeka<br />
Croatia<br />
Tel: +385-51 215 548<br />
Fax: +385-51 215 574<br />
DENMARK<br />
Cmdr Roi Jespersen, PMO &<br />
Cmdr Harald R. Joensen, PMO<br />
Danish Meteorological inst., Observation<br />
Dept<br />
Surface and Upper Air Observations<br />
Division<br />
Lyng<strong>by</strong>vej 100<br />
DK-2100 Copenhagen<br />
Denmark<br />
Tel: +45 3915 7337<br />
Fax: +45 3915 7390<br />
E-mail: rj@dmi.dk<br />
hrj@dmi.dk<br />
FAlKlANDS<br />
Captain R. Gorbutt, Marine Officer<br />
Fishery Protection Office<br />
Port Stanley<br />
Falklands<br />
Tel: +500 27260<br />
Fax: +500 27265<br />
Telex: 2426 FiShDir FK<br />
51<br />
points of Contact<br />
<strong>December</strong> <strong>2012</strong> ~ Mariners Weather Log
points of Contact<br />
<strong>December</strong> <strong>2012</strong> ~ Mariners Weather Log<br />
52<br />
FRANCE<br />
Headquarters<br />
André Péries, PMO Supervisor<br />
Météo-France DSO/rESO/PMO<br />
42, Avenue gustave Coriolis<br />
31057 Toulouse Cédex<br />
France<br />
Tel: +33-5 61 07 98 54<br />
Fax: +33-5 61 07 98 69<br />
E-mail: andre.peries@meteo.fr<br />
Boulogne-sur-mer<br />
Gérard Doligez<br />
Météo-France DDM62<br />
17, boulevard Sainte-Beuve<br />
62200 Boulogne-sur-mer<br />
France<br />
Tel: +33-3 21 10 85 10<br />
Fax: +33-2 21 33 33 12<br />
E-mail: gerard.doligez@meteo.fr<br />
Brest<br />
louis Stéphan, Station Météorologique<br />
16, quai de la douane29200 Brest<br />
France<br />
Tel: +33-2 98 44 60 21<br />
Fax: +33-2 98 44 60 21<br />
La Réunion<br />
Yves Morville, Station Météorologique<br />
Port réunion<br />
France<br />
Fax: +262 262 921 147<br />
Telex: 916797rE<br />
E-mail: dirre@meteo.fr<br />
meteo.france.leport@wanadoo.fr<br />
Le Havre<br />
Andre Devatine, Station Météorologique<br />
Nouveau Sémaphore<br />
Quai des Abeilles<br />
76600 Le havre<br />
France<br />
Tel: +33-2 32 74 03 65<br />
Fax: +33 2 32 74 03 61<br />
E-mail: andre.devatine@meteo.fr<br />
Marseille<br />
Michel Perini, PMO<br />
Météo-France / CDM 13<br />
2A BD du Château-Double<br />
13098 Aix en Provence Cédex 02<br />
France<br />
Tel: +00 33 (0)4 42 95 25 42<br />
Fax: +00 33 (0)4 42 95 25 49<br />
E-mail: michel.perini@meteo.fr<br />
Montoir de Bretagne<br />
Jean Beaujard, Station Météorologique<br />
Aérodome de Saint-Nazaire-Montoir<br />
44550 Montoir de Bretagne<br />
France<br />
Tel: +33-2 40 17 13 17<br />
Fax: +33-2 40 90 39 37<br />
New Caledonia<br />
Henri lévèque, Station Météorologique<br />
BP 151<br />
98845 Noumea Port<br />
New Caledonia<br />
France<br />
Tel: +687 27 30 04<br />
Fax: +687 27 42 95<br />
GERMANY<br />
Headquarters<br />
Volker Weidner, PMO Advisor<br />
Deutscher Wetterdienst<br />
Bernhard-Nocht-Strasse 76<br />
D-20359 hamburg<br />
germany<br />
Tel: +49-40 6690 1410<br />
Fax: +49-40 6690 1496<br />
E-mail: pmo@dwd.de<br />
Bremerhaven<br />
Henning Hesse, PMO<br />
Deutscher Wetterdienst<br />
An der Neuen Schleuse 10b<br />
D-27570 Bremerhaven<br />
germany<br />
Tel: +49-471 70040-18<br />
Fax: +49-471 70040-17<br />
E-mail: pmo@dwd.de<br />
Hamburg<br />
Horst von Bargen, PMO<br />
Matthias Hoigt<br />
Susanne Ripke<br />
Deutscher Wetterdienst<br />
Met. hafendienst<br />
Bernhard-Nocht-Str. 76<br />
D - 20359 hamburg<br />
Tel: +49 40 6690 1412/1411/1421<br />
Fax: +49 40 6690 1496<br />
E-mail: pmo@dwd.de<br />
Rostock<br />
Christel Heidner, PMO<br />
Deutscher Wetterdienst<br />
Seestr. 15a<br />
D - 18119 rostock<br />
Tel: +49 381 5438830<br />
Fax: +49 381 5438863<br />
E-mail: pmo@dwd.de<br />
Gilbraltar<br />
Principal Meteorological Officer<br />
Meteorological Office<br />
rAF gilbraltar BFPO 52<br />
gilbraltar<br />
Tel: +350 53419<br />
Fax: +350 53474<br />
GREECE<br />
Michael Myrsilidis<br />
Marine Meteorology Section<br />
hellenic National Meteorological Service<br />
(hNMS)<br />
El, Venizelou 14<br />
16777 hellinikon<br />
Athens<br />
greece<br />
Tel: +30-10 9699013<br />
Fax: +30-10 9628952, 9649646<br />
E-mail: mmirsi@hnms.gr<br />
HONG KONG, CHINA<br />
Wing Tak Wong, Senior Scientific Officer<br />
hong Kong Observatory<br />
134A Nathan road<br />
Kowloon<br />
hong Kong, China<br />
Tel: +852 2926 8430<br />
Fax: +852 2311 9448<br />
E-mail: wtwong@hko.gov.hk
ICElAND<br />
Hreinn Hjartarson, Icelandic Met. Office<br />
Bústadavegur 9<br />
iS-150 reykjavik<br />
iceland<br />
Tel: +354 522 6000<br />
Fax: +354 522 6001<br />
E-mail: hreinn@vedur.is<br />
INDIA<br />
Calcutta<br />
Port Meteorological Office<br />
Alibnagar, Malkhana Building<br />
N.S. Dock gate No. 3<br />
Calcutta 700 043<br />
india<br />
Tel: +91-33 4793167<br />
Chennai<br />
Port Meteorological Office<br />
10th Floor, Centenary Building<br />
Chennai Port Trust, rajaji road<br />
Chennai 600 001<br />
india<br />
Tel: +91-44 <strong>56</strong>0187<br />
Fort Mumbai<br />
Port Meteorological Office<br />
3rd Floor, New Labour hamallage Building<br />
Yellow gate, indira Doct<br />
Fort Mumbai 400 001<br />
india<br />
Tel: +91-2613733<br />
Goa<br />
PMO, Port Meteorological liaison Office<br />
Sada, P.O., head Land Sada<br />
goa 403 804<br />
india<br />
Tel: +91-832 520012<br />
Kochi<br />
Port Meteorological Office<br />
Cochin harbour, North End, Wellington<br />
island<br />
Kochi 682 009<br />
india<br />
Tel: +91-484 667042<br />
Visakhapatnam<br />
Port Meteorological Office<br />
c/o The Director, Cyclone Warning Centre<br />
Chinna Waltair<br />
Visakhapatnam 530 017.Andra Pradesh<br />
india<br />
Tel: +91-891 746506<br />
INDONESIA<br />
Belawan<br />
Stasiun Meteorologi Maritim Belawan<br />
Jl. raya Pelabuhan iii<br />
Belawan - 20414<br />
indonesia<br />
Tel: +62-21 6941851<br />
Fax: +62-21 6941851<br />
Bitung<br />
Stasiun Meteorologi Maritim Bitung<br />
Jl. Kartini No. 1<br />
Bitung - 95524<br />
indonesia<br />
Tel: +62-438 30989<br />
Fax: +62-438 21710<br />
Jakarta<br />
Mochamad Rifangi<br />
Meteorological and geophysical Agency<br />
Jl. Angkasa i No. 2 Kemayoran<br />
Jakarta - 10720<br />
indonesia<br />
Tel: +62-21 4246321<br />
Fax: +62-21 4246703<br />
Stasiun Meteorologi Maritim Tanjung<br />
Priok<br />
Jl. Padamarang Pelabuhan<br />
Tanjung Priok<br />
Jakarta - 14310<br />
indonesia<br />
Tel: +62-21 4351366<br />
Fax: +62-21 490339<br />
Makassar<br />
Stasiun Meteorologi Maritim Makassar<br />
Jl. Sabutung i No. 20 Paotere<br />
Makassar<br />
indonesia<br />
Tel: +62-411 319242<br />
Fax: +62-411 328235<br />
Semarang<br />
Stasiun Meteorologi Maritim Semarang<br />
Jl. Deli Pelabuhan<br />
Semarang - 50174<br />
indonesia<br />
Tel: +62-24 3549050<br />
Fax: +62-24 3559194<br />
Surabaya<br />
Stasiun Meteorologi Maritim Surabaya<br />
Jl. Kalimas baru No. 97B<br />
Surabaya - 60165<br />
indonesia<br />
Tel: +62-31 3291439<br />
Fax: +62-31 3291439<br />
IRElAND<br />
Cork<br />
Brian Doyle, PMO<br />
Met Eireann<br />
Cork Airport<br />
Cork<br />
ireland<br />
Tel: +353-21 4917753<br />
Fax: +353-21 4317405<br />
53<br />
points of Contact<br />
<strong>December</strong> <strong>2012</strong> ~ Mariners Weather Log
points of Contact<br />
<strong>December</strong> <strong>2012</strong> ~ Mariners Weather Log<br />
54<br />
Donegal<br />
Paddy Delaney, Station Manager<br />
Met Eireann<br />
Cork Airport<br />
Malinhead<br />
Lifford<br />
Co. Donegal<br />
ireland<br />
Dublin<br />
Columba Creamer, Marine Unit<br />
Met Eireann<br />
glasnevin hill<br />
Dublin 9<br />
ireland<br />
Mayo<br />
Andy Clohessy, Station Manager<br />
Connaught international Airport<br />
Charleston<br />
Co. Mayo<br />
IRElAND<br />
Wexford<br />
Dennis O. Mahoney, Station Manager<br />
Met Eireann<br />
rossiare harbour<br />
Wexford<br />
ireland<br />
Tel: +353-53 33113<br />
Fax: +353-53 33105<br />
E-mail: met.rossiarre@eircom.net<br />
ISRAEl<br />
Ashdod<br />
Aharon Ofir, PMO<br />
Marine Department<br />
Ashdod Port<br />
Tel: 972 8 85249<strong>56</strong><br />
Haifa<br />
Hani Arbel, PMO<br />
haifa Port<br />
Tel: 972 4 8664427<br />
JAPAN<br />
Headquarters<br />
Dr. Kazuhiko Hayashi, Scientific Officer<br />
Marine Div., Climate and Marine Dept.<br />
Japan Meteorological Agency<br />
1-3-4 Otemachi, Chiyoda-ku<br />
Tokyo, 100-8122<br />
Japan<br />
Tel: +81-3 3212 8341 ext. 5144<br />
Fax: +81-3 3211 6908<br />
Email: hayashik@met.kishou.go.jp<br />
VOS@climar.kishou.go.jp<br />
Kobe<br />
Port Meteorological Officer<br />
Kobe Marine Observatory<br />
1-4-3, Wakinohamakaigan-dori, Chuo-ku<br />
Kobe 651-0073<br />
Japan<br />
Tel: +81-78 222 8918<br />
Fax: +81-78 222 8946<br />
Nagoya<br />
Port Meteorological Officer<br />
Nagoya Local Meteorological Observatory<br />
2-18, hiyori-ho, Chigusa-ku<br />
Nagoya, 464-0039<br />
Japan<br />
Tel: +81-52 752 6364<br />
Fax: +81-52 762-1242<br />
Yokohama<br />
Port Meteorological Officer<br />
Yokohama Local Meteorological<br />
Observatory<br />
99 Yamate-cho, Naka-ku<br />
Yokohama, 231-0862<br />
Japan<br />
Tel: +81-45 621 1991<br />
Fax: +81-45 622 3520<br />
Telex: 2222163<br />
KENYA<br />
Ali Juma Mafimbo, PMO<br />
PO Box 98512<br />
Mombasa<br />
Kenya<br />
Tel: +254-11 22<strong>56</strong>87 / 433689<br />
Fax: +254-11 433689<br />
E-mail: mafimbo@lion.meteo.go.ke<br />
MAlASYA<br />
Port Bintulu<br />
Paul Chong Ah Poh, PMO<br />
Bintulu Meteorological Station<br />
P.O. Box 285<br />
97007 Bintulu<br />
Sarawak<br />
Malaysia<br />
Fax: +60-86 314 386<br />
Port Klang<br />
Mohd Shah Ani, PMO<br />
Malaysian Meteorological Service<br />
Jalan Sultan<br />
46667 Petaling Jaya<br />
Selangor<br />
Malaysia<br />
Fax: +60-3 7957 8046<br />
Port Kinabalu<br />
Mohd Sha Ebung, PMO<br />
Malaysian Meteorological Service<br />
7th Floor, Wisma Dang Bandang<br />
P.O. Box 54<br />
88995 Kota Kinabalu<br />
Sabah<br />
Malaysia<br />
Fax: +60-88 211 019<br />
MAURITUIS<br />
Port Louis<br />
Meteorological Services<br />
St. Paul road<br />
Vacoas<br />
Mauritius<br />
Tel: +230 686 1031/32<br />
Fax: +230 686 1033<br />
E-mail: meteo@intnet.mu
NETHERlANDS<br />
Bert de Vries, PMO &<br />
René Rozeboom, PMO<br />
KNMi, PMO-Office<br />
Wilhelminalaan 10<br />
Postbus 201<br />
3730 Ae de Bilt<br />
Netherlands<br />
Tel: +31-30 2206391<br />
Fax: +31-30 2210849<br />
E-mail: pmo-office@knmi.nl<br />
NEW ZEAlAND<br />
Julie Fletcher, MMO<br />
Meteorological Service New Zealand Ltd.<br />
P.O. Box 722<br />
Wellington<br />
New Zealand<br />
Tel: +64-4 4700 789<br />
Fax: +64-4 4700 772<br />
NORWAY<br />
Tor Inge Mathiesen, PMO<br />
Norwegian Meteorological institute<br />
Allégaten 70<br />
N-5007 Bergen, Norway<br />
Tel: +47-55 236600<br />
Fax: +47-55 236703<br />
Telex: 40427/42239<br />
PAKISTAN<br />
Hazrat Mir, Senior Meteorologist<br />
Pakistan Meteorological Department<br />
Meteorological Office<br />
Jinnah international Airport<br />
Karachi, Pakistan<br />
Tel:+ 92-21 45791300, 45791322<br />
Fax: +92-21 9248282<br />
E-mail: pmdmokar@khi.paknet.com.pk<br />
PHIlIPINES<br />
Cagayan de Oro City<br />
leo Rodriguez<br />
Pagasa Complex Station<br />
Cagayan de Oro City 9000, Misamis<br />
Occidental<br />
Philipines<br />
Tel: +63-8822 722 760<br />
Davao City<br />
Edwin Flores<br />
Pagasa Complex Station, Bangoy Airport<br />
Davao City 8000<br />
Philipines<br />
Tel: +63-82 234 08 90<br />
Dumaguete City<br />
Edsin Culi<br />
Pagasa Complex Station<br />
Dumaguete City Airport<br />
Dumaguete City, Negros Oriental 6200<br />
Philipines<br />
Tel: +63-35 225 28 04<br />
Legaspi City<br />
Orthello Estareja<br />
Pagasa Complex Station<br />
Legaspi City, 4500<br />
Philipines<br />
Tel: +63-5221 245 5241<br />
Iloilo City<br />
Constancio Arpon, Jr.<br />
Pagasa Complex Station<br />
iloilo City 5000<br />
Philipines<br />
Tel: +63-33 321 07 78<br />
Mactan City<br />
Roberto Entrada<br />
Pagasa Complex Station, Mactan Airport<br />
Mactan City, CEBU 6016<br />
Philipines<br />
Tel: +63-32 495 48 44<br />
Manila<br />
Dr. Juan D. Cordeta & Benjamin Tado, Jr<br />
Pagasa Port Meteorological Office<br />
PPATC Building, gate 4<br />
South harbor<br />
Manila 1018<br />
Philipines 1100<br />
Tel: +63-22 527 03 16<br />
POlAND<br />
Józef Kowalewski, PMO<br />
gdynia and gdansk institute of<br />
Meteorology and Water Management<br />
Waszyngton 42<br />
PL-81-342 gdynia<br />
Poland<br />
Tel: +48-58 6204572<br />
Fax: +48-58 6207101<br />
Telex: 054216<br />
E-mail: kowalews@stratus.imgw.gdynia.pl<br />
REPUBlIC OF KOREA<br />
Inchon<br />
Inchon Meteorological Station<br />
25 Chon-dong, Chung-gu<br />
inchon<br />
republic of Korea<br />
Tel: +82-32 7610365<br />
Fax: +82-32 7630365<br />
Pusan<br />
Pusan Meteorological Station<br />
1-9 Taechong-dong, Chung-gu<br />
Pusan<br />
republic of Korea<br />
Tel: +82-51 4697008<br />
Fax: +82-51 4697012<br />
RUSSIAN FEDERATION<br />
Ravil S. Fakhrutdinov<br />
roshydromet<br />
12, Novovagan’kovsky Street<br />
Moscow 123242<br />
russian Federation<br />
Tel:+7-095 255 23 88<br />
Fax: +7-095 255 20 90<br />
Telex: 411117 rUMS rF<br />
E-mail: marine@mcc.mecom.ru fakhrutdinov@rhmc.mecom.ru<br />
SAUDI ARABIA<br />
Mahmoud M. Rajkhan, PMO<br />
Meteorology and Environmental<br />
Protection Administration (MEPA)<br />
P.O. Box 1358<br />
Jeddah 21431<br />
Saudi Arabia<br />
Tel: +966-2 6512312 Ext. 2252 or 2<strong>56</strong>4<br />
55<br />
points of Contact<br />
<strong>December</strong> <strong>2012</strong> ~ Mariners Weather Log
points of Contact<br />
<strong>December</strong> <strong>2012</strong> ~ Mariners Weather Log<br />
<strong>56</strong><br />
SINGAPORE<br />
Amran bin Osman, PMS<br />
Meteorological Service<br />
PO Box 8<br />
Singapore Changi Airport<br />
Singapore 9181<br />
Tel: 5457198<br />
Fax: +65 5457192<br />
Telex: rS50345 METSiN<br />
SOUTH AFRICA<br />
Headquarters<br />
Johan Stander<br />
regional Manager: Western Cape<br />
Antarctica and islands<br />
South African Weather Service<br />
P O Box 21 Cape Town international<br />
Airport 7525<br />
South Africa<br />
Tel: +27 (0) 21 934 0450<br />
Fax: +27 (0) 21 934 4590<br />
Cell: +27 (0) 82 281 0993<br />
Weatherline: 082 162<br />
E-mail: johan.stander@weathersa.co.za<br />
Cape Town<br />
C. Sydney Marais, PMO<br />
Cape Town regional Weather Office<br />
Cape Town international Airport<br />
Cape Town 7525<br />
South Africa<br />
Tel: +27-21 934 0836<br />
Fax: +27-21 934 3296<br />
E-mail: maritime@weathersa.co.za<br />
Durban<br />
Gus McKay, PMO<br />
Durban regional Weather Office<br />
Durban international Airpot<br />
Durban 4029<br />
South Africa<br />
Tel: +27-31 408 1446<br />
Fax: +27-31 408 1445<br />
E-mail: mckay@weathersa.co.za<br />
SWEDEN<br />
Johan Svalmark<br />
SMhi<br />
SE-601 75 NOrrKÖPiNg<br />
Sweden<br />
Tel: + 46 11 4958000<br />
E-mail: johan.svalmark@smhi.se<br />
TANZANIA, UNITED REPUBlIC OF<br />
H. Charles Mwakitosi, PMO<br />
P.O. Box 30<strong>56</strong><br />
Dar es Salaam<br />
United republic of Tanzania<br />
THAIlAND<br />
Kesrin Hanprasert, Meteorologist<br />
Marine and Upper Air Observation<br />
Section<br />
Meteorological Observation Division<br />
Thai Meteorological Department<br />
4353 Sukhumvit road, Bangna<br />
Bangkok 10260<br />
Thailand<br />
Tel: +66-2 399 4<strong>56</strong>1<br />
Fax: +66-2 398 9838<br />
E-mail: wattana@fc.nrct.go.th<br />
UNITED KINGDOM<br />
Headquarters<br />
Sarah C. North, Marine Networks<br />
Manager Met Office<br />
Observations Supply - Marine Networks<br />
Fitzroy road<br />
Exeter<br />
Devon<br />
EX1 3PB<br />
United Kingdom<br />
Tel: +44-1392 855 617<br />
Fax: +44-870 900 5050<br />
E-mail: sarah.north@metoffice.gov.uk<br />
group E-mail: obsmar@metoffice.gov.uk<br />
North England<br />
Emma Steventon<br />
Port Meteorological Officer<br />
Met Office<br />
Saughton house<br />
Broomhouse Drive<br />
EDiNBUrgh Eh11 3XQ<br />
United Kingdom<br />
Telephone: +44 (0)131 528 7318<br />
Mobile : +44 (0) 7753880209<br />
E-mail: emma.steventon@metoffice.gov.uk<br />
—or—<br />
E-mail: pmoscotland@metoffice.gov.uk<br />
South England – PMO London<br />
Joe Maguire<br />
Port Meteorological Officer<br />
Met Office<br />
Trident house<br />
21 Berth Tilbury Dock<br />
Tilbury, Essex rM18 7hL<br />
United Kingdom<br />
Telephone: +44-1375 859 970<br />
Telefax: +44- (0)870 900 5050<br />
E-mail: pmolondon@metoffice.go<br />
PMO Southampton<br />
lalinda Namalarachchi, PMO<br />
Met Office<br />
c/o room 231/19<br />
National Oceanography Centre,<br />
Southampton<br />
University of Southampton,<br />
Waterfront Campus<br />
European Way<br />
Southampton SO14 3Zh<br />
United Kingdom<br />
Telephone: +44 -2380638339<br />
Telefax: +44-870 900 5050<br />
E-mail: pmosouthampton@metoffice.gov.
SCOTlAND<br />
Tony Eastham, PMO<br />
Met Office<br />
Saughton house, Broomhouse Drive<br />
Edinburgh Eh11 3XQ<br />
United Kingdom<br />
Tel: +44-131 528 7305<br />
Fax: +44-131 528 7345<br />
E-mail: pmoedinburgh@metoffice.gov.uk<br />
Ian J. Hendry, Offshore Adviser<br />
Met Office<br />
Davidson house Campus 1<br />
Aberdeen Science & Technology Park<br />
Bridge of Don<br />
Aberdeen AB22 8gT<br />
United Kingdom<br />
Tel: +44-1224 407 557<br />
Fax: +44-1224 407 <strong>56</strong>8<br />
E-mail: ihendry@metoffice.gov.uk<br />
NOAA WEATHER RADIO<br />
NETWORK<br />
(1) 162.550 mhz<br />
(2) 162.400 mhz<br />
(3) 162.475 mhz<br />
(4) 162.425 mhz<br />
(5) 162.450 mhz<br />
(6) 162.500 mhz<br />
(7) 162.525 mhz<br />
Channel numbers, e.g. (WX1, WX2) etc.<br />
have no special significance but are<br />
often designated this way in consumer<br />
equipment. Other channel numbering<br />
schemes are also prevalent.<br />
The NOAA Weather radio network<br />
provides voice broadcasts of local and<br />
coastal marine forecasts on a continuous<br />
cycle. The forecasts are produced <strong>by</strong><br />
local National Weather Service Forecast<br />
Offices.<br />
U.S. Department of Commerce<br />
National Oceanic and Atmospheric<br />
Administration<br />
National Data Buoy Center<br />
Stennis Space Center<br />
1007 Balch Blvd<br />
Bay St Louis, MS 39520-9903<br />
Coastal stations also broadcast predicted<br />
tides and real time observations from<br />
buoys and coastal meteorological<br />
stations operated <strong>by</strong> NOAA’s National<br />
Data Buoy Center. Based on user<br />
demand, and where feasible, Offshore<br />
and Open Lake forecasts are broadcast<br />
as well.<br />
The NOAA Weather radio network<br />
provides near continuous coverage of<br />
the coastal U.S, great Lakes, hawaii,<br />
and populated Alaska coastline. Typical<br />
coverage is 25 nautical miles offshore,<br />
but may extend much further in certain<br />
areas.<br />
57<br />
points of Contact<br />
<strong>December</strong> <strong>2012</strong> ~ Mariners Weather Log