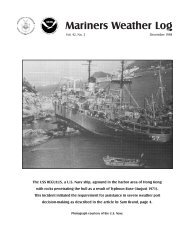
Volume 56, Number 3 December 2012 Photo by Denice Drass
Volume 56, Number 3 December 2012 Photo by Denice Drass
Volume 56, Number 3 December 2012 Photo by Denice Drass

You also want an ePaper? Increase the reach of your titles
YUMPU automatically turns print PDFs into web optimized ePapers that Google loves.
North pacific Area<br />
<strong>December</strong> <strong>2012</strong> ~ Mariners Weather Log<br />
38<br />
introduction<br />
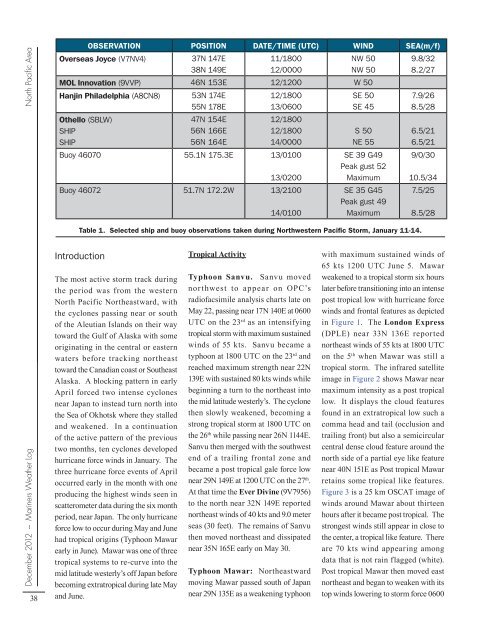
OBSERVATION POSITION DATE/TIME (UTC) WIND SEA(m/f)<br />
Overseas Joyce (V7NV4) 37N 147E<br />
38N 149E<br />
The most active storm track during<br />
the period was from the western<br />
North Pacific Northeastward, with<br />
the cyclones passing near or south<br />
of the Aleutian Islands on their way<br />
toward the Gulf of Alaska with some<br />
originating in the central or eastern<br />
waters before tracking northeast<br />
toward the Canadian coast or Southeast<br />
Alaska. A blocking pattern in early<br />
April forced two intense cyclones<br />
near Japan to instead turn north into<br />
the Sea of Okhotsk where they stalled<br />
and weakened. In a continuation<br />
of the active pattern of the previous<br />
two months, ten cyclones developed<br />
hurricane force winds in January. The<br />
three hurricane force events of April<br />
occurred early in the month with one<br />
producing the highest winds seen in<br />
scatterometer data during the six month<br />
period, near Japan. The only hurricane<br />
force low to occur during May and June<br />
had tropical origins (Typhoon Mawar<br />
early in June). Mawar was one of three<br />
tropical systems to re-curve into the<br />
mid latitude westerly’s off Japan before<br />
becoming extratropical during late May<br />
and June.<br />
Tropical Activity<br />
11/1800<br />
12/0000<br />
Typhoon Sanvu. Sanvu moved<br />
northwest to appear on OPC’s<br />
radiofacsimile analysis charts late on<br />
May 22, passing near 17N 140E at 0600<br />
UTC on the 23 rd as an intensifying<br />
tropical storm with maximum sustained<br />
winds of 55 kts. Sanvu became a<br />
typhoon at 1800 UTC on the 23 rd and<br />
reached maximum strength near 22N<br />
139E with sustained 80 kts winds while<br />
beginning a turn to the northeast into<br />
the mid latitude westerly’s. The cyclone<br />
then slowly weakened, becoming a<br />
strong tropical storm at 1800 UTC on<br />
the 26 th while passing near 26N 1144E.<br />
Sanvu then merged with the southwest<br />
end of a trailing frontal zone and<br />
became a post tropical gale force low<br />
near 29N 149E at 1200 UTC on the 27 th .<br />
At that time the Ever Divine (9V79<strong>56</strong>)<br />
to the north near 32N 149E reported<br />
northeast winds of 40 kts and 9.0 meter<br />
seas (30 feet). The remains of Sanvu<br />
then moved northeast and dissipated<br />
near 35N 165E early on May 30.<br />
Typhoon Mawar: Northeastward<br />
moving Mawar passed south of Japan<br />
near 29N 135E as a weakening typhoon<br />
NW 50<br />
NW 50<br />
MOL Innovation (9VVP) 46N 153E 12/1200 W 50<br />
Hanjin Philadelphia (A8CN8) 53N 174E<br />
55N 178E<br />
Othello (SBLW)<br />
SHIP<br />
SHIP<br />
47N 154E<br />
<strong>56</strong>N 166E<br />
<strong>56</strong>N 164E<br />
12/1800<br />
13/0600<br />
12/1800<br />
12/1800<br />
14/0000<br />
Buoy 46070 55.1N 175.3E 13/0100<br />
Buoy 46072 51.7N 172.2W<br />
13/0200<br />
13/2100<br />
14/0100<br />
SE 50<br />
SE 45<br />
S 50<br />
NE 55<br />
SE 39 G49<br />
Peak gust 52<br />
Maximum<br />
SE 35 G45<br />
Peak gust 49<br />
Maximum<br />
Table 1. Selected ship and buoy observations taken during Northwestern Pacific Storm, January 11-14.<br />
9.8/32<br />
8.2/27<br />
7.9/26<br />
8.5/28<br />
6.5/21<br />
6.5/21<br />
9/0/30<br />
10.5/34<br />
7.5/25<br />
8.5/28<br />
with maximum sustained winds of<br />
65 kts 1200 UTC June 5. Mawar<br />
weakened to a tropical storm six hours<br />
later before transitioning into an intense<br />
post tropical low with hurricane force<br />
winds and frontal features as depicted<br />
in Figure 1. The London Express<br />
(DPLE) near 33N 136E reported<br />
northeast winds of 55 kts at 1800 UTC<br />
on the 5 th when Mawar was still a<br />
tropical storm. The infrared satellite<br />
image in Figure 2 shows Mawar near<br />
maximum intensity as a post tropical<br />
low. It displays the cloud features<br />
found in an extratropical low such a<br />
comma head and tail (occlusion and<br />
trailing front) but also a semicircular<br />
central dense cloud feature around the<br />
north side of a partial eye like feature<br />
near 40N 151E as Post tropical Mawar<br />
retains some tropical like features.<br />
Figure 3 is a 25 km OSCAT image of<br />
winds around Mawar about thirteen<br />
hours after it became post tropical. The<br />
strongest winds still appear in close to<br />
the center, a tropical like feature. There<br />
are 70 kts wind appearing among<br />
data that is not rain flagged (white).<br />
Post tropical Mawar then moved east<br />
northeast and began to weaken with its<br />
top winds lowering to storm force 0600