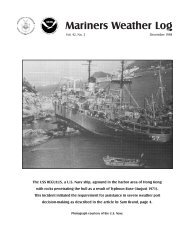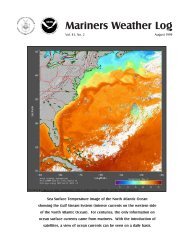
Volume 56, Number 3 December 2012 Photo by Denice Drass
Volume 56, Number 3 December 2012 Photo by Denice Drass
Volume 56, Number 3 December 2012 Photo by Denice Drass

Create successful ePaper yourself
Turn your PDF publications into a flip-book with our unique Google optimized e-Paper software.
North Atlantic Area<br />
<strong>December</strong> <strong>2012</strong> ~ Mariners Weather Log<br />
32<br />
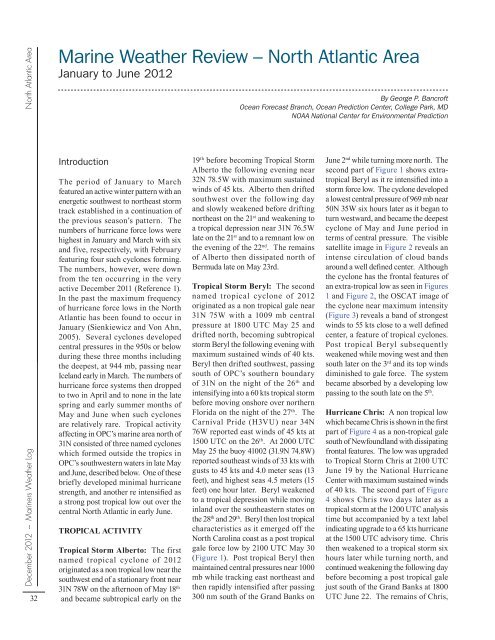
Marine Weather review – North Atlantic Area<br />
January to June <strong>2012</strong><br />
introduction<br />
The period of January to March<br />
featured an active winter pattern with an<br />
energetic southwest to northeast storm<br />
track established in a continuation of<br />
the previous season’s pattern. The<br />
numbers of hurricane force lows were<br />
highest in January and March with six<br />
and five, respectively, with February<br />
featuring four such cyclones forming.<br />
The numbers, however, were down<br />
from the ten occurring in the very<br />
active <strong>December</strong> 2011 (Reference 1).<br />
In the past the maximum frequency<br />
of hurricane force lows in the North<br />
Atlantic has been found to occur in<br />
January (Sienkiewicz and Von Ahn,<br />
2005). Several cyclones developed<br />
central pressures in the 950s or below<br />
during these three months including<br />
the deepest, at 944 mb, passing near<br />
Iceland early in March. The numbers of<br />
hurricane force systems then dropped<br />
to two in April and to none in the late<br />
spring and early summer months of<br />
May and June when such cyclones<br />
are relatively rare. Tropical activity<br />
affecting in OPC’s marine area north of<br />
31N consisted of three named cyclones<br />
which formed outside the tropics in<br />
OPC’s southwestern waters in late May<br />
and June, described below. One of these<br />
briefly developed minimal hurricane<br />
strength, and another re intensified as<br />
a strong post tropical low out over the<br />
central North Atlantic in early June.<br />
TROPICAL ACTIVITY<br />
Tropical Storm Alberto: The first<br />
named tropical cyclone of <strong>2012</strong><br />
originated as a non tropical low near the<br />
southwest end of a stationary front near<br />
31N 78W on the afternoon of May 18 th<br />
and became subtropical early on the<br />
By George P. Bancroft<br />
Ocean Forecast Branch, Ocean Prediction Center, College Park, MD<br />
NOAA National Center for Environmental Prediction<br />
19 th before becoming Tropical Storm<br />
Alberto the following evening near<br />
32N 78.5W with maximum sustained<br />
winds of 45 kts. Alberto then drifted<br />
southwest over the following day<br />
and slowly weakened before drifting<br />
northeast on the 21 st and weakening to<br />
a tropical depression near 31N 76.5W<br />
late on the 21 st and to a remnant low on<br />
the evening of the 22 nd . The remains<br />
of Alberto then dissipated north of<br />
Bermuda late on May 23rd.<br />
Tropical Storm Beryl: The second<br />
named tropical cyclone of <strong>2012</strong><br />
originated as a non tropical gale near<br />
31N 75W with a 1009 mb central<br />
pressure at 1800 UTC May 25 and<br />
drifted north, becoming subtropical<br />
storm Beryl the following evening with<br />
maximum sustained winds of 40 kts.<br />
Beryl then drifted southwest, passing<br />
south of OPC’s southern boundary<br />
of 31N on the night of the 26 th and<br />
intensifying into a 60 kts tropical storm<br />
before moving onshore over northern<br />
Florida on the night of the 27 th . The<br />
Carnival Pride (H3VU) near 34N<br />
76W reported east winds of 45 kts at<br />
1500 UTC on the 26 th . At 2000 UTC<br />
May 25 the buoy 41002 (31.9N 74.8W)<br />
reported southeast winds of 33 kts with<br />
gusts to 45 kts and 4.0 meter seas (13<br />
feet), and highest seas 4.5 meters (15<br />
feet) one hour later. Beryl weakened<br />
to a tropical depression while moving<br />
inland over the southeastern states on<br />
the 28 th and 29 th . Beryl then lost tropical<br />
characteristics as it emerged off the<br />
North Carolina coast as a post tropical<br />
gale force low <strong>by</strong> 2100 UTC May 30<br />
(Figure 1). Post tropical Beryl then<br />
maintained central pressures near 1000<br />
mb while tracking east northeast and<br />
then rapidly intensified after passing<br />
300 nm south of the Grand Banks on<br />
June 2 nd while turning more north. The<br />
second part of Figure 1 shows extratropical<br />
Beryl as it re intensified into a<br />
storm force low. The cyclone developed<br />
a lowest central pressure of 969 mb near<br />
50N 35W six hours later as it began to<br />
turn westward, and became the deepest<br />
cyclone of May and June period in<br />
terms of central pressure. The visible<br />
satellite image in Figure 2 reveals an<br />
intense circulation of cloud bands<br />
around a well defined center. Although<br />
the cyclone has the frontal features of<br />
an extra-tropical low as seen in Figures<br />
1 and Figure 2, the OSCAT image of<br />
the cyclone near maximum intensity<br />
(Figure 3) reveals a band of strongest<br />
winds to 55 kts close to a well defined<br />
center, a feature of tropical cyclones.<br />
Post tropical Beryl subsequently<br />
weakened while moving west and then<br />
south later on the 3 rd and its top winds<br />
diminished to gale force. The system<br />
became absorbed <strong>by</strong> a developing low<br />
passing to the south late on the 5 th .<br />
Hurricane Chris: A non tropical low<br />
which became Chris is shown in the first<br />
part of Figure 4 as a non-tropical gale<br />
south of Newfoundland with dissipating<br />
frontal features. The low was upgraded<br />
to Tropical Storm Chris at 2100 UTC<br />
June 19 <strong>by</strong> the National Hurricane<br />
Center with maximum sustained winds<br />
of 40 kts. The second part of Figure<br />
4 shows Chris two days later as a<br />
tropical storm at the 1200 UTC analysis<br />
time but accompanied <strong>by</strong> a text label<br />
indicating upgrade to a 65 kts hurricane<br />
at the 1500 UTC advisory time. Chris<br />
then weakened to a tropical storm six<br />
hours later while turning north, and<br />
continued weakening the following day<br />
before becoming a post tropical gale<br />
just south of the Grand Banks at 1800<br />
UTC June 22. The remains of Chris,