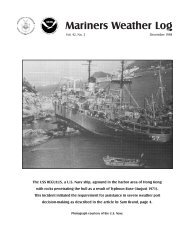
Charles M. - Voluntary Observing Ship Program - NOAA
Charles M. - Voluntary Observing Ship Program - NOAA
Charles M. - Voluntary Observing Ship Program - NOAA

You also want an ePaper? Increase the reach of your titles
YUMPU automatically turns print PDFs into web optimized ePapers that Google loves.
Mariners Weather Log<br />
Vol. 43, No. 2 August 1999<br />
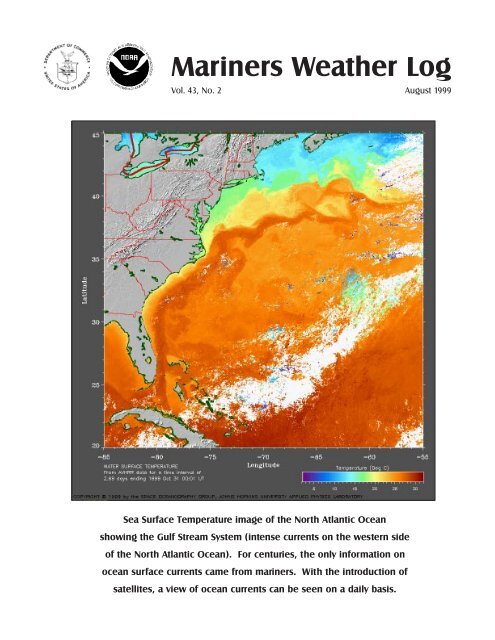
Sea Surface Temperature image of the North Atlantic Ocean<br />
showing the Gulf Stream System (intense currents on the western side<br />
of the North Atlantic Ocean). For centuries, the only information on<br />
ocean surface currents came from mariners. With the introduction of<br />
satellites, a view of ocean currents can be seen on a daily basis.
2 Mariners Weather Log<br />
Mariners Weather Log<br />
U.S. Department of Commerce<br />
William M. Daley, Secretary<br />
National Oceanic and<br />
Atmospheric Administration<br />
Dr. D. James Baker, Administrator<br />
National Weather Service<br />
John J. Kelly, Jr.,<br />
Assistant Administrator for Weather Services<br />
National Environmental Satellite,<br />
Data, and Information Service<br />
Robert S. Winokur,<br />
Assistant Administrator<br />
Editorial Supervisor<br />
Martin S. Baron<br />
Editor<br />
Mary Ann Burke<br />
The Secretary of Commerce has determined that the publication of this<br />
periodical is necessary in the transaction of the public business required by law<br />
of this department. Use of funds for printing this periodical has been approved<br />
by the director of the Office of Management and Budget through December<br />
1999.<br />
The Mariners Weather Log (ISSN: 0025-3367) is published by the National<br />
Weather Service, Office of Meteorology, Integrated Hydrometeorological<br />
Services Core, Silver Spring, Maryland, (301) 713-1677, Ext. 134. Funding is<br />
provided by the National Weather Service, National Environmental Satellite,<br />
Data, and Information Service, and the United States Navy. Data is provided by<br />
the National Climatic Data Center.<br />
Articles, photographs, and letters should be sent to:<br />
Mr. Martin S. Baron, Editorial Supervisor<br />
Mariners Weather Log<br />
National Weather Service, <strong>NOAA</strong><br />
1325 East-West Highway, Room 14108<br />
Silver Spring, MD 20910<br />
Phone: (301) 713-1677 Ext. 134<br />
Fax: (301) 713-1598<br />
E-mail: martin.baron@noaa.gov<br />
Mariners Weather Log<br />
From the Editorial Supervisor<br />
As the 20th century ends and we enter the new<br />
millennium, now, as never before, the topics of<br />
weather and climate are at the forefront of speculation<br />
and study. In the past, predictions about<br />
humanity’s future did not take account of changing<br />
climate, disappearing forests, spreading deserts,<br />
rising sea levels, and the like. Now, as we are all<br />
aware, changes like these are likely to affect our<br />
future profoundly. In light of this, the cover of this<br />
issue was chosen to recognize the impact that ocean<br />
currents such as the Gulf Stream have on weather<br />
and climate.<br />
The Gulf Stream impacts weather both in the United<br />
States and Europe. Along the United States east<br />
coast, a class of storms, referred to as “Nor’Easters”<br />
can form in winter near or over the Gulf Stream as<br />
cold air from the North American continent meets the<br />
Gulf Stream warm air. Development of these storms<br />
can sometimes be explosive, with central pressures<br />
dropping 18 mb (0.5 inches) or more in less than 24<br />
hours (called “bombs” in our North Atlantic Marine<br />
Weather Reviews). Further east, the Gulf Stream has<br />
a major moderating impact on the weather of Iceland,<br />
Western Europe, the Azores, and the Canary Islands.<br />
It is widely believed that ocean currents, along with<br />
phenomena such as El Niño and La Niña are key to<br />
understanding and predicting weather and climate<br />
change. They will be at the forefront of climate<br />
research throughout the 21st century. We will continue<br />
to run articles on these subjects as they become<br />
available.h<br />
Some Important Webpage Addresses<br />
<strong>NOAA</strong> http://www.noaa.gov<br />
National Weather Service http://www.nws.noaa.gov<br />
VOS <strong>Program</strong> http://www.vos.noaa.gov<br />
SEAS <strong>Program</strong> http://seas.nos.noaa.gov/seas/<br />
Mariners Weather Log http://www.nws.noaa.gov/om/<br />
mwl/mwl.htm<br />
Marine Dissemination http://www.nws.noaa.gov/om/<br />
marine/home.htm<br />
See these webpages for further links.
Table of Contents<br />
Mariners Weather Log<br />
Hurricane Avoidance Using the “34-Knot Wind Radius” and “1-2-3” Rules ................................ 4<br />
Obtaining National Weather Service Hurricane Advisories Using E-Mail .................................... 7<br />
Great Lakes Wrecks—The Roy A. Jodrey.................................................................................... 10<br />
Departments:<br />
Physical Oceanography ..................................................................................................................................... 11<br />
AMVER ............................................................................................................................................................. 18<br />
National Data Buoy Center................................................................................................................................ 20<br />
Marine Biology .................................................................................................................................................. 22<br />
Marine Weather Review<br />
North Atlantic, December 1998–March 1999 ..................................................................................... 26<br />
North Pacific, December 1998–March 1999 ....................................................................................... 36<br />
Tropical Atlantic and Tropical East Pacific, January–April 1999 ....................................................... 44<br />
Climate Prediction Center, January–April 1999 ..................................................................................51<br />
Fam Float ........................................................................................................................................................... 53<br />
Coastal Forecast Office News ............................................................................................................................ 54<br />
VOS <strong>Program</strong> .................................................................................................................................................... 56<br />
VOS Cooperative <strong>Ship</strong> Reports ........................................................................................................................ 74<br />
Buoy Climatological Data Summary ................................................................................................................. 86<br />
Meteorological Services<br />
Observations ......................................................................................................................................... 90<br />
Forecasts ............................................................................................................................................... 93<br />
August 1999 3
4 Mariners Weather Log<br />
Hurricane Avoidance<br />
Hurricane Avoidance Using the “34-Knot Wind Radius” and “1-2-3”<br />
Rules<br />
Michael Carr<br />
George Burkley<br />
Maritime Institute of Technology and Graduate Studies<br />
Linthicum Heights, Maryland<br />
Lee Chesneau<br />
Marine Prediction Center<br />
The Maritime Institute of Technology<br />
and Graduate Studies<br />
(MITAGS) offers both two- and<br />
five-day Coast Guard approved<br />
weather courses which meet<br />
International Maritime Organization<br />
Standards of Training and<br />
Conduct for Watchkeepers<br />
(STCW) requirements.<br />
It is no secret that a hurricane<br />
(or typhoon) is a very power<br />
ful and dangerous weather<br />
system. A fully developed category<br />
5 hurricane (on the Saffir-<br />
Simpson Hurricane Scale), the<br />
highest classification a hurricane<br />
can attain, will have winds in<br />
excess of 135 knots and will<br />
control over one million cubic<br />
miles of atmosphere.<br />
Hurricanes can also create waves<br />
over 50 feet high in the open<br />
ocean. Further, the low pressure at<br />
the center of one of these hurricanes<br />
can cause the ocean’s<br />
surface to rise and produce a<br />
coastal surge that can be 20 feet or<br />
more above the normal high water<br />
mark. While it is hard to grasp the<br />
power of a typical hurricane, if the<br />
energy from one were converted to<br />
electricity, it could supply the<br />
United States power demand for<br />
six months.<br />
Although the subject of how<br />
hurricanes form is complex there<br />
are some general constants. All<br />
hurricanes originate near the<br />
equator and sustain themselves by<br />
capturing and condensing the<br />
warm moist air that is present at<br />
these latitudes. A hurricane begins<br />
to form when there is a buildup of<br />
equatorial heat and this heat is<br />
unable to move away to the earth’s<br />
polar regions quickly enough to<br />
keep the earth’s atmosphere in<br />
balance.<br />
Because a hurricane expedites<br />
removal of heat from equatorial<br />
regions to cooler polar areas it is<br />
similar to a circuit breaker in an<br />
electrical system or a relief valve<br />
on a radiator. It quickly transfers<br />
heat from hot equatorial regions to<br />
cool polar areas. Hurricanes are so<br />
good at removing heat that water<br />
temperatures behind a hurricane<br />
are often reduced several degrees.<br />
Avoidance is an essential ship<br />
routing tactic in dealing with<br />
hurricanes and, though recognized<br />
limits do exist in both hurricane<br />
track and intensity forecasting,<br />
there are two reliable rules that<br />
should be used by mariners. These<br />
are the “34-knot wind radius” and<br />
the “1-2-3” rules.<br />
Continued on Page 5
Hurricane Avoidance<br />
Continued from Page 4<br />
Thirty-Four-Knot Wind<br />
Radius Rule<br />
The 34-knot wind radius rule<br />
states that ships should stay<br />
outside the area of a hurricane<br />
where winds of 34 knots or greater<br />
are analyzed or predicted. Often<br />
this area is not symmetrical<br />
around a hurricane, varying within<br />
semi-circles or quadrants.<br />
Thirty-four knots is chosen as the<br />
critical wind speed because as<br />
wind speed doubles its generated<br />
force increases by a factor of four<br />
(see side bar on wind force), and<br />
when 34 knots is reached, sea state<br />
development significantly limits<br />
ship maneuverability. When ship<br />
maneuverability is limited, then<br />
course options are also significantly<br />
reduced.<br />
Hurricane advisory messages<br />
produced by the National Weather<br />
Service, National Hurricane<br />
Center provide 34-knot wind<br />
radius analysis and forecast. For<br />
example; advisory #30 for Hurricane<br />
Bonnie, produced on August<br />
26, 1998, provided the following<br />
information on location of 34-knot<br />
winds:<br />
0900Z Wed 26 Aug 1999:<br />
34 knot winds……….200NE 150SE<br />
125SW 150NW<br />
(Thirty-four knot winds found out to 200<br />
miles from center in NE quadrant, 150<br />
miles of center in SE quadrant, 125 miles<br />
of center in SW quadrant, and 150 miles<br />
of center in NW quadrant.)<br />
Forecast for 27 Aug 1999:<br />
34 knot winds……….200NE 150SE<br />
50SW 75NW<br />
Hurricane Avoidance<br />
Using this information, a chart can<br />
be constructed showing the area to<br />
be avoided, and this area should<br />
be compared with National<br />
Weather Service, Marine prediction<br />
Center sea-state and windwave<br />
analysis and forecasts.<br />
Subsequent forecasts should be<br />
used to validate and update<br />
conditions, which are then used to<br />
update a ship’s route.<br />
The 1-2-3 Rule:<br />
Constructing an Area to be<br />
Avoided Around a Tropical<br />
Cyclone’s Track<br />
The 1-2-3 rule states that track<br />
error forecasting for a hurricane is<br />
100 miles either side of a predicted<br />
track for each 24-hour<br />
forecast period. Thus, for a 24hour<br />
period, an error of 100 miles<br />
(1 day x 100 miles) to the left or<br />
right of an official predicted track<br />
is applicable. For 48 hours the<br />
error is 200 miles (2 x 100), and<br />
for 72 hours the error is 300 miles<br />
(3 x 100).<br />
Averaging errors in track deviation<br />
from predicted path for the period<br />
1988-1997 substantiates this rule<br />
of thumb:<br />
Forecast Avg. Error (nm) Avg. Error (nm)<br />
Interval (left & right (left & right<br />
(Hours) of track) of track)<br />
Atlantic Ocean Pacific Ocean<br />
24 88 71<br />
48 166 137<br />
72 248 195<br />
Therefore, when a hurricane’s<br />
track is plotted, a 100-mile error<br />
for each 24-hour period must be<br />
applied and a vessel within this<br />
adjusted area must take action as<br />
if a hurricane were bearing<br />
directly toward them, which may<br />
become the case.<br />
Combining both the “34-knot<br />
wind radius” and “1-2-3” rules<br />
allows calculation of the area to<br />
avoid when a hurricane- or a<br />
hurricane-force mid-latitude low<br />
Wind Force<br />
Force per square foot experienced when wind is blowing perpendicular to a<br />
surface is calculated using this formula:<br />
F = 0.004V(squared)<br />
F = wind force measured in pounds per square inch<br />
V = wind velocity in knots<br />
Wind Speed Force (lbs./square foot)<br />
10 0.4<br />
15 0.9<br />
20 1.6<br />
25 2.5<br />
30 3.6<br />
34 4.6<br />
Source: U.S. Navy Sailors Handbook<br />
Continued on Page 6<br />
August 1999 5
Hurricane Avoidance<br />
Continued from Page 5<br />
pressure system is detected. An<br />
example of this technique is<br />
diagramed in Figure 1. Mariners<br />
transiting hurricane- and typhoonprone<br />
regions who make use of<br />
these two well-proven techniques<br />
will reduce risk to life, cargo, and<br />
vessel damage.<br />
Author Biographies<br />
Michael Carr is a graduate of the<br />
U.S. Coast Guard Academy and a<br />
U.S. Navy <strong>Ship</strong> Salvage Diving<br />
Officer (SSDO). He holds a 1600ton<br />
all oceans license and is an<br />
Figure 1. Diagram of the 1-2-3 rule.<br />
6 Mariners Weather Log<br />
Hurricane Avoidance<br />
instructor at the Maritime Institute<br />
of Technology and Graduate<br />
Studies (MITAGS) in Linthicum<br />
Heights, Maryland. Michael<br />
authored the recently released<br />
book “Weather Simplified: How to<br />
Read Weather Charts and Satellite<br />
Images” published by International<br />
Marine/McGraw Hill.<br />
George Burkley is a 1989 graduate<br />
of the California Maritime Academy<br />
and has served as a merchant<br />
ships officer and an aviator in the<br />
U.S. Naval reserve. He currently is<br />
the Marine Science Department<br />
Head at MITAGS, instructing in<br />
radar/ARPA, electronic naviga-<br />
tion, and heavy Weather Avoidance.<br />
Lee Chesneau is a senior marine<br />
forecaster with the NWS’s Marine<br />
Prediction Center, Camp Springs,<br />
Maryland. He is the Outreach<br />
Coordinator and liaison to the<br />
Maritime Institute of Technology<br />
Conference and Training Center in<br />
Linthicum Heights, Maryland,<br />
commonly known in the maritime<br />
industry as MITAGS. He coinstructs<br />
two-day marine Weather<br />
Safety Seminars jointly with<br />
Navigator Publishing and<br />
MITAGS, as well as the five-day<br />
Heavy Weather Avoidance courses<br />
at MITAGS.h
Hurricane Advisories<br />
Obtaining National Weather Service Hurricane Advisories<br />
Using E-Mail<br />
Note: The following provided<br />
information does not imply any<br />
endorsement by the National<br />
Weather Service as to function or<br />
suitability for your purpose or<br />
environment.<br />
Using the University of<br />
Illinois Listserver for Marine<br />
Applications<br />
These Lists provide an automated<br />
means to receive NWS hurricane<br />
forecast products via e-mail.<br />
However, performance may vary<br />
and receipt cannot be guaranteed<br />
by either UIUC or the National<br />
Weather Service.<br />
The University of Illinois at<br />
Urbana-Champaign (UIUC)<br />
operates an e-mail Listserver, of<br />
which two Lists, WX-ATLAN,<br />
and WX-TROPL, are of special<br />
interest to mariners who do not<br />
have direct access to the World<br />
Wide Web but who are equipped<br />
with an e-mail system. These lists<br />
provide an automated means to<br />
receive hurricane information via<br />
e-mail. Information on this system<br />
may be found at: http://ralph.<br />
centerone.com/wxlist/.<br />
Users should be aware of the costs<br />
for operating their particular email<br />
system before attempting to<br />
use this Listserver, especially<br />
when using satellite communica-<br />
tion systems. Although the service<br />
is free, the user is responsible for<br />
any charges associated with the<br />
communication system(s) used by<br />
their e-mail system. As this<br />
Listserver will send requested data<br />
on a continuous basis until service<br />
is successfully terminated, potential<br />
charges might be significant.<br />
As a general guide, National<br />
Weather Service hurricane products<br />
average 1 Kbyte each in<br />
length. The tropical weather<br />
OUTLOOK is transmitted on a<br />
six-hour cycle during the hurricane<br />
season. Other products are<br />
Continued on Page 8<br />
August 1999 7
Hurricane Advisories<br />
Continued from Page 7<br />
transmitted when active systems<br />
exist, on a six-hour cycle (one<br />
series of products for each storm).<br />
Products may be transmitted more<br />
often as the systems approach<br />
landfall, to make corrections, etc.<br />
The lists may contain products in<br />
addition to those produced by the<br />
National Weather Service.<br />
This Listserver is not operated or<br />
maintained by the National<br />
Weather Service. Please direct all<br />
questions to Chris Novy at:<br />
chris@siu.edu.<br />
National Weather Service hurricane<br />
products may also be found<br />
on the World Wide Web at links<br />
including:<br />
http://www.nws.noaa.gov<br />
http://weather.gov<br />
http://www.nhc.noaa.gov<br />
http://www.nws.noaa.gov/om/<br />
marine/forecast.htm<br />
Below are an abbreviated set of<br />
instructions for the WX-ATLAN<br />
and WX-TROPL lists on the<br />
UIUC Listserver.<br />
WX-ATLAN Information<br />
This list contains topical weather<br />
outlooks, hurricane position<br />
reports, etc. It is most active from<br />
June through December. Portions<br />
of the products on this list may be<br />
in abbreviated (coded) format.<br />
8 Mariners Weather Log<br />
To subscribe to WX-ATLAN send<br />
e-mail to listserv@po.uiuc.edu<br />
and include the following message:<br />
sub wx-atlan YourFirstName YourLastName<br />
To signoff WX-ATLAN send email<br />
to listserv@po.uiuc.edu and<br />
include the following message:<br />
signoff wx-atlan<br />
WX-ATLAN mailings are subdivided<br />
based on product category.<br />
There is presently no way to<br />
restrict mailings to a specific<br />
storm. By default, when you first<br />
subscribe, you will receive ONLY<br />
the brief outlook (OUTLOOK)<br />
The available sub-topics are:<br />
OUTLOOK = Brief discussions<br />
concerning development<br />
trends [ABNT20]<br />
Hurricane Advisories<br />
TROPDISC = Detailed discussions<br />
concerning development<br />
trends [AXNT20]<br />
FORECAST = Storm forecasts<br />
(wind and sea height estimates)<br />
[WTNT2x]<br />
ADVISORY = Storm status<br />
reports (movement, wind<br />
speeds, etc) [WTNT3x]<br />
STRMDISC = Discussion reports<br />
concerning a specific storm<br />
[WTNT4x]<br />
POSITION = Position reports<br />
[WTNT5x]<br />
UPDATE = Storm updates (they<br />
often cites recon reports)<br />
[WTNT6x]<br />
STRIKE = Strike probabilities<br />
(landfall probabilities)<br />
[WTNT7x]<br />
ALL = All sub-topics<br />
RECON = URNT12 FOS header<br />
Vortex messages<br />
To receive bulletins from just one<br />
specific product, say the strike<br />
probabilities, send e-mail to<br />
listserv@po.uiuc.edu with the<br />
following:<br />
set wx-atlan topics: strike<br />
You can also use combinations of<br />
the keywords for multiple products.<br />
For example:<br />
set wx-atlan topics: strike,position,tropdisc<br />
Notes: If you have previously<br />
specified a list of sub-topics and<br />
now you want to add or delete<br />
specific sub-topics, prefix them<br />
with a (+) or (-) respectively. For<br />
example, to add ADVISORY and<br />
delete TROPDISC (while leaving<br />
any other sub-topics alone) you<br />
would send the command:<br />
set wx-atlan topics: +advisory -tropdisc<br />
You must already be subscribed to<br />
WX-ATLAN in order to use the<br />
sub-topic commands.<br />
Continued on Page 9
Hurricane Advisories<br />
Continued from Page 8<br />
WX-TROPL Tropical Information<br />
This list contains topical weather<br />
outlooks, hurricane position<br />
reports, etc. Portions of the<br />
products on this list may be in<br />
abbreviated (coded) format.<br />
Note: For Atlantic and Gulf of<br />
Mexico information see the WX-<br />
ATLAN list.<br />
To subscribe to WX-TROPL send<br />
e-mail to listserv@po.uiuc.edu<br />
and include the following message:<br />
sub wx-tropl YourFirstName YourLastName<br />
To signoff WX-TROPL send email<br />
to listserv@po.uiuc.edu and<br />
include the following message:<br />
signoff wx-tropl<br />
WX-TROPL mailings are subdivided<br />
into geographic regions. By<br />
default, new subscribers will<br />
receive all bulletins. We have set<br />
up sub-topic areas for a number of<br />
geographically related regions:<br />
PACIFIC-EN = Pacific Ocean<br />
Eastern Northern region (90W<br />
to 140W)<br />
PACIFIC-NC = Pacific Ocean<br />
North Central region (140W<br />
to 180W)<br />
PACIFIC-NW = Pacific Ocean<br />
Northwest region (100E to<br />
180E)<br />
PACIFIC-SW = Pacific Ocean<br />
Southwest (120E to 180E<br />
south of Equator)<br />
INDIAN-N = Indian Ocean<br />
(North) (100E to 40E north of<br />
Equator)<br />
INDIAN-S = Indian Ocean<br />
(South) (120E to 40E south of<br />
Equator)<br />
PACIFIC-SE = Pacific Ocean<br />
Southeast Region<br />
To receive bulletins from just one<br />
specific region, say the northwest<br />
Pacific Ocean, send e-mail to<br />
listserv@po.uiuc.edu with the<br />
following:<br />
set wx-tropl topics: pacific-nw<br />
You can also use combinations of<br />
the keywords for multiple areas.<br />
For example:<br />
set wx-tropl topics: pacific-en, pacific-nw<br />
Hurricane Advisories<br />
Notes: If you have previously<br />
specified a list of sub-topics and<br />
now you want to add or delete<br />
specific sub-topics, prefix them<br />
with a (+) or (-) respectively. For<br />
example, to add PACIFIC-NW and<br />
delete INDIAN-N (while leaving<br />
any other sub-topics alone) you<br />
would send the command:<br />
set wx-tropl topics: +pacific-nw -indian-n<br />
You must already be subscribed to<br />
WX-TROPL in order to use the<br />
sub-topic commands.<br />
If you wish to receive National<br />
Weather Service hurricane products<br />
via e-mail only upon individual<br />
request , the NWS<br />
FTPMAIL server may be more<br />
appropriate for your needs.<br />
Using the NWS FTPMAIL<br />
Server<br />
National Weather Service radiofax<br />
charts broadcast by U.S. Coast<br />
Guard from Boston, New Orleans,<br />
and Pt. Reyes, California are<br />
available via e-mail. Marine text<br />
products are also available. The<br />
FTPMAIL server is intended to<br />
allow Internet access for mariners<br />
and other users who do not have<br />
direct access to the World Wide<br />
Web but who are equipped with an<br />
e-mail system. Turnaround is<br />
generally in under three hours,<br />
however, performance may vary<br />
widely and receipt cannot be<br />
guaranteed. To get started in using<br />
the NWS FTPMAIL service,<br />
follow these simple directions to<br />
obtain the FTPMAIL “help” file<br />
(6 Kbytes).<br />
Send an e-mail to:<br />
ftpmail@weather.noaa.gov<br />
Subject line: Put anything you<br />
like.<br />
Body: help<br />
Also available at: http://weather.<br />
noaa.gov/pub/fax/ftpmail.txt<br />
August 1999 9
Great Lakes Wrecks — The Roy A. Jodrey<br />
Skip Gillham<br />
Vineland, Ontario, Canada<br />
It has been twenty-five years<br />
since the Roy A. Jodrey<br />
went to the bottom of the St.<br />
Lawrence River. The ship was lost<br />
off Wellesley Island on November<br />
21, 1974.<br />
This was a modern member of the<br />
Algoma Central Marine fleet. It<br />
was barely nine years old, having<br />
been launched at Collingwood,<br />
Ontario, on September 9, l965.<br />
The ship sailed to load the first<br />
cargo, a shipment of limestone, on<br />
November 11, l965.<br />
The 640-foot, 6-inch long bulk<br />
carrier was constructed with onboard<br />
systems and a 250-foot selfunloading<br />
boom that allowed the<br />
discharge of a wide variety of<br />
cargoes without the need for<br />
shore-based personnel or equipment.<br />
Roy A. Jodrey operated throughout<br />
the Great Lakes and St.<br />
Lawrence Seaway and was<br />
carrying 20,450 tons of taconite<br />
ore pellets from Sept Iles, Quebec,<br />
to Detroit when it went down.<br />
The upbound vessel struck Pullman<br />
Shoal in the American<br />
Narrows section of the St.<br />
Lawrence east of the entrance to<br />
10 Mariners Weather Log<br />
Great Lakes Wrecks<br />
Lake Ontario. There were three<br />
bumps and the ship sheered to port<br />
and took on a starboard list.<br />
The vessel was intentionally<br />
grounded adjacent to the Coast<br />
Guard station near Alexandria<br />
Bay, New York, some 1600 feet<br />
upstream from Pullman Shoal.<br />
The forward area was badly holed<br />
and a quick investigation revealed<br />
the seriousness of the damage.<br />
The crew abandoned ship via<br />
lifeboat and around midnight the<br />
Captain and Chief Engineer were<br />
removed.<br />
Shortly afterwards the hull slipped<br />
off the precarious perch on the<br />
ledge, rolled on its side and sank.<br />
Due to the depth and location,<br />
salvage of the ship or cargo<br />
proved unfeasible. The Roy A.<br />
Jodrey remains on the bottom as<br />
proof that even the most modern<br />
ships are not exempt from disaster.<br />
Note: Skip Gillham is the author<br />
of 18 books, most related to Great<br />
Lakes ships and shipping.h<br />
The Roy A. Jodrey above Lock 1 of the Welland Canal on February 25,<br />
197l. (Skip Gillham photo.)
Waves Beneath the Sea<br />
Bruce Parker<br />
National Ocean Service<br />
On August 29, 1893, two<br />
months into its voyage to<br />
the North Pole, the<br />
Norwegian ship Fram was<br />
steaming in calm weather through<br />
open waters north of Taimur<br />
Island, Siberia, when it came<br />
almost to a dead stop. The ship’s<br />
engine had been going at full<br />
pressure, moving her at 5 knots,<br />
when the speed suddenly dropped<br />
to1 knot, and stayed that way. The<br />
ship’s progress was greatly<br />
slowed, and Dr. Fridtjof Nansen,<br />
the leader of the expedition, wrote<br />
in his journal, “It was such slow<br />
work that I thought I would row<br />
ahead to shoot seal.”<br />
The Fram had encountered what<br />
Norwegian seaman called<br />
“dödvand” or “dead water”. This<br />
strange phenomenon caused a ship<br />
to lose her speed and to refuse to<br />
answer her helm. The only clue to<br />
its cause was that dead water<br />
always occurred at locations<br />
where the sea was covered with<br />
fresh or brackish water. And this<br />
was indeed the case in the sound<br />
north of Taimur Island, where the<br />
ice cover had been melting<br />
rapidly. August 30th brought more<br />
slow going. Nansen wrote: “We<br />
could hardly get on at all for the<br />
dead water, and we swept the<br />
whole sea along with us.” “We<br />
made loops in our course, turned<br />
sometimes right round, tried all<br />
sorts of antics to get clear of it, but<br />
to little purpose. The moment the<br />
engine stopped, it seemed as if the<br />
ship was sucked back.”<br />
The Fram encountered dead water<br />
on several other occasions during<br />
its voyage. In November 1898,<br />
two years after his expedition’s<br />
end, Nansen sent a letter to<br />
Professor Vilhelm Bjerknes, an<br />
old classmate, asking for his<br />
opinion as to the cause of this<br />
phenomenon. Bjerknes hypothesized<br />
correctly that, when there is<br />
a layer of fresh water on top of<br />
saltwater, a moving ship will not<br />
only generate visible waves at the<br />
boundary between water and air,<br />
but will also generate invisible<br />
waves beneath the sea along the<br />
boundary between the freshwater<br />
layer and the saltwater layer below<br />
it. The energy that normally would<br />
have propelled the ship forward<br />
was instead going into generating<br />
these “internal waves,” with the<br />
Physical Oceanography<br />
result that the ship hardly moved<br />
at all (see Figure 1).<br />
Bjerknes then turned the problem<br />
over to his student Vagn Walfrid<br />
Ekman, who proceeded to confirm<br />
Bjerknes’ theory with mathematics<br />
and with experiments. In these<br />
experiments he used a glass tank<br />
containing a freshwater layer on<br />
top of a salt-water layer that had<br />
been dyed a dark color to make<br />
the interface clearer. Ekman pulled<br />
a model boat along the surface and<br />
was able to generate clearly<br />
observable internal waves propagating<br />
along the interface between<br />
the two water layers.<br />
This was the first demonstration<br />
and explanation of internal waves<br />
in the ocean. Internal waves,<br />
however, had been observed<br />
earlier in a totally different setting.<br />
Benjamin Franklin may have been<br />
the first to write about them, in a<br />
letter dated December 1, 1762,<br />
while he was in Madeira, Spain.<br />
He had made what he referred to<br />
as an Italian lamp, by filling the<br />
bottom third of a glass tumbler<br />
Continued on Page 12<br />
August 1999 11
Waves Beneath the Sea<br />
Continued from Page 11<br />
with water, and the next third with<br />
oil. He noticed times when the<br />
surface of the oil (with air above<br />
it) was motionless, but the surface<br />
of the water under the oil could be<br />
“in great commotion, rising and<br />
falling in irregular waves”. He<br />
repeated this experiment many<br />
times when he returned to<br />
America. Today one often sees<br />
toys where a layer of blue-dyed<br />
water is covered with a layer of<br />
clear oil to make the waves along<br />
the interface look like waves at<br />
sea. These waves, however, look<br />
like they’re moving in slow<br />
motion, and they become larger<br />
and break more easily than would<br />
water waves covered with a layer<br />
of air. (As we shall see, this is due<br />
the small difference in the densities<br />
of water and oil, which is<br />
much smaller than the difference<br />
in the densities of water and air).<br />
When one looks at the details of<br />
the wave motion along the inter-<br />
12 Mariners Weather Log<br />
face between two liquids (whether<br />
water and oil or saltwater and<br />
freshwater) there are many<br />
similarities with the wave motion<br />
along the surface of the ocean<br />
(described in our last Physical<br />
Oceanography column). When the<br />
two layers are motionless, with the<br />
lighter fluid resting on the heavier<br />
one, and the interface is a horizontal<br />
straight line, the entire system<br />
is in equilibrium. At every point<br />
the weight of the fluid is exactly<br />
balanced by the pressure exerted<br />
on it by neighboring fluid. If<br />
something disturbs the interface,<br />
for example by pushing the<br />
interface up at some point, heavier<br />
water from the lower layer will be<br />
moved higher up in the water<br />
column into a layer of lighter<br />
water. Gravity will then pull the<br />
heavier water back down. Without<br />
any appreciable friction to stop<br />
this downward movement the<br />
inertia of the heavier water will<br />
keep it moving downward, overshooting<br />
its original at-rest<br />
equilibrium position and moving<br />
deeper than it originally was. The<br />
Physical Oceanography<br />
Figure 1. A model of the Norwegian ship Fram generating an internal wave at the interface between an upper<br />
layer of freshwater and a lower layer of saltwater.<br />
lighter water in the top layer<br />
follows after, flowing down into<br />
the depression. This lighter water<br />
moves downward in the water<br />
column into a layer of heavier<br />
water. The buoyancy of the lighter<br />
water (being surrounded now by<br />
heavier water) eventually starts it<br />
moving upward again. This<br />
oscillation of the interface between<br />
the two layers also moves<br />
horizontally, because the individual<br />
water particles do not just<br />
move up and down; they also<br />
move to the left and right. In fact,<br />
water particles in both layers trace<br />
out circular orbits (rotating in<br />
opposite directions on opposite<br />
sides of the interface). Energy is<br />
transferred horizontally to surrounding<br />
water particles, and so<br />
the wave (i.e., the shape of the<br />
distorted interface) propagates<br />
along the interface (see Figure 2).<br />
Due to the small density difference<br />
between the two water<br />
Continued on Page 13
Waves Beneath the Sea<br />
Continued from Page 12<br />
layers, the gravitational restoring<br />
force is reduced, and is much<br />
smaller than the restoring force for<br />
waves on the ocean’s surface. The<br />
heavier water particles raised up<br />
in the crest of an internal wave are<br />
not that much heavier than the<br />
surrounding water, so it takes<br />
longer for these water particles to<br />
slow up and start falling again.<br />
Likewise, lighter water particles<br />
lowered into the trough of an<br />
internal wave are not that much<br />
lighter than surrounding water.<br />
They are, therefore, only slightly<br />
buoyant and so they also take<br />
longer to slow up and then to<br />
starting moving upward. This<br />
makes for larger wave heights<br />
(they move farther up or down<br />
before slowing down) and for<br />
slower propagating wave forms (it<br />
takes longer for the restoring force<br />
to return water particles to their<br />
average position). Internal wave<br />
periods vary from 10 minutes to<br />
several hours, compared with<br />
several seconds to minutes for<br />
surface waves. Internal waves can<br />
reach heights of several hundred<br />
feet in the ocean, much larger than<br />
their surface wave counterparts.<br />
For a ship to be caught in dead<br />
water, first, its draft must be close<br />
to the thickness of the fresh water<br />
surface layer, so it can generate an<br />
internal wave, and second, it must<br />
be traveling at the same speed (or<br />
slower) than the speed of propagation<br />
of the internal wave created.<br />
The speed of the internal wave is<br />
determined by the density difference<br />
between the two layers, and<br />
by the thickness of the layers. The<br />
drag on the ship reaches a maximum<br />
when the ship’s speed is very<br />
close to the internal wave speed. If<br />
the ship has enough power to go<br />
faster than the speed of the<br />
internal wave (usually speeds<br />
greater than 5 knots will be<br />
enough), it can break away from<br />
the dead water. Dead water is thus<br />
less of a problem today with the<br />
power of modern ships. However,<br />
there have been cases where a ship<br />
has slowed down and then suddenly<br />
come to a dead stop (sometimes<br />
with extreme vibrations). In<br />
such cases, the initial reaction is<br />
usually that the ship has run<br />
aground. In some instances ships<br />
have even been dry-docked to<br />
assess the damage from the<br />
“grounding,” only to find that<br />
there was none.<br />
Back when ships had less power<br />
than today, incidents of dead water<br />
were reported at many locations<br />
Physical Oceanography<br />
around the world where there was<br />
a fresh or brackish water layer on<br />
top of a saltwater layer. Dead<br />
water was especially common in<br />
the fjords of Scandinavia. A fjord<br />
is a hollowed-out glacial valley<br />
with a sill at the ocean end. Cold<br />
dense saltwater fills the bottom of<br />
the fjord to the depth of the sill.<br />
The surface water is lighter due to<br />
the freshwater from streams<br />
running into the fjord. The sill at<br />
the entrance tends to act like a<br />
filter, keeping a major portion of<br />
the energy in the ocean from<br />
getting into the fjord, so that there<br />
is little vertical mixing and the<br />
two layers are maintained. Thus, a<br />
fjord is an ideal location for the<br />
generation of internal waves. Dead<br />
water was less common in rivers<br />
because, even with strong runoff,<br />
the water column can be well<br />
mixed from top to bottom if the<br />
currents are strong enough (espe-<br />
Continued on Page 14<br />
Figure 2. An idealized internal wave propagating along the interface<br />
between an upper layer of freshwater and a lower layer of saltwater. The<br />
streamlines show the direction of flow for a particular moment in time. The<br />
particle orbits are the motion of specific water particles over one complete<br />
cycle of the internal wave as it propagates from left to right.<br />
August 1999 13
Waves Beneath the Sea<br />
Continued from Page 13<br />
cially if there are strong tidal<br />
currents). When dead water was<br />
reported in rivers (with slow<br />
currents), it occurred at different<br />
locations at different times of the<br />
year because of differing amounts<br />
of runoff, since the thickness of<br />
the upper layer had to be comparable<br />
to the ship draft. Dead water<br />
occurred upriver during dry<br />
seasons, and outside the river<br />
entrance in the sea during periods<br />
of heavy runoff. Dead water also<br />
tended to be more prevalent<br />
during sea breezes and flood tides<br />
(which helped maintain the<br />
thickness of the freshwater surface<br />
layer).<br />
Internal waves are not limited to<br />
rivers and fjords where fresh<br />
water flows out over saltwater.<br />
Most internal waves, in fact, occur<br />
offshore and in the open ocean,<br />
but there the density differences<br />
are primarily due to differences in<br />
water temperature. The upper<br />
layer is lighter because the water<br />
is warmer than in the lower layer.<br />
Heat from the sun warms the<br />
surface waters of the ocean, and<br />
that heat slowly propagates<br />
14 Mariners Weather Log<br />
downward into the ocean depths.<br />
The action of surface waves often<br />
mixes the water to a particular<br />
depth, so that the entire upper<br />
layer is the same warmer temperature.<br />
In this case there is a sudden<br />
change in temperature as one<br />
crosses the interface between this<br />
warm upper layer and the cooler<br />
layer below. This interface is<br />
called a thermocline (the interface<br />
between fresher water and saltier<br />
water is called a halocline). It is<br />
along the thermocline that internal<br />
waves in the ocean propagate.<br />
When water density increases with<br />
depth (due to decreasing temperature<br />
or to increasing salinity) the<br />
water is said to be “stratified”.<br />
Wherever water is stratified,<br />
internal waves are possible.<br />
Because the density difference<br />
between an upper warm layer and<br />
a lower cool layer in the ocean is<br />
smaller than that between freshwater<br />
and saltwater layers, and<br />
because the thickness of these<br />
layers is larger, the amplitudes of<br />
the internal waves in the ocean<br />
can be much larger than those in<br />
fjords and rivers. Ocean internal<br />
waves are often 160 feet high, but<br />
have been measured at heights of<br />
600 feet. These internal waves<br />
Physical Oceanography<br />
also produce currents (see below)<br />
that can reach speeds of 6 knots.<br />
The largest internal waves tend to<br />
occur where the thermocline is<br />
deep and where the local generation<br />
mechanisms are energetic<br />
enough (places like the Strait of<br />
Gibralter, where current speeds<br />
are increased by the sudden<br />
narrow width of the strait).<br />
When two fluid layers are close in<br />
density it does not take much of a<br />
disturbance to move water vertically<br />
and to generate an internal<br />
wave. As we have seen, this<br />
disturbance can be a moving ship,<br />
but it can also be a change in wind<br />
stress or pressure at the ocean<br />
surface. When stratified water<br />
flows over a bump in the river<br />
bottom (or over an ocean ridge or<br />
shelf break, or over any irregular<br />
underwater topography) the fluid<br />
particles will be displaced vertically<br />
upward. Being heavier than<br />
their surroundings, those water<br />
particles are acted upon by gravity<br />
to move them downward again,<br />
thus starting the internal wave (see<br />
Figure 3). The internal waves that<br />
result can vary significantly,<br />
having periods from a few minutes<br />
Figure 3. Internal wave generated by two-layered flow over a topographic feature on the bottom.<br />
Continued on Page 15
Figure 4. The circulation pattern produced by a propagating internal<br />
wave. At the water’s surface, long slicks of smooth water alternate with<br />
bands of rougher water. Surface debris tends to collect in the convergence<br />
zones over the troughs of the internal wave, as does plankton.<br />
Waves Beneath the Sea<br />
Continued from Page 14<br />
to many days. Internal tidal<br />
waves, with the thermocline or<br />
halocline moving up and down at<br />
tidal frequencies, are probably the<br />
most common variety. An earthquake<br />
can produce internal<br />
tsunamis at the same time that it is<br />
producing the much faster and<br />
more destructive tsunami on the<br />
ocean’s surface.<br />
Sudden disturbances can generate<br />
“solitary” internal waves. A<br />
solitary wave (also called a<br />
soliton) is a single peak or trough<br />
that moves along the thermocline.<br />
Such waves can maintain their<br />
shape as they travel for hundreds<br />
of miles. Disturbances at a shelf<br />
break or in a strait can produce<br />
packets of solitons, which always<br />
travel with the tallest soliton at the<br />
front of the packet. A typical<br />
situation is that strong tidal<br />
currents oscillate stratified water<br />
over continental shelf topography<br />
or through a strait, which generates<br />
long internal tidal waves,<br />
which become unstable as they<br />
propagate onto the sloping shelf<br />
(much like a wave breaking on a<br />
beach). This breaking of the<br />
internal tidal wave generates<br />
packets of solitons with even<br />
larger heights and stronger currents.<br />
For example, packets of<br />
internal solitons have been observed<br />
in oil fields in the northern<br />
South China Sea that were generated<br />
350 miles to the east, and two<br />
to four days earlier, by tidal<br />
forcing at the shallow sill in the<br />
Luzon Strait (halfway between<br />
Taiwan and the Philippines).<br />
These waves had traveled at<br />
speeds of 4 to 8 knots and had<br />
been refracted around an island<br />
creating a complex interference<br />
pattern of wave fronts. Packets of<br />
solitons are very common in this<br />
area, observable throughout the<br />
Physical Oceanography<br />
year. During some months these<br />
packets arrive every 12 hours.<br />
These waves can be 165 feet high<br />
and accompanied by currents on<br />
the order of 3 knots or higher.<br />
Although internal waves beneath<br />
the surface of the water are not<br />
directly visible, they do have an<br />
effect on the water’s surface that<br />
is clearly observable. Figure 4<br />
illustrates the circulation pattern<br />
produced by propagating internal<br />
waves. Water in the upper layer<br />
moves down toward the trough of<br />
the internal wave as the interface<br />
moves deeper, and water in the<br />
upper layer over the crest is<br />
pushed aside as the crest of the<br />
internal wave moves upward. At<br />
the ocean’s surface, therefore, the<br />
motion of the surface water is<br />
away from the crests and toward<br />
the troughs; the water tends to<br />
converge over the troughs and<br />
diverge over the crests. This<br />
causes any floating surface debris<br />
to collect over the troughs. This<br />
debris dampens the small surface<br />
ripples, making the surface<br />
smooth and glassy. The result is<br />
long parallel slicks of smooth<br />
water on the ocean surface,<br />
alternating with long rows of<br />
rougher water.<br />
Such surface patterns were<br />
observable by Nansen and many<br />
others who described the surface<br />
waters during incidents of dead<br />
water. Nansen’s comment that “we<br />
swept the whole sea along with<br />
us” was a typical description of<br />
dead water and was a reference to<br />
the smooth slick area (over the<br />
unseen trough of the internal wave<br />
Continued on Page 16<br />
August 1999 15
Waves Beneath the Sea<br />
Continued from Page 15<br />
just behind and below the stern of<br />
the ship) that moved with the ship.<br />
His comment that “The moment<br />
the engine stopped, it seemed as if<br />
the ship was sucked back,” was a<br />
reaction to the slick area (and<br />
succeeding surface pattern)<br />
moving past the ship as the<br />
internal wave below propagated<br />
forward leaving the ship behind.<br />
For the larger internal waves<br />
offshore and in the open ocean,<br />
the parallel rows of smooth slicks<br />
and rougher water can each be 60<br />
miles long. The difference in the<br />
surface roughness can be seen<br />
from satellites with Synthetic<br />
Aperture Radar (SAR) or with<br />
ordinary photography (if the sun is<br />
at the right angle). With packets of<br />
internal solitons, each soliton is<br />
preceded by a very long band of<br />
rough water (called “rips”) and<br />
followed by an equally long band<br />
of calm water.<br />
Most of the interest in internal<br />
waves today is not because of<br />
dead water, but because of the<br />
damage that the large internal<br />
waves in the ocean can do,<br />
especially to oil drilling operations.<br />
Large amplitude internal<br />
waves (especially packets of<br />
internal solitons), with their<br />
associated strong currents, can<br />
create enormous bending moments<br />
in offshore structures, and have<br />
been reported to displace oil<br />
platforms hundreds of feet in the<br />
horizontal as well as tens of feet in<br />
the vertical direction. Drillships<br />
appear to be especially susceptible<br />
to the effect of internal waves.<br />
Self-propelled and designed to<br />
16 Mariners Weather Log<br />
drill for oil in water over 7000 feet<br />
deep, they use dynamic positioning<br />
and propulsion to maintain a<br />
constant position while drilling.<br />
Studies in the Andaman Sea (west<br />
of Burma) have shown increases<br />
in mooring line tensions that<br />
correlate directly with independently<br />
measured packets of 200foot<br />
high internal solitons propagating<br />
past the drillship. Internal<br />
waves are capable of causing large<br />
integrated forces on vertical<br />
elements such as risers and<br />
tethers. Because of the real<br />
possibility of riser failure or other<br />
problems, internal soliton prediction<br />
systems have been developed.<br />
Internal waves have also been<br />
cited as the possible cause for a<br />
few unexplained submarine losses.<br />
Perhaps the most famous was the<br />
loss of the USS Thresher on April<br />
10, 1963, in the Gulf of Maine.<br />
The most probable cause of the<br />
tragedy was determined by the<br />
Navy to be a leak in an engine<br />
room seawater system which<br />
shorted electrical circuits causing<br />
a loss of propulsion power. At<br />
some point she sank below her<br />
crush depth and then plunged to<br />
the bottom. Two days before,<br />
however, a large storm crossed the<br />
Gulf of Maine creating a subsurface<br />
eddy and (it was speculated)<br />
possibly a 300-foot-high internal<br />
wave. A submarine traveling<br />
through an internal wave could<br />
very quickly cross from dense to<br />
less dense water and suddenly<br />
become heavier and start to sink.<br />
Without prompt pumping of<br />
ballast overboard and enough<br />
propulsion power to propel it<br />
toward the surface, the submarine<br />
could continue to head deeper.<br />
Physical Oceanography<br />
Whether an internal wave played a<br />
role in the Thresher tragedy will<br />
never be known, but internal<br />
waves are certainly important in<br />
submarine operations. They can<br />
affect sound transmission and a<br />
submarine can trim its buoyancy<br />
so that it can “rest” on a density<br />
layer, move slowly, and remain<br />
undetected by surface craft.<br />
Internal waves observed with<br />
satellite Synthetic Aperture Radar<br />
(SAR) may also be used to locate<br />
moving ships, by analyzing<br />
patterns at the surface produced<br />
by the internal waves generated by<br />
the ship.<br />
Internal waves also have a variety<br />
of other as yet not fully appreciated<br />
effects. The slicks above the<br />
troughs have been shown to be<br />
associated with higher concentrations<br />
of plankton. This has been<br />
seen not just at the surface, but<br />
throughout the water column over<br />
the troughs. Porpoises have been<br />
observed feeding in these surface<br />
slicks. The porpoises also ride<br />
internal waves, much as a surfer<br />
rides a wave on the surface of the<br />
ocean. Porpoises learn to tilt<br />
themselves at a slope that matches<br />
the slope of the internal waves, so<br />
that in effect they’re on a perpetual<br />
downhill ride.<br />
We have only talked about internal<br />
waves traveling horizontally along<br />
an interface between two layers of<br />
water, such as a thermocline.<br />
However, water temperature can<br />
become cooler with depth in a<br />
smooth and continuous manner,<br />
rather than in a sudden change<br />
Continued on Page 17
Waves Beneath the Sea<br />
Continued from Page 16<br />
when crossing a thermocline. In<br />
such cases, internal waves are no<br />
longer restricted to traveling<br />
horizontally. Although the largest<br />
still travel horizontally, some also<br />
travel vertically. Thus, internal<br />
waves can travel to all depths of<br />
the ocean if the stratification is<br />
right. They are, therefore, an<br />
important mechanism for transporting<br />
energy from the ocean’s<br />
surface to the ocean bottom. If<br />
vertical propagation is impeded by<br />
the bottom or by a sudden change<br />
in stratification at some depth,<br />
these internal waves can also be<br />
reflected.<br />
Internal waves also occur in the<br />
atmosphere, traveling on the<br />
interface between warm and cold<br />
air. They can produce patterns of<br />
clouds organized into bands, with<br />
the clouds over the crests of the<br />
internal wave. They are often<br />
found downwind of mountain<br />
ranges, the so-called lee waves in<br />
which sailplane pilots soar to great<br />
heights.<br />
In the report that Ekman wrote<br />
describing his experiments and his<br />
mathematical treatment of internal<br />
waves, he also provided a section<br />
of collected historical anecdotes<br />
about the occurrences of dead<br />
water recorded as far back as the<br />
Roman Empire. Since dead water<br />
would very suddenly hold back a<br />
ship, as if by a mysterious force, it<br />
was attributed to a whole host of<br />
causes. Seamen blamed it on the<br />
gods or other supernatural forces,<br />
on magnetic rocks, and on molluscs<br />
that suddenly grew on the<br />
ship’s hull. They also imagined<br />
very large remora fish (the normal<br />
size remora attach themselves to<br />
sharks and other fish) that could<br />
attach onto the hull of a ship and<br />
hold it in place even during a<br />
strong wind. The slick that follows<br />
a ship in dead water led some<br />
mariners to believe that something<br />
had made the water stick to the<br />
vessel and the ship had to drag it<br />
along it, thus greatly reducing its<br />
speed.<br />
Over the years mariners have tried<br />
a variety of ways to escape dead<br />
water, including shearing off<br />
course, running the whole crew<br />
forward and aft on the deck,<br />
scooping up quantities of water on<br />
deck, pouring oil on the water<br />
ahead of the ship, working the<br />
rudder rapidly, firing guns into the<br />
water, and hitting the water with<br />
oars. Tugboats with a vessel in<br />
tow were usually more successful<br />
in escaping. Typically the vessel<br />
they towed had a deeper draft and<br />
was the vessel actually caught in<br />
the dead water. When this happened<br />
one course of action was to<br />
shorten the rope between the<br />
tugboat and the towed vessel as<br />
much as possible. Unknowing to<br />
the tug captain, this allowed the<br />
tug’s propeller to mix the water<br />
around the vessel being pulled,<br />
destroying the interface on which<br />
the internal wave traveled.<br />
Of all the stories collected by<br />
Ekman, to which he attributed a<br />
role to internal waves, the most<br />
famous was the Battle of Actium,<br />
the naval battle on September 2,<br />
31 BC, where the fleets of Marc<br />
Antony and Cleopatra were<br />
Physical Oceanography<br />
defeated by Octavian. Ekman cites<br />
an account by Pliny the Naturalist,<br />
who said that during that sea battle<br />
a remora fish grabbed onto<br />
Antony’s ship and held it so fast<br />
that he was obliged to board<br />
another vessel. Although it will<br />
never be known for sure, Ekman’s<br />
guess that an internal wave was<br />
involved may be correct. The<br />
Battle of Actium took place on the<br />
Adriatic Sea along the coast of<br />
Dalmatia (near where Croatia is<br />
today). The Adriatic Sea receives<br />
large amounts of freshwater river<br />
runoff. Antony’s fleet was trapped<br />
close to shore by Octavian’s fleet.<br />
Octavian had lighter shallowerdraft<br />
vessels, whereas Antony’s<br />
vessels were heavy deeper-draft<br />
Roman warships equipped with<br />
stone throwing catapults. Historians<br />
have mentioned how the<br />
lighter ships of Octavian were<br />
more maneuverable. But if on that<br />
day there was a layer of brackish<br />
water on the surface, Antony’s<br />
deeper draft vessels would have<br />
been more likely to be captured by<br />
dead water, and Pliny’s description<br />
of Antony’s vessel being held<br />
fast may have been accurate. The<br />
battle ultimately ended when<br />
Cleopatra decided to flee with her<br />
60 ships and Antony abandoned<br />
his legions and chased after her. It<br />
was a sea battle that changed<br />
history, and it is possible that<br />
internal waves may have played a<br />
role in Octavian’s victory, which<br />
led to his subsequent crowning as<br />
Rome’s first emperor, Augustus.<br />
Bruce Parker is the Chief of the<br />
Coast Survey Development<br />
Laboratory, National Ocean<br />
Service, <strong>NOAA</strong>.h<br />
August 1999 17
18 Mariners Weather Log<br />
AMVER<br />
Hands Across the Water!<br />
<strong>Ship</strong> Reporting Systems Save Lives at Sea<br />
Richard T. Kenney<br />
United States Coast Guard<br />
Maritime Relations Officer<br />
As part of a visit to U.S.<br />
Coast Guard facilities<br />
around the United States,<br />
a delegation of officials from the<br />
People’s Republic of China visited<br />
the AMVER Maritime Relations<br />
Office in New York City. There,<br />
they were met by Captain Gabriel<br />
Kinney, Chief of the Office of<br />
Search and Rescue at U.S. Coast<br />
Guard (USCG) Headquarters in<br />
Washington, D.C., and Mr. Rick<br />
Kenney, the AMVER Maritime<br />
Relations Officer. At Mr.<br />
Kenney’s invitation, Captain Shen<br />
Jugen, former Master of the<br />
AMVER rescue ship Gao He, and<br />
Mr. Lachun Liu, Chief of <strong>Ship</strong><br />
Operations, from the offices of<br />
COSCO North America in<br />
Secaucus, New Jersey, were<br />
invited to participate as technical<br />
interpreters.<br />
The Chinese group was headed by<br />
Mr. Wang Zhi Yi, Director of the<br />
Shanghai Maritime Safety Agency<br />
(SMSA). It included Mr. Zhai<br />
Jiugang, Director of the Navigation<br />
Safety Division of the Maritime<br />
Safety Agency (MSA) of<br />
China; Mr. Chang Fu Zhi, Director<br />
of the Navigation Safety Division<br />
of SMSA; Mr. Chen Zhen Wei,<br />
Director of the Aids To Navigation<br />
District of SMSA; Mr. Gao<br />
Hui, an Engineer from the Ministry<br />
of Communication; and Mr. Hu<br />
Ming, an Investments Engineer<br />
from the <strong>Ship</strong>ping Bureau of the<br />
Ministry of Communication.<br />
The group had previously visited<br />
the USCG’s Pacific Area Headquarters<br />
in Alameda, California;<br />
Vessel Traffic Service facilities<br />
San Francisco; and a USCG small<br />
boat Group and Air Station in Los<br />
Angeles. In a meeting with Vice<br />
Admiral Collins, the U.S. Coast<br />
Guard’s Pacific Area Commander,<br />
discussions centered on developing<br />
a “partnership” between the<br />
MSA and USCG on such matters<br />
as search and rescue, port state<br />
control, and oil pollution response<br />
programs.<br />
The purpose of their New York<br />
visit was to brief AMVER officials<br />
on the establishment of a<br />
new China <strong>Ship</strong> Reporting System<br />
(CHISREP) for any vessels,<br />
foreign and domestic, that enter<br />
the Chinese sea area (9 degrees N<br />
northward, 130 degrees E, westward,<br />
excluding other countries’<br />
Continued on Page 19
Hands Across the Water!<br />
Continued from page 18<br />
territorial seas). Participation in<br />
CHISREP is mandatory for all<br />
Chinese-registered ships over 300<br />
GT engaged in international<br />
routes, and 1600 GT engaged in<br />
domestic coastal routes. All ships<br />
not registered in China must report<br />
when they arrive or depart from<br />
Chinese harbors. The reporting<br />
scheme follows the IMO-prescribed<br />
format.<br />
The main functions of CHISREP<br />
are to provide assistance for<br />
search and rescue, marine safety<br />
and pollution prevention, utilizing<br />
information from the system.<br />
CHISREP is an active system,<br />
which means once a ship joins<br />
CHISREP and begins sending<br />
daily position reports, if a report is<br />
missed, the CHISREP Center will<br />
perform a pre-alarm and consult<br />
the ship’s company, operator or<br />
related departments to ensure that<br />
the ship is in no distress. Reports<br />
fall into two categories: General<br />
Reports (Sail Plan, Position<br />
Report, Deviation Report, and<br />
Final Report), and Special Reports<br />
(Dangerous Goods, Harmful<br />
Substances, and Marine Pollutant<br />
Reports). Reports can be sent via<br />
NBDP, Morse, wireless phone, or<br />
Inmarsat. Coast Radio Stations in<br />
Shanghai, Guangzhou, and Dalian<br />
are prescribed report-receiving<br />
stations. The CHISREP computer<br />
center is located in the Shanghai<br />
Maritime Safety Administration.<br />
There was an exchange of information<br />
on the operation of both<br />
systems. By comparison to the<br />
AMVER<br />
Officials of the China <strong>Ship</strong> Reporting System (CHISREP) and U.S. Coast<br />
Guard AMVER Safety Network exchange information on the similarities<br />
and differences between the two computerized lifesaving systems. From<br />
right, Richard Kenney (U.S. Coast Guard AMVER Maritime Relations<br />
Officer), Wang Zhi Yi (Director General, Shanghai Maritime Safety<br />
Agency), and Gabriel Kinney (Chief, U.S. Coast Guard, Office of Search<br />
and Rescue). An interpreter is seated on the far right.<br />
worldwide AMVER system,<br />
CHISREP is a smaller, regional<br />
system. In contrast to the Chinese<br />
system, AMVER is used only for<br />
search and rescue. It is a “passive”<br />
system that does not initiate action<br />
unless a ship is unreported or<br />
overdue. The only reports required<br />
are the Sail Plan, Position Reports,<br />
Deviation Report, and Arrival<br />
Report. The Coast Guard representatives<br />
took advantage of the<br />
opportunity to promote increased<br />
AMVER participation by the<br />
COSCO fleet. Captain Shen was<br />
called upon to relate his experience<br />
in carrying out an AMVER<br />
rescue of a yachtsman in a remote<br />
area of the Pacific Ocean during a<br />
storm to illustrate the value of<br />
AMVER reporting.<br />
Discussions also centered around<br />
other search and rescue issues of<br />
mutual interest, such as GMDSS<br />
implementation, and the planned<br />
COSPAS-SARSAT termination of<br />
121.5 MHz beacon processing. A<br />
bilateral agreement between the<br />
two nations, signed in 1987, was<br />
seen as a good blueprint for future<br />
close cooperation in training,<br />
communications, and even joint<br />
search and rescue exercises. Both<br />
sides considered this dialogue<br />
valuable to understanding the role<br />
of both the AMVER and<br />
CHISREP systems, and the<br />
benefits of maximum participation<br />
by ships in both. It was agreed that<br />
discussions would continue on<br />
broader issues of search and<br />
rescue so that, by joint cooperation,<br />
the two nations could enhance<br />
safety of life at sea.h<br />
August 1999 19
Are weather buoys relatively<br />
new?<br />
Actually, no. The U.S. Navy first<br />
developed experimental buoys to<br />
acquire weather data in the 1950s.<br />
Approximately 50 individual data<br />
buoy programs were conducted by<br />
many agencies and research<br />
laboratories in the 1960s. The<br />
National Data Buoy Center<br />
20 Mariners Weather Log<br />
National Data Buoy Center<br />
Some Frequently Asked Questions About NDBC Buoys<br />
David B. Gilhousen<br />
National Data Buoy Center<br />
Bay St. Louis, Mississippi<br />
(NDBC) was founded in 1970 as a<br />
joint National Weather Service<br />
(NWS)–U.S. Coast Guard<br />
(USCG) project, and deployed its<br />
first experimental buoy southeast<br />
of Norfolk, Virginia, in 1972. By<br />
1979, NDBC had moored 26<br />
buoys in the Pacific, Atlantic, and<br />
Gulf of Mexico. There are presently<br />
67 buoy stations supported<br />
by NWS and other agencies.<br />
What is relatively new are the web<br />
sites that help to disseminate the<br />
observations. NDBC’s web site,<br />
http://www.ndbc.noaa.gov/<br />
receives approximately 2 million<br />
hits each month, and the NWS’s<br />
Interactive Marine Observation<br />
page, http://www.nws.fsu.edu/<br />
buoy/, which also contains<br />
Canadian and British buoys,<br />
Continued on Page 21
Questions About NDBC Buoys<br />
Continued from Page 20<br />
receives approximately 3.5 million<br />
hits each month.<br />
Why aren’t waves measured<br />
at more stations?<br />
Sea state is not an easy measurement<br />
to make. Between the two<br />
major types of NDBC stations<br />
(floating moored buoys and fixed<br />
platforms), it is more difficult to<br />
measure waves from a platform.<br />
If the station identifier is alphanumeric<br />
instead of numeric, the<br />
station is a fixed platform in the<br />
Coastal-Marine Automated<br />
Network (C-MAN). For example;<br />
• CSBF1 identifies the C-MAN<br />
station at Cape San Blas,<br />
Florida<br />
• 42036 identifies a moored<br />
buoy in the northeastern Gulf<br />
of Mexico.<br />
A C-MAN automatic weather<br />
station is usually located on a<br />
lighthouse, pier, jetty, piling,<br />
beach, or offshore platform. Only<br />
on offshore platforms, where<br />
NDBC uses a downward-pointing<br />
laser sensor, can waves be easily<br />
measured. Even if waves could be<br />
measured at all C-MAN stations,<br />
the wave measurements would be<br />
severely affected at many of these<br />
sites by shallow water and would<br />
not be representative of nearby<br />
deeper water.<br />
Who determines where<br />
buoys and C-MAN stations<br />
are located?<br />
No one person or agency determines<br />
the locations. The number<br />
of buoy locations grew and<br />
evolved in response to the changing<br />
needs of the NWS, other<br />
government agencies, and nonfederal<br />
reimbursable customers.<br />
The first group of buoys was<br />
placed 200 to 300 miles offshore<br />
for NWS support in the 1970s.<br />
The NWS chose these locations<br />
because they wanted advance<br />
indication of storms and wave<br />
conditions before they affected the<br />
coastal areas. Then, after 1979,<br />
eight buoys were deployed in the<br />
Great Lakes in response to the<br />
sinking of the Edmund<br />
Fitzgerald. When the USCG<br />
announced plans to automate<br />
lighthouses, Congress funded the<br />
NWS for the C-MAN program in<br />
the 1980s. Although the C-MAN<br />
program did include several<br />
offshore platforms and (originally)<br />
a few coastal buoys, most coastal<br />
buoys were funded through<br />
reimbursable agreements with<br />
National Data Buoy Center<br />
government agencies other than<br />
NWS. Some of these agencies<br />
support data collection for experiments<br />
that could last from a few<br />
months to several years. Once the<br />
experiment is complete, the station<br />
is no longer continued unless<br />
Congress supplies funding.<br />
Several years ago, Congress<br />
supplied permanent funding for 36<br />
buoy and C-MAN stations that<br />
had been funded originally by<br />
other government agencies.<br />
Can cameras that relay<br />
“live” photos be added to<br />
NDBC buoys?<br />
Yes, but several significant<br />
problems would have to be solved.<br />
First, a method of keeping salt<br />
spray off the lenses would have to<br />
be developed. NDBC tries to<br />
operate stations one to two years<br />
without servicing them. Second,<br />
the communications capability of<br />
the Geostationary Operational<br />
Environmental Satellite (GOES)<br />
system that NDBC uses is far too<br />
limited to relay photos. Other<br />
satellites could be used, but they<br />
would be very expensive to<br />
operate.<br />
For answers to other frequently<br />
asked questions, visit: http://<br />
www.ndbc.noaa.gov/faq.<br />
shtml/<br />
August 1999 21
What is it?<br />
Marine debris comes from a<br />
myriad of sources, land-based<br />
activities and ship-based activities<br />
alike. Whatever the source,<br />
however, the effects of this<br />
disposal are the same. Trash in our<br />
oceans and coastal waters diminishes<br />
aesthetics, harms natural<br />
resources, and costs everyone in<br />
clean up expenses. It’s often<br />
difficult to pinpoint the sources of<br />
most debris, as the nature of the<br />
oceans transport these materials<br />
sometimes thousands of miles<br />
from their origin, and trash usually<br />
doesn’t come with an identification<br />
tag. Likewise the vast nature<br />
of the oceans makes it easy to<br />
forget or overlook the tonnage of<br />
debris that enters the waters. Once<br />
out to sea, our interaction or<br />
exposure to the problem is minimal<br />
to nonexistent. And what we<br />
don’t see, we tend less to worry<br />
over. Through the ages, dumping<br />
of trash into the oceans seemed<br />
only natural, as the waters appeared<br />
able to accommodate our<br />
debris indefinitely. Once the trash<br />
disappeared from sight as it settled<br />
beneath the surface, problems<br />
22 Mariners Weather Log<br />
Marine Biology<br />
Marine Debris: Sources and Sinks in the Ocean Environment<br />
Ramona Schreiber<br />
<strong>NOAA</strong> Office of Policy & Strategic Planning<br />
Washington, D.C.<br />
seemed nonexistent, effects<br />
appeared nil, and any concerns<br />
drifted away with the ocean<br />
currents. Only relatively recently<br />
did we begin to notice the results<br />
of the years of misuse. Animals<br />
entangled in nets, shipboard<br />
wastes spread across the shores,<br />
miscellaneous debris afloat in the<br />
waters we use more and more for<br />
recreation. With our growing<br />
dependence upon the coasts and<br />
coastal waters for sport as well as<br />
economic gain, our awareness of<br />
these impacts has heightened. We<br />
are finally understanding the<br />
effects of our early mistakes. It’s<br />
now our job to take steps to stop<br />
ongoing impacts and clean up the<br />
effects from past wrongs. This<br />
article discusses the impacts,<br />
sources, and solutions to marine<br />
debris.<br />
What are the impacts?<br />
Once debris enters the marine<br />
environment, its biological effects<br />
may be considered in three<br />
primary areas: entanglement,<br />
consumption, or habitat degradation.<br />
These produce immediate to<br />
residual impacts, from loss of<br />
forage space to tragic deaths.<br />
Marine mammals, seabirds, and<br />
sea turtles all are at significant risk<br />
to entanglement. Studies estimate<br />
that at least 135 species of vertebrates<br />
and eight invertebrates have<br />
been reported through surveys as<br />
entangled in marine debris. These<br />
animals often seem to “play” with<br />
items they encounter, inadvertently<br />
exposing themselves to<br />
greater risk of becoming ensnared.<br />
The effects of entanglement can<br />
be quite severe. The most likely<br />
result is death due to drowning,<br />
often over an extended period, as<br />
animals respond to the stressor by<br />
twisting and worsening the clutch<br />
of the debris. Some impacts may<br />
extend even longer, such as lowgrade<br />
suffocation from plastic<br />
bands that restrict airways as the<br />
animals grow.<br />
The global biological effects of<br />
debris tend to vary with the health<br />
of a particular species’ population.<br />
When entanglement occurs within<br />
strong populations such as sea<br />
lions, herring gulls, or northern<br />
elephant seals, losses may have<br />
limited effects on the population.<br />
Continued on Page 23
Marine Debris<br />
Continued from Page 22<br />
While individual animals are lost,<br />
the populations are able to sustain<br />
themselves. For other populations<br />
that are no longer at sustainable<br />
levels, risk to entanglement may<br />
have a significant effect on the<br />
population’s continued existence.<br />
Hawaiian monk seals, green sea<br />
turtles, and northern right whales<br />
are examples of such species.<br />
Losses of even limited numbers of<br />
these individuals may drastically<br />
reduce that group’s ability to<br />
continue existence.<br />
How much of an effect this impact<br />
has on a population depends on<br />
the level of interaction between<br />
the stressor and the species. For<br />
example, birds tend to use plastics<br />
in nest building, picking up odds<br />
and ends throughout their daily<br />
excursions. Bits of net, bags, or<br />
line may stand out as a valuable<br />
commodity to an efficient builder.<br />
The dangers in collecting this<br />
debris include risk of entanglement<br />
as fishing nets are hauled on<br />
board or lines are shuttled off back<br />
decks. Birds may attempt to land<br />
on cast off net that is afloat on the<br />
surface, then become entangled,<br />
and eventually drown. Curiosity of<br />
young animals results in increased<br />
entanglements of juvenile seals<br />
and other mammals. Turtles and<br />
sea lions may swim through<br />
netting or ringed bands, resulting<br />
in the plastic encircling a neck or<br />
fin. Over time, this debris may<br />
constrict growth, ultimately<br />
strangle, promote infection in an<br />
open wound, or amputate a limb.<br />
Yet another risk comes from future<br />
entanglement, as a piece of rope or<br />
Marine Biology<br />
filament may drag behind an<br />
ensnared animal, eventually<br />
snagging on rocks, kelps, or<br />
corals, or even tethering an animal<br />
from swimming free. These and<br />
many other methods are indicative<br />
of the devastating effects marine<br />
debris may have on many marine<br />
animals.<br />
In the marine environment,<br />
animals generally rely less on<br />
vision in determining food<br />
sources. Dark waters and continuous<br />
wave action tend to make<br />
man-made items indistinguishable<br />
from food. Plastic pellets often<br />
resemble prey items for seabirds<br />
seeking a young crab afloat in<br />
surface waters. The adverse<br />
effects of plastics ingestion may<br />
even be passed through a colony<br />
by simple rearing characteristics.<br />
For example, adult birds may pass<br />
plastic pellets to their young as<br />
they feed by regurgitation. Juvenile<br />
fledglings may accumulate<br />
sufficient materials that their food<br />
becomes toxic. Jellyfish are a<br />
favorite meal for many species,<br />
however its appearance underwater<br />
is quite similar to a discarded<br />
plastic bag. Ingested by a sea<br />
turtle, whale or other animal, the<br />
effects are devastating. Plastics<br />
may obstruct airways and digestive<br />
tracts. A pygmy whale made<br />
international news when bags<br />
upon bags were removed from her<br />
gut. The plastics, twisted with air<br />
pockets throughout, inhibited her<br />
ability to dive, keeping her<br />
buoyant above critical food<br />
sources. Starving and unable to<br />
navigate, she was near death when<br />
luck came her way and she was<br />
rescued. To her good fortune,<br />
veterinarians were able to remove<br />
the debris and nurse her to health<br />
before returning her to her natural<br />
environment. These effects are<br />
examples with potentially lethal<br />
results. Sublethal effects have<br />
been found as well, including<br />
reduced growth and feeding<br />
desire.<br />
Impacts to the biological environment<br />
such as these touch our<br />
emotions. We hate to think of sad<br />
sea lions succumbing to a slow<br />
and tragic end. Other emotions are<br />
rallied at the thought of our<br />
beaches being littered with<br />
medical waste or toxic materials,<br />
our human environment likewise<br />
succumbing to tragic impacts. Our<br />
lives are affected, in terms of<br />
ability to enjoy recreation, fish for<br />
our livelihoods, or move freely<br />
across the marine environment.<br />
We expect our shorelines to be<br />
clear of trash, so that we can enjoy<br />
the outdoors with our families,<br />
without worry of exposure to<br />
empty bottles or used syringes.<br />
Increasingly, however, visits to the<br />
beaches bring us face to face with<br />
the problem. Plastics wash ashore<br />
from distant cargo vessels, medical<br />
and industrial wastes float<br />
from trash barges or sewer overflows,<br />
and the disinterested<br />
neighbors up the beach leave<br />
leftover picnic utensils for the<br />
next recreationer to pick that spot<br />
in the sun. By any path it takes,<br />
marine debris on the shoreline is<br />
an alarm to us. It’s visually<br />
unappealing, as well as a potential<br />
health risk. And while the aesthetics<br />
may have a significant connection<br />
to our economy, the greater<br />
Continued on Page 24<br />
August 1999 23
Marine Debris<br />
Continued from Page 23<br />
disturbance is to the delicate<br />
balance that keeps the coastal<br />
environment running in check.<br />
When this balance slides one way<br />
or the other, tourism dollars may<br />
likewise wane from the coastal<br />
communities so closely tied to the<br />
environment. Without picturesque<br />
estuaries, healthy tidal pools and<br />
clean sandy shores, the draw to the<br />
beach is not as strong. Vacation<br />
dollars that previously supported<br />
coastal enterprises may be redirected<br />
to support a timberline<br />
lodge or non-coastal adventure.<br />
These impacts affect the shoreward<br />
side of the coastal environment,<br />
yet the problems with<br />
marine debris don’t stop there.<br />
Out at sea, boaters and commercial<br />
fishers also feel the effects of<br />
trash in the waters. Fishermen may<br />
feel economic impacts as their<br />
target catches are caught by other<br />
means. For example, lost gear<br />
from one fishery may entrap<br />
species of another fishery. When a<br />
fishery is large, the effects may be<br />
minimal. Yet when a fishery<br />
consists of a handful of captains,<br />
any lost catch is a factor in the<br />
sustainability of the resource and<br />
the associated income. Economic<br />
impacts also come to those fishers<br />
that lose their gear. Nets, lines,<br />
and traps can cost tens of thousands<br />
of dollars to a fisherman<br />
each year. Gear lost at sea not only<br />
costs the fishery in terms of<br />
environmental costs, but in<br />
replacement costs as well. Yet<br />
another aspect involves the effects<br />
24 Mariners Weather Log<br />
Marine Biology<br />
of marine debris on the boats<br />
themselves. Propellors may<br />
become entangled in drifting net<br />
or lines, floating trash may<br />
damage props, and large scale<br />
objects may even impart damage<br />
to hulls. Typically these impacts<br />
are the result of another boat’s<br />
carelessness with trash. The<br />
responsibility is on each vessel so<br />
that it’s trash doesn’t adversely<br />
affect the livelihood or recreational<br />
enjoyment of others.<br />
Where does it come from?<br />
Marine debris can take several<br />
forms and evolve from many<br />
sources. The most common debris<br />
is plastics, in a myriad of forms.<br />
Other debris include contaminants<br />
such as oil spillage and toxic<br />
discharge, as well as point source<br />
pollution from sewage outfalls.<br />
Some debris is just plain random,<br />
such as tires, crates, or galley<br />
wastes, all of which affect the<br />
marine environment. The effects<br />
vary between degrading to debilitating,<br />
depending on where in the<br />
ocean environment the debris<br />
resides. For example, food wastes<br />
discharged from a ship may be<br />
consumed by marine species, yet<br />
the plastic bag in which it was<br />
contained may suffocate a sea<br />
turtle. Ice bags and bait boxes may<br />
entrap other organisms or suffocate<br />
important fauna once they<br />
settle on the sea floor.<br />
Vessel debris is a visible focus in<br />
the discussion of marine debris.<br />
<strong>Ship</strong>s have sailed the seas for<br />
hundreds of years, and only<br />
recently (such as the 1970s) has<br />
the practice of overboard disposal<br />
become a globally recognized<br />
concern. In beginning to remedy<br />
the problem, many of the solutions<br />
are wrapped with issues more<br />
difficult than simply ordering<br />
ships to return all wastes to port.<br />
The costs involved in retaining<br />
wastes can be significant, as can<br />
costs for dockside disposal.<br />
Determining who pays for disposal<br />
also is a factor. These are<br />
just some of the issues that limit<br />
developing countries from ratifying<br />
MARPOL Annex V*.<br />
A final source of debris comes<br />
from land-based sources. Urban<br />
areas inland of waterways are<br />
culprits in the degradation of our<br />
coastal zone as a result of sewer<br />
overflows or industrial wastes.<br />
Not only are these sources for<br />
threats to the coastal resources,<br />
but threats to human health as<br />
well. Visibility was high when<br />
surgical wastes began to appear on<br />
public beaches in the 1980s. In an<br />
instant, public concern was raised<br />
sufficient to noticeably reduce<br />
beach visitors for some time.<br />
When rains cause waste treatment<br />
plants to operate above capacity,<br />
human waste and other debris may<br />
be diverted directly to adjacent<br />
rivers or coastal waters. Storm<br />
water also washes debris from<br />
roadways into storm drains, which<br />
eventually reach the same waters.<br />
Flowing underground, these types<br />
of pollution travel out of the<br />
public’s sight and often mind.<br />
Nevertheless, the impacts occur,<br />
thus education is necessary to<br />
reduce the impacts from their<br />
start.<br />
Continued on Page 25
Marine Debris<br />
Continued from Page 24<br />
What’s the Answer?<br />
Studies show there is a significant<br />
value placed on clean beaches,<br />
even by the public that does not<br />
necessarily visit a beach. Just<br />
knowing that our coastal zone is<br />
clean is of value to many. Given<br />
this value, how do we reduce the<br />
debris and impacts on the resources?<br />
This requires actions at<br />
several stages, from product<br />
development to public education.<br />
A good example of improvement<br />
comes from our beverages. A<br />
sizable source of impact and risk<br />
to marine resources came from<br />
plastic six-pack rings. Thousands<br />
of animals become entangled<br />
when these rings find their way to<br />
oceans and beaches and thousands<br />
of rings are retrieved in annual<br />
beach clean ups. One manufacturer<br />
recognized the problems this<br />
product caused and sought a<br />
remedy. With the assistance of<br />
design teams, plastic rings were<br />
improved in production to increase<br />
degradation rates of the<br />
plastic in sunlight and to include<br />
pull tabs to break individual rings<br />
apart after use.<br />
The U.S. ratified Annex V more<br />
than ten years ago, yet implementation<br />
is still a challenge. By 1993,<br />
69 nations had ratified Annex V.<br />
Difficulties include the magnitude<br />
of coverage (the world’s oceans)<br />
and limited resources for surveillance,<br />
lack of prosecution for<br />
foreign fleets by flag states, and<br />
economic disincentives. Despite<br />
these hurdles, there have been<br />
remarkable gains made in some<br />
Marine Biology<br />
areas. Annual numbers of vessels<br />
off-loading garbage has increased<br />
significantly and steadily, a<br />
reflection of increasing compliance.<br />
Beach clean ups of plastics,<br />
which may be an indicator for<br />
Annex V compliance, are reporting<br />
decreasing percentages of such<br />
wastes among the trash removed<br />
from the shoreline. Education is a<br />
strong step in influencing change,<br />
particularly among the public that<br />
uses its beaches, for fishing,<br />
diving, and general enjoyment of<br />
the coastal environment. Where do<br />
we go from here? A few strategies<br />
for improved implementation may<br />
include:<br />
• Work with recreational<br />
boaters to fully comply with<br />
zero-discharge of debris.<br />
Because this group generally<br />
remains close to shore and<br />
trips are short, storage of all<br />
trash for disposal portside<br />
should be a reasonable<br />
mandate. Reduction in disposable<br />
materials will reduce the<br />
amount of trash to be stored.<br />
Educating boaters will also<br />
assist in reaching full compliance.<br />
• Commercial fishing vessels<br />
operating shorter trips should<br />
also reach full compliance.<br />
Initiatives to recycle fishing<br />
gear would reduce that left at<br />
sea and new technology may<br />
be available to reduce the<br />
amounts of gear lost. Annex V<br />
enforcement must also be<br />
increased, perhaps via labeling<br />
gear as well as reporting of<br />
lost gear for accountability.<br />
• <strong>Ship</strong>ping vessels should<br />
implement improved onboard<br />
garbage handling methodologies<br />
and ports should provide<br />
adequate trash reception<br />
facilities.<br />
A clean ocean is integral to<br />
healthy resources. The public<br />
desires a clean coastal environment<br />
and our marine resources<br />
depend on clean waters to exist.<br />
Given these fundamental requirements,<br />
it is clear that we all must<br />
work together to support the<br />
resources. By keeping our beaches<br />
clean, returning all trash from<br />
vessels to the dockside, and<br />
stopping discharge of pollutants<br />
and debris from stormwater flows,<br />
we will all contribute to a healthy<br />
marine environment.<br />
Footnote<br />
* The 1973 International Convention<br />
for the Prevention of Pollution<br />
from <strong>Ship</strong>s is known as<br />
MARPOL. It went into effect in<br />
1983 with the intent to end the<br />
“deliberate, negligent, or accidental<br />
release of harmful substances<br />
from ships” and to work toward<br />
the elimination of international<br />
pollution of the marine environment.<br />
It focuses on the wastes<br />
generated during the normal<br />
operations of vessels. MARPOL<br />
falls under the umbrella of the<br />
International Maritime Organization.<br />
Within the United States, the<br />
Coast Guard has the implementing<br />
authority. MARPOL includes<br />
several annexes. Annex V addressed<br />
ship-generated garbage,<br />
including a prohibition on disposal<br />
of plastics in the ocean. Annex V<br />
took effect December 31, 1988.h<br />
August 1999 25
Marine Weather Review<br />
North Atlantic Area<br />
December 1998 through March 1999<br />
George P. Bancroft<br />
Meteorologist<br />
Marine Prediction Center<br />
December began with a<br />
strong upper level ridge of<br />
high pressure over the<br />
eastern Atlantic which forced<br />
developing lows exiting the U.S.<br />
East Coast or the Canadian<br />
Maritimes northward toward<br />
Greenland and Iceland. Later in<br />
December the ridge broke down,<br />
leading to more unstable zonal<br />
(westerly) flow across the Atlantic<br />
steering the cyclones more east<br />
into the Great Britain area. This<br />
was the most active part of the<br />
winter in the North Atlantic,<br />
which lasted through January.<br />
The strong ridge re-appeared in<br />
the eastern Atlantic by February<br />
which led to a series of slow<br />
moving lows developing off the<br />
southeast U.S. coast, making late<br />
winter the most active period<br />
off the entire East Coast.<br />
Hurricane Nicole<br />
The tropical cyclone season<br />
normally runs through November<br />
in the North Atlantic. However,<br />
26 Mariners Weather Log<br />
December 1998 began with<br />
Hurricane Nicole moving north<br />
along 35W in the high seas waters<br />
and becoming an extratropical<br />
storm by 00Z 02 December<br />
(Figure 1). The two 500 mb<br />
analysis charts in Figure 1 (corresponding<br />
to the first and third<br />
panels of the surface analysis)<br />
show a weak 500 mb low near<br />
34N 40W associated with Nicole<br />
which re-intensified as an extratropical<br />
storm. Note the 60 kt ship<br />
report west of the center at 00Z 02<br />
December. This system later<br />
merged with the storm center<br />
moving off the Labrador coast<br />
leading to a 964 mb storm over the<br />
Labrador Sea by 00Z 04 December<br />
(not shown).<br />
Storm of December 22-24,<br />
1998<br />
This system strengthened explosively<br />
while still over land, from<br />
989 mb at 12Z 22 December to<br />
949 mb at 12Z 23 December when<br />
the center was just off the Labra-<br />
Marine Weather Review<br />
dor coast, a drop of 40 mb in 24<br />
hours. The 24 hour track of the<br />
developing storm in the first<br />
surface panel of Figure 2 shows<br />
this strengthening. At 500 mb the<br />
development is supported by a<br />
strong short wave trough and jet<br />
of more than 100 kt (Figure 2).<br />
The storm, southeast of Cape<br />
Farewell at 12Z 24 December,<br />
reached maximum intensity by<br />
that time and was the second most<br />
intense North Atlantic storm of<br />
the winter, second only to the 926<br />
mb storm described below.<br />
Surface data was sparse, but there<br />
was a ship report that reported<br />
951.3 mb pressure, southwest<br />
wind of 35 kt, and 9 meter seas<br />
(30 ft), just southeast of the center<br />
shown in the second surface<br />
analysis of Figure 2. Gale to storm<br />
force winds occurred as far south<br />
as 45N south of the center. This<br />
system then drifted east and<br />
weakened.<br />
Continued on Page 29
Marine Weather Review<br />
Figure 1. Series of three surface analysis charts for the period 00Z 01 December 1998 to 00Z 02 December 1998<br />
and two 500 millibar analysis charts valid 00Z 01 December 1998 and 00Z 02 December 1998 showing<br />
transformation of Hurricane Nicole into an extratropical storm.<br />
August 1999 27
28 Mariners Weather Log<br />
Figure 2. Two-panel display of surface analyses and corresponding 500-millibar analysis charts valid 12Z 22 December 1998 and 12Z 24 December<br />
1998 showing development of the storm of December 22-24, 1998.<br />
Marine Weather Review
North Atlantic Area<br />
Continued from Page 26<br />
British Isles Storm<br />
December 26-27, 1998<br />
This system developed off the<br />
South Carolina coast late on<br />
December 23 and became a storm<br />
south of Newfoundland near 42N<br />
by 00Z December 25. It was<br />
picked up by a strong short wave<br />
trough and underwent explosive<br />
strengthening shown in Figure 3.<br />
Much of the intensification shown<br />
in Figure 3 occurred in the 6 hour<br />
period from 06Z to 12Z December<br />
26 when the central pressure<br />
dropped 22 mb. The 500 mb<br />
analysis in Figure 3 is valid<br />
between the two surface analysis<br />
times and shows a short wave<br />
trough with negative tilt approaching<br />
Ireland (a trough which tilts to<br />
the left northward along its axis),<br />
supported by a very strong 120 kt<br />
jet. These conditions were favorable<br />
for rapid strengthening. The<br />
second surface panel of Figure 3<br />
shows the storm at maximum<br />
intensity slamming into the British<br />
Isles. A wind of 50 kt was reported<br />
by a ship near the coast of<br />
Ireland. At 12Z 26 December,<br />
between the valid times of the two<br />
surface analyses in Figure 3, buoy<br />
62081 just southwest of Ireland<br />
near 51N 13W reported 11 meter<br />
seas (36 ft). To the southwest of<br />
the buoy, ship PJRN (name not<br />
known) near 50N 15W reported a<br />
west wind of 55 kt. Seas were 6<br />
meters (20 ft) or higher south of<br />
the storm center down to 40N<br />
and west to 30W at that time.<br />
Figure 4 is a METEOSAT7<br />
infrared satellite image of the<br />
storm near maximum intensity.<br />
The center is clearly evident and<br />
marked by a “ring cloud”, a<br />
signature of a very intense cyclone.<br />
December 27-28 Storm<br />
This system formed off the<br />
southeast U.S. coast like its<br />
predecessor, but moved east along<br />
47-48N before turning more north<br />
upon approaching 20W. It was<br />
moving at more than 50 kt while<br />
passing east of Newfoundland and<br />
rapidly intensifying. Figure 5<br />
shows this system absorbing an<br />
arctic front moving off the Canadian<br />
Maritimes. It would appear<br />
that the arctic air drawn into the<br />
circulation and the fast eastward<br />
motion could account for the<br />
reported winds. In Figure 5, ship<br />
the MSC Sicily (DDPH) reported<br />
a northwest wind of 90 kt at 18Z<br />
28 December. Twelve hours<br />
prior to this, the Galveston Bay<br />
(WPKD) reported northwest<br />
winds 75 kt. These reports were<br />
the highest reported winds in<br />
either oceanic area during the<br />
four-month period. At 18Z 28<br />
December the cluster of ships (on<br />
the analysis in Figure 5) southwest<br />
of the center, between 36N and<br />
40N, reported northwest winds 50<br />
to 55 kt and seas 8 to 13 meters<br />
(26 to 43 ft). The ships with south<br />
to southwest winds 45 to 55 kt<br />
southeast of the center at that time<br />
reported seas 9 to 10 meters (30 to<br />
33 ft).<br />
926 mb Storm Near Iceland<br />
January 15-16<br />
Like the December 27-28 storm,<br />
this system was moving more than<br />
50 kt as it rapidly intensified<br />
near Newfoundland at 00Z 14<br />
Marine Weather Review<br />
January (Figure 6). The central<br />
pressure dropped 50 mb in the 24hour<br />
period ending at 00Z 15<br />
January and another 35 mb in the<br />
following 24 hours, leading to a<br />
large 926 mb storm just south of<br />
Iceland at 00Z 16 January. This<br />
was the most intense storm of<br />
the season in either ocean. Figure<br />
7 is a METEOSAT7 infrared<br />
satellite image showing the storm<br />
near maximum intensity just<br />
southeast of Iceland. The appearance<br />
of a ring of cold-topped<br />
clouds around the center along<br />
with the dry slot wrapping around<br />
the center are characteristic of a<br />
very deep, intense low (see Figure<br />
7). A study done for mid-latitude<br />
storms showed a relationship<br />
between cloud patterns, stages of<br />
storm development, and central<br />
pressures. Storms that undergo<br />
an intensification below 960 mb<br />
develop “ring cloud” features.<br />
(Reference: Frank J. Smigielski<br />
and H. Michael Mogil, Use of<br />
Satellite Information For Improved<br />
Oceanic Surface Analysis,<br />
First International Winter Storm<br />
Symposium American. Meteorological.<br />
Society, New Orleans, LA<br />
–January 1991).<br />
At 21Z 15 January ship Dettifos<br />
(P3BK4) reported a south wind of<br />
60 kt and a 928 mb pressure. The<br />
highest reported wind was from<br />
the ship V2XO (name not available)<br />
which reported from 60N<br />
10W at 21Z 15 January with a<br />
southwest wind of 68 kt. Gale- to<br />
storm-force winds and seas of 6 to<br />
9 meters (20 to 30 ft) or more<br />
covered much of the area east of<br />
50W and north 40N at this time.<br />
Continued on Page34<br />
August 1999 29
30 Mariners Weather Log<br />
Marine Weather Review<br />
Figure 3. Two-panel display of surface analyses for 06Z 26 December and 18Z 26 December 1998<br />
showing rapid intensification of the British Isles storm. A 500 mb analysis is included, valid 12Z 26<br />
December 1998, which is between the two surface analysis times.
Marine Weather Review<br />
Figure 4. METEOSAT7 infrared satellite image valid 18Z 26 December 1998.<br />
August 1999 31
32 Mariners Weather Log<br />
Marine Weather Review<br />
Figure 5. Three-panel series of surface analysis charts for the period<br />
18Z 27 December to 18Z 28 December 1998, depicting the storm of<br />
December 27-28 with winds up to 90 kt.
Marine Weather Review<br />
Figure 6. Three-panel series of surface analyses for the period 00Z 14<br />
January to 00Z 16 January, 1999, depicting development of the 926 mb<br />
Iceland storm.<br />
August 1999 33
North Atlantic Area<br />
Continued from Page 29<br />
At 00Z 17 January, 24 hours after<br />
the third analysis in Figure 6, buoy<br />
62108 west of Ireland reported<br />
seas of 9.5 meters (31 ft). To the<br />
south, ship Maersk Colorado<br />
(WCX5081) reported from 47N<br />
21W with a northwest wind 55 kt<br />
and 9 meter seas (30 ft).<br />
Storm off East Coast<br />
February 4-6<br />
A persistent upper level trough<br />
near the U.S. East Coast in<br />
February and March led to frequent<br />
cyclogenesis (storm development).<br />
Unlike storms that<br />
34 Mariners Weather Log<br />
formed earlier in the winter and<br />
moved out rapidly, these were<br />
slower-moving and developed<br />
gale- and sometimes storm-force<br />
winds. One of the strongest of<br />
these East Coast lows strengthened<br />
32 mb after moving off the<br />
southeast Virginia coast at 18Z 04<br />
February, to become a 976 mb<br />
storm 39N 63W 24 hours later<br />
(Figure 8). North to northwest<br />
winds of 45 to 60 kt were on the<br />
back side of the storm west to<br />
73W over the northern mid-<br />
Atlantic offshore waters. Seas<br />
were up to 11 to 13 meters (32 to<br />
43 ft). The system then slowed<br />
and began to weaken and turn<br />
more north as it encountered a<br />
building ridge of high pressure<br />
over the central Atlantic.<br />
Marine Weather Review<br />
Storm March 11<br />
Several storms formed during the<br />
period over the south central<br />
waters and off the coast of Portugal.<br />
The strongest of these is<br />
depicted in Figure 9 near 41N<br />
18W with winds of 50 to 60 kt<br />
reported west of the center.<br />
Reported seas were 5 to 9 meters<br />
(16 to 30 ft) in this area. The<br />
storm, near maximum intensity at<br />
this time, subsequently drifted<br />
southeast and weakened.<br />
Reference<br />
Figure 7. METEOSAT7 infrared satellite image of the storm in Figure 6<br />
near maximum intensity. Valid time is 00Z 16 January 1999.<br />
Sienkiewicz, Joe and Chesneau,<br />
Lee, Mariner’s Guide to the 500-<br />
Millibar Chart (Mariners<br />
Weather Log, Winter 1995).h
August 1999 35<br />
Figure 8. Two- panel display of surface analyses valid 18Z<br />
04 February and 18Z 05 February 1999, depicting<br />
development of the East Coast storm of February 4-5,<br />
1999.<br />
Figure 9. Surface analysis valid 12Z 11 March 1999 showing a cutoff storm off<br />
coast of Portugal.<br />
Marine Weather Review
Marine Weather Review<br />
North Pacific Area<br />
December 1998 through March 1999<br />
George P. Bancroft<br />
Meteorologist Marine Prediction Center<br />
The winter of 1998/1999<br />
was dominated by La Niña,<br />
with a strong jet stream<br />
extending from near Japan east<br />
northeast toward the Gulf of<br />
Alaska. Also a series of strong<br />
upper lows moving east from<br />
Siberia to the Kamchatka Peninsula<br />
area helped fuel significant<br />
developments. This led to frequent<br />
storm development east of Japan,<br />
with the lows then tracking east<br />
northeast to the Gulf of Alaska,<br />
with some of the lows moving<br />
more north into the Aleutians and<br />
Bering Sea and redeveloping in<br />
the Gulf of Alaska or looping back<br />
toward the Kamchatka Peninsula<br />
to be “captured” by the upper low<br />
in that area. Beginning late in<br />
January 1999, an upper low<br />
developed over Alaska and the<br />
Gulf of Alaska. This forced the jet<br />
stream south into the U.S. Pacific<br />
Northwest and Vancouver Island<br />
area and led to more storminess in<br />
that area. This set the stage for the<br />
36 Mariners Weather Log<br />
major storm in early March off the<br />
Washington and Oregon coasts<br />
that is covered in this article.<br />
Storm Near Dateline January<br />
4-8<br />
The two panels of Figure 1 show<br />
the storm developing east of Japan<br />
and strengthening 33 mb during<br />
the 24-hour period between<br />
surface analyses. This development<br />
would therefore qualify as a<br />
meteorological “bomb” labeled on<br />
the analysis as “RAPIDLY IN-<br />
TENSIFYING.” The first 500 mb<br />
chart in the Figure shows a 105 kt<br />
jet, an upper low near the<br />
Kamchatka Peninsula and a pair of<br />
short wave troughs (troughs of<br />
shorter wavelength and amplitude<br />
embedded in large upper lows)<br />
supporting this development. In<br />
the cold unstable air behind the<br />
surface cold front, winds are<br />
stronger than the pressure gradient<br />
Marine Weather Review<br />
indicates. (Note the two 50 kt ship<br />
reports in the first surface panel.)<br />
The second surface analysis in<br />
Figure 1 shows the storm near<br />
maximum intensity at 955 mb<br />
crossing the dateline, unusually<br />
intense for that far south. There<br />
were ship reports with 55 to 60 kt<br />
east and southeast of the center at<br />
12Z 05 January (between surface<br />
analysis times). Also note the 35<br />
kt report with 958 mb pressure<br />
near the center.<br />
The system then drifted northeast<br />
and began to weaken by 7 January.<br />
The second 500 mb chart for 00Z<br />
08 January (two days later) shows<br />
that the Kamchatka upper low has<br />
reformed to the southeast over the<br />
storm center. The storm was<br />
slowly weakening and drifting east<br />
at that time.<br />
Continued on Page 42
August 1999 37<br />
Figure 1. Two-panel display of surface analysis and 500-mb charts showing the development of the early January 1999<br />
storm east of Japan. The second 500-mb chart is valid 48 hours after the second surface analysis.<br />
Marine Weather Review
38 Mariners Weather Log<br />
Figure 2. Two-panel display of surface analysis and 500-mb charts for the storm of February 27-28, 1999 near the Kurile Islands.<br />
Marine Weather Review
Marine Weather Review<br />
Figure 3. Series of three surface analysis charts for the period 02 March 00Z to 03 March 00Z, 1999 and two 500<br />
mb charts valid 01 March 00Z and 03 March 00Z, 1999, depicting the development of the March 2-3 Pacific<br />
Northwest storm.<br />
August 1999 39
40 Mariners Weather Log<br />
Figure 4. GOES infrared image of the storm in Figure 3 near maximum intensity. Valid time is 0015Z 03 March 1999. Colder cloud tops are<br />
computer-enhanced.<br />
Marine Weather Review
August 1999 41<br />
Figure 5. Surface analysis valid 06Z 18 March 1999 showing the first of two<br />
“twin super-storms.” The second part is a sea state analysis valid 00Z 19<br />
March 1999.<br />
Figure 6. Two-panel display of surface analyses valid 00Z 20<br />
March and 18Z 21 March 1999 showing the development of the<br />
second “super-storm” of late March.<br />
Marine Weather Review
North Pacific Area<br />
Continued from Page 36<br />
Storm Near Kurile Islands<br />
February 27-28<br />
This storm resulted from the<br />
explosive strengthening of a low<br />
as it moved into the northern Sea<br />
of Japan and then to the southern<br />
Sea of Okhotsk. The system<br />
slowed with the lowest pressure at<br />
954 mb near 50N 150E at 06Z 28<br />
February as shown in the second<br />
surface analysis in Figure 2. The<br />
most rapid strengthening was the<br />
drop from 1000 mb at 18Z 26<br />
February (when the center was<br />
moving off the coast) to 962 mb at<br />
18Z 27 February. The accompanying<br />
500 mb charts show that the<br />
development is supported by a<br />
disturbance (strong short wave<br />
trough) and 100 kt jet moving<br />
42 Mariners Weather Log<br />
northeast from Japan (first panel).<br />
Then in the second panel the<br />
system has strengthened into an<br />
intense upper low nearly vertically<br />
stacked (from lower to higher<br />
levels in the atmosphere).<br />
As the system reached maximum<br />
intensity, gale- to storm-force<br />
winds appear behind the front<br />
down to 35N. The maximum<br />
reported wind was a west wind of<br />
60 kt from a ship (name and call<br />
sign not available) at 46N 152E at<br />
12Z 28 February (six hours later).<br />
Maximum seas were around 9<br />
meters (30 ft) near 43N 149E.<br />
Pacific Northwest Storm of<br />
March 2-3<br />
This storm was a classic “bomb,”<br />
forming out of a low near 30N<br />
Marine Weather Review<br />
Figure 7. GMS infrared satellite image of the storm in Figure 6 near maximum<br />
intensity, valid 0332Z 22 March 1999.<br />
which strengthened by 43 mb in<br />
24 hours after it was picked up by<br />
a short wave disturbance coming<br />
from the northwest. Figure 3<br />
illustrates this development. The<br />
southern disturbances (short wave<br />
troughs) consolidate and begin to<br />
close off (intensify to develop a<br />
detached revolving circulation) at<br />
500 mb by 00Z 03 March. Figure<br />
4 is an enhanced infrared satellite<br />
photo of the storm at 00Z 03<br />
March showing the meteorologist<br />
a classic signature of a mature<br />
intense cyclone. The center is<br />
quite evident. The bands of<br />
relatively dry air spiraling around<br />
to the north and west sides of the<br />
center are indicative that the<br />
system is near maximum intensity.<br />
Continued on Page 43
North Pacific Area<br />
Continued from Page 42<br />
This storm packed hurricane force<br />
winds as it reached its peak off the<br />
north Oregon coast. The highest<br />
winds from any of the coastal<br />
buoys were a gust of 62 kt at buoy<br />
46050 moored 15 miles west of<br />
Newport, Oregon. The CMAN<br />
station at Destruction Island a few<br />
miles off the northwest tip of the<br />
Olymic Peninsula reported gusts<br />
to 69 kt at 10Z on 3 March, and<br />
Tatoosh Island (15 miles south of<br />
destruction island) later had gusts<br />
to 77 kt from the west at 16Z on 3<br />
March after the storm center had<br />
passed. Farther offshore a ship, the<br />
Veracruz (ELFO9) reported a<br />
northwest wind of 60 kt at 00Z 03<br />
March (Figure 3). Other reports<br />
around the center of the storm<br />
were in the 40 to 50 kt range.<br />
Perhaps the most notable feature<br />
of this storm was the phenomenal<br />
seas it generated in the coastal<br />
waters and also the rapid building<br />
of the seas as the storm approached.<br />
Maximum seas exceeded<br />
40 ft just off the northwest<br />
Oregon and southwest Washington<br />
coasts. The highest reported sea<br />
was 14 meters (46 ft) at buoy<br />
46050 at 07Z 03 March. This was<br />
more than double the 6.5 meter<br />
sea (21 ft) reported six hours prior<br />
to this at 01Z 03 March.<br />
From a historical perspective, the<br />
NWS Portland, Oregon, office<br />
noted that the central pressure of<br />
this storm was likely equal to that<br />
of the 1962 Columbus Day storm.<br />
Also, seas at the buoy 46050 were<br />
the highest in memory at that<br />
location.<br />
Twin Super-Storms,<br />
Aleutians Area, March 15-22<br />
Besides the storminess associated<br />
with the upper level trough off the<br />
West Coast, there was an active<br />
track of cyclones from Japan to<br />
the Aleutians and southern Bering<br />
Sea and then east. This made<br />
March perhaps the most active<br />
period of the winter. The strongest<br />
of these developed in mid to late<br />
March with central pressures<br />
below 950 mb. Figure 5 shows the<br />
first of these two storms with<br />
similar tracks and intensities. It is<br />
shown near maximum intensity at<br />
946 mb in the central Aleutians at<br />
06Z 18 March in the upper panel<br />
of Figure 5, while the lower panel<br />
is a sea state analysis valid 18<br />
hours later when seas were fully<br />
developed. Note the 16 meter (50<br />
feet) maximum analyzed south of<br />
the center, which was the highest<br />
of all the daily sea state analyses<br />
done by the National Weather<br />
Service, Marine Prediction Center<br />
(MPC) for either ocean in this<br />
four-month period. There was a 60<br />
kt ship report (vessel name<br />
unknown) in the Bering Sea<br />
northwest of the center (Figure 5),<br />
but winds were likely hurricane<br />
force south of the center where<br />
there were no ship reports.<br />
The second storm formed near<br />
Japan at 00Z 20 March and<br />
reached a maximum intensity of<br />
940 mb near the western Aleutians<br />
at 18Z 21 March (Figure 6). Much<br />
Marine Weather Review<br />
of the intensification occurred in<br />
the 24-hour period from 12Z 20<br />
March to 12Z 21 March when the<br />
central pressure dropped 50 mb,<br />
from 992 mb to 942 mb. The<br />
Sealand Liberator (KHRP) at<br />
12Z 21 March reported 20 knot<br />
southeast wind, pressure 943.5 mb<br />
and seas 6 meters (20 ft) near the<br />
center of the storm. After passage<br />
of the center six hours later, the<br />
pressure jumped to 968 mb; wind<br />
increased to northwest 68 kt and<br />
seas built to 9.5 meters (31 ft).<br />
The Polar Eagle (ELPT3)<br />
reported from near 54N 180W at<br />
12Z 21 March with a southeast<br />
wind of 60 kt and seas 7 meters<br />
(23 ft). In the central Bering Sea,<br />
Buoy 46035 reported a peak wind<br />
of 43 knots with gusts to 52 knots<br />
(maximum 60 kt) ahead of the<br />
front at 21Z 21 March. Sea state at<br />
this buoy increased from 2 meters<br />
(7 ft) at 12Z 21 March to 9 meters<br />
(30 ft) 10 hours later. This storm,<br />
like its predecessor, then slowed<br />
and turned east and began to<br />
weaken. Figure 7 is an infrared<br />
satellite image of the fully mature<br />
storm, still with pressure around<br />
940 mb, with the cold, dry air<br />
wrapping completely around a<br />
center which is clearly evident<br />
near 55N 178W in this picture.<br />
Both storms reached maximum<br />
intensity in a relatively data-sparse<br />
area and there were no ship<br />
reports where maximum winds<br />
and seas are likely to have occurred,<br />
south of the centers.<br />
However, remote sensing through<br />
radar altimetry indicated maximum<br />
seas in the 18 to 20 meter<br />
(59 to 65 ft) range (Sienkiewicz,<br />
MPC, personal communication).h<br />
August 1999 43
I. Introduction<br />
La Niña conditions continued<br />
through the period in the tropical<br />
Eastern Pacific. This contributed<br />
to different weather patterns<br />
compared with this time in 1998,<br />
which in turn led to considerably<br />
calmer conditions in the Tropical<br />
Prediction Center (TPC) forecast<br />
areas compared with this time last<br />
year.<br />
II. La Niña and Weather<br />
Events<br />
The El Niño phenomenon is an<br />
abnormal warming of ocean<br />
temperatures in the tropical<br />
Pacific west of South America. As<br />
seen in 1998, it causes major<br />
changes in world weather patterns.<br />
44 Mariners Weather Log<br />
The reverse phenomenon, La<br />
Niña, occurs when these waters<br />
become colder than normal.<br />
Figure 1 shows the Eastern Pacific<br />
sea surface temperature (SST)<br />
anomalies for the week of 24-30<br />
January 1999. Notice the dark<br />
stripe along the Equator west of<br />
110W. This is an area of below<br />
normal SSTs associated with La<br />
Niña, with some temperatures<br />
greater than 2.5 o C below normal.<br />
While strong El Niño events<br />
produce significant and somewhat<br />
predictable changes in weather<br />
patterns, changes associated with<br />
La Niña are less clear. Generally,<br />
strong La Niña events see above<br />
normal numbers of Atlantic<br />
hurricanes and normal to below<br />
normal numbers of Eastern Pacific<br />
Marine Weather Review<br />
Marine Weather Review<br />
Tropical Atlantic and Tropical East Pacific Areas<br />
January through April 1999<br />
Dr. Jack Beven<br />
National Hurricane Center<br />
Daniel Brown<br />
Christopher Burr<br />
Tropical Analysis and Forecast Branch<br />
Tropical Prediction Center<br />
hurricanes. However, there are<br />
exceptions, such as in 1973. While<br />
Eastern Pacific SSTs were below<br />
normal that year, only eight<br />
tropical storms and hurricanes<br />
occurred in the Atlantic compared<br />
with the long term average of ten.<br />
La Niña also affects winter<br />
weather patterns. Normally, the<br />
Gulf of Mexico and adjacent<br />
Atlantic are less stormy during La<br />
Niña events than during El Niño<br />
events, with smaller numbers of<br />
strong low pressure areas. This<br />
results from differences in the jet<br />
stream patterns between the two<br />
types of events. However, strong<br />
winter storms can occur in these<br />
areas during La Niña events, as<br />
shown by the Florida coastal<br />
storm of 10-12 March 1996.<br />
Continued on Page 45
Tropical Prediction Center<br />
Continued from Page 44<br />
As of this writing, the La Niña<br />
might be weakening, as the cold<br />
SST anomalies are slowly<br />
warmimg and the associated<br />
tropical air pressure patterns are<br />
weakening. Is another El Niño on<br />
the horizon? Only time will tell.<br />
III. Start of the 1999<br />
Hurricane Season<br />
May 15 marked the start of the<br />
Eastern Pacific hurricane season<br />
while June 1 is the start of the<br />
Atlantic hurricane season.<br />
IV. Significant Weather<br />
A. Tropical Cyclones: No tropical<br />
cyclones occurred in the Tropical<br />
Atlantic or Tropical Eastern<br />
Pacific during the January - April<br />
period. This is normal, as only<br />
four tropical or subtropical<br />
cyclones are known to have<br />
occurred during this time of year<br />
in these areas since 1886.<br />
B. Other Significant Events: As<br />
mentioned earlier, the first four<br />
months of 1999 were calmer<br />
compared with the El Niño winter<br />
and early spring of 1998. Most<br />
gale events were associated with<br />
strong cold fronts trailing from<br />
gale or storm centers located in<br />
more northerly latitudes. However,<br />
two significant gale centers did<br />
develop. The first was in the far<br />
eastern portion of the tropical<br />
Atlantic area in late January. The<br />
second developed along the Gulf<br />
of Mexico coast in mid-March and<br />
Marine Weather Review<br />
Figure 1. Eastern Pacific sea surface temperature anomalies for the week<br />
of 24-30 January 1999.<br />
produced gale conditions in the<br />
Gulf and Western Atlantic.<br />
1. Atlantic, Caribbean and Gulf of<br />
Mexico<br />
Central Atlantic Gale of 24-27<br />
January: A gale center developed<br />
on 24 January in the central<br />
Atlantic. By 0000 UTC 25 January,<br />
the center was analyzed near<br />
31N 34W with a central pressure<br />
of 1012 mb. Although the central<br />
pressure was rather high, a 1034<br />
mb high pressure system located<br />
northwest of the gale center<br />
combined with it to create a strong<br />
pressure gradient and a large area<br />
of gale force winds. The first ship<br />
report of gale force winds was at<br />
0000 UTC 25 January from the<br />
Chiquita Bremen,which reported<br />
40 kt north winds near 30N 43W.<br />
By 1200 UTC 25 January the gale<br />
had drifted to near 29N 35W<br />
(Figure 2). At that time, the<br />
Robert E. Lee, located near 31N<br />
45W, reported 39 kt northeast<br />
winds and 18 ft combined seas.<br />
The system continued to<br />
strengthen slowly while moving<br />
southwest. By 0000 UTC 26<br />
January (Figure 3) it was located<br />
near 27N 38W with a 1006 mb<br />
central pressure. Because the area<br />
of strong winds remained nearly<br />
stationary for about 36 hours,large<br />
swells were propagated. The ship<br />
V2HL (name not available)<br />
reported 20 foot swells at both<br />
0000 UTC and 1200 UTC 26<br />
January, as did the Chiquita<br />
Rostock near 31N 46W at 1200<br />
UTC. Late on 26 January the high<br />
pressure system began to weaken.<br />
The central pressure dropped to<br />
1004 MB by 0600 UTC 27<br />
January. Although gales ended<br />
about that time, large swells which<br />
had been generated by the gale<br />
Continued on Page 46<br />
August 1999 45
Figure 2. GOES-8 visible image at 1815 UTC 25 January 1999. Image<br />
courtesy of the National Climatic Data Center.<br />
Figure 3. Subset of TAFB surface analysis at 0000 UTC 26 January 1999.<br />
Solid isobars are at 4 mb intervals with intermediate dashed isobars at 2<br />
mb intervals.<br />
46 Mariners Weather Log<br />
Marine Weather Review<br />
Tropical Prediction Center<br />
Continued from Page 45<br />
affected the area for the next few<br />
days.<br />
Atlantic Gale of 31 January - 2<br />
February: On 31 January a low<br />
formed near 34N 61W. As the<br />
system developed, a strong high<br />
pressure center located over the<br />
northeast United States combined<br />
with it to produce strong northeast<br />
winds over a large area of the<br />
western Atlantic. At 0000 UTC 1<br />
February the 1000 mb gale was<br />
centered near 33N 57W. At that<br />
time, the ship C6JS (name not<br />
available) reported 40 kt northwest<br />
winds while the Nolizwe<br />
reported 34 kt winds. Both ships<br />
were near 30N 63W. The Primo<br />
(V7AV6), located closer to the<br />
gale center, reported 41 kt winds.<br />
At 1200 UTC 1 February, the<br />
C6JS near 32N 60W reported 40<br />
kt winds with 26 ft combined seas.<br />
Primo near 29N 36W reported 36<br />
kt. By 1800 UTC 1 February there<br />
was a 996 mb low located near<br />
33N 50W. After 1800 UTC the<br />
gale center turned northeast and<br />
rapidly moved away from the area.<br />
Cold Front and Gale of 16-18<br />
February: Starting at 0000 UTC<br />
16 February, gale conditions<br />
developed north of 29N between<br />
57W and 67W. This occurred<br />
along and to the west of a cold<br />
front trailing from a mid-latitude<br />
gale center. The area of gales<br />
spread east and by 1200 UTC 16<br />
February were north of 28N<br />
between 50W and 61W. At 0000<br />
UTC 17 February the ship C6JS<br />
Continued on Page 47
Tropical Prediction Center<br />
Continued from Page 46<br />
reported 38 kt southwest winds<br />
near 31N 49W. Several ships<br />
reported 10 to 16 ft seas on 17<br />
February. Gale conditions continued<br />
spreading east and by 0000<br />
UTC 18 February were north of<br />
29N between 45W and 60W. The<br />
Gale Force winds ended in this<br />
area by 0600 UTC 18 February.<br />
However, large swells affected the<br />
area through the remainder of the<br />
day.<br />
Cold Front and Gale of 8-10<br />
March: A strong cold front and<br />
associated 20-30 kt winds moved<br />
across the U.S. east coast and the<br />
western Atlantic on 7-8 March,<br />
reaching a 31N 62W to central<br />
Cuba line by 1800 UTC 8 March.<br />
At that time, a developing storm<br />
center produced an area of gales<br />
north of 28N within 300 nm west<br />
of the cold front. The front<br />
continued to move rapidly southeast<br />
and by 1800 UTC 9 March<br />
was analyzed from 31N 50W to<br />
near Puerto Rico. At that time the<br />
ship ELTN6 (name not available)<br />
reported 34 kt west winds near<br />
28N 54W. The Hood Island<br />
reported 34 kt westerly winds at<br />
0000 UTC 10 March west of the<br />
cold front. Gales had moved<br />
further north by 0600 UTC 10<br />
March, although 20-30 kt winds<br />
continued for another 12 hours.<br />
Gulf of Mexico-Atlantic Gale of<br />
12-16 March: A low pressure<br />
center developed over southeast<br />
Texas on 12 March and moved<br />
northeast into southern Louisiana<br />
on 13 March. By 0000 UTC 14<br />
March, the 1000 MB low pressure<br />
Marine Weather Review<br />
Figure 4. GOES-8 visible image at 1815 UTC 14 March 1999. Image<br />
courtesy of the National Climatic Data Center.<br />
was centered just north of New<br />
Orleans moving slowly east. An<br />
associated cold front extended<br />
southwest across the Gulf to near<br />
Veracruz, Mexico. The C-MAN<br />
site at Southwest Pass, Louisiana,<br />
reported 40 kt south winds just<br />
ahead of the cold front. Six hours<br />
later, the Chevron Arizona near<br />
29N 87W reported 38 kt westerly<br />
winds just west of the cold front.<br />
By 1800 UTC 14 March, the low<br />
was centered over north Georgia.<br />
The cold front trailed southward<br />
into north Florida and extended<br />
across the Gulf of Mexico from<br />
Cedar Key to the northeast tip of<br />
the Yucatan Peninsula (Figure 4).<br />
Winds in the Gulf of Mexico had<br />
decreased below gale force.<br />
However, several buoys still<br />
reported 10 to 12 ft seas.<br />
As the front approached the<br />
western Atlantic, the winds again<br />
increased. <strong>Ship</strong> YJWZ7 (name<br />
not available) reported 40 kt<br />
southwest winds at 0000 UTC 15<br />
March near 32N 80W. At 0600<br />
UTC 15 March, the low pressure<br />
system moved off the North<br />
Carolina coast and rapidly developed<br />
into a storm center. The cold<br />
front extended south across the<br />
southern tip of Florida into<br />
western Cuba. Buoy 41002 near<br />
32N 75W reported 40 kt southsoutheast<br />
winds with 15 ft seas at<br />
this time. Later on 15 March the<br />
Continued on Page 48<br />
August 1999 47
Tropical Prediction Center<br />
Continued from Page 47<br />
storm center moved rapidly<br />
northeast.<br />
Caribbean Wind Surge of 17-19<br />
April: From 17-19 April, low<br />
surface pressures over northern<br />
South America, in combination<br />
with a strong high pressure ridge<br />
across the Atlantic, created a<br />
strong pressure gradient across the<br />
central and eastern Caribbean. A<br />
strong easterly wind surge developed<br />
over the southern Caribbean<br />
along and just north of the coast of<br />
Colombia. At 1800 UTC 17 April<br />
the Lincoln Universal near 17N<br />
76W and the Caribic near 13N<br />
75W reported 34 kt and 36 kt<br />
easterly winds respectively. At<br />
nearly the same time, a satellite<br />
scatterometer overpass (Figure 5)<br />
48 Mariners Weather Log<br />
indicated an area 30 to 35 kt winds<br />
over the south-central Caribbean,<br />
confirming the ship observations.<br />
This was a difficult forecast<br />
situation, as numerical model<br />
guidance underestimated the<br />
pressure gradient and wind speeds.<br />
The surge continued on 18 April,<br />
with the Caribic reporting 34 kt<br />
easterly winds near 14N 77W at<br />
0600 UTC and 33 kt near 11N<br />
79W six hours later. By 0600 UTC<br />
19 April, the pressure gradient<br />
decreased slightly across the<br />
Caribbean and the winds decreased<br />
below gale force. However,<br />
20-25 kt easterly winds<br />
continued across the area for<br />
several more days. During this<br />
event, ship observations and<br />
scatterometer satellite wind<br />
estimates were a very valuable<br />
forecast tool, as they helped<br />
Marine Weather Review<br />
pinpoint the strength and area of<br />
the strongest winds.<br />
2. Eastern Pacific<br />
The East Pacific area was affected<br />
by six gale events in the Gulf of<br />
Tehuantepec (and surrounding<br />
waters) and one gale center that<br />
moved rapidly eastward across the<br />
northern boundary of the forecast<br />
area in early March.<br />
Gulf of Tehuantepec: All the<br />
Gulf of Tehuantepec events<br />
resulted from north to northeast<br />
winds passing through the Isthmus<br />
of Tehuantepec behind strong cold<br />
fronts that moved rapidly eastward<br />
across the Gulf of Mexico. The<br />
gale events were verified by<br />
satellite Special Sensor Micro-<br />
Continued on Page 49<br />
Figure 5. ERS-2 Scatterometer data for 17 April 1999. Image courtesy of the Naval Research Laboratory.
Tropical Prediction Center<br />
Continued from Page 48<br />
wave/Imager (SSM/I) data and<br />
occasionally by ship reports. Each<br />
event lasted for two to four days<br />
with the gale conditions confined<br />
to within 240 nautical miles of the<br />
coast although SSM/I data in some<br />
cases indicated wind speeds in the<br />
20 to 30 kt range extending<br />
southward and southwestward to<br />
9N (approximately 420 nautical<br />
miles from the coast).<br />
The fourth (12-14 February) and<br />
fifth (15-16 March) events were<br />
the strongest of the six. The fourth<br />
event was marked by a strong<br />
pressure gradient between a cold<br />
front and a 1037 mb high that<br />
moved eastward across Texas and<br />
the southeast United States. Gale<br />
conditions began approximately<br />
1800 UTC 12 February and<br />
continued until 1800 UTC 14<br />
February. The Century Highway<br />
No. 3 reported 45 kt northeast<br />
winds and 18 ft combined seas<br />
near 12N 96W at 1200 UTC 14<br />
February. Figure 6 depicts the<br />
daily average SSM/I wind speeds<br />
on 14 February.<br />
The fifth event began approximately<br />
0000 UTC 15 March and<br />
Marine Weather Review<br />
was marked by an elongated ridge<br />
of high pressure that extended<br />
across the central United States<br />
through east Texas and into the<br />
western Gulf of Mexico (the cold<br />
front at this time was along a line<br />
extending from the Georgia coast<br />
across the west tip of Cuba into<br />
the Gulf of Honduras). This front/<br />
ridge pattern progressed eastward<br />
20 to 25 kt and gale conditions<br />
ended at approximately 1200 UTC<br />
16 March. A ship (name or call<br />
sign not available) reported 39 kt<br />
north winds and 11 ft combined<br />
seas near 15N 94W at 1200 UTC<br />
Continued on Page 50<br />
Figure 6. SSM/I average surface winds for 14 February 1999. Image courtesy of the <strong>NOAA</strong>/NESDIS Office of<br />
Research and Applications.<br />
August 1999 49
Tropical Prediction Center<br />
Continued from Page 49<br />
15 March. The same ship reported<br />
34 kt northeast winds (seas not<br />
reported) six hours earlier. Figure<br />
8 depicts the daily average SSM/I<br />
wind speeds on 15 March.<br />
Cold Front and Gale of 6-7<br />
March: A strong cold front<br />
entered the forecast area from the<br />
north between 1200 UTC 6 March<br />
and 1800 UTC 6 March. By 0000<br />
UTC 7 March the cold front<br />
extended southwest from 30N<br />
126W through 24N 140W. Gale<br />
conditions were confined to the<br />
area west of the cold front with<br />
the ship DXQC (name not available)<br />
reporting 33 kt north winds<br />
and 10 ft combined seas near 30N<br />
132W. Six hours later the ship<br />
VRUY4 (name not available)<br />
reported 33 kt north winds and 12<br />
ft combined seas near 24N 131W.<br />
By 1200 UTC 7 March, the gale<br />
center associated with the cold<br />
front moved southeast near 30N<br />
121W with a central pressure of<br />
1010 mb (the gale strengthened<br />
only slightly over the preceding 24<br />
to 36 hours). The ship DXQC<br />
(moving southeast about 15 kt)<br />
encountered 34 kt north winds and<br />
17 ft combined seas near 29N<br />
129W. The gale center then<br />
tracked eastward (Figure 9) and<br />
weakened as it crossed the northern<br />
Baja peninsula and into<br />
northwest Mexico between 0000<br />
UTC and 0600 UTC 8 March. The<br />
cold front continued to move<br />
southeast and gradually weakened.<br />
The DXQC encountered 33 kt<br />
north winds and 14 ft combined<br />
seas near 28N 127W at 1800 UTC<br />
8 March.h<br />
50 Mariners Weather Log<br />
Marine Weather Review<br />
Figure 8. SSM/I average surface winds for 15 March 1999. Image courtesy<br />
of the <strong>NOAA</strong>/NESDIS Office of Research and Applications.<br />
Figure 9. GOES-10 visible image at 1830 UTD 7 March 1999. Image<br />
courtesy of the National Climatic Data Center.
August 1999 51<br />
The chart on the left shows the two-month mean 500-mb height contours<br />
at 60 m intervals in solid lines, with alternate contours labeled in<br />
decameters (dm). Height anomalies are contoured in dashed lines at<br />
30 m intervals. Areas where the mean height anomaly was greater than<br />
30 m above normal have light shading, and areas where the mean height<br />
anomaly was more than 30 m below normal have heavy shading<br />
The chart on the right shows the two-month mean sea level pressure at<br />
4-mb intervals in solid lines, labeled in mb. Anomalies of SLP are<br />
contoured in dashed lines and labeled at 2-mb intervals, with light<br />
shading in areas more than 2 mb above normal, and heavy shading in<br />
areas in excess of 2 mb below normal.<br />
Marine Weather Review
52 Mariners Weather Log<br />
The chart on the left shows the two-month mean 500-mb height contours<br />
at 60 m intervals in solid lines, with alternate contours labeled in<br />
decameters (dm). Height anomalies are contoured in dashed lines at<br />
30 m intervals. Areas where the mean height anomaly was greater than<br />
30 m above normal have light shading, and areas where the mean height<br />
anomaly was more than 30 m below normal have heavy shading<br />
The chart on the right shows the two-month mean sea level pressure at<br />
4-mb intervals in solid lines, labeled in mb. Anomalies of SLP are<br />
contoured in dashed lines and labeled at 2-mb intervals, with light<br />
shading in areas more than 2 mb above normal, and heavy shading in<br />
areas in excess of 2 mb below normal.<br />
Marine Weather Review
Familiarization Float Aboard the<br />
<strong>Charles</strong> M. Beeghly<br />
May 6-7, 1999<br />
Eric Stevens<br />
National Weather Service<br />
Marquette, Michigan<br />
The 800-foot <strong>Charles</strong> M.<br />
Beeghly reached the Sault<br />
Ste Marie locks on the<br />
evening of May 6 as it headed for<br />
Superior, Wisconsin, with a load<br />
of limestone. John Machowski and<br />
I, both meteorologists with the<br />
National Weather Service in<br />
Marquette, Michigan, rode the<br />
comparatively tiny motor launch,<br />
Ojibway, from the “Soo Store”<br />
warehouse out to meet the<br />
Beeghly. John and I were guests of<br />
the Interlake Steamship Company<br />
and the crew of the Beeghly for<br />
just over 24 hours as the Beeghly<br />
completed its journey to Superior.<br />
Our goal was to observe the<br />
operations aboard a Great Lakes<br />
ore carrier and to learn what<br />
impact the weather has on the<br />
Great Lakes’ largest ships.<br />
Upon leaving Sault Ste Marie, the<br />
wind blew from the southeast at<br />
10 to 20 knots and waves were<br />
only 2 to 3 feet (.5 to 1 meter)<br />
while we were still in Whitefish<br />
Bay. By the time we had reached<br />
the western half of Lake Superior,<br />
the wind had picked up to northeast<br />
20 to 30 knots, and waves had<br />
built to 4 to 6 feet (1 to 2 meters).<br />
The Beeghly hardly seemed to<br />
notice such waves. The last time I<br />
Fam Float<br />
had been on Lake<br />
Superior was in<br />
September 1998, when<br />
I took the Royale<br />
Queen III to Isle<br />
Royale. Waves<br />
reached 6 feet that<br />
day, and the Queen was soon filled<br />
with seasick passengers. This<br />
contrast illustrates how different<br />
boats handle similar conditions<br />
differently, such as wave height,<br />
structural icing, or fog, to name a<br />
few weather elements. Captain<br />
Russ Brohl of the Beeghly mentioned<br />
that 8- to 12-foot (2.5- to 4meter)<br />
waves are more noticeable<br />
and sometimes break over the<br />
deck, but the ship and cargo can<br />
handle these conditions. Waves<br />
begin to be more of an issue when<br />
they reach the 13 to 15 foot (4 to<br />
4.5 meter) range, as they will then<br />
frequently break over the deck and<br />
all the hatches must be secured.<br />
The wind in the immediate<br />
Duluth/Superior area was quite<br />
gusty. The topography at the<br />
western tip of Lake Superior can<br />
sometimes focus the wind and<br />
produce significant differences<br />
between the weather on the open<br />
lake and the weather right along<br />
shore at Duluth/Superior.<br />
While many smaller boats rely<br />
exclusively on radio broadcasts<br />
for their weather information, the<br />
Beeghly’s communications equipment<br />
allows the wheelhouse crew<br />
to read copies of the National<br />
Weather Service open lake, Coded<br />
Marine Forecast (MAFOR), and<br />
nearshore forecasts themselves.<br />
They also download graphical<br />
forecasts via DMAWDS (Digital<br />
MArine Weather Dissemination<br />
System). These graphical forecasts<br />
depict the positions of high and<br />
low pressure centers and fronts on<br />
the Great Lakes and help the crew<br />
interpret the weather forecast.<br />
Captain Bruhl and the crew of the<br />
Beeghly showed John and I the<br />
warmest hospitality throughout the<br />
trip. John and I truly appreciated<br />
the opportunity to sail aboard the<br />
Beeghly, and we are already using<br />
the knowledge gained during the<br />
voyage to assist in forecasting the<br />
weather for Lake Superior.h<br />
August 1999 53
The first four months of<br />
1999 were quite active<br />
along the North Carolina<br />
coast. Although there were no<br />
major storms, numerous cold<br />
frontal passages produced many<br />
gale force wind episodes. The<br />
main storm track this winter ran<br />
from the southern plains northeast<br />
toward the Ohio Valley region.<br />
Coastal North Carolina was to the<br />
south of most of the low pressure<br />
systems, and this produced several<br />
events where strong south to<br />
southeast winds developed.<br />
Gale force south to southeast wind<br />
events occurred during the following<br />
periods: January 3rd and 24th,<br />
February 12th and 28th, and<br />
March 13th. Sustained winds of<br />
30 to 40 knots produced seas of 10<br />
to 15 feet along the coast, with the<br />
worst conditions mainly from<br />
Cape Hatteras south. These strong<br />
winds and large seas produced<br />
significant beach erosion along the<br />
south coast, mainly from Emerald<br />
Isle to North Topsail Beach.<br />
A low pressure system that<br />
developed off the South Carolina<br />
54 Mariners Weather Log<br />
coast during late April, moved<br />
very slowly northeast and produced<br />
a prolonged period of<br />
strong northeast winds along the<br />
coast. Winds of 35 to 45 knots<br />
with gusts to 50 knots were<br />
common the 29th and 30th. These<br />
strong winds produced very rough<br />
seas of 4 to 5 meters (12 to 16<br />
feet), with the worst conditions<br />
from Cape Hatteras south. Beach<br />
erosion was reported along the<br />
Outer Banks, with some flooding<br />
along the southern Pamlico sound.<br />
The National Weather service in<br />
Newport anticipated all the above<br />
events and issued Marine Weather<br />
Statements well in advance to give<br />
mariners a heads-up of the hazardous<br />
conditions. In addition to the<br />
Coastal Waters Forecast, statements<br />
were issued during each<br />
event to give additional information<br />
to mariners and coastal<br />
residents.<br />
The National Weather Service in<br />
Newport transmits numerous<br />
products for the marine user. One<br />
of our most popular forecast<br />
products is the Coastal Marine<br />
Coastal Forecast Office News<br />
Coastal Forecast Office News—North Carolina Area<br />
Laura Furgione<br />
Warning Coordination Meteorologist<br />
National Weather Service Office<br />
Newport, North Carolina<br />
Forecast, which covers South of<br />
Currituck Beach Light to Surf City<br />
and out to 20 nm. For those<br />
interested in forecasts beyond 48<br />
hours, an extended three- to fiveday<br />
forecast is also compiled.<br />
Included in the extended forecast<br />
is wind speed, wind direction, and<br />
wave height. Special Marine<br />
Warnings are issued on an asneeded<br />
basis. These include<br />
severe thunderstorms, waterspouts,<br />
and wind speeds that are<br />
forecast to exceed 35 knots.<br />
All the forecasts can be obtained<br />
via the <strong>NOAA</strong> Weather Radio.<br />
The transmitter in New Bern is<br />
162.40 Mhz, while the Hatteras<br />
transmission can be heard over<br />
162.475 Mhz. An Offshore<br />
Forecast from Baltimore Canyon<br />
to Hatteras Canyon then southward<br />
to Blake Ridge can be found<br />
on either channel. During hurricane<br />
season, June 1 through<br />
November 30, Tropical Marine<br />
Advisories are also broadcast.<br />
Additional sources include our<br />
recorded forecast telephone line<br />
(252) 223-5737 and our web site<br />
http://www.nws.noaa.gov/er/<br />
mhx
Coastal Forecast Office News<br />
Coastal Forecast Office News—North Carolina Area (Continued)<br />
Carl Morgan<br />
Meteorologist<br />
National Weather Service Forecast Office<br />
Wilmington, North Carolina<br />
An unusually-intense low<br />
pressure system began to<br />
take shape off the South<br />
Carolina coast on Thursday April<br />
29, 1999, and lingered nearly<br />
stationary until Sunday, May 2nd.<br />
As a result of the tight pressure<br />
gradient between the strengthening<br />
low pressure offshore and a<br />
ridge of high pressure east of the<br />
Appalachian Mountains, the<br />
Carolina coastal waters from Surf<br />
City, North Carolina, to South<br />
Santee River, South Carolina,<br />
were pounded with gale- to stormforce<br />
winds for nearly four days.<br />
The meteorological conditions<br />
which lead to the development of<br />
this system more typically occur<br />
during the winter season. A cold<br />
front pushed southward through<br />
the Carolinas during the late night<br />
and early morning hours of April<br />
27 and 28 and stalled off the South<br />
Carolina coast. Weak low pressure<br />
(1010 mb) developed along the<br />
front Thursday morning as a 500<br />
mb trough swung into the Mid-<br />
Atlantic region (500 mb troughs<br />
observed on the 500 mb analyses<br />
frequently result in the formation<br />
of surface low pressure areas).<br />
The 500 mb trough evolved into a<br />
closed low Thursday evening<br />
before moving off the South<br />
Carolina coast early Friday. The<br />
surface low deepened to 1004 mb<br />
by Saturday morning as the<br />
surface and upper-level systems<br />
became vertically stacked.<br />
A Gale Warning was issued by the<br />
National Weather Service in<br />
Wilmington, North Carolina, at<br />
4:08 am EDT Thursday, April 29<br />
for the coastal waters between<br />
Surf City and South Santee River.<br />
The Gale Warning was upgraded<br />
to a Storm Warning at 8:18 am<br />
EDT Friday, April 30, for the<br />
waters between Surf City and<br />
Murrells Inlet. The Storm Warning<br />
remained in effect for nearly 44<br />
continuous hours.<br />
The storm coincided with a full<br />
moon on Friday, causing higher<br />
than normal high tides. Beach<br />
erosion was reported along the<br />
shores of Pender and New Hanover<br />
counties, including Topsail<br />
and Wrightsville beaches. Because<br />
winds remained generally out of<br />
the northeast, the south-facing<br />
beaches of Brunswick county were<br />
spared significant damage.<br />
Heavy rain, which began falling<br />
on Tuesday, continued into<br />
Sunday. More than 13 inches fell<br />
across portions of New Hanover<br />
county, leaving up to a foot of<br />
water standing on flood prone<br />
roads. By Saturday afternoon,<br />
numerous roads across New<br />
Hanover, Pender, and Brunswick<br />
counties were blocked by flood<br />
waters. The New Hanover County<br />
town of Carolina Beach was hit<br />
particularly hard, as several feet of<br />
water blocked roads in the northern<br />
part of town. US 421, the main<br />
artery between Carolina Beach<br />
and the rest of New Hanover<br />
County, was severed.<br />
The Oak Island Coast Guard<br />
Station recorded a wind gust of 70<br />
knots on Friday afternoon. The<br />
tower at Frying Pan Shoals, North<br />
Carolina, approximately 30 nm<br />
southeast of Cape Fear, recorded<br />
sustained winds to 61 knots and<br />
seas of 5 meters (17 feet) at the<br />
peak of the storm. Wind gauges in<br />
the coastal communities of Surf<br />
City, Kure Beach, and Southport<br />
recorded gusts up to 43 knots on<br />
Saturday.<br />
One mariner lost his life when a<br />
shrimp boat capsized near the<br />
mouth of the Cape Fear River<br />
Thursday morning.<br />
Storm Warnings were lowered to<br />
Gale Warnings at 4:00 am EDT on<br />
Sunday, May 2nd. Winds and seas<br />
subsided throughout the afternoon<br />
as the low pressure system weakened<br />
and moved northeast of the<br />
area. Gale Warnings were lowered<br />
at 4:00 pm Sunday.h<br />
August 1999 55
<strong>Voluntary</strong> <strong>Observing</strong> <strong>Ship</strong> <strong>Program</strong><br />
Martin S. Baron<br />
National Weather Service<br />
Silver Spring, Maryland<br />
New SEAS/AMVER Software<br />
(Windows version) Under<br />
Development<br />
Development of new SEAS/<br />
AMVER software is underway.<br />
This new Windows® version<br />
features on-screen drop-down<br />
windows with code tables, sea<br />
state and cloud photographs, and<br />
help menus. The entire ships code<br />
card is available as a tutorial onscreen.<br />
To create your coded<br />
weather message, you either click<br />
on code values drawn directly<br />
from the on-screen tables, or you<br />
type-in the value from your<br />
computer keyboard.<br />
Like earlier SEAS/AMVER<br />
software, this software is<br />
“paperless.” Your completed<br />
weather observations are stored in<br />
the computer and transferred to<br />
Archive Diskettes for mailing to<br />
your PMO (special postage paid<br />
diskette mailers are now available,<br />
see below). Recording of observations<br />
on <strong>Ship</strong>s Weather Observa-<br />
56 Mariners Weather Log<br />
VOS <strong>Program</strong><br />
tions Form B-81 is still appropriate<br />
for ships not using this software<br />
or incapable of using this<br />
software due to equipment limitations.<br />
SEAS 2000 will also support<br />
AMVER position reporting<br />
requirements when the report is<br />
transmitted through COMSAT<br />
affiliated stations.<br />
We expect this new software to be<br />
available in late 2000. A version<br />
to operate with shipboard<br />
Expendible Bathythermographs<br />
(XBTs) is also being developed.<br />
Prior to release of this new<br />
software, we recommend use of<br />
SEAS version 4.52 (available<br />
from Port Meteorological Officers<br />
(PMOs), SEAS Field Representatives,<br />
or the SEAS webpage at<br />
http://seas.nos.noaa.gov/seas/<br />
Three <strong>NOAA</strong> line offices are<br />
collaborating in the SEAS 2000<br />
development effort. It’s being lead<br />
by the Office of Atmospheric<br />
Research, Global Ocean <strong>Observing</strong><br />
System (GOOS) Operations<br />
Center, with the office of <strong>NOAA</strong><br />
Corps Operations writing the<br />
software in cooperation with the<br />
National Weather Service (NWS).<br />
System requirements for new<br />
SEAS/AMVER software will be<br />
Pentium 133 MHz or greater,<br />
VGA monitor, Windows 95, 98, or<br />
NT, 3.5 inch floppy drive, and a<br />
compact disk reader (CD).<br />
New SEAS Archive Diskette<br />
Mailers<br />
Special SEAS Archive Diskette<br />
mailers are now available from<br />
PMOs. These are for mailing your<br />
SEAS formatted weather observation<br />
records to your PMO. (If you<br />
are using Form B-81 <strong>Ship</strong>s<br />
Weather Observations, use the<br />
large mail envelopes available<br />
from your PMO.) After reviewing<br />
the observations, the PMO sends<br />
Continued on Page 57
VOS <strong>Program</strong><br />
Continued from Page 56<br />
the SEAS diskettes (or Form B-<br />
81) to the National Climatic Data<br />
Center for archiving. Like the<br />
envelopes, the diskette mailers are<br />
pre-printed with PMO mailing<br />
addresses and are postage paid<br />
when mailed in any United States<br />
port.<br />
The backs of the mailers are preprinted<br />
with a checklist of weather<br />
observing and reporting supplies<br />
to order from your PMO. There is<br />
also space for you to enter your<br />
vessel mailing address.<br />
Updated <strong>Observing</strong><br />
Handbook Now Available<br />
The revised edition of NWS<br />
<strong>Observing</strong> Handbook No.1 is now<br />
in print. (The cover of the revised<br />
edition is the same as the old<br />
edition; the April 1999 revision<br />
date appears on the title page next<br />
to the inside front cover.) This<br />
new edition replaces the August<br />
1995 edition. Copies were mailed<br />
to all NWS <strong>Voluntary</strong> <strong>Observing</strong><br />
<strong>Ship</strong>s. Additional copies are<br />
available from PMOs. The most<br />
notable change has been a complete<br />
rewrite of Chapter 3, Transmitting<br />
the Observation.<br />
New Recruits—January<br />
through April 1999<br />
During the four-month period<br />
January through April 1999,<br />
PMOs recruited 42 vessels into<br />
the <strong>Voluntary</strong> <strong>Observing</strong> <strong>Ship</strong><br />
VOS <strong>Program</strong><br />
<strong>Program</strong>. Thank you for joining<br />
the program.<br />
Please remember that the<br />
weather reporting schedule for<br />
<strong>Voluntary</strong> <strong>Observing</strong> <strong>Ship</strong>s is<br />
four times daily, at 0000Z,<br />
0600Z, 1200Z, and 1800Z. Three<br />
hourly observations are also<br />
requested from vessels operating<br />
within 200 miles of the United<br />
States and Canadian coasts (at<br />
0000Z, 0300Z, 0600Z, 0900Z,<br />
1200Z, 1500Z, 1800Z). Please<br />
make every effort to follow the<br />
weather reporting schedules. Your<br />
observations are very important to<br />
the weather forecasting effort, and<br />
to your safety and well being at<br />
sea.<br />
Some Reminders<br />
1. Complete the transmission of<br />
your INMARSAT weather report<br />
in 30 seconds or less. This helps<br />
reduce communications costs paid<br />
by the NWS.<br />
2. Take special care to accurately<br />
code your day, time, and position<br />
information (section 0 of the <strong>Ship</strong>s<br />
Synoptic Code). Meteorological<br />
reports received with section 0<br />
coding errors can seldom be used,<br />
and are usually discarded. Section<br />
0 consists of the first five groups<br />
of the weather message — BBXX<br />
D....D YYGGi w 99L a L a L a<br />
Q c L o L o L o L o.<br />
3. Remember the relationship<br />
between i x in group i r i x hVV and<br />
group 7wwW 1 W 2 . I x must be<br />
coded as 1 when group 7wwW 1 W 2<br />
is included in your weather<br />
message (most of the time). If not<br />
reporting any significant weather,<br />
i x is coded as 2 and group<br />
7wwW 1 W 2 is omitted from the<br />
weather message.<br />
4. Many sea states are composed<br />
of a mixture of sea and swell<br />
which can be difficult to unravel.<br />
Swell waves are due to the action<br />
of strong winds in some distant<br />
area and may travel thousands of<br />
miles from their origin before<br />
dissipating. Swell waves have<br />
longer wavelengths in comparison<br />
to sea waves and also have longer<br />
periods.<br />
To help distinguish sea from<br />
swell, use (1) your observed wind<br />
speed, and (2) wave direction of<br />
movement. A succession of waves<br />
with long wavelength with height<br />
of 3 meters or more, when the<br />
wind has not exceeded 10 knots,<br />
would have to be classified as<br />
swell because the local wind is not<br />
strong enough to be responsible.<br />
Waves not moving with the local<br />
wind must be described as swell.<br />
With stronger winds, when there is<br />
a considerable sea, distinguishing<br />
between sea and swell can be<br />
difficult if there is not much<br />
difference between their direction<br />
of motion. In such cases, waves<br />
with noticeably longer periods are<br />
swell. If period differences cannot<br />
be distinguished, and the waves<br />
are moving in the same direction,<br />
it is best to regard the combined<br />
motion as being due to sea waves.<br />
Continued on Page 58<br />
August 1999 57
VOS <strong>Program</strong><br />
Continued from Page 57<br />
Summary of Weather Report Transmission Procedures<br />
58 Mariners Weather Log<br />
VOS <strong>Program</strong><br />
Weather observations sent by ships participating in the VOS program are sent at no cost to the ship except as<br />
noted.<br />
The stations listed accept weather observations which enter an automated system at National Weather Service<br />
headquarters. This system is not intended for other types of messages. To communicate with NWS personnel,<br />
see phone numbers and e-mail addresses at the beginning of this manual.<br />
INMARSAT<br />
Follow the instructions with your INMARSAT terminal for sending a telex message. Use the special dialing<br />
code 41 (except when using the SEAS/AMVER software in compressed binary format with INMARSAT C),<br />
and do not request a confirmation. Here is a typical procedure for using an INMARSAT A transceiver:<br />
1. Select appropriate Land Earth Station Identity (LES-ID). See table below.<br />
2. Select routine priority.<br />
3. Select duplex telex channel.<br />
4. Initiate the call. Wait for the GA+ signal.<br />
5. Select the dial code for meteorological reports, 41+.<br />
6. Upon receipt of our answerback, NWS OBS MHTS, transmit the weather message starting with<br />
BBXX and the ship’s call sign. The message must be ended with five periods. Do not send any<br />
preamble.<br />
GA+<br />
41+<br />
NWS OBS MHTS<br />
BBXX WLXX 29003 99131 70808 41998 60909 10250 2021/ 4011/ 52003 71611 85264 22234<br />
00261 20201 31100 40803.....<br />
The five periods indicate the end of the message and must be included after each report. Do not request a<br />
confirmation.<br />
Land-Earth Station Identity (LES-ID) of U.S. Inmarsat Stations Accepting <strong>Ship</strong>s Weather (BBXX) and<br />
Oceanographic (JJYY) Reports<br />
Operator Service Station ID<br />
AOR-W AOR-E IOR POR<br />
COMSAT A 01 01 01 01<br />
COMSAT B 01 01 01 01<br />
COMSAT C 001 101 321 201<br />
Continued on Page 59
VOS <strong>Program</strong><br />
Continued from Page 58<br />
VOS <strong>Program</strong><br />
Operator Service Station ID<br />
AOR-W AOR-E IOR POR<br />
COMSAT C (AMVER/SEAS) 001 101 321 201<br />
STRATOS/IDB A (octal ID) 13-1 13-1 13-1 13-1<br />
STRATOS/IDB A (decimal ID) 11-1 11-1 11-1 11-1<br />
STRATOS/IDB B 013 013 013 013<br />
Use abbreviated dialing code 41.<br />
Do not request a confirmation<br />
If your ship’s Inmarsat terminal does not contain a provision for using abbreviated dialing code 41, TELEX<br />
address 0023089406 may be used via COMSAT. Please note that the ship will incur telecommunication<br />
charges for any messages sent to TELEX address 0023089406 using any Inmarsat earth station other than<br />
COMSAT.<br />
Some common mistakes include: (1) failure to end the message with five periods when using INMARSAT A,<br />
(2) failure to include BBXX in the message preamble, (3) incorrectly coding the date, time, latitude, longitude,<br />
or quadrant of the globe, (4) requesting a confirmation.<br />
Using The SEAS/AMVER Software<br />
The National Oceanic and Atmospheric Administration (<strong>NOAA</strong>), in cooperation with the U.S. Coast Guard<br />
Automated Mutual-assistance VEssel Rescue program (AMVER) and COMSAT, has developed a PC software<br />
package known as AMVER/SEAS which simplifies the creation of AMVER and meteorological<br />
(BBXX) reports. The U.S. Coast Guard is able to accept, at no cost to the ship, AMVER reports transmitted<br />
via Inmarsat-C in a compressed binary format, created using the AMVER/SEAS program. Typically, in the<br />
past, the cost of transmission for AMVER messages has been assumed by the vessel. When ships participate<br />
in both the SEAS and AMVER programs, the position of ship provided in the meteorological report is<br />
forwarded to the Coast Guard as a supplementary AMVER position report to maintain a more accurate plot.<br />
To obtain the AMVER/SEAS program contact your U.S. PMO or AMVER/SEAS representative listed at the<br />
back of this publication.<br />
If using the <strong>NOAA</strong> AMVER/SEAS software, follow the instructions outlined in the AMVER/SEAS User’s<br />
Manual. When using Inmarsat-C, use the compressed binary format and 8-bit X.25 (PSDN) addressing<br />
(31102030798481), rather than TELEX if possible when reporting weather.<br />
Common errors when using the AMVER/SEAS include sending the compressed binary message via the code<br />
41 or a plain text message via the X.25 address. Only COMSAT can accept messages in the compressed<br />
binary format. Text editors should normally not be utilized in sending the data in the compressed binary<br />
format as this may corrupt the message.<br />
Continued on Page 60<br />
August 1999 59
VOS <strong>Program</strong><br />
Continued from Page 59<br />
Telephone (Landline, Cellular, Satphone, etc.)<br />
60 Mariners Weather Log<br />
VOS <strong>Program</strong><br />
The following stations will accept VOS weather observations via telephone. Please note that the ship will<br />
be responsible for the cost of the call in this case.<br />
GLOBE WIRELESS 650-726-6588<br />
MARITEL 228-897-7700<br />
WLO 334-666-5110<br />
The National Weather Service is developing a dial-in bulletin board to accept weather observations using a<br />
simple PC program and modem. The ship will be responsible for the cost of the call when using this<br />
system. For details contact:<br />
Tim Rulon, <strong>NOAA</strong><br />
W/OM12 SSMC2 Room 14114<br />
1325 East-West Highway<br />
Silver Spring, MD 20910 USA<br />
301-713-1677 Ext. 128<br />
301-713-1598 (Fax)<br />
timothy.rulon@noaa.gov<br />
marine.weather@noaa.gov<br />
Reporting Through United States Coast Guard Stations<br />
U.S. Coast Guard stations accept SITOR (preferred) or voice radiotelephone weather reports. Begin with the<br />
BBXX indicator, followed by the ships call sign and the weather message.<br />
U.S. Coast Guard High Seas Communication Stations<br />
<strong>Ship</strong> <strong>Ship</strong><br />
SEL ITU Xmit Rec<br />
Location (CALL) Mode CAL MMSI # CH# Freq Freq Watch<br />
Boston (NMF) Voice 003669991 424 4134 4426 Night 3<br />
Boston (NMF) Voice 003669991 601 6200 6501 24Hr<br />
Boston (NMF) Voice 003669991 816 8240 8764 24Hr<br />
Boston (NMF) Voice 003669991 1205 12242 13089 Day 3<br />
Chesapeake (NMN) SITOR 1097 604 6264.5 6316 Night 2<br />
Chesapeake (NMN) SITOR 1097 824 8388 8428 24Hr<br />
Chesapeake (NMN) SITOR 1097 1227 12490 12592.5 24hr<br />
Chesapeake (NMN) SITOR 1097 1627 16696.5 16819.5 24Hr<br />
Chesapeake (NMN) SITOR 1097 2227 22297.5 22389.5 Day 2<br />
Continued on Page 61
VOS <strong>Program</strong><br />
Continued from Page 60<br />
VOS <strong>Program</strong><br />
<strong>Ship</strong> <strong>Ship</strong><br />
SEL ITU Xmit Rec<br />
Location (CALL) Mode CAL MMSI # CH# Freq Freq Watch<br />
Chesapeake (NMN) Voice 003669995 424 4134 4426 Night 2<br />
Chesapeake (NMN) Voice 003669995 601 6200 6501 24Hr<br />
Chesapeake (NMN) Voice 003669995 816 8240 8764 24Hr<br />
Chesapeake (NMN) Voice 003669995 1205 12242 13089 Day 2<br />
Miami (NMA) Voice 003669997 601 6200 6501 24Hr<br />
Miami (NMA) Voice 003669997 1205 12242 13089 24Hr<br />
Miami (NMA) Voice 003669997 1625 16432 17314 24Hr<br />
New Orleans (NMG) Voice 003669998 424 4134 4426 24Hr<br />
New Orleans (NMG) Voice 003669998 601 6200 6501 24Hr<br />
New Orleans (NMG) Voice 003669998 816 8240 8764 24Hr<br />
New Orleans (NMG) Voice 003669998 1205 12242 13089 24Hr<br />
Kodiak (NOJ) SITOR 1106 407 4175.5 4213.5 Night<br />
Kodiak (NOJ) SITOR 1106 607 6266 6317.5 24Hr<br />
Kodiak (NOJ) SITOR 1106 807 8379.5 8419.5 Day<br />
Kodiak (NOJ) Voice 003669899 1 *** 4125 4125 24Hr<br />
Kodiak (NOJ) Voice 003669899 1 601 6200 6501 24Hr<br />
Pt. Reyes (NMC) SITOR 1096 620 6272.5 6323.5 Night<br />
Pt. Reyes (NMC) SITOR 1096 820 8386 8426 24Hr<br />
Pt. Reyes (NMC) SITOR 1096 1620 16693 16816.5 Day<br />
Pt. Reyes (NMC) Voice 003669990 424 4134 4426 24Hr<br />
Pt. Reyes (NMC) Voice 003669990 601 6200 6501 24Hr<br />
Pt. Reyes (NMC) Voice 003669990 816 8240 8764 24Hr<br />
Pt. Reyes (NMC) Voice 003669990 1205 12242 13089 24Hr<br />
Honolulu (NMO) SITOR 1099 827 8389.5 8429.5 24hr<br />
Honolulu (NMO) SITOR 1099 1220 12486.5 12589 24hr<br />
Honolulu (NMO) SITOR 1099 2227 22297.5 22389.5 Day<br />
Honolulu (NMO) Voice 003669993 1 424 4134 4426 Night 4<br />
Honolulu (NMO) Voice 003669993 1 601 6200 6501 24Hr<br />
Honolulu (NMO) Voice 003669993 1 816 8240 8764 24Hr<br />
Honolulu (NMO) Voice 003669993 1 1205 12242 13089 Day 4<br />
Guam (NRV) SITOR 1100 812 8382 8422 24hr<br />
Guam (NRV) SITOR 1100 1212 12482.5 12585 Night<br />
Guam (NRV) SITOR 1100 1612 16689 16812.5 24hr<br />
Guam (NRV) SITOR 1100 2212 22290 22382 Day<br />
Guam (NRV) Voice 003669994 1 601 6200 6501 Night 5<br />
Guam (NRV) Voice 003669994 1 1205 12242 13089 Day 5<br />
Stations also maintain an MF/HF DSC watch on the following frequencies: 2187.5 kHz, 4207.5 kHz, 6312<br />
kHz, 8414.5 kHz, 12577 kHz, and 16804.5 kHz.<br />
Continued on Page 62<br />
August 1999 61
VOS <strong>Program</strong><br />
Continued from Page 61<br />
62 Mariners Weather Log<br />
VOS <strong>Program</strong><br />
Voice frequencies are carrier (dial) frequencies. SITOR and DSC frequencies are assigned frequencies.<br />
Note that some stations share common frequencies.<br />
An automated watch is kept on SITOR. Type “HELP+” for the of instructions or “OBS+” to send the weather<br />
report.<br />
For the latest information on Coast Guard frequencies, visit their webpage at: http://www.navcen.uscg.mil/<br />
marcomms.<br />
1 MF/HF DSC has not yet been implemented at these stations.<br />
2 2300-1100 UTC Nights, 1100-2300 UTC Days<br />
3 2230-1030 UTC Nights, 1030-2230 UTC Days<br />
4 0600-1800 UTC Nights, 1800-0600 UTC Days<br />
5 0900-2100 UTC Nights, 2100-0900 UTC Days<br />
U.S. Coast Guard Group Communication Stations<br />
U.S. Coast Guard Group communication stations monitor VHF marine channels 16 and 22A and/or MF<br />
radiotelephone frequency 2182 kHz (USB). Great Lakes stations do not have MF installations.<br />
The following stations have MF DSC installations and also monitor 2187.5 kHz DSC. Additional stations are<br />
planned. Note that although a station may be listed as having DSC installed, that installation may not have yet<br />
been declared operational. The U.S. Coast Guard is not expected to have the MF DSC network installed and<br />
declared operational until 2003 or thereafter.<br />
The U.S. Coast Guard is not expected to have an VHF DSC network installed and declared operational until<br />
2005 or thereafter.<br />
STATION MMSI #<br />
CAMSLANT Chesapeake VA MF/HF — 003669995<br />
COMMSTA Boston MA MF/HF Remoted to CAMSLANT 003669991<br />
COMMSTA Miami FL MF/HF Remoted to CAMSLANT 003669997<br />
COMMSTA New Orleans LA MF/HF Remoted to CAMSLANT 003669998<br />
CAMSPAC Pt Reyes CA MF/HF — 003669990<br />
COMMSTA Honolulu HI MF/HF Remoted to CAMSPAC 003669993<br />
COMMSTA Kodiak AK MF/HF — 003669899<br />
Group Atlantic City NJ MF 003669903<br />
Group Cape Hatteras NC MF 003669906<br />
Group Southwest Harbor MF 003669921<br />
Group Eastern Shore VA MF 003669932<br />
Continued on Page 63
VOS <strong>Program</strong><br />
Continued from Page 62<br />
VOS <strong>Program</strong><br />
STATION MMSI #<br />
Group Mayport FL MF 003669925<br />
Group Long Island Snd MF 003669931<br />
Act New York NY MF 003669929<br />
Group Ft Macon GA MF 003669920<br />
Group Astoria OR MF 003669910<br />
Reporting Through Specified U.S. Commercial Radio Stations<br />
If a U.S. Coast Guard station cannot be communicated with, and your ship is not INMARSAT equipped, U.S.<br />
commercial radio stations can be used to relay your weather observations to the NWS. When using SITOR,<br />
use the command “OBS +”, followed by the BBXX indicator and the weather message. Example:<br />
OBS + BBXX WLXX 29003 99131 70808 41998 60909 10250 2021/<br />
40110 52003 71611 85264 22234 00261 20201 31100 40803<br />
Commercial stations affiliated with Globe Wireless (KFS, KPH, WNU, WCC, etc.) accept weather messages<br />
via SITOR or morse code (not available at all times).<br />
Commercial Stations affiliated with Mobile Marine Radio, Inc. (WLO, KLB, WSC) accept weather<br />
messages via SITOR, with Radiotelephone and Morse Code (weekdays from 1300-2100 UTC only) also<br />
available as backups.<br />
MARITEL Marine Communication System accepts weather messages via VHF marine radiotelephone<br />
from near shore (out 50-60 miles), and from the Great Lakes.<br />
Globe Wireless<br />
<strong>Ship</strong> <strong>Ship</strong><br />
SEL ITU Xmit Rec<br />
Location (CALL) Mode CAL MMSI # CH# Freq Freq Watch<br />
Slidell, (WNU) SITOR 401 4172.5 4210.5 24Hr<br />
Louisina (WNU) SITOR 4200.5 4336.4 24Hr<br />
(WNU) SITOR 627 6281 6327 24Hr<br />
(WNU) SITOR 819 8385.5 8425.5 24Hr<br />
(WNU) SITOR 1257 12505 12607.5 24Hr<br />
(WNU) SITOR 1657 16711.5 16834.5 24Hr<br />
Barbados (8PO) SITOR 409 4176.5 4214.5 24Hr<br />
(8PO) SITOR 634 6284.5 6330.5 24Hr<br />
(8PO) SITOR 834 8393 8433 24Hr<br />
(8PO) SITOR 1273 12513 12615.5 24Hr<br />
(8PO) SITOR 1671 16718.5 16841.5 24Hr<br />
Continued on Page 64<br />
August 1999 63
VOS <strong>Program</strong><br />
Continued from Page 63<br />
64 Mariners Weather Log<br />
VOS <strong>Program</strong><br />
<strong>Ship</strong> <strong>Ship</strong><br />
SEL ITU Xmit Rec<br />
Location (CALL) Mode CAL MMSI # CH# Freq Freq Watch<br />
San Francisco, (KPH) SITOR 413 4178.5 4216 24Hr<br />
California (KPH) SITOR 613 6269 6320 24Hr<br />
(KPH) SITOR 813 8382.5 8422.5 24Hr<br />
(KPH) SITOR 822 8387 8427 24Hr<br />
(KPH) SITOR 1213 12483 12585.5 24Hr<br />
(KPH) SITOR 1222 12487.5 12590 24Hr<br />
(KPH) SITOR 1242 12497.5 12600 24Hr<br />
(KPH) SITOR 1622 16694 16817.5 24Hr<br />
(KPH) SITOR 2238 22303 22395 24Hr<br />
(KFS) SITOR 403 4173.5 4211.5 24Hr<br />
(KFS) SITOR 6253.5 6436.4 24Hr<br />
(KFS) SITOR 603 6264 6315.5 24Hr<br />
(KFS) SITOR 8323.5 8526.4 24Hr<br />
(KFS) SITOR 803 8377.5 8417.5 24Hr<br />
(KFS) SITOR 1203 12478 12580.5 24Hr<br />
(KFS) SITOR 1247 12500 12602.5 24Hr<br />
(KFS) SITOR 16608.5 17211.4 24Hr<br />
(KFS) SITOR 1647 16706.5 16829.5 24Hr<br />
(KFS) SITOR 2203 22285.5 22377.5 24Hr<br />
Hawaii (KEJ) SITOR 4154.5 4300.4 24Hr<br />
(KEJ) SITOR 625 6275 6326 24Hr<br />
(KEJ) SITOR 830 8391 8431 24Hr<br />
(KEJ) SITOR 1265 12509 12611.5 24Hr<br />
(KEJ) SITOR 1673 16719.5 16842.5 24Hr<br />
Delaware, (WCC) SITOR 6297 6334 24Hr<br />
USA (WCC) SITOR 816 8384 8424 24Hr<br />
(WCC) SITOR 1221 12487 12589.5 24Hr<br />
(WCC) SITOR 1238 12495.5 12598 24Hr<br />
(WCC) SITOR 1621 16693.5 16817 24Hr<br />
Argentina (LSD836) SITOR 4160.5 4326 24Hr<br />
(LSD836) SITOR 8311.5 8459 24Hr<br />
(LSD836) SITOR 12379.5 12736 24Hr<br />
(LSD836) SITOR 16560.5 16976 24Hr<br />
(LSD836) SITOR 18850.5 19706 24Hr<br />
Guam (KHF) SITOR 605 6265 6316.5 24Hr<br />
(KHF) SITOR 808 8380 8420 24Hr<br />
(KHF) SITOR 1301 12527 12629 24Hr<br />
(KHF) SITOR 1726 16751 16869 24Hr<br />
(KHF) SITOR 1813 18876.5 19687 24Hr<br />
(KHF) SITOR 2298 22333 22425 24Hr<br />
Newfoundland (VCT) SITOR 414 4179 4216.5 24Hr<br />
Canada (VCT) SITOR 416 4180 4217.5 24Hr<br />
(VCT) SITOR 621 6273 6324 24Hr<br />
(VCT) SITOR 632 6283.5 6329.5 24Hr<br />
(VCT) SITOR 821 8386.5 8426.5 24Hr<br />
(VCT) SITOR 838 8395 8435 24Hr<br />
(VCT) SITOR 1263 12508 12610.5 24Hr<br />
(VCT) SITOR 1638 16702 16825 24Hr<br />
Continued on Page 65
VOS <strong>Program</strong><br />
Continued from Page 64<br />
VOS <strong>Program</strong><br />
<strong>Ship</strong> <strong>Ship</strong><br />
SEL ITU Xmit Rec<br />
Location (CALL) Mode CAL MMSI # CH# Freq Freq Watch<br />
Cape Town, (ZSC) SITOR 408 4176 4214 24Hr<br />
South Africa (ZSC) SITOR 617 6271 6322 24Hr<br />
(ZSC) SITOR 831 8391.5 8431.5 24Hr<br />
(ZSC) SITOR 1244 12498.5 12601 24Hr<br />
(ZSC) SITOR 1619 16692.5 16816 24Hr<br />
(ZSC) SITOR 1824 18882 19692.5 24Hr<br />
Bahrain, (A9M) SITOR 419 4181.5 4219 24Hr<br />
Arabian Gulf (A9M) SITOR 8302.5 8541 24Hr<br />
(A9M) SITOR 12373.5 12668 24Hr<br />
(A9M) SITOR 16557.5 17066.5 24Hr<br />
(A9M) SITOR 18853.5 19726 24Hr<br />
Gothenburg, (SAB) SITOR 228 2155.5 1620.5 24Hr<br />
Sweden (SAB) SITOR 4166.5 4259 24Hr<br />
(SAB) SITOR 626 6275.5 6326.5 24Hr<br />
(SAB) SITOR 837 8394.5 8434.5 24Hr<br />
(SAB) SITOR 1291 12522 12624 24Hr<br />
(SAB) SITOR 1691 16728.5 16851.5 24Hr<br />
Norway, (LFI) SITOR 2653 1930 24Hr<br />
(LFI) SITOR 4154.5 4339 24Hr<br />
(LFI) SITOR 6250.5 6467 24Hr<br />
(LFI) SITOR 8326.5 8683.5 24Hr<br />
(LFI) SITOR 12415.5 12678 24Hr<br />
(LFI) SITOR 16566.5 17204 24Hr<br />
Awanui, (ZLA) SITOR 402 4173 4211 24Hr<br />
New Zealand (ZLA) SITOR 602 6263.5 6315 24Hr<br />
(ZLA) SITOR 802 8377 8417 24Hr<br />
(ZLA) SITOR 1202 12477.5 12580 24Hr<br />
(ZLA) SITOR 1602 16684 16807.5 24Hr<br />
(ZLA) SITOR 18859.5 19736.4 24Hr<br />
Perth, (VIP) SITOR 406 4175 4213 24Hr<br />
Western (VIP) SITOR 806 8379 8419 24Hr<br />
Austrailia (VIP) SITOR 1206 12479.5 12582 24Hr<br />
(VIP) SITOR 1210 12481.5 12584 24Hr<br />
(VIP) SITOR 1606 16686 16809.5 24Hr<br />
The frequencies listed are used by the stations in the Global Radio network for both SITOR and GlobeEmail.<br />
Stations listed as being 24hr may not be operational during periods of poor propagation.<br />
For the latest information on Globe Wireless frequencies, visit their webpage at:<br />
http://www.globewireless.com<br />
Stations and channels are added regularly. Contact any Globe Wireless station/channel or visit the website for<br />
an updated list.<br />
Continued on Page 66<br />
August 1999 65
VOS <strong>Program</strong><br />
Continued from Page 65<br />
Mobile Marine Radio Inc.<br />
66 Mariners Weather Log<br />
VOS <strong>Program</strong><br />
<strong>Ship</strong> <strong>Ship</strong><br />
SEL ITU Xmit Rec<br />
Location (CALL) Mode CAL MMSI # CH# Freq Freq Watch<br />
Mobile, AL (WLO) SITOR 1090 003660003 406 4175 4213 24Hr<br />
(WLO) SITOR 1090 003660003 410 4177 4215 24Hr<br />
(WLO) SITOR 1090 003660003 417 4180.5 4218 24Hr<br />
(WLO) SITOR 1090 003660003 606 6265.5 6317 24Hr<br />
(WLO) SITOR 1090 003660003 610 6267.5 6319 24Hr<br />
(WLO) SITOR 1090 003660003 615 6270 6321 24Hr<br />
(WLO) SITOR 1090 003660003 624 6274.5 6325.5 24Hr<br />
(WLO) SITOR 1090 003660003 806 8379 8419 24Hr<br />
(WLO) SITOR 1090 003660003 810 8381 8421 24Hr<br />
(WLO) SITOR 1090 003660003 815 8383.5 8423.5 24Hr<br />
(WLO) SITOR 1090 003660003 829 8390.5 8430.5 24Hr<br />
(WLO) SITOR 1090 003660003 832 8392 8432 24Hr<br />
(WLO) SITOR 1090 003660003 836 8394 8434 24Hr<br />
(WLO) SITOR 1090 003660003 1205 12479 12581.5 24Hr<br />
(WLO) SITOR 1090 003660003 1211 12482 12584.5 24Hr<br />
(WLO) SITOR 1090 003660003 1215 12484 12586.5 24Hr<br />
(WLO) SITOR 1090 003660003 1234 12493.5 12596 24Hr<br />
(WLO) SITOR 1090 003660003 1240 12496.5 12599 24Hr<br />
(WLO) SITOR 1090 003660003 1251 12502 12604.5 24Hr<br />
(WLO) SITOR 1090 003660003 1254 12503.5 12606 24Hr<br />
(WLO) SITOR 1090 003660003 1261 12507 12609.5 24Hr<br />
(WLO) SITOR 1090 003660003 1605 16685.5 16809 24Hr<br />
(WLO) SITOR 1090 003660003 1611 16688.5 16812 24Hr<br />
(WLO) SITOR 1090 003660003 1615 16690.5 16814 24Hr<br />
(WLO) SITOR 1090 003660003 1625 16695.5 16818.5 24Hr<br />
(WLO) SITOR 1090 003660003 1640 16703 16826 24Hr<br />
(WLO) SITOR 1090 003660003 1644 16705 16828 24Hr<br />
(WLO) SITOR 1090 003660003 1661 16713.5 16836.5 24Hr<br />
(WLO) SITOR 1090 003660003 1810 18875 19685.5 24Hr<br />
(WLO) SITOR 1090 003660003 2210 22289 22381 24Hr<br />
(WLO) SITOR 1090 003660003 2215 22291.5 22383.5 24Hr<br />
(WLO) SITOR 1090 003660003 2254 22311 22403 24Hr<br />
(WLO) SITOR 1090 003660003 2256 22312 22404 24Hr<br />
(WLO) SITOR 1090 003660003 2260 22314 22406 24Hr<br />
(WLO) SITOR 1090 003660003 2262 22315 22407 24Hr<br />
(WLO) SITOR 1090 003660003 2272 22320 22412 24Hr<br />
(WLO) SITOR 1090 003660003 2284 22326 22418 24Hr<br />
(WLO) SITOR 1090 003660003 2510 25177.5 26105.5 24Hr<br />
(WLO) SITOR 1090 003660003 2515 25180 26108 24Hr<br />
(WLO) DSC 003660003 4208 4219 24Hr<br />
(WLO) DSC 003660003 6312.5 6331.0 24Hr<br />
(WLO) DSC 003660003 8415 8436.5 24Hr<br />
(WLO) DSC 003660003 12577.5 12657 24Hr<br />
(WLO) DSC 003660003 16805 16903 24Hr<br />
(WLO) Voice 003660003 405 4077 4369 24Hr<br />
(WLO) Voice 414 4104 4396 24Hr<br />
Continued on Page 67
VOS <strong>Program</strong><br />
Continued from Page 66<br />
VOS <strong>Program</strong><br />
<strong>Ship</strong> <strong>Ship</strong><br />
SEL ITU Xmit Rec<br />
Location (CALL) Mode CAL MMSI # CH# Freq Freq Watch<br />
(WLO) Voice 419 4119 4411 24Hr<br />
(WLO) Voice 003660003 607 6218 6519 24Hr<br />
(WLO) Voice 003660003 824 8264 8788 24Hr<br />
(WLO) Voice 829 8279 8803 24Hr<br />
(WLO) Voice 830 8282 8806 24Hr<br />
(WLO) Voice 003660003 1212 12263 13110 24Hr<br />
(WLO) Voice 1226 12305 13152 24Hr<br />
(WLO) Voice 1607 16378 17260 24Hr<br />
(WLO) Voice 1641 16480 17362 24Hr<br />
(WLO) VHFVoice CH 25,84 24Hr<br />
(WLO) DSC Call 003660003 CH 70 24Hr<br />
(WLO) DSC Work 003660003 CH 84 24Hr<br />
Tuckerton, (WSC) SITOR 1108 419 4181.5 4219 24Hr<br />
NJ (WSC) SITOR 1108 832 8392 8432 24Hr<br />
(WSC) SITOR 1108 1283 12518 12620.5 24Hr<br />
(WSC) SITOR 1108 1688 16727 16850 24Hr<br />
(WSC) SITOR 1108 1805 18872.5 19683 24Hr<br />
(WSC) SITOR 1108 2295 22331.5 22423.5 24Hr<br />
Seattle, WA (KLB) SITOR 1113 408 4176 4214 24Hr<br />
(KLB) SITOR 1113 608 6266.5 6318 24Hr<br />
(KLB) SITOR 1113 818 8385 8425 24Hr<br />
(KLB) SITOR 1113 1223 12488 12590.5 24Hr<br />
(KLB) SITOR 1113 1604 16685 16808.5 24Hr<br />
(KLB) SITOR 1113 2240 22304 22396 24Hr<br />
WLO Radio is equipped with an operational Thrane & Thrane TT-6200A DSC system for VHF and MF/HF<br />
general purpose digital selective calling communications.<br />
<strong>Ship</strong> Telex Automatic System Computer Commands and Guidelines for Contacting Mobile Marine<br />
Radio stations.<br />
<strong>Ship</strong> Station Response Land Station Response<br />
1) INITIATE ARQ CALL<br />
4) SHIP’S ANSWERBACK IDENTITY<br />
6) Send Command<br />
OBS+ (Weather Observations)<br />
OPR+ (Operator Assistance)<br />
HELP+ (Operator Procedure)<br />
9) SEND MESSAGE<br />
2) RTTY CHANNEL<br />
3) “WHO ARE YOU”<br />
(Requests <strong>Ship</strong>’s Answerback)<br />
5) GA+?<br />
7) MOM<br />
8) MSG+?<br />
Continued on Page 68<br />
August 1999 67
VOS <strong>Program</strong><br />
Continued from Page 67<br />
10) KKKK (End of Message Indicator,<br />
WAIT for System Response<br />
DO NOT DISCONNECT)<br />
12) SHIP’S ANSWERBACK<br />
15) GO TO STEP 6, or<br />
16) BRK+? Clear Radio Circuit)<br />
68 Mariners Weather Log<br />
VOS <strong>Program</strong><br />
11) RTTY CHANNEL<br />
13) SYSTEM REFERENCE,<br />
INFORMATION, TIME, DURATION<br />
14) GA+?<br />
Stations listed as being 24Hr may not be operational during periods of poor propogation.<br />
For the latest information on Mobile Marine Radio frequencies, visit their webpage at: http://www.wloradio.<br />
com.<br />
National Weather Service <strong>Voluntary</strong> <strong>Observing</strong> <strong>Ship</strong> <strong>Program</strong><br />
New Recruits from January 1 through April 30, 1999<br />
NAME OF SHIP CALL AGENT NAME RECRUITING PMO<br />
ALMA ELPN5 OMI CORPORATION NEW YORK CITY, NY<br />
ANASTASIS 9HOZ MERCY SHIPS MIAMI, FL<br />
APL GARNET 9VVN AMERICAN SHIP MANAGEMENT SAN FRANCISCO, CA<br />
ARABIAN SEA C6QS ECUADORIAN LINE, INC. MIAMI, FL<br />
BARBICAN SPIRIT DVFS PMO MIAMI, FL<br />
CANBERRA GBVC PRINCESS CRUISES MIAMI, FL<br />
CHOYANG PHOENIX P3ZY6 INCHAPE SHIPPING SERVICES NORFOLK, VA<br />
CMS ISLAND EXPRESS J8NX TROPICAL SHIPPING AND CONSTRUCTION CO MIAMI, FL<br />
CORAL SEA C6YW ECUADORIAN LINE....TRIREME VESSEL MANAGEMENT MIAMI, FL<br />
CRYSTAL HARMONY C6IP2 CRYSTAL CRUISE LINE MIAMI, FL<br />
DOCELAKE ELUI6 INCHAPE SHIPPING SERVICES NORFOLK, VA<br />
DONAU LXDO % TECTO N.V. HOUSTON, TX<br />
EMERALD ISLE WCX7834 BEAVER ISLAND BOAT COMPANY CHICAGO, IL<br />
EVER DIAMOND 3FQS8 EVERGREEN AMERICA CORP NORFOLK, VA<br />
EVER DIVINE 3FSA8 EVERGREEN AMERICA CORPORATION NORFOLK, VA<br />
FRANK A. SHRONTZ C6PZ3 CEVRON SHIPPING SAN FRANCISCO, CA<br />
GOLDENSARI INDAH 9VVB MANHATTAN SHIPPING (CANADA) LTD SEATTLE, WA<br />
GREEN POINT WCY4148 CENTRAL GULF LINES NEW YORK CITY, NY<br />
GREEN SAIKAI 3EVS5 INTERNATIONAL SHIPPING CO INC SEATTLE, WA<br />
HMI PETROCHEM KNJL HVIDE MARINE INC. MIAMI, FL<br />
HOEGH DENE ELWO7 KERR NORTON MARINE NORFOLK, VA<br />
IMAN TCTC PMO MIAMI, FL<br />
KATRINE MAERSK OZLL2 MAERSK PACIFIC LTD. NEW YORK CITY, NY<br />
KIRSTEN MAERSK OYDM2 MAERSK PACIFIC LTD SEATTLE, WA<br />
MAERSK SEA S6CW A.P.MOLLER SINGAPORE PTE LTD SEATTLE, WA<br />
MARINE CHEMIST KMCB PORT METEOROLOGICAL OFFICER HOUSTON, TX<br />
MERCEDES 9HHE5 POLEMBROS MARITIME NORFOLK, VA<br />
MSC ORINOCO 3EFY7 TRANS-AMERICA SS AGENCY LOS ANGELES, CA<br />
MV CONTSHIP ROME ELVZ6 LYKES LINES, FIRST VIRGINIA TOWER NORFOLK, VA<br />
ORIENTE VICTORIA 3FVG8 INTERNATIONAL SHIPPING CO. SEATTLE, WA<br />
ORTA DXAY T. PARKER HOST NEW YORK CITY, NY<br />
PACDREAM ELQO6 LASCO SHIPPING CO. SEATTLE, WA<br />
REGAL PRINCESS ELVK6 PRINCESS CRUISES MIAMI, FL<br />
SANTA BARBARA ELOT3 NYK LINE (NORTH AMERICA) INC. SEATTLE, WA<br />
SULU WARRIOR DZEO INCHCAPE SHIPPING SERVICES NORFOLK, VA<br />
TAUSALA SAMOA V2KS SUNRISE SHIPPING AGENCY SEATTLE, WA<br />
TECO TRADER KSDF GULFCOAST TRANSIT CO NEW ORLEANS, LA<br />
THORKIL MAERSK MSJX8 UNIVERSAL MARITIME MIAMI, FL<br />
TROPICAL LIGHT ELTP3 INCHCAPE SHIPPING SERVICES BALTIMORE, MD<br />
USNS SAN JOSE NIBV MASTER SAN FRANCISCO, CA<br />
WESTWOOD BORG LAON4 OCEAN AGENCIES INC., SUITE 202 SEATTLE, WA<br />
WESTWOOD BREEZE LAOT4 OCEAN AGENCIES INC., SUITE 202 SEATTLE, WA
VOS <strong>Program</strong><br />
VOS <strong>Program</strong> Awards and Presentations Gallery<br />
The Sealand Integrity received<br />
1997 and 1998 outstanding<br />
VOS awards. From left, Chief<br />
Mate Bruce Myrdek, Captain<br />
Wes Winters, New York PMO<br />
Tim Kenefik, Captain Alan<br />
Hinshaw, and Chief Mate Bob<br />
Sargent.<br />
A VOS outstanding performance<br />
award for 1998 is<br />
presented to the Carnival<br />
Cruise ship Destiny. From left,<br />
3rd Officer Vasta Rosario, 2nd<br />
Officer Barrile Pierluiai,<br />
Miami PMO Bob<br />
Drummond,and 2nd Officer<br />
Longhin Gianluca.<br />
August 1999 69
Derek LeeLoy, NWS Pacific Region Ocean Services<br />
<strong>Program</strong> Coordinator, performs ship visitations on<br />
behalf of the VOS program in the Honolulu area.<br />
70 Mariners Weather Log<br />
VOS <strong>Program</strong><br />
PMO Miami Robert Drummond presented a VOS award<br />
to Captain James V. Seiler of the R/V Stewart Johnson.<br />
The Chevron South America<br />
received a 1999 outstanding VOS<br />
performance award from Norfolk<br />
PMO Pete Gibino. She is one of<br />
the 15 largest vessels in the world,<br />
at 1200 feet long with a beam of<br />
229 feet. The vessel can carry<br />
3,162,635 barrels of oil (about<br />
407,000 tons) at 98% full. Draft at<br />
full load is 75 feet. With a 42,000<br />
HP steam engine, she has a<br />
service speed of about 15.3 knots<br />
loaded and 17 knots in ballast.
PMO Miami Bob Drummond presented a 1998 VOS<br />
award to the T/S State of Maine (shown dockside in<br />
Castine, Maine).<br />
VOS <strong>Program</strong><br />
PMO Baltimore Jim Saunders presenting a 1997<br />
VOS award to Alastair McDonald of the Gypsum<br />
King.<br />
The APL Singapore was one of<br />
the ships recognized in 1998 by<br />
the VOS program. Standing left to<br />
right are PMO Pat Brandow,<br />
Captain Harrison, and Second<br />
Mate Mark Schiedemayer.<br />
August 1999 71
PMO Baltimore Jim Saunders presenting a 1998 VOS<br />
award to Chief Mate Albert Zykov of the Agulhas.<br />
The Edwin H. Goott is presented a 1998 VOS award.<br />
From left are First Mate Cass Kane, Captain Elden W.<br />
Brege, and Second Mate Richard Robertson. Courtesy<br />
PMO Chiago Amy Seeley.<br />
72 Mariners Weather Log<br />
VOS <strong>Program</strong><br />
PMO Chicago Amy Seeley presenting a 1998 VOS<br />
award to 2nd Mate Edward T. Gaynor of the M/V Burns<br />
Harbor.<br />
Aboard the Chevron South America are, from left, C/O<br />
Emil Smeraldo, 3rd Officer Brigitta Johansen, and 2nd<br />
Officer Philip Nottingham.
VOS <strong>Program</strong><br />
The Sea-Land Anchorage comes<br />
through in 1998 with one of the<br />
top honors of the VOS awards<br />
program. Pictured from left to<br />
right are Second Mate Philip<br />
Kelly, Chief Mate James<br />
Kitterman, and PMO Pat<br />
Brandow of Seattle.<br />
Waterspout spotted by the<br />
Argonaut on May 30, 1999, at<br />
1400Z, 38.2N 63.3W. Photo<br />
courtesy of Master R. Bowden.<br />
August 1999 73
74 Mariners Weather Log<br />
VOS Cooperative <strong>Ship</strong> Reports<br />
VOS Coop <strong>Ship</strong> Reports — January through April 1999<br />
The National Climatic Data Center compiles the tables for the VOS Cooperative <strong>Ship</strong> Report from radio<br />
messages. The values under the monthly columns represent the number of weather reports received. Port<br />
Meteorological Officers supply ship names to the NCDC. Comments or questions regarding this report should<br />
be directed to NCDC, Operations Support Division, 151 Patton Avenue, Asheville, NC 28801, Attention:<br />
Dimitri Chappas (828-271-4060 or dchappas@ncdc.noaa.gov).<br />
SHIP NAME CALL PORT JAN FEB MAR APR TOTAL<br />
AALSMEERGRACHT PCAM Long Beach 20 52 38 48 158<br />
ACT 7 GWAN Newark 40 62 2 0 104<br />
ADVANTAGE WPPO Norfolk 0 0 0 2 2<br />
AGDLEK OUGV Miami 18 2 1 22 43<br />
AGULHAS 3ELE9 Baltimore 55 26 37 35 153<br />
AL AWDAH 9KWA Houston 24 74 44 71 213<br />
AL FUNTAS 9KKX Miami 27 2 0 0 29<br />
AL SAMIDOON 9KKF Houston 33 10 6 33 82<br />
ALBEMARLE ISLAND C6LU3 Newark 61 47 51 54 213<br />
ALBERNI DAWN ELAC5 Houston 46 6 0 31 83<br />
ALBLASGRACHT PCIG Houston 0 0 22 17 39<br />
ALEXANDER VON HUMBOLD Y3CW Miami 728 139 692 703 2262<br />
ALKMAN C6OG4 Houston 36 18 45 67 166<br />
ALLEGIANCE WSKD Norfolk 4 17 15 20 56<br />
ALLIANCA AMERICA DHGE Baltimore 16 0 0 0 16<br />
ALLIGATOR AMERICA JPAL Seattle 0 0 6 11 17<br />
ALLIGATOR BRAVERY 3FXX4 Oakland 33 49 44 42 168<br />
ALLIGATOR COLUMBUS 3ETV8 Seattle 13 9 15 12 49<br />
ALLIGATOR FORTUNE ELFK7 Seattle 16 16 13 16 61<br />
ALLIGATOR GLORY ELJP2 Seattle 23 15 16 16 70<br />
ALLIGATOR HOPE ELFN8 Seattle 9 17 32 28 86<br />
ALLIGATOR LIBERTY JFUG Seattle 72 24 67 33 196<br />
ALLIGATOR STRENGTH 3FAK5 Oakland 15 19 11 8 53<br />
ALPENA WAV4647 Cleveland 0 0 0 11 11<br />
ALTAIR DBBI Miami 502 615 684 494 2295<br />
AMAZON S6BJ Norfolk 22 35 0 51 108<br />
AMBASSADOR BRIDGE 3ETH9 Oakland 68 58 120 45 291<br />
AMERICA STAR C6JZ2 Houston 63 82 83 85 313<br />
AMERICAN CORMORANT KGOP Jacksonville 2 3 0 0 5<br />
AMERICAN MERLIN WRGY Norfolk 5 0 0 0 5<br />
AMERIGO VESPUCCI ICBA Norfolk 5 6 6 15 32<br />
ANASTASIS 9HOZ Miami 0 2 3 33 38<br />
ANATOLIY KOLESNICHENKO UINM Seattle 13 32 33 15 93<br />
ANKERGRACHT PCQL Baltimore 0 39 55 70 164<br />
APL CHINA V7AL5 Seattle 36 25 43 15 119<br />
APL GARNET 9VVN Oakland 42 32 71 0 145<br />
APL JAPAN V7AL7 Seattle 10 24 19 24 77<br />
APL KOREA WCX8883 Seattle 46 54 38 40 178<br />
APL PHILIPPINES WCX8884 Seattle 34 30 32 61 157<br />
APL SINGAPORE WCX8812 Seattle 46 44 57 53 200<br />
APL THAILAND WCX8882 Seattle 52 39 36 49 176<br />
APOLLOGRACHT PCSV Baltimore 61 29 22 38 150<br />
ARCO ALASKA KSBK Long Beach 0 5 14 6 25<br />
ARCO CALIFORNIA WMCV Long Beach 1 0 0 2 3<br />
ARCO INDEPENDENCE KLHV Long Beach 16 15 9 14 54<br />
ARCO PRUDHOE BAY KPFD Long Beach 0 0 0 1 1<br />
ARCO SAG RIVER WLDF Long Beach 5 7 14 7 33<br />
ARCO SPIRIT KHLD Long Beach 14 9 7 18 48<br />
ARCO TEXAS KNFD Long Beach 10 12 13 14 49<br />
ARGONAUT KFDV Newark 14 32 11 7 64<br />
ARIES KGBD New York City 5 2 3 7 17<br />
ARINA ARCTICA OVYA2 Miami 116 97 129 90 432<br />
ARKTIS FUTURE OXUF2 Miami 0 11 71 63 145<br />
ARMCO WE6279 Cleveland 0 0 5 15 20<br />
ARTHUR M. ANDERSON WE4805 Chicago 0 0 16 16 32<br />
ATLANTIC 3FYT Miami 203 207 176 161 747<br />
ATLANTIC BULKER 3FSQ4 Miami 0 7 0 0 7<br />
ATLANTIC CARTIER C6MS4 Norfolk 25 9 3 0 37<br />
Continued on Page 75
Continued from Page 74<br />
VOS Cooperative <strong>Ship</strong> Reports<br />
SHIP NAME CALL PORT JAN FEB MAR APR TOTAL<br />
ATLANTIC COMPANION SKPE Newark 16 14 31 30 91<br />
ATLANTIC COMPASS SKUN Norfolk 32 13 32 32 109<br />
ATLANTIC CONCERT SKOZ Norfolk 21 13 12 17 63<br />
ATLANTIC CONVEYOR C6NI3 Norfolk 26 36 25 25 112<br />
ATLANTIC NOVA 3FWT4 Seattle 1 12 44 49 106<br />
ATLANTIC OCEAN C6T2064 Newark 36 19 20 0 75<br />
ATLANTIS KAQP New Orleans 0 0 14 21 35<br />
AUCKLAND STAR C6KV2 Baltimore 86 66 66 59 277<br />
AUSTRAL RAINBOW WEZP New Orleans 0 0 26 25 51<br />
AUTHOR GBSA Houston 51 23 28 17 119<br />
B. T. ALASKA WFQE Long Beach 9 9 23 16 57<br />
BARBARA ANDRIE WTC9407 Chicago 0 0 9 25 34<br />
BARRINGTON ISLAND C6QK Miami 30 30 62 82 204<br />
BAY BRIDGE ELES7 Seattle 14 6 5 2 27<br />
BELLONA 3FEA4 Jacksonville 6 17 18 14 55<br />
BERING SEA C6YY Miami 20 22 42 33 117<br />
BERNARDO QUINTANA A C6KJ5 New Orleans 30 25 25 15 95<br />
BLUE GEMINI 3FPA6 Seattle 82 43 44 47 216<br />
BLUE HAWK D5HZ Norfolk 26 15 30 22 93<br />
BLUE NOVA 3FDV6 Seattle 33 26 35 26 120<br />
BONN EXPRESS DGNB Houston 450 525 674 314 1963<br />
BP ADMIRAL ZCAK2 Houston 40 58 47 21 166<br />
BREMEN EXPRESS 9VUM Norfolk 11 12 0 0 23<br />
BRIGHT PHOENIX DXNG Seattle 41 40 61 31 173<br />
BRISBANE STAR C6LY4 Seattle 4 45 32 22 103<br />
BRITISH ADVENTURE ZCAK3 Seattle 40 56 52 37 185<br />
BRITISH HAWK ZCBK6 New Orleans 60 63 67 16 206<br />
BRITISH RANGER ZCAS6 Houston 48 55 71 74 248<br />
BT NIMROD ZCBL5 Long Beach 16 4 10 23 53<br />
BUCKEYE WAQ3520 Cleveland 0 0 0 12 12<br />
BUFFALO WXS6134 Cleveland 0 0 0 15 15<br />
BUNGA ORKID DUA 9MBQ4 Seattle 32 30 1 8 71<br />
BURNS HARBOR WQZ7049 Chicago 31 0 24 132 187<br />
C.S. IRIS GVIA Seattle 14 5 0 0 19<br />
CALCITE II WB4520 Chicago 0 0 0 26 26<br />
CALIFORNIA HIGHWAY 3FHQ4 Seattle 0 6 7 8 21<br />
CALIFORNIA JUPITER ELKU8 Long Beach 11 7 10 11 39<br />
CALIFORNIA LUNA 3EYX5 Seattle 9 2 17 4 32<br />
CALIFORNIA MERCURY JGPN Seattle 13 19 4 8 44<br />
CAPE CHARLES 3EFX5 Seattle 5 11 4 11 31<br />
CAPE MAY JBCN Norfolk 10 9 14 5 38<br />
CAPE TRINITY KAFD Houston 6 8 45 1 60<br />
CAPT STEVEN L BENNETT KAXO New Orleans 15 7 41 6 69<br />
CARDIGAN BAY ZCBF5 New York City 42 0 0 0 42<br />
CARIBBEAN MERCY 3FFU4 Miami 16 0 0 25 41<br />
CARLA A. HILLS ELBG9 Oakland 86 83 70 10 249<br />
CARNIVAL DESTINY 3FKZ3 Miami 43 29 37 17 126<br />
CARNIVAL PARADISE 3FOB5 Miami 17 26 27 28 98<br />
CAROLINA WYBI Jacksonville 6 26 19 0 51<br />
CASON J. CALLAWAY WE4879 Chicago 0 0 0 37 37<br />
CELEBRATION ELFT8 Miami 9 12 16 5 42<br />
CENTURY HIGHWAY #2 3EJB9 Long Beach 19 24 9 22 74<br />
CENTURY HIGHWAY NO. 1 3FFJ4 Houston 20 21 27 20 88<br />
CENTURY HIGHWAY_NO. 3 8JNP Houston 6 40 36 0 82<br />
CENTURY LEADER NO. 1 3FBI6 Houston 30 8 21 54 113<br />
CHARLES ISLAND C6JT Miami 55 67 56 38 216<br />
CHARLES M. BEEGHLEY WL3108 Cleveland 0 0 0 32 32<br />
CHASTINE MAERSK OWNJ2 New York City 6 13 0 0 19<br />
CHELSEA KNCX Miami 25 8 28 35 96<br />
CHESAPEAKE BAY DIOD Long Beach 0 1 0 0 1<br />
CHESAPEAKE BAY WMLH Houston 19 48 5 67 139<br />
CHESAPEAKE TRADER WGZK Houston 49 10 17 20 96<br />
CHEVRON ARIZONA KGBE Miami 0 0 85 106 191<br />
CHEVRON ATLANTIC C6KY3 New Orleans 32 21 23 2 78<br />
CHEVRON EDINBURGH VSBZ5 Oakland 7 0 0 14 21<br />
CHEVRON LOUISIANA WHNG Oakland 1 0 0 16 17<br />
CHEVRON MISSISSIPPI WXBR Oakland 42 46 42 38 168<br />
CHEVRON NAGASAKI A8BK Oakland 19 4 11 0 34<br />
CHEVRON SOUTH AMERICA ZCAA2 New Orleans 11 0 43 54 108<br />
CHEVRON WASHINGTON KFDB Oakland 0 0 0 23 23<br />
CHIEF GADAO WEZD Oakland 19 28 19 27 93<br />
CHIQUITA BELGIE C6KD7 Baltimore 38 48 47 30 163<br />
CHIQUITA BREMEN ZCBC5 Miami 40 40 50 47 177<br />
Continued on Page 76<br />
August 1999 75
Continued from Page 75<br />
76 Mariners Weather Log<br />
VOS Cooperative <strong>Ship</strong> Reports<br />
SHIP NAME CALL PORT JAN FEB MAR APR TOTAL<br />
CHIQUITA BRENDA ZCBE9 Miami 51 40 49 37 177<br />
CHIQUITA DEUTSCHLAND C6KD8 Baltimore 60 29 42 45 176<br />
CHIQUITA ELKESCHLAND ZCBB9 Miami 30 44 48 48 170<br />
CHIQUITA FRANCES ZCBD9 Miami 29 33 29 39 130<br />
CHIQUITA ITALIA C6KD5 Baltimore 52 42 56 66 216<br />
CHIQUITA JEAN ZCBB7 Jacksonville 45 44 30 49 168<br />
CHIQUITA JOY ZCBC2 Miami 21 49 52 41 163<br />
CHIQUITA NEDERLAND C6KD6 Baltimore 34 46 54 54 188<br />
CHIQUITA ROSTOCK ZCBD2 Miami 20 53 47 50 170<br />
CHIQUITA SCANDINAVIA C6KD4 Baltimore 61 53 44 40 198<br />
CHIQUITA SCHWEIZ C6KD9 Baltimore 17 9 2 8 36<br />
CHO YANG ATLAS DQVH Seattle 43 50 62 30 185<br />
CHOYANG PHOENIX P3ZY6 Norfolk 0 0 0 5 5<br />
CITY OF DURBAN GXIC Long Beach 51 57 52 68 228<br />
CLEVELAND KGXA Houston 0 0 0 4 4<br />
COLORADO KWFE Miami 0 1 0 14 15<br />
COLUMBIA BAY WRB4008 Houston 1 8 0 0 9<br />
COLUMBIA STAR WSB2018 Cleveland 0 0 0 18 18<br />
COLUMBIA STAR C6HL8 Long Beach 76 57 86 77 296<br />
COLUMBINE 3ELQ9 Baltimore 1 16 83 3 103<br />
COLUMBUS AMERICA ELSX2 Norfolk 40 49 68 7 164<br />
COLUMBUS AUSTRALIA ELSX3 Houston 37 17 25 41 120<br />
COLUMBUS CALIFORNIA ELUB7 Houston 20 42 0 56 118<br />
COLUMBUS CANADA ELQN3 Seattle 55 63 14 19 151<br />
COLUMBUS CANTERBURY ELUB8 Norfolk 0 0 0 52 52<br />
COLUMBUS QUEENSLAND ELUB9 Norfolk 31 12 3 0 46<br />
COLUMBUS VICTORIA ELUB6 Long Beach 42 0 29 19 90<br />
CONDOLEEZZA RICE C6OK Baltimore 0 0 3 7 10<br />
CONTSHIP ENDEAVOUR ZCBE7 Houston 0 0 28 26 54<br />
CONTSHIP SUCCESS ZCBE3 Houston 84 43 94 58 279<br />
COPACABANA PPXI Norfolk 3 15 0 0 18<br />
CORAL SEA C6YW Miami 0 0 0 44 44<br />
CORDELIA 3ESJ3 Long Beach 0 6 4 7 17<br />
CORMORANT ARROW C6IO9 Seattle 0 65 61 0 126<br />
CORNUCOPIA KPJC Oakland 48 53 19 12 132<br />
CORWITH CRAMER WTF3319 Norfolk 1 19 35 45 100<br />
COSMOWAY 3EVO3 Seattle 3 10 22 8 43<br />
COURTNEY BURTON WE6970 Cleveland 0 0 2 23 25<br />
COURTNEY L ZCAQ8 Baltimore 21 16 19 21 77<br />
CRISTOFORO COLOMBO ICYS Norfolk 18 17 13 12 60<br />
CROWN OF SCANDINAVIA OXRA6 Miami 43 43 42 63 191<br />
CSL CABO D5XH Seattle 31 35 34 52 152<br />
CSS HUDSON CGDG Norfolk 0 0 0 51 51<br />
DAGMAR MAERSK DHAF New York City 18 4 1 0 23<br />
DAISHIN MARU 3FPS6 Seattle 69 75 77 56 277<br />
DANIA PORTLAND OXEH2 Miami 39 66 31 17 153<br />
DAVID Z. NORTON WZF9655 Cleveland 0 0 0 1 1<br />
DAWN PRINCESS ELTO4 Miami 28 28 25 28 109<br />
DELAWARE BAY WMLG Houston 0 0 18 14 32<br />
DELAWARE TRADER WXWL Long Beach 40 86 116 40 282<br />
DENALI WSVR Long Beach 32 21 31 15 99<br />
DIRECT FALCON C6MP7 Long Beach 69 63 92 18 242<br />
DIRECT KEA C6MP8 Long Beach 61 67 92 70 290<br />
DIRECT KOOKABURRA C6MQ2 Long Beach 26 73 46 59 204<br />
DOCK EXPRESS 20 PJRF Baltimore 31 10 38 5 84<br />
DON QUIJOTE SFQP New York City 0 0 26 0 26<br />
DONAU LXDO Houston 20 23 0 0 43<br />
DORTHE MAERSK DHPD New York City 26 2 0 0 28<br />
DORTHE OLDENDORFF ELQJ6 Seattle 6 2 10 20 38<br />
DRAGOER MAERSK OXPW2 Long Beach 42 3 24 35 104<br />
DUHALLOW ZCBH9 Baltimore 68 64 74 47 253<br />
DUNCAN ISLAND C6JS Miami 23 43 51 45 162<br />
DUSSELDORF EXPRESS S6IG Long Beach 701 363 714 676 2454<br />
E.P. LE QUEBECOIS CG3130 Norfolk 0 0 0 191 191<br />
EAGLE BEAUMONT S6JO New York City 2 0 0 0 2<br />
EASTERN BRIDGE C6JY9 Baltimore 89 85 79 80 333<br />
ECSTASY ELNC5 Miami 6 1 0 0 7<br />
EDELWEISS VRUM3 Seattle 35 48 35 37 155<br />
EDGAR B. SPEER WQZ9670 Chicago 45 0 30 136 211<br />
EDWIN H. GOTT WXQ4511 Chicago 7 0 0 28 35<br />
EDYTH L C6YC Baltimore 8 10 14 18 50<br />
EL MORRO KCGH Miami 0 0 5 14 19<br />
EL YUNQUE WGJT Jacksonville 2 25 25 0 52<br />
Continued on Page 77
Continued from Page 76<br />
VOS Cooperative <strong>Ship</strong> Reports<br />
SHIP NAME CALL PORT JAN FEB MAR APR TOTAL<br />
ELATION 3FOC5 Miami 6 4 8 5 23<br />
EMPIRE STATE KKFW New York City 29 38 0 0 67<br />
ENCHANTMENT OF THE SEAS LAXA4 Miami 2 1 3 0 6<br />
ENDEAVOR WAUW New York City 21 29 56 23 129<br />
ENDURANCE WAUU New York City 23 17 38 30 108<br />
ENERGY ENTERPRISE WBJF Baltimore 9 0 0 0 9<br />
ENGLISH STAR C6KU7 Long Beach 64 63 63 77 267<br />
ENIF 9VVI Houston 0 15 0 0 15<br />
ENTERPRISE WAUY New York City 31 26 64 35 156<br />
EVER DELIGHT 3FCB8 New York City 0 4 7 4 15<br />
EVER DELUXE 3FBE8 Norfolk 0 10 12 0 22<br />
EVER DEVOTE 3FIF8 New York City 0 0 0 1 1<br />
EVER GAINING BKJO Norfolk 0 9 0 0 9<br />
EVER GALLANT BKJN Norfolk 0 0 2 0 2<br />
EVER GARLAND 3EOB8 Long Beach 4 0 0 4 8<br />
EVER GENERAL BKHY Baltimore 0 0 21 0 21<br />
EVER GENTLE BKHE Newark 0 16 15 0 31<br />
EVER GLOWING BKJZ Long Beach 5 0 0 7 12<br />
EVER GRACE 3FWR2 Seattle 0 12 13 0 25<br />
EVER GROUP BKJI Long Beach 0 0 4 0 4<br />
EVER GUEST BKJH Norfolk 0 0 18 15 33<br />
EVER LAUREL BKHH Long Beach 11 22 0 0 33<br />
EVER LEVEL BKHJ Miami 10 22 9 3 44<br />
EVER RACER 3FJL4 Norfolk 2 17 3 14 36<br />
EVER REACH 3FQO4 Newark 0 0 0 15 15<br />
EVER RENOWN 3FFR4 Long Beach 9 0 0 0 9<br />
EVER RESULT 3FSA4 Norfolk 0 0 7 0 7<br />
EVER RIGHT 3FML3 Long Beach 2 0 12 5 19<br />
EVER ROUND 3FQN3 Long Beach 0 11 0 0 11<br />
EVER ULTRA 3FEJ6 Seattle 6 10 7 7 30<br />
EVER UNION 3FFG7 Seattle 0 0 0 23 23<br />
EVER UNIQUE 3FXQ6 Seattle 6 4 10 11 31<br />
EVER UNISON 3FTL6 Long Beach 13 10 16 15 54<br />
EVER UNITED 3FMQ6 Seattle 9 4 5 4 22<br />
FAIRLIFT PEBM Norfolk 36 20 56 0 112<br />
FAIRMAST PJLC Norfolk 0 42 24 19 85<br />
FANAL TRADER VRUY4 Seattle 57 35 71 46 209<br />
FANTASY ELKI6 Miami 0 1 0 4 5<br />
FARALLON ISLAND FARIS Oakland 146 135 126 102 509<br />
FASCINATION 3EWK9 Miami 10 11 9 11 41<br />
FAUST WRYX Jacksonville 27 29 16 2 74<br />
FIDELIO WQVY Jacksonville 45 43 44 29 161<br />
FLAMENGO PPXU Norfolk 0 26 0 0 26<br />
FLORAL LAKE 3FFA5 Seattle 0 0 0 2 2<br />
FOREST CHAMPION 3FSH3 Seattle 65 2 0 0 67<br />
FRANCES HAMMER KRGC Jacksonville 19 12 17 18 66<br />
FRANCES L C6YE Baltimore 55 40 41 35 171<br />
FRANKFURT EXPRESS 9VPP New York City 52 40 33 47 172<br />
G AND C PARANA LADC2 Long Beach 14 9 29 14 66<br />
GALVESTON BAY WPKD Houston 26 42 45 56 169<br />
GANNET ARROW C6QF5 Seattle 5 5 15 5 30<br />
GEORGE A. SLOAN WA5307 Chicago 1 0 0 21 22<br />
GEORGE A. STINSON WCX2417 Cleveland 5 0 7 6 18<br />
GEORGE SCHULTZ ELPG9 Baltimore 36 15 30 25 106<br />
GEORGE WASHINGTON BRIDGE JKCF Long Beach 55 45 49 51 200<br />
GEORGIA RAINBOW II VRVS5 Jacksonville 0 0 15 68 83<br />
GLOBAL LINK WWDY Baltimore 42 76 7 0 125<br />
GLOBAL MARINER WWXA Baltimore 31 19 0 0 50<br />
GLOBAL SENTINEL WRZU Baltimore 8 0 0 0 8<br />
GLORIOUS SUCCESS DUHN Seattle 0 13 0 20 33<br />
GLORIOUS SUN DVTR Seattle 0 0 8 2 10<br />
GOLDEN BEAR NMRY Oakland 0 0 0 7 7<br />
GOLDEN BELL 3EBK9 Seattle 12 9 5 10 36<br />
GOLDEN GATE KIOH Long Beach 0 0 12 75 87<br />
GOLDEN GATE BRIDGE 3FWM4 Seattle 67 76 59 83 285<br />
GRANDEUR OF THE SEAS ELTQ9 Miami 4 12 9 9 34<br />
GREAT LAND WFDP Seattle 21 0 0 47 68<br />
GREEN BAY KGTH Long Beach 26 13 17 5 61<br />
GREEN ISLAND KIBK New Orleans 0 29 0 4 33<br />
GREEN LAKE KGTI Baltimore 31 49 66 71 217<br />
GREEN POINT WCY4148 New York City 0 3 17 16 36<br />
GREEN RAINIER 3ENI3 Seattle 24 35 27 41 127<br />
GREEN RIDGE WRYL Seattle 5 0 0 0 5<br />
Continued on Page 78<br />
August 1999 77
Continued from Page 77<br />
78 Mariners Weather Log<br />
VOS Cooperative <strong>Ship</strong> Reports<br />
SHIP NAME CALL PORT JAN FEB MAR APR TOTAL<br />
GRETE MAERSK OZNF2 New York City 18 16 8 9 51<br />
GROTON KMJL Newark 12 7 10 26 55<br />
GUANAJUATO ELMH8 Jacksonville 22 11 14 1 48<br />
GUAYAMA WZJG Jacksonville 3 13 21 21 58<br />
HADERA ELBX4 Baltimore 34 40 39 14 127<br />
HANDY LOGGER DZBH Seattle 1 1 0 0 2<br />
HANJIN BARCELONA 3EXX9 Long Beach 8 0 1 0 9<br />
HANJIN COLOMBO 3FTF4 Oakland 0 6 8 0 14<br />
HANJIN KAOHSIUNG P3BN8 Seattle 5 6 17 9 37<br />
HANJIN KEELUNG P3VH7 Houston 64 43 59 28 194<br />
HANJIN LOS ANGELES 3FPQ7 Newark 0 9 8 15 32<br />
HANJIN PORTLAND 3FSB3 Newark 0 14 3 0 17<br />
HANJIN TOKYO 3FZJ3 New York City 8 0 0 0 8<br />
HANSA CALADONIA DHFN Norfolk 3 7 0 0 10<br />
HARBOUR BRIDGE ELJH9 Seattle 2 0 0 0 2<br />
HEIDELBERG EXPRESS DEDI Houston 288 0 526 182 996<br />
HEKABE C6OU2 New Orleans 38 0 0 0 38<br />
HENRY HUDSON BRIDGE JKLS Long Beach 84 50 42 85 261<br />
HERBERT C. JACKSON WL3972 Cleveland 0 0 0 8 8<br />
HOEGH DENE ELWO7 Norfolk 0 0 0 14 14<br />
HOEGH DYKE LAGM5 Norfolk 7 0 0 0 7<br />
HOEGH MINERVA LAGI5 Seattle 13 14 0 0 27<br />
HOEGH MIRANDA LAGJ5 Norfolk 0 0 15 11 26<br />
HOLIDAY 3FPN5 Long Beach 1 1 0 3 5<br />
HONG KONG SENATOR DEIP Seattle 33 42 40 36 151<br />
HONSHU SILVIA 3EST7 Seattle 65 58 65 70 258<br />
HOOD ISLAND C6LU4 Miami 25 44 38 31 138<br />
HORIZON ELNG6 Miami 0 1 0 0 1<br />
HOUSTON FNXB Houston 54 10 7 24 95<br />
HOUSTON EXPRESS DLBB Houston 0 16 58 63 137<br />
HUMACAO WZJB Norfolk 28 32 36 38 134<br />
HUMBERGRACHT PEUQ Houston 14 0 34 53 101<br />
HUME HIGHWAY 3EJO6 Jacksonville 0 3 47 37 87<br />
HYUNDAI CONTINENTAL D9RV Norfolk 0 0 5 1 6<br />
HYUNDAI DISCOVERY 3FFR6 Seattle 18 20 35 40 113<br />
HYUNDAI EXPLORER 3FTG4 Seattle 4 50 38 44 136<br />
HYUNDAI FORTUNE 3FLG6 Seattle 1 15 32 18 66<br />
HYUNDAI FREEDOM 3FFS6 Seattle 7 12 9 14 42<br />
HYUNDAI INDEPENDENCE 3FDY6 Seattle 0 0 1 0 1<br />
HYUNDAI LIBERTY 3FFT6 Seattle 11 7 8 15 41<br />
IMAGINATION 3EWJ9 Miami 0 4 1 12 17<br />
INDEPENDENT LEADER DHOU New York City 0 11 70 71 152<br />
INDIAN OCEAN C6T2063 New York City 14 23 13 18 68<br />
INSPIRATION 3FOA5 Miami 2 2 4 2 10<br />
IRENA ARCTICA OXTS2 Miami 115 107 127 80 429<br />
ISLA DE CEDROS 3FOA6 Seattle 0 16 25 43 84<br />
ISLAND PRINCESS GBBM Long Beach 2 7 0 0 9<br />
ITB BALTIMORE WXKM Baltimore 5 0 0 3 8<br />
ITB MOBILE KXDB New York City 1 2 0 13 16<br />
ITB NEW YORK WVDG Newark 15 28 15 17 75<br />
IVARAN CONDOR DGGD Houston 19 12 13 20 64<br />
IVARAN EAGLE DNEN Houston 18 41 23 11 93<br />
IVARAN RAVEN DIGF Houston 34 24 36 34 128<br />
IVER EXPLORER PEXV Houston 13 0 0 0 13<br />
IVER EXPRESS PEXX Houston 53 39 51 44 187<br />
IWANUMA MARU 3ESU8 Seattle 16 21 12 16 65<br />
J. DENNIS BONNEY ELLE2 Baltimore 0 0 0 16 16<br />
J.A.W. IGLEHART WTP4966 Cleveland 0 0 0 4 4<br />
JACKLYN M. WCV7620 Chicago 0 0 16 8 24<br />
JACKSONVILLE WNDG Baltimore 30 39 36 21 126<br />
JADE ORIENT ELRY6 Seattle 20 1 4 2 27<br />
JADE PACIFIC ELRY5 Seattle 0 17 6 11 34<br />
JAHRE SPIRIT LAWS2 Houston 7 2 1 0 10<br />
JAMES ELRR6 New Orleans 40 49 48 56 193<br />
JAMES N. SULLIVAN ELPG8 Baltimore 5 0 0 0 5<br />
JEB STUART WRGQ Oakland 0 2 2 66 70<br />
JO CLIPPER PFEZ Baltimore 34 8 27 36 105<br />
JOHN G. MUNSON WE3806 Chicago 0 0 0 83 83<br />
JOIDES RESOLUTION D5BC Norfolk 69 22 48 7 146<br />
JOSEPH L. BLOCK WXY6216 Chicago 1 0 9 16 26<br />
JOSEPH LYKES ELRZ8 Houston 25 26 32 37 120<br />
JUBILEE 3FPM5 Long Beach 48 36 10 2 96<br />
JULIUS HAMMER KRGJ Jacksonville 11 3 9 9 32<br />
Continued on Page 79
Continued from Page 78<br />
VOS Cooperative <strong>Ship</strong> Reports<br />
SHIP NAME CALL PORT JAN FEB MAR APR TOTAL<br />
JUPITER DIAMOND 9VNA Baltimore 0 43 0 0 43<br />
KAIJIN 3FWI3 Seattle 0 0 0 5 5<br />
KANIN ELEO2 New Orleans 64 13 14 37 128<br />
KAPITAN BYANKIN UAGK Seattle 9 21 26 24 80<br />
KAPITAN KONEV UAHV Seattle 22 20 41 59 142<br />
KAPITAN MASLOV UBRO Seattle 15 9 24 37 85<br />
KAREN ANDRIE WBS5272 Chicago 0 0 2 31 33<br />
KATRINE MAERSK OZLL2 New York City 0 0 0 4 4<br />
KAUAI WSRH Long Beach 0 1 8 13 22<br />
KAYE E. BARKER WCF3012 Cleveland 11 0 2 25 38<br />
KAZIMAH 9KKL Houston 39 45 0 88 172<br />
KEE LUNG BHFN Seattle 0 14 0 7 21<br />
KEN KOKU 3FMN6 Seattle 10 14 1 6 31<br />
KEN SHIN YJQS2 Seattle 5 4 15 18 42<br />
KENAI WSNB Houston 2 6 8 0 16<br />
KENNETH E. HILL C6FA6 Newark 43 51 44 4 142<br />
KENNETH T. DERR C6FA3 Newark 63 27 40 0 130<br />
KENNICOTT WCY2920 Seattle 2 13 0 0 15<br />
KINSMAN INDEPENDENT WUZ7811 Cleveland 0 0 0 13 13<br />
KNOCK ALLAN ELOI6 Houston 36 33 24 0 93<br />
KOELN EXPRESS 9VBL New York City 271 615 447 682 2015<br />
KRISTEN MAERSK OYDM2 Seattle 0 34 6 14 54<br />
KURE 3FGN3 Seattle 14 23 28 8 73<br />
LEE A. TREGURTHA WUR8857 Cleveland 7 0 0 19 26<br />
LEGEND OF THE SEAS ELRR5 New Orleans 5 17 20 15 57<br />
LEISE MAERSK OXGR2 Oakland 0 11 1 27 39<br />
LEOPARDI V7AU8 Baltimore 0 0 5 22 27<br />
LIBERTY SPIRIT WCPU New Orleans 6 0 3 0 9<br />
LIBERTY STAR WCBP New Orleans 44 39 40 8 131<br />
LIBERTY SUN WCOB Houston 54 38 4 30 126<br />
LILAC ACE 3FDL4 Long Beach 11 12 76 57 156<br />
LINDA OLDENDORF ELRR2 Baltimore 24 48 38 50 160<br />
LINDO MAERSK OWEQ2 Long Beach 0 0 0 49 49<br />
LNG AQUARIUS WSKJ Oakland 64 47 56 66 233<br />
LNG CAPRICORN KHLN New York City 26 24 12 2 64<br />
LNG LEO WDZB New York City 29 49 69 64 211<br />
LNG LIBRA WDZG New York City 3 20 8 24 55<br />
LNG TAURUS WDZW New York City 21 31 17 2 71<br />
LNG VIRGO WDZX New York City 23 62 49 20 154<br />
LOK PRAGATI ATZS Seattle 42 0 2 10 54<br />
LONG BEACH 3FOU3 Seattle 0 5 0 10 15<br />
LONG LINES WATF Baltimore 28 19 85 21 153<br />
LOOTSGRACHT PFPT Houston 20 21 39 40 120<br />
LOUIS MAERSK OXMA2 Baltimore 0 39 4 31 74<br />
LUCY OLDENDORFF ELPA2 Long Beach 0 19 34 8 61<br />
LUISE OLDENDORFF 3FOW4 Seattle 16 4 0 0 20<br />
LURLINE WLVD Oakland 12 34 45 43 134<br />
LUTJENBURG ELVF6 Long Beach 48 56 68 41 213<br />
LYKES ADVENTURER KNFG Jacksonville 6 4 0 0 10<br />
LYKES CHALLANGER FNHV Houston 39 14 21 9 83<br />
LYKES COMMANDER 3ELF9 Baltimore 22 17 12 31 82<br />
LYKES DISCOVERER WGXO Houston 29 29 19 57 134<br />
LYKES EXPLORER WGLA Houston 62 34 40 7 143<br />
LYKES LIBERATOR WGXN Houston 35 21 28 44 128<br />
LYKES NAVIGATOR WGMJ Houston 27 16 26 17 86<br />
LYKES PATHFINDER 3EJT9 Baltimore 2 47 20 5 74<br />
M. P. GRACE ELBG New Orleans 0 0 3 0 3<br />
M/V FRANCOIS L.D. FNEQ Norfolk 6 54 57 8 125<br />
MAASDAM PFRO Miami 0 0 2 2 4<br />
MACKINAC BRIDGE JKES Long Beach 82 57 71 59 269<br />
MADISON MAERSK OVJB2 Oakland 13 11 19 24 67<br />
MAERSK BROOKLYN C6OE8 New York City 65 43 0 0 108<br />
MAERSK CALIFORNIA WCX5083 Miami 29 0 0 0 29<br />
MAERSK COLORADO WCX5081 Miami 30 10 2 8 50<br />
MAERSK GANNET GJLK Miami 69 6 72 41 188<br />
MAERSK GENOA DGUC New York City 24 41 35 34 134<br />
MAERSK GIANT OU2465 Miami 233 214 222 228 897<br />
MAERSK SANTOS ELRR4 Baltimore 6 2 0 6 14<br />
MAERSK SEA S6CW Seattle 0 0 12 49 61<br />
MAERSK SHETLAND MSQK3 Miami 6 45 6 0 57<br />
MAERSK SOMERSET MQVF8 New Orleans 64 27 27 6 124<br />
MAERSK STAFFORD MRSS9 New Orleans 47 52 58 48 205<br />
MAERSK SUN S6ES Seattle 75 39 0 0 114<br />
Continued on Page 80<br />
August 1999 79
Continued from Page 79<br />
80 Mariners Weather Log<br />
VOS Cooperative <strong>Ship</strong> Reports<br />
SHIP NAME CALL PORT JAN FEB MAR APR TOTAL<br />
MAERSK SURREY MRSG8 Houston 56 82 73 48 259<br />
MAERSK TAIKI 9VIG Baltimore 2 68 0 1 71<br />
MAERSK TENNESSEE WCX3486 Miami 22 44 0 0 66<br />
MAERSK TEXAS WCX3249 Miami 0 16 1 0 17<br />
MAGLEBY MAERSK OUSH2 Newark 3 9 24 5 41<br />
MAHARASHTRA VTSQ Seattle 1 3 0 2 6<br />
MAHIMAHI WHRN Oakland 60 25 54 51 190<br />
MAIRANGI BAY GXEW Long Beach 67 43 68 72 250<br />
MAJESTIC MAERSK OUJH2 Newark 26 0 35 0 61<br />
MAJESTY OF THE SEAS LAOI4 Miami 45 36 48 30 159<br />
MANHATTAN BRIDGE 3FWL4 Long Beach 21 62 51 34 168<br />
MANOA KDBG Oakland 46 26 23 1 96<br />
MANUKAI KNLO Oakland 0 0 1 36 37<br />
MARCHEN MAERSK OWDQ2 Long Beach 19 9 15 0 43<br />
MAREN MAERSK OWZU2 Long Beach 16 7 18 12 53<br />
MARGRETHE MAERSK OYSN2 Long Beach 17 23 20 46 106<br />
MARIE MAERSK OULL2 Newark 18 17 21 10 66<br />
MARINE CHEMIST KMCB Houston 0 0 44 40 84<br />
MARINE COLUMBIA KLKZ Oakland 40 24 56 54 174<br />
MARIT MAERSK OZFC2 Miami 9 19 21 17 66<br />
MATHILDE MAERSK OUUU2 Long Beach 27 33 25 20 105<br />
MATSONIA KHRC Oakland 49 27 49 20 145<br />
MAUI WSLH Long Beach 37 40 54 44 175<br />
MAURICE EWING WLDZ Newark 3 61 50 22 136<br />
MAYAGUEZ WZJE Jacksonville 33 32 33 25 123<br />
MAYVIEW MAERSK OWEB2 Oakland 17 17 24 14 72<br />
MC-KINNEY MAERSK OUZW2 Newark 7 12 9 17 45<br />
MEDUSA CHALLENGER WA4659 Cleveland 5 0 0 34 39<br />
MEKHANIK KALYUZHNIY UFLO Seattle 53 45 1 0 99<br />
MEKHANIK MOLDOVANOV UIKI Seattle 69 0 1 0 70<br />
MELBOURNE STAR C6JY6 Newark 41 53 28 36 158<br />
MELVILLE WECB Long Beach 38 66 66 48 218<br />
MERCHANT PREMIER VROP Houston 25 39 47 29 140<br />
MERCHANT PRINCIPAL VRIO Miami 12 6 41 16 75<br />
MERCURY 3FFC7 Miami 0 0 2 0 2<br />
MERCURY ACE JFMO Norfolk 0 12 14 35 61<br />
MERLION ACE 9VHJ Long Beach 3 10 9 7 29<br />
MESABI MINER WYQ4356 Cleveland 8 0 10 17 35<br />
METEOR DBBH Houston 167 168 178 185 698<br />
METTE MAERSK OXKT2 Long Beach 8 18 13 13 52<br />
MICHIGAN WRB4141 Chicago 4 5 5 9 23<br />
MIDDLETOWN WR3225 Cleveland 0 0 3 38 41<br />
MING ASIA BDEA New York City 0 7 15 21 43<br />
MING PEACE ELVR9 Long Beach 6 4 0 0 10<br />
MOKIHANA WNRD Oakland 63 36 50 45 194<br />
MOKU PAHU WBWK Oakland 80 58 63 26 227<br />
MORELOS PGBB Houston 37 40 58 31 166<br />
MORMACSKY WMBQ New York City 26 11 19 0 56<br />
MORMACSTAR KGDF Houston 36 51 24 22 133<br />
MORMACSUN WMBK Norfolk 10 31 16 5 62<br />
MOSEL ORE ELRE5 Norfolk 25 34 36 0 95<br />
MSC BOSTON 9HGP4 New York City 27 31 38 45 141<br />
MSC NEW YORK 9HIG4 New York City 45 43 55 0 143<br />
MUNKEBO MAERSK OUNI5 New York City 0 0 0 15 15<br />
MV CONTSHIP ROME ELVZ6 Norfolk 0 0 0 7 7<br />
MV MIRANDA 3FRO4 Norfolk 0 31 27 0 58<br />
MYRON C. TAYLOR WA8463 Chicago 0 0 0 6 6<br />
NADA II ELAV2 Seattle 25 22 32 1 80<br />
NAJA ARCTICA OXVH2 Miami 2 18 1 0 21<br />
NATHANIEL B. PALMER WBP3210 Seattle 60 60 46 21 187<br />
NATIONAL DIGNITY DZRG Long Beach 11 12 13 6 42<br />
NATIONAL HONOR DZDI Long Beach 1 17 4 6 28<br />
NEDLLOYD HOLLAND KRHX Houston 47 65 68 38 218<br />
NEDLLOYD MONTEVIDEO PGAF Long Beach 21 47 0 30 98<br />
NEDLLOYD RALEIGH BAY PHKG Houston 0 3 2 0 5<br />
NEGO LOMBOK DXQC Seattle 0 24 30 14 68<br />
NELVANA YJWZ7 Baltimore 26 47 11 0 84<br />
NEPTUNE ACE JFLX Long Beach 0 0 0 23 23<br />
NEPTUNE RHODONITE ELJP4 Long Beach 23 15 12 26 76<br />
NEW CARISSA 3ELY7 Seattle 71 12 0 0 83<br />
NEW HORIZON WKWB Long Beach 10 14 48 0 72<br />
NEW NIKKI 3FHG5 Seattle 36 43 53 61 193<br />
NEWARK BAY WPKS Houston 51 49 49 61 210<br />
Continued on Page 81
Continued from Page 80<br />
VOS Cooperative <strong>Ship</strong> Reports<br />
SHIP NAME CALL PORT JAN FEB MAR APR TOTAL<br />
NEWPORT BRIDGE 3FGH3 Oakland 22 7 14 14 57<br />
NIEUW AMSTERDAM PGGQ Long Beach 0 0 0 12 12<br />
<strong>NOAA</strong> SHIP ALBATROSS IV WMVF Norfolk 28 33 101 92 254<br />
<strong>NOAA</strong> SHIP DELAWARE II KNBD New York City 12 68 93 101 274<br />
<strong>NOAA</strong> SHIP FERREL WTEZ Norfolk 6 0 12 23 41<br />
<strong>NOAA</strong> SHIP KA’IMIMOANA WTEU Seattle 29 51 0 15 95<br />
<strong>NOAA</strong> SHIP MCARTHUR WTEJ Seattle 0 28 0 13 41<br />
<strong>NOAA</strong> SHIP MILLER FREEMAN WTDM Seattle 0 0 0 127 127<br />
<strong>NOAA</strong> SHIP OREGON II WTDO New Orleans 64 72 75 46 257<br />
<strong>NOAA</strong> SHIP RAINIER WTEF Seattle 0 0 0 27 27<br />
<strong>NOAA</strong> SHIP RONALD H BROWN WTEC New Orleans 40 64 74 37 215<br />
<strong>NOAA</strong> SHIP T. CROMWELL WTDF Seattle 13 82 86 97 278<br />
<strong>NOAA</strong> SHIP WHITING WTEW Baltimore 0 8 0 30 38<br />
NOBEL STAR KRPP Houston 12 11 12 0 35<br />
NOL STENO ZCBD4 New York City 3 6 14 36 59<br />
NOLIZWE MQLN7 New York City 113 18 105 91 327<br />
NOMZI MTQU3 Baltimore 58 81 58 90 287<br />
NOORDAM PGHT Miami 4 0 0 0 4<br />
NORASIA SHANGHAI DNHS New York City 0 0 21 10 31<br />
NORD JAHRE TRANSPORTER LACF4 Baltimore 8 3 5 6 22<br />
NORDMAX P3YS5 Seattle 66 50 72 84 272<br />
NORDMORITZ P3YR5 Seattle 34 77 72 15 198<br />
NORTHERN LIGHTS WFJK New Orleans 0 0 0 11 11<br />
NORWAY C6CM7 Miami 0 0 0 36 36<br />
NORWEGIAN WIND C6LG6 Miami 19 23 5 11 58<br />
NTABENI 3EGR6 Houston 0 40 38 14 92<br />
NUERNBERG EXPRESS 9VBK Houston 713 649 704 711 2777<br />
NUEVO LEON XCKX Houston 17 15 17 11 60<br />
NYK SPRINGTIDE S6CZ Seattle 6 0 0 0 6<br />
NYK STARLIGHT 3FUX6 Long Beach 39 59 31 40 169<br />
NYK SUNRISE 3FYZ6 Seattle 49 31 33 46 159<br />
NYK SURFWIND ELOT3 Seattle 0 0 0 23 23<br />
OCEAN BELUGA 3FEI6 Jacksonville 16 15 2 5 38<br />
OCEAN CITY WCYR Houston 50 32 55 35 172<br />
OCEAN HARMONY 3FRX6 Seattle 7 3 1 0 11<br />
OCEAN LAUREL 3FLX4 Seattle 2 0 0 0 2<br />
OCEAN PALM 3FDO7 Seattle 7 35 45 69 156<br />
OCEAN SERENE DURY Seattle 38 0 47 0 85<br />
OGLEBAY NORTON WAQ3521 Cleveland 10 0 10 32 52<br />
OLEANDER PJJU Newark 23 14 18 25 80<br />
OLIVEBANK 3ETQ5 Baltimore 1 0 0 0 1<br />
OLYMPIA V7AZ4 Baltimore 71 80 78 57 286<br />
OLYMPIAN HIGHWAY 3FSH4 Seattle 0 0 10 14 24<br />
OOCL AMERICA ELSM7 Oakland 30 31 42 36 139<br />
OOCL CALIFORNIA ELSA4 Seattle 41 29 37 51 158<br />
OOCL CHINA ELSU8 Long Beach 58 53 61 58 230<br />
OOCL ENVOY ELNV7 Seattle 29 23 35 40 127<br />
OOCL FAIR ELFV2 Long Beach 17 17 31 38 103<br />
OOCL FAITH ELFU9 Norfolk 44 38 70 42 194<br />
OOCL FIDELITY ELFV8 Long Beach 13 18 37 11 79<br />
OOCL FORTUNE ELFU8 Norfolk 16 37 28 13 94<br />
OOCL FREEDOM VRCV Norfolk 47 65 46 56 214<br />
OOCL FRIENDSHIP ELFV3 Long Beach 18 28 16 32 94<br />
OOCL HONG KONG VRVA5 Oakland 34 26 16 13 89<br />
OOCL INNOVATION WPWH Houston 35 43 53 50 181<br />
OOCL INSPIRATION KRPB Houston 52 31 55 55 193<br />
OOCL JAPAN ELSU6 Long Beach 72 61 83 56 272<br />
ORANGE BLOSSOM ELEI6 Newark 0 0 23 22 45<br />
ORIANA GVSN Miami 73 4 43 25 145<br />
ORIENTAL ROAD 3FXT6 Houston 25 74 23 16 138<br />
ORIENTE GRACE 3FHT4 Seattle 28 15 27 5 75<br />
ORIENTE HOPE 3ETH4 Seattle 23 19 33 5 80<br />
ORIENTE NOBLE 3FVF5 Seattle 35 11 0 0 46<br />
ORIENTE PRIME 3FOU4 Seattle 11 0 0 0 11<br />
OURO DO BRASIL ELPP9 Baltimore 0 6 0 0 6<br />
OVERSEAS CHICAGO KBCF Oakland 2 2 4 0 8<br />
OVERSEAS HARRIET WRFJ Houston 0 2 5 0 7<br />
OVERSEAS JOYCE WUQL Jacksonville 64 64 59 29 216<br />
OVERSEAS MARILYN WFQB Houston 3 4 1 6 14<br />
OVERSEAS NEW ORLEANS WFKW Houston 4 14 32 43 93<br />
OVERSEAS NEW YORK WMCK Houston 28 30 19 0 77<br />
OVERSEAS OHIO WJBG Oakland 15 15 0 1 31<br />
P & O NEDLLOYD BUENOS AIRES PGEC Houston 14 22 15 20 71<br />
Continued on Page 82<br />
August 1999 81
Continued from Page 81<br />
82 Mariners Weather Log<br />
VOS Cooperative <strong>Ship</strong> Reports<br />
SHIP NAME CALL PORT JAN FEB MAR APR TOTAL<br />
P & O NEDLLOYD VERA CRUZ PGFE Houston 20 5 17 8 50<br />
P&O NEDLLOYD CHILE DVRA New York City 13 7 3 0 23<br />
P&O NEDLLOYD HOUSTON PGEB Houston 0 0 31 49 80<br />
P&O NEDLLOYD LOS ANGELES PGDW Long Beach 49 55 64 38 206<br />
P&O NEDLLOYD TEXAS ZCBF6 Houston 54 57 71 72 254<br />
PACDREAM ELQO6 Seattle 0 15 27 3 45<br />
PACDUKE A8SL Seattle 14 3 0 0 17<br />
PACIFIC ARIES ELJQ2 Seattle 0 44 0 0 44<br />
PACIFIC HIRO 3FOY5 Seattle 39 0 0 0 39<br />
PACIFIC PRINCESS GBCF New York City 1 16 8 1 26<br />
PACIFIC SELESA DVCK Seattle 16 27 53 1 97<br />
PACIFIC SENATOR ELTY6 Long Beach 53 2 2 62 119<br />
PACKING ELBX3 Seattle 5 8 14 0 27<br />
PACOCEAN ELJE3 Seattle 10 34 48 10 102<br />
PACPRINCE ELED7 Seattle 11 8 1 15 35<br />
PACPRINCESS ELED8 Houston 6 14 0 0 20<br />
PACROSE YJQK2 Seattle 0 7 2 0 9<br />
PAUL BUCK KDGR Houston 13 8 0 0 21<br />
PAUL R. TREGURTHA WYR4481 Cleveland 0 0 10 28 38<br />
PEGASUS HIGHWAY 3FMA4 New York City 16 0 17 7 40<br />
PEGGY DOW PJOY Long Beach 51 36 54 28 169<br />
PHILIP R. CLARKE WE3592 Chicago 0 0 11 79 90<br />
PIERRE FORTIN CG2678 Norfolk 0 0 0 8 8<br />
PINO GLORIA 3EZW7 Seattle 6 0 0 12 18<br />
PISCES EXPLORER MWQD5 Long Beach 13 26 6 59 104<br />
POLYNESIA D5NZ Long Beach 55 66 92 95 308<br />
POTOMAC TRADER WXBZ Houston 27 23 17 30 97<br />
PRESIDENT ADAMS WRYW Oakland 54 60 61 58 233<br />
PRESIDENT GRANT WCY2098 Long Beach 24 43 30 15 112<br />
PRESIDENT HOOVER WCY2883 Houston 21 42 34 35 132<br />
PRESIDENT JACKSON WRYC Oakland 49 34 48 14 145<br />
PRESIDENT KENNEDY WRYE Oakland 38 32 25 29 124<br />
PRESIDENT POLK WRYD Oakland 0 0 2 67 69<br />
PRESIDENT TRUMAN WNDP Oakland 60 62 55 40 217<br />
PRESIDENT WILSON WCY3438 Long Beach 21 5 17 13 56<br />
PRESQUE ISLE WZE4928 Chicago 3 0 0 68 71<br />
PRINCE OF OCEAN 3ECO9 Seattle 0 0 0 24 24<br />
PRINCE WILLIAM SOUND WSDX Long Beach 1 2 1 0 4<br />
PRINCESS OF SCANDINAVIA OWEN2 Miami 90 81 129 110 410<br />
PROJECT ARABIA PJKP Miami 25 46 20 54 145<br />
PROJECT ORIENT PJAG Baltimore 52 38 46 32 168<br />
PUDONG SENATOR DQVI Seattle 25 61 65 68 219<br />
PUSAN SENATOR DQVG Seattle 22 11 7 16 56<br />
QUEEN ELIZABETH 2 GBTT New York City 64 11 43 47 165<br />
QUEEN OF SCANDINAVIA OUSE6 Miami 38 32 36 45 151<br />
QUEENSLAND STAR C6JZ3 Houston 67 56 53 61 237<br />
R.J. PFEIFFER WRJP Long Beach 18 24 22 11 75<br />
RAINBOW BRIDGE 3EYX9 Long Beach 50 98 79 70 297<br />
RAYMOND E. GALVIN ELCO5 Oakland 1 0 0 0 1<br />
REGINA MAERSK OZIN2 New York City 5 16 3 20 44<br />
REPULSE BAY MQYA3 Houston 9 3 0 3 15<br />
RESOLUTE KFDZ Norfolk 25 15 0 24 64<br />
RHAPSODY OF THE SEAS LAZK4 Miami 14 7 4 0 25<br />
RICHARD G MATTHIESEN WLBV Jacksonville 0 0 0 2 2<br />
RICHARD REISS WBF2376 Cleveland 0 0 0 32 32<br />
RIO APURE ELUG7 Miami 35 52 55 62 204<br />
ROBERT E. LEE KCRD New Orleans 20 0 7 13 40<br />
ROGER BLOUGH WZP8164 Chicago 0 0 2 36 38<br />
ROGER REVELLE KAOU New Orleans 31 24 0 5 60<br />
ROSINA TOPIC ELAJ6 Seattle 0 35 45 0 80<br />
ROYAL ETERNITY DUXW Norfolk 30 9 48 28 115<br />
ROYAL PRINCESS GBRP Long Beach 32 34 52 49 167<br />
RUBIN BONANZA 3FNV5 Seattle 0 54 49 4 107<br />
RUBIN KOBE DYZM Seattle 11 14 44 31 100<br />
RUBIN PEARL YJQA8 Seattle 51 46 57 73 227<br />
RUBIN STELLA 3FAP5 Seattle 0 0 1 53 54<br />
RYNDAM PHFV Miami 0 21 44 19 84<br />
SAM HOUSTON KDGA Houston 0 22 0 28 50<br />
SAMUEL GINN C6OB Oakland 42 34 33 0 109<br />
SAMUEL H. ARMACOST C6FA2 Oakland 0 7 15 7 29<br />
SAMUEL RISLEY CG2960 Norfolk 192 156 140 150 638<br />
SAN ISIDRO ELVG8 Norfolk 24 18 27 9 78<br />
SAN MARCOS ELND4 Jacksonville 0 26 29 1 56<br />
Continued on Page 83
Continued from Page 82<br />
VOS Cooperative <strong>Ship</strong> Reports<br />
SHIP NAME CALL PORT JAN FEB MAR APR TOTAL<br />
SAN PEDRO DHHO Norfolk 63 28 6 40 137<br />
SANKO LAUREL 3EXQ3 Seattle 0 4 0 0 4<br />
SANTA CHRISTINA 3FAE6 Seattle 10 10 1 7 28<br />
SANTORIN 2 P3ZL4 Seattle 52 46 55 0 153<br />
SARAMATI 9VIW Baltimore 0 37 0 0 37<br />
SC HORIZON ELOC8 New York City 15 0 32 5 52<br />
SCHACKENBORG OYUY4 Houston 0 0 0 37 37<br />
SEA FOX KBGK Jacksonville 53 7 0 0 60<br />
SEA INITIATIVE DEBB Houston 58 51 22 46 177<br />
SEA LION KJLV Jacksonville 33 17 30 3 83<br />
SEA LYNX DGOO Jacksonville 40 57 75 62 234<br />
SEA MARINER J8FF9 Miami 67 7 1 23 98<br />
SEA PRINCESS KRCP New Orleans 0 29 0 0 29<br />
SEA RACER ELQI8 Jacksonville 39 35 66 53 193<br />
SEA WISDOM 3FUO6 Seattle 23 49 63 44 179<br />
SEA-LAND CHARGER V7AY2 Long Beach 34 43 29 37 143<br />
SEA-LAND EAGLE V7AZ8 Long Beach 10 21 34 28 93<br />
SEA/LAND VICTORY DIDY New York City 0 0 0 26 26<br />
SEABOARD FLORIDA 3FBW5 Miami 13 12 23 25 73<br />
SEABOARD UNIVERSE ELRU3 Miami 15 16 18 2 51<br />
SEABOURN PRIDE LALT2 Miami 6 3 0 0 9<br />
SEABREEZE I 3FGV2 Miami 0 0 1 1 2<br />
SEALAND ANCHORAGE KGTX Seattle 48 59 59 64 230<br />
SEALAND ARGENTINA DGVN Jacksonville 37 30 6 8 81<br />
SEALAND ATLANTIC KRLZ Norfolk 52 28 29 24 133<br />
SEALAND CHALLENGER WZJC Newark 57 16 0 19 92<br />
SEALAND CHAMPION V7AM9 Oakland 37 17 24 67 145<br />
SEALAND COMET V7AP3 Oakland 2 22 48 14 86<br />
SEALAND CONSUMER WCHF Houston 28 25 42 50 145<br />
SEALAND CRUSADER WZJF Jacksonville 33 22 31 50 136<br />
SEALAND DEFENDER KGJB Oakland 0 0 28 33 61<br />
SEALAND DEVELOPER KHRH Long Beach 0 0 0 3 3<br />
SEALAND DISCOVERY WZJD Jacksonville 0 37 45 38 120<br />
SEALAND ENDURANCE KGJX Long Beach 5 33 31 20 89<br />
SEALAND ENTERPRISE KRGB Oakland 71 69 57 72 269<br />
SEALAND EXPEDITION WPGJ Jacksonville 41 42 49 61 193<br />
SEALAND EXPLORER WGJF Long Beach 17 43 0 25 85<br />
SEALAND FREEDOM V7AM3 Houston 42 13 31 26 112<br />
SEALAND HAWAII KIRF Seattle 34 7 48 45 134<br />
SEALAND INDEPENDENCE WGJC Long Beach 38 38 23 44 143<br />
SEALAND INNOVATOR WGKF Oakland 27 14 17 18 76<br />
SEALAND INTEGRITY WPVD Norfolk 103 12 24 79 218<br />
SEALAND INTREPID V7BA2 Norfolk 8 16 24 26 74<br />
SEALAND KODIAK KGTZ Seattle 44 32 47 21 144<br />
SEALAND LIBERATOR KHRP Oakland 51 6 56 17 130<br />
SEALAND MARINER V7AM5 Houston 24 31 24 21 100<br />
SEALAND MERCURY V7AP6 Oakland 6 30 14 10 60<br />
SEALAND METEOR V7AP7 Long Beach 37 7 1 8 53<br />
SEALAND NAVIGATOR WPGK Long Beach 57 54 66 30 207<br />
SEALAND PACIFIC WSRL Long Beach 45 47 51 66 209<br />
SEALAND PATRIOT KHRF Oakland 40 39 39 46 164<br />
SEALAND PERFORMANCE KRPD Houston 31 33 53 56 173<br />
SEALAND PRODUCER WJBJ Long Beach 18 55 66 51 190<br />
SEALAND QUALITY KRNJ Jacksonville 23 30 37 34 124<br />
SEALAND RACER V7AP8 Long Beach 9 0 0 0 9<br />
SEALAND RELIANCE WFLH Long Beach 76 62 52 41 231<br />
SEALAND SPIRIT WFLG Oakland 30 43 51 20 144<br />
SEALAND TACOMA KGTY Seattle 30 29 14 11 84<br />
SEALAND TRADER KIRH Oakland 59 38 54 63 214<br />
SEALAND VOYAGER KHRK Long Beach 32 47 72 47 198<br />
SEARIVER BATON ROUGE WAFA Oakland 4 8 13 9 34<br />
SEARIVER BENICIA KPKL Long Beach 2 0 0 0 2<br />
SEARIVER LONG BEACH WHCA Long Beach 8 8 1 0 17<br />
SEARIVER NORTH SLOPE KHLQ Oakland 11 14 18 11 54<br />
SENATOR V7AY7 Miami 0 1 24 0 25<br />
SENSATION 3ESE9 Miami 0 11 11 4 26<br />
SETO BRIDGE JMQY Oakland 34 53 63 60 210<br />
SEVEN OCEAN 3EZB8 Seattle 28 12 0 0 40<br />
SEWARD JOHNSON WST9756 Miami 0 57 34 39 130<br />
SHIRAOI MARU 3ECM7 Seattle 50 34 24 6 114<br />
SIDNEY STAR C6JY7 Houston 54 36 70 80 240<br />
SINCERE SUCCESS VRUC5 Seattle 0 1 0 0 1<br />
SINGA STAR 9VNF Seattle 0 0 43 39 82<br />
Continued on Page 84<br />
August 1999 83
Continued from Page 83<br />
84 Mariners Weather Log<br />
VOS Cooperative <strong>Ship</strong> Reports<br />
SHIP NAME CALL PORT JAN FEB MAR APR TOTAL<br />
SKAUBRYN LAJV4 Seattle 76 27 39 10 152<br />
SKAUGRAN LADB2 Seattle 7 0 8 6 21<br />
SKOGAFOSS V2QT Norfolk 0 0 0 2 2<br />
SKS TANA LAZI4 Norfolk 1 0 0 0 1<br />
SNOW CRYSTAL C6ID8 New York City 49 62 69 78 258<br />
SOKOLICA ELIG5 Baltimore 8 18 6 7 39<br />
SOL DO BRASIL ELQQ4 Baltimore 0 0 36 41 77<br />
SOLAR WING ELJS7 Jacksonville 77 27 82 86 272<br />
SONG OF AMERICA LENA3 Miami 12 11 3 0 26<br />
SONORA XCTJ Houston 29 9 35 32 105<br />
SOUTH FORTUNE 3FJC6 Seattle 16 0 41 41 98<br />
SOVEREIGN OF THE SEAS LAEB2 Miami 35 20 3 0 58<br />
ST BLAIZE J8FO Norfolk 52 22 49 20 143<br />
STAR ALABAMA LAVU4 Baltimore 25 22 31 23 101<br />
STAR AMERICA LAVV4 Jacksonville 6 0 0 9 15<br />
STAR DOVER LAEP4 Seattle 27 0 8 15 50<br />
STAR EVVIVA LAHE2 Jacksonville 3 14 1 2 20<br />
STAR FUJI LAVX4 Seattle 21 22 31 22 96<br />
STAR GEIRANGER LAKQ5 Norfolk 0 0 0 19 19<br />
STAR GRAN LADR4 Long Beach 5 16 17 25 63<br />
STAR HARDANGER LAXD4 Baltimore 0 4 0 0 4<br />
STAR HARMONIA LAGB5 Baltimore 8 57 39 26 130<br />
STAR HERDLA LAVD4 Baltimore 12 19 32 1 64<br />
STAR SKARVEN LAJY2 Miami 41 25 37 21 124<br />
STAR TRONDANGER LAQQ2 Baltimore 7 7 4 5 23<br />
STATENDAM PHSG Miami 1 7 8 27 43<br />
STELLAR KOHINOOR 3FFG8 Seattle 10 19 15 8 52<br />
STEPHAN J V2JN Miami 102 87 100 106 395<br />
STEWART J. CORT WYZ3931 Chicago 7 0 6 80 93<br />
STONEWALL JACKSON KDDW New Orleans 10 4 41 0 55<br />
STRONG CAJUN KALK Norfolk 10 23 31 15 79<br />
SUGAR ISLANDER KCKB Houston 11 5 22 0 38<br />
SUN DANCE 3ETQ8 Seattle 0 0 0 11 11<br />
SUNBELT DIXIE D5BU Baltimore 9 15 12 22 58<br />
SUNDA ELPB8 Houston 8 3 68 50 129<br />
SUSAN W. HANNAH WAH9146 Chicago 0 2 24 2 28<br />
SVEN OLTMANN V2JP Miami 13 24 19 24 80<br />
SWAN ARROW C6CN8 Baltimore 13 0 0 0 13<br />
TAI HE BOAB Long Beach 43 40 39 53 175<br />
TAIHO MARU 3FMP6 Seattle 72 80 49 38 239<br />
TAIKO LAQT4 New York City 1 4 0 0 5<br />
TAKASAGO LACR5 Jacksonville 7 5 0 0 12<br />
TAMPA LMWO3 Long Beach 1 0 0 0 1<br />
TAMPERE LAOP2 Norfolk 38 18 39 25 120<br />
TANABATA LAZO4 Baltimore 28 2 0 0 30<br />
TAPIOLA LAOQ2 Norfolk 32 0 0 0 32<br />
TAUSALA SAMOA V2KS Seattle 0 0 0 2 2<br />
TECO TRADER KSDF New Orleans 0 0 33 5 38<br />
TEQUI 3FDZ5 Seattle 22 23 33 12 90<br />
TEXAS LMWR3 Baltimore 0 0 30 3 33<br />
THORKIL MAERSK MSJX8 Miami 55 50 38 55 198<br />
THORNHILL YJZU9 New Orleans 4 6 0 0 10<br />
TMM MEXICO XCMG Houston 46 50 50 17 163<br />
TMM OAXACA ELUA5 Houston 34 44 32 60 170<br />
TOBIAS MAERSK MSJY8 Long Beach 28 31 17 0 76<br />
TOKIO EXPRESS 9VUY Long Beach 14 1 0 0 15<br />
TORM FREYA ELVY8 Norfolk 46 10 25 29 110<br />
TOWER BRIDGE ELJL3 Seattle 17 13 13 13 56<br />
TRADE APOLLO VRUN7 New York City 16 28 44 22 110<br />
TRADE COSMOS VRUQ2 Miami 5 0 0 0 5<br />
TRANSWORLD BRIDGE ELJJ5 Seattle 56 53 37 17 163<br />
TRENT ELSM2 New York City 1 0 0 0 1<br />
TRINITY WRGL Houston 13 2 0 0 15<br />
TRITON WTU2310 Chicago 0 0 39 55 94<br />
TROJAN STAR C6OD7 Baltimore 60 30 32 32 154<br />
TROPIC LURE J8PD Miami 0 2 1 0 3<br />
TROPIC SUN 3EZK9 New Orleans 14 15 17 21 67<br />
TROPIC TIDE 3FGQ3 Miami 54 51 47 54 206<br />
TROPICAL DAWN ELTK9 Baltimore 17 0 0 0 17<br />
TROPICALE ELBM9 New Orleans 1 4 2 1 8<br />
TUI PACIFIC P3GB4 Seattle 40 38 42 71 191<br />
TULSIDAS ATUJ Norfolk 5 1 3 3 12<br />
TURMOIL 9VGL New York City 0 0 0 9 9<br />
Continued on Page 85
Continued from Page 84<br />
VOS Cooperative <strong>Ship</strong> Reports<br />
SHIP NAME CALL PORT JAN FEB MAR APR TOTAL<br />
USCGC ACACIA (WLB406) NODY Chicago 20 1 1 0 22<br />
USCGC ACTIVE WMEC 618 NRTF Seattle 0 1 0 0 1<br />
USCGC ALERT (WMEC 630) NZVE Seattle 0 1 0 3 4<br />
USCGC BRAMBLE (WLB 392) NODK Cleveland 0 0 0 1 1<br />
USCGC DEPENDABLE NOWK Baltimore 3 0 0 0 3<br />
USCGC DURABLE (WMEC 628) NRUN Houston 3 1 1 11 16<br />
USCGC MACKINAW NRKP Chicago 4 1 14 14 33<br />
USCGC MELLON (WHEC 717) NMEL Seattle 20 34 16 0 70<br />
USCGC MIDGETT (WHEC 726) NHWR Seattle 3 0 0 0 3<br />
USCGC MOHAWK WMEC 913 NRUF Jacksonville 0 1 0 0 1<br />
USCGC MORGENTHAU NDWA Oakland 1 0 0 0 1<br />
USCGC PLANETREE NRPY Seattle 0 9 0 0 9<br />
USCGC POLAR SEA__(WAGB 1 NRUO Seattle 36 96 115 132 379<br />
USCGC POLAR STAR (WAGB 1 NBTM Seattle 1 0 0 0 1<br />
USCGC RELIANCE WMEC 615 NJPJ Miami 1 0 0 0 1<br />
USCGC STORIS (WMEC 38) NRUC Seattle 1 0 0 0 1<br />
USCGC SUNDEW (WLB 404) NODW Chicago 0 0 5 3 8<br />
USNS BELLATRIX NHLL Houston 0 4 13 0 17<br />
USNS BOWDITCH NWSW New Orleans 5 0 0 4 9<br />
USNS GUS W. DARNELL KCDK Houston 19 6 0 0 25<br />
USNS HENSON NENB New Orleans 7 0 3 29 39<br />
USNS SATURN T-AFS-10 NADH Norfolk 0 0 13 1 14<br />
USNS SIOUX NJOV Oakland 47 22 0 0 69<br />
USNS SUMNER NZAU New Orleans 0 1 1 0 2<br />
VALIANT WXCA New Orleans 0 0 1 26 27<br />
VEGA 9VJS Houston 27 23 41 18 109<br />
VICTORIA GBBA Miami 0 0 0 1 1<br />
VIRGINIA 3EBW4 Seattle 18 32 33 24 107<br />
VISION LAKS5 Seattle 31 16 0 0 47<br />
WAARDRECHT S6BR Seattle 50 17 31 37 135<br />
WECOMA WSD7079 Seattle 11 0 1 20 32<br />
WESTERN BRIDGE C6JQ9 Baltimore 92 37 75 51 255<br />
WESTWARD WZL8190 Miami 3 2 12 36 53<br />
WESTWARD VENTURE KHJB Seattle 35 0 8 47 90<br />
WESTWOOD ANETTE DVDM Seattle 44 56 46 72 218<br />
WESTWOOD BELINDA C6CE7 Seattle 33 41 40 41 155<br />
WESTWOOD BORG LAON4 Seattle 62 51 53 61 227<br />
WESTWOOD BREEZE LAOT4 Seattle 0 16 69 39 124<br />
WESTWOOD CLEO C6OQ8 Seattle 35 38 41 65 179<br />
WESTWOOD JAGO C6CW9 Seattle 37 47 48 51 183<br />
WESTWOOD MARIANNE C6QD3 Seattle 63 44 66 45 218<br />
WIELDRECHT S6BO Seattle 9 52 5 0 66<br />
WILFRED SYKES WC5932 Chicago 4 0 7 13 24<br />
WILLIAM E. CRAIN ELOR2 Oakland 0 0 12 4 16<br />
WILLIAM E. MUSSMAN D5OE Seattle 36 9 0 0 45<br />
WILSON WNPD New Orleans 7 4 22 40 73<br />
WOENSDRECHT S6BP Long Beach 9 18 23 26 76<br />
WORLD ISLAND 3FDH4 Long Beach 0 30 0 34 64<br />
WORLD SPIRIT ELWG7 Seattle 0 0 34 0 34<br />
YUCATAN XCUY Houston 35 25 24 44 128<br />
YURIY OSTROVSKIY UAGJ Seattle 87 33 36 48 204<br />
ZIM AMERICA 4XGR Newark 53 27 24 21 125<br />
ZIM ASIA 4XFB New Orleans 10 11 36 27 84<br />
ZIM ATLANTIC 4XFD New York City 35 37 17 48 137<br />
ZIM CANADA 4XGS Norfolk 26 29 43 44 142<br />
ZIM CHINA 4XFQ New York City 30 35 58 17 140<br />
ZIM EUROPA 4XFN New York City 30 76 61 28 195<br />
ZIM HONG KONG 4XGW Houston 0 0 25 17 42<br />
ZIM IBERIA 4XFP New York City 49 14 25 68 156<br />
ZIM ISRAEL 4XGX New Orleans 32 33 29 0 94<br />
ZIM ITALIA 4XGT New Orleans 56 14 13 1 84<br />
ZIM JAMAICA 4XFE New York City 68 27 20 27 142<br />
ZIM JAPAN 4XGV Baltimore 12 18 47 21 98<br />
ZIM KOREA 4XGU Miami 5 3 11 10 29<br />
ZIM MONTEVIDEO V2AG7 Norfolk 6 8 6 63 83<br />
ZIM PACIFIC 4XFC New York City 24 40 43 13 120<br />
ZIM SANTOS ELRJ6 Baltimore 54 22 33 35 144<br />
ZIM U.S.A. 4XFO New York City 26 31 25 15 97<br />
Totals Jan 22864<br />
Feb 21512<br />
Mar 25419<br />
Apr 24703<br />
Period Total 94498<br />
August 1999 85
Buoy Climatological Data Summary —<br />
January through April 1999<br />
86 Mariners Weather Log<br />
Buoy Climatological Data Summary<br />
Weather observations are taken each hour during a 20-minute averaging period, with a sample taken every<br />
0.67 seconds. The significant wave height is defined as the average height of the highest one-third of the<br />
waves during the average period each hour. The maximum significant wave height is the highest of those<br />
values for that month. At most stations, air temperature, water temperature, wind speed and direction are<br />
sampled once per second during an 8.0-minute averaging period each hour (moored buoys) and a 2.0-minute<br />
averaging period for fixed stations (C-MAN). Contact NDBC Data Systems Division, Bldg. 1100, SSC,<br />
Mississippi 39529 or phone (601) 688-1720 for more details.<br />
MEAN MEAN MEAN SIG MAX SIG MAX SIG SCALAR MEAN PREV MAX MAX MEAN<br />
BUOY LAT LONG OBS AIR TP SEA TP WAVE HT WAVE HT WAVE HT WIND SPEED WIND WIND WIND PRESS<br />
(C) (C) (M) (M) (DA/HR) (KNOTS) (DIR) (KTS) (DA/HR) (MB)<br />
January 1999<br />
41001 34.7N 072.6W 743 16.8 21.2 2.3 5.5 03/16 15.5 W 35.9 24/22 1021.7<br />
41002 32.3N 075.2W 741 18.9 22.6 2.0 5.0 24/20 13.1 SE 31.1 03/14 1022.0<br />
41004 32.5N 079.1W 742 16.5 20.6 1.5 5.2 03/05 12.9 SW 30.3 03/01 1021.2<br />
41008 31.4N 080.9W 742 13.6 1.0 3.0 31/12 9.2 NW 27.6 04/07 1021.7<br />
41009 28.5N 080.2W 1485 21.0 23.4 1.5 4.5 31/23 12.5 SE 40.6 03/07 1021.3<br />
41010 28.9N 078.6W 1483 21.4 24.2 1.8 4.4 31/19 12.8 SE 31.3 03/09 1021.6<br />
42001 25.9N 089.6W 741 1.4 3.9 02/22 12.9 SE 34.6 02/20 1019.0<br />
42003 25.9N 085.9W 742 21.9 25.0 1.6 3.9 03/05 14.7 E 35.0 03/00 1019.0<br />
42007 30.1N 088.8W 743 14.1 16.1 0.7 2.7 23/04 10.1 SE 28.8 23/03 1020.5<br />
42020 26.9N 096.7W 744 19.3 21.6 14.6 SE 31.9 23/01 1017.2<br />
42035 29.2N 094.4W 744 14.8 15.7 1.0 2.6 22/10 11.2 SE 30.9 02/17 1019.2<br />
42036 28.5N 084.5W 743 18.0 20.7 1.1 2.6 10/08 12.7 E 28.6 03/00 1020.4<br />
42039 28.8N 086.0W 743 18.5 21.5 1.3 3.6 23/07 13.8 SE 31.3 31/07 1021.1<br />
42040 29.2N 088.2W 740 17.9 21.5 1.3 4.1 23/05 12.3 SE 26.8 23/02 1020.1<br />
44004 38.5N 070.7W 743 10.4 15.2 2.5 6.9 03/22 16.2 W 31.5 03/18 1021.7<br />
44005 42.9N 068.9W 733 0.8 5.3 2.2 5.8 04/01 17.6 W 35.2 03/22 1019.8<br />
44007 43.5N 070.1W 742 -2.1 1.3 5.4 15/21 14.4 SW 32.8 19/03 1020.3<br />
44008 40.5N 069.4W 700 4.9 7.3 2.4 5.9 04/00 16.4 W 32.8 03/22 1020.0<br />
44009 38.5N 074.7W 743 5.3 7.6 1.5 4.7 03/16 14.4 S 30.9 10/00 1021.4<br />
44011 41.1N 066.6W 743 4.2 6.0 2.6 6.1 04/06 16.3 W 36.1 04/02 1021.0<br />
44013 42.4N 070.7W 740 0.3 4.0 1.1 4.0 03/21 14.6 W 35.8 03/20 1019.5<br />
44014 36.6N 074.8W 739 9.1 10.6 1.6 5.5 03/15 12.9 SW 26.8 03/14 1021.1<br />
44025 40.3N 073.2W 98 1.1 6.6 1.1 2.3 31/06 13.0 N 26.2 31/03 1028.5<br />
46001 56.3N 148.2W 740 2.0 4.3 3.6 7.7 12/22 1001.7<br />
46005 46.1N 131.0W 743 8.1 9.0 3.7 8.9 16/12 16.0 SW 39.6 25/23 1014.8<br />
46006 40.8N 137.5W 665 11.1 12.0 3.7 10.6 17/23 17.5 W 39.4 17/22 1019.6<br />
46011 34.9N 120.9W 743 12.3 13.2 2.6 6.7 27/02 9.9 NW 27.2 31/05 1019.7<br />
46012 37.4N 122.7W 738 10.7 10.9 2.5 5.8 26/17 1019.9<br />
46013 38.2N 123.3W 740 10.1 10.8 2.6 6.5 26/17 10.9 NW 28.0 31/17 1020.7<br />
46014 39.2N 124.0W 744 10.0 2.9 7.0 26/16 10.8 SE 28.8 31/14 1020.5<br />
46022 40.7N 124.5W 743 9.9 10.4 3.1 7.9 27/02 13.4 N 36.7 22/18 1019.7<br />
46023 34.7N 121.0W 740 12.1 13.0 2.5 6.3 27/17 12.4 NW 28.2 12/23 1020.3<br />
46025 33.8N 119.1W 741 13.8 14.3 1.3 2.5 20/02 7.1 W 25.3 21/16 1019.5<br />
46026 37.8N 122.8W 456 10.2 10.1 1.9 5.6 19/00 9.5 NW 20.6 09/06 1021.6<br />
46027 41.8N 124.4W 582 9.6 9.8 3.4 7.1 26/21 13.9 S 33.2 17/23 1017.8<br />
46028 35.7N 121.9W 743 11.4 11.8 2.8 7.7 27/01 11.4 NW 27.4 01/00 1019.7<br />
46029 46.1N 124.5W 679 8.4 9.3 3.4 9.2 29/14 14.8 S 38.3 29/17 1014.5<br />
46030 40.4N 124.5W 732 9.9 10.3 1.8 3.0 01/01 15.3 N 35.4 22/18 1019.9<br />
Continued on Page 87
Continued from Page 86<br />
Buoy Climatological Data Summary<br />
MEAN MEAN MEAN SIG MAX SIG MAX SIG SCALAR MEAN PREV MAX MAX MEAN<br />
BUOY LAT LONG OBS AIR TP SEA TP WAVE HT WAVE HT WAVE HT WIND SPEED WIND WIND WIND PRESS<br />
(C) (C) (M) (M) (DA/HR) (KNOTS) (DIR) (KTS) (DA/HR) (MB)<br />
46035 56.9N 177.8W 727 -1.0 2.4 3.7 9.9 31/17 1003.2<br />
46042 36.7N 122.4W 743 11.1 11.7 2.8 7.7 26/21 11.3 NW 26.4 30/18 1020.3<br />
46045 33.8N 118.5W 742 13.4 14.0 1.0 2.1 19/23 4.6 E 16.5 26/16 1018.8<br />
46050 44.6N 124.5W 743 8.8 9.6 3.3 9.0 29/18 13.8 S 40.6 29/17 1017.8<br />
46053 34.2N 119.8W 738 13.2 13.7 1.5 3.0 27/04 8.0 W 25.5 16/17 1019.2<br />
46054 34.3N 120.4W 735 12.6 12.9 2.4 6.1 19/07 13.2 NW 29.7 01/02 1018.9<br />
46059 38.0N 130.0W 742 13.3 3.4 9.6 26/14 14.4 NW 35.6 26/08<br />
46060 60.6N 146.8W 1457 0.4 5.4 12.0 NW 34.2 13/09 1002.8<br />
46061 60.2N 146.8W 1482 0.8 5.5 1.9 7.1 13/20 16.6 N 36.9 13/12 1002.0<br />
46062 35.1N 121.0W 734 12.1 12.7 2.6 6.8 27/01 10.9 NW 29.7 31/08 1019.3<br />
46063 34.2N 120.7W 741 12.4 12.9 2.7 7.0 27/03 12.6 NW 26.8 01/03 1018.8<br />
51001 23.4N 162.3W 733 22.7 23.6 3.2 8.4 01/02 12.6 E 29.9 22/07 1018.0<br />
51002 17.2N 157.8W 741 24.2 25.2 2.7 4.7 01/16 14.7 NE 25.3 23/13 1015.8<br />
51003 19.2N 160.7W 742 24.1 25.2 2.6 6.1 01/09 12.0 NE 23.8 25/16 1016.3<br />
51004 17.4N 152.5W 741 23.8 24.6 2.7 5.0 26/09 14.0 E 26.2 25/05 1016.5<br />
51028 00.0N 153.9W 725 23.9 23.7 2.1 3.3 03/22 13.0 NE 19.8 20/04 1010.1<br />
ABAN6 44.3N 075.9W 744 -7.1 0.9 6.3 SW 21.9 28/09 1020.8<br />
ALSN6 40.4N 073.8W 708 1.8 1.1 4.4 03/15 18.1 W 44.6 03/14 1021.3<br />
BLIA2 60.8N 146.9W 1459 -1.3 19.7 N 46.0 29/13 1004.0<br />
BURL1 28.9N 089.4W 743 14.9 14.6 SE 42.1 02/15 1019.8<br />
BUZM3 41.4N 071.0W 744 1.3 18.6 W 50.0 03/20 1021.9<br />
CARO3 43.3N 124.4W 741 8.4 13.3 S 44.6 20/20 1019.4<br />
CDRF1 29.1N 083.0W 742 10.1 6.7 NE 21.6 31/23 1021.6<br />
CHLV2 36.9N 075.7W 741 7.7 8.4 1.0 3.8 03/12 14.4 S 31.9 15/13 1022.0<br />
CLKN7 34.6N 076.5W 740 11.1 11.4 SW 36.7 03/12 1024.2<br />
CSBF1 29.7N 085.4W 737 14.0 6.5 E 25.0 02/22 1021.0<br />
DBLN6 42.5N 079.3W 744 -3.0 15.4 SW 40.8 01/10 1019.4<br />
DESW1 47.7N 124.5W 742 6.9 15.3 SE 55.2 29/13 1015.1<br />
DISW3 47.1N 090.7W 742 -8.2 15.9 SW 39.0 27/17 1018.2<br />
DPIA1 30.2N 088.1W 743 13.6 11.2 SE 32.2 02/17 1021.1<br />
DRYF1 24.6N 082.9W 744 21.6 22.5 11.9 NE 27.0 10/05 1019.0<br />
DSLN7 35.2N 075.3W 743 13.3 1.4 5.1 24/17 18.8 W 51.1 03/15 1024.9<br />
DUCN7 36.2N 075.8W 463 11.4 0.6 1.3 15/08 11.5 S 29.3 24/12 1023.7<br />
FBIS1 32.7N 079.9W 740 11.5 8.3 SW 33.0 31/22 1022.6<br />
FFIA2 57.3N 133.6W 742 1.2 16.9 SE 39.4 22/11 1007.5<br />
FPSN7 33.5N 077.6W 743 16.6 1.6 6.1 03/07 15.6 SW 44.0 03/04 1020.8<br />
FWYF1 25.6N 080.1W 741 22.2 24.1 16.7 E 31.3 24/07 1021.8<br />
GDIL1 29.3N 089.9W 743 15.0 15.4 9.7 SE 29.4 09/16 1019.9<br />
GLLN6 43.9N 076.4W 740 -4.7 18.0 NE 40.3 04/14 1020.0<br />
IOSN3 43.0N 070.6W 741 -1.6 1019.8<br />
KTNF1 29.8N 083.6W 744 13.1 7.4 E 24.7 02/17 1021.3<br />
LKWF1 26.6N 080.0W 742 21.4 23.6 12.2 SE 27.9 03/06 1021.1<br />
LONF1 24.8N 080.9W 740 21.3 21.1 11.7 E 24.5 05/00 1020.0<br />
LPOI1 48.1N 116.5W 490 3.2 4.3 7.5 S 29.6 14/21 1018.9<br />
MDRM1 44.0N 068.1W 742 -1.6 20.5 W 49.9 04/02 1019.2<br />
MISM1 43.8N 068.8W 742 -1.5 20.3 W 47.7 03/23 1019.1<br />
MLRF1 25.0N 080.4W 742 22.3 24.4 15.4 SE 27.6 11/23 1020.2<br />
MRKA2 61.1N 146.7W 1476 -4.1 13.1 NE 37.7 29/04 1005.2<br />
NWPO3 44.6N 124.1W 743 7.7 12.2 S 40.7 29/22 1018.6<br />
PILM4 48.2N 088.4W 744 -9.7 16.5 NW 35.3 26/06 1019.0<br />
POTA2 61.1N 146.7W 1483 -3.9 24.3 NE 46.9 30/19 1003.7<br />
PTAC1 39.0N 123.7W 739 9.7 9.3 N 29.4 30/22 1020.0<br />
PTAT2 27.8N 097.1W 739 15.2 15.4 11.2 SE 31.4 02/14 1017.9<br />
PTGC1 34.6N 120.6W 740 12.4 11.7 N 32.2 01/03 1020.0<br />
ROAM4 47.9N 089.3W 717 -9.7 19.4 N 41.0 04/01 1017.9<br />
SANF1 24.4N 081.9W 743 22.2 23.6 16.0 NE 31.1 04/18 1019.7<br />
SAUF1 29.8N 081.3W 741 15.7 17.2 8.3 NW 28.3 31/14 1022.3<br />
SBIO1 41.6N 082.8W 742 -4.0 15.3 SW 37.9 04/06 1018.8<br />
SGNW3 43.8N 087.7W 742 -6.7 0.0 13.3 W 41.3 02/15 1017.8<br />
SISW1 48.3N 122.8W 743 6.4 13.2 SE 41.9 29/15 1016.1<br />
SMKF1 24.6N 081.1W 741 22.3 24.4 16.2 E 27.6 04/18 1020.2<br />
SPGF1 26.7N 079.0W 742 21.6 10.5 E 22.6 11/20 1020.8<br />
SRST2 29.7N 094.0W 740 13.6 10.5 SE 25.7 02/17 1020.4<br />
STDM4 47.2N 087.2W 741 -6.7 18.2 NW 41.4 19/04 1016.3<br />
SUPN6 44.5N 075.8W 743 -7.3 1.0 11.4 SW 31.0 19/16 1019.4<br />
THIN6 44.3N 076.0W 740 -6.8<br />
TPLM2 38.9N 076.4W 744 3.1 3.1 10.9 S 34.1 03/11 1022.7<br />
TTIW1 48.4N 124.7W 744 6.4 15.1 E 58.7 29/08 1015.3<br />
VENF1 27.1N 082.4W 743 17.3 18.4 7.8 E 24.9 03/05 1022.1<br />
February 1999<br />
41001 34.7N 072.6W 667 15.1 20.0 2.9 6.7 22/22 16.9 NW 35.8 05/02 1017.0<br />
41002 32.3N 075.2W 672 17.3 21.5 2.4 4.8 28/22 14.7 NW 35.9 28/23 1018.5<br />
41004 32.5N 079.1W 665 15.2 19.7 1.4 4.2 02/05 13.3 SW 30.7 28/17 1018.5<br />
41008 31.4N 080.9W 671 14.2 16.2 1.0 2.9 01/01 9.9 S 27.6 13/04 1019.3<br />
41009 28.5N 080.2W 1343 20.0 22.8 1.4 4.9 01/02 12.4 SW 28.8 01/02 1019.6<br />
41010 28.9N 078.6W 1342 20.5 23.7 1.9 4.9 01/03 13.6 S 29.7 28/22 1019.5<br />
42001 25.9N 089.6W 656 21.1 0.9 4.2 12/22 9.9 E 29.9 12/20 1019.4<br />
42003 25.9N 085.9W 671 22.1 26.2 1.0 3.3 13/14 10.4 E 31.5 13/06 1019.0<br />
42007 30.1N 088.8W 672 15.7 17.4 0.5 1.7 12/12 10.5 SE 30.9 12/12 1020.3<br />
42019 27.9N 095.4W 603 18.9 19.8 1.2 3.9 12/09 10.7 SE 34.2 21/04 1018.5<br />
Continued on Page 88<br />
August 1999 87
Continued from Page 87<br />
88 Mariners Weather Log<br />
Buoy Climatological Data Summary<br />
MEAN MEAN MEAN SIG MAX SIG MAX SIG SCALAR MEAN PREV MAX MAX MEAN<br />
BUOY LAT LONG OBS AIR TP SEA TP WAVE HT WAVE HT WAVE HT WIND SPEED WIND WIND WIND PRESS<br />
(C) (C) (M) (M) (DA/HR) (KNOTS) (DIR) (KTS) (DA/HR) (MB)<br />
42020 26.9N 096.7W 671 20.1 20.9 12.0 SE 36.5 12/04 1017.9<br />
42035 29.2N 094.4W 671 17.0 17.7 0.8 2.1 12/07 10.3 SE 29.9 12/06 1020.0<br />
42036 28.5N 084.5W 671 18.2 20.7 0.9 3.5 13/07 10.2 E 28.2 18/03 1019.6<br />
42039 28.8N 086.0W 670 18.5 21.7 1.0 3.0 13/12 10.6 S 26.8 13/07 1020.6<br />
42040 29.2N 088.2W 672 18.0 21.6 0.9 2.9 12/16 10.6 N 29.0 12/13 1019.6<br />
44004 38.5N 070.7W 672 8.8 13.8 2.7 6.5 05/13 16.6 NW 40.6 05/07 1016.6<br />
44005 42.9N 068.9W 670 1.7 4.5 2.1 7.6 26/03 16.7 NW 37.3 25/23 1015.3<br />
44007 43.5N 070.1W 672 0.3 1.2 5.1 26/07 12.9 N 30.5 03/03 1016.5<br />
44008 40.5N 069.4W 664 4.1 6.0 2.5 8.0 25/15 16.7 N 37.9 25/12 1015.0<br />
44009 38.5N 074.7W 670 4.8 6.5 1.5 3.4 25/01 14.0 NW 28.8 05/11 1018.0<br />
44011 41.1N 066.6W 670 4.6 6.5 2.8 9.2 25/17 17.7 NW 43.3 05/11 1013.9<br />
44013 42.4N 070.7W 672 1.5 2.9 1.3 4.8 25/21 12.9 NW 31.1 25/18 1015.5<br />
44014 36.6N 074.8W 669 8.0 9.5 1.8 3.9 25/05 12.7 NW 27.6 05/11 1017.3<br />
44025 40.3N 073.2W 672 3.4 5.9 1.3 3.2 25/17 13.7 NW 29.7 05/09 1017.0<br />
46001 56.3N 148.2W 669 -.1 3.2 3.8 7.9 07/20 991.7<br />
46005 46.1N 131.0W 672 7.4 8.0 5.4 13.0 16/08 22.2 SW 40.0 11/18 1004.0<br />
46006 40.8N 137.5W 504 10.0 10.5 5.5 12.8 16/00 23.9 SW 40.2 11/07 1009.4<br />
46011 34.9N 120.9W 671 11.6 12.2 3.0 7.1 17/08 11.7 NW 27.0 09/19 1021.6<br />
46012 37.4N 122.7W 670 10.4 10.9 3.2 5.6 07/04 1021.7<br />
46013 38.2N 123.3W 672 9.9 10.4 3.4 6.7 16/22 11.6 NW 29.5 09/14 1022.1<br />
46014 39.2N 124.0W 672 9.5 3.7 6.7 06/20 12.4 SE 30.9 09/13 1021.5<br />
46022 40.7N 124.5W 671 9.4 9.8 4.2 8.0 16/22 15.5 SE 41.8 06/14 1019.0<br />
46023 34.7N 121.0W 672 11.4 12.1 3.1 5.7 26/09 14.3 NW 29.9 10/03 1022.1<br />
46025 33.8N 119.1W 672 13.1 13.5 1.6 2.9 10/09 8.4 NW 33.0 10/03 1020.7<br />
46027 41.8N 124.4W 671 9.0 9.5 4.2 9.0 16/18 15.8 SE 38.5 06/12 1017.7<br />
46028 35.7N 121.9W 670 10.8 11.4 3.3 5.7 26/05 12.1 NW 25.8 09/17 1021.9<br />
46029 46.1N 124.5W 672 8.1 8.9 4.9 9.8 16/17 20.3 S 42.6 05/21 1009.4<br />
46030 40.4N 124.5W 650 9.4 10.1 16.6 SE 41.8 06/12 1019.7<br />
46035 56.9N 177.8W 660 -1.1 1.5 3.5 9.1 01/00 994.3<br />
46042 36.7N 122.4W 671 10.6 11.4 3.4 6.3 17/04 11.3 NW 26.2 09/15 1022.3<br />
46045 33.8N 118.5W 672 12.7 13.5 0.4 3.2 10/04 3.9 W 18.5 10/19 1019.9<br />
46050 44.6N 124.5W 671 8.8 9.3 5.0 10.1 06/00 20.6 S 42.2 05/22 1012.9<br />
46053 34.2N 119.8W 669 12.5 12.9 1.8 2.9 22/02 10.0 W 29.1 10/02 1020.4<br />
46054 34.3N 120.4W 666 11.7 11.8 2.9 7.1 17/09 15.5 NW 33.2 22/21 1020.4<br />
46059 38.0N 130.0W 672 12.3 4.6 9.9 16/15 17.2 W 31.3 12/07<br />
46060 60.6N 146.8W 1208 -.6 4.7 1.0 3.0 15/18 12.4 N 32.1 15/05 993.5<br />
46061 60.2N 146.8W 1342 -.9 4.2 2.0 7.0 15/22 16.2 NW 39.6 15/16 992.3<br />
46062 35.1N 121.0W 657 11.4 11.9 3.0 6.3 26/04 12.2 NW 28.6 10/01 1021.3<br />
46063 34.2N 120.7W 672 11.7 11.9 3.0 5.7 17/06 14.5 NW 27.8 10/04 1020.4<br />
51001 23.4N 162.3W 671 22.6 23.7 2.9 6.6 27/03 13.7 E 26.9 03/17 1020.9<br />
51002 17.2N 157.8W 672 23.7 24.5 3.1 5.6 04/19 18.0 NE 27.1 03/23 1017.9<br />
51003 19.2N 160.7W 672 23.8 24.7 2.8 6.4 27/08 13.5 E 24.5 13/04 1018.6<br />
51004 17.4N 152.5W 672 23.4 24.1 3.3 5.6 28/00 16.9 E 26.9 04/08 1018.5<br />
51028 00.0N 153.9W 655 24.1 23.9 2.1 3.1 15/20 11.5 E 20.2 09/21 1010.9<br />
ABAN6 44.3N 075.9W 672 -2.9 5.4 N 16.0 28/14 1019.1<br />
ALSN6 40.4N 073.8W 651 2.7<br />
March 1999<br />
41001 34.7N 072.6W 741 14.9 19.0 2.9 6.5 15/12 17.3 NW 37.9 15/11 1015.3<br />
41002 32.3N 075.2W 742 17.6 22.3 2.3 6.1 01/08 15.3 NW 40.8 15/05 1016.7<br />
41004 32.5N 079.1W 728 15.3 19.1 1.3 4.1 14/23 14.5 W 31.9 03/20 1016.7<br />
41008 31.4N 080.9W 736 14.6 0.9 3.0 14/20 11.2 NE 27.2 14/18 1017.4<br />
41009 28.5N 080.2W 1484 20.1 22.4 1.2 3.4 14/20 11.8 N 27.2 14/19 1017.9<br />
41010 28.9N 078.6W 1485 20.5 23.7 1.6 4.1 15/03 12.0 NW 29.0 14/22 1018.1<br />
42001 25.9N 089.6W 743 21.7 1.3 4.0 14/19 12.7 SE 32.6 15/08 1016.4<br />
42002 25.9N 093.6W 701 21.5 23.1 1.6 4.7 14/01 15.5 SE 34.4 28/18 1015.8<br />
42003 25.9N 085.9W 743 22.0 25.2 1.2 4.2 15/12 12.5 E 30.9 14/08 1016.6<br />
42007 30.1N 088.8W 744 16.5 17.9 0.8 2.7 08/14 12.3 SE 27.6 08/13 1017.6<br />
42019 27.9N 095.4W 742 19.3 19.9 1.5 3.5 14/06 12.0 SE 29.0 03/10 1014.9<br />
42020 26.9N 096.7W 742 20.2 20.7 12.8 E 30.1 13/13 1014.3<br />
42035 29.2N 094.4W 741 17.7 18.5 1.0 2.2 07/16 11.9 SE 28.4 13/18 1016.7<br />
42036 28.5N 084.5W 737 18.2 19.8 1.0 4.3 15/05 11.3 E 28.6 03/23 1017.3<br />
42039 28.8N 086.0W 742 18.8 21.0 1.2 4.7 14/23 12.4 SE 31.5 09/07 1018.1<br />
42040 29.2N 088.2W 454 18.6 19.8 1.3 3.7 08/22 12.6 SE 30.3 03/12 1017.1<br />
44004 38.5N 070.7W 741 9.2 12.4 2.8 7.6 15/17 17.7 NW 33.2 22/10 1014.1<br />
44005 42.9N 068.9W 741 2.8 3.8 2.3 5.5 07/23 17.5 NW 37.3 16/00 1010.9<br />
44007 43.5N 070.1W 739 2.2 1.3 5.6 22/16 14.4 NW 35.8 22/13 1011.6<br />
44008 40.5N 069.4W 739 4.7 5.2 2.5 7.3 04/21 16.7 NW 33.6 16/12 1012.0<br />
44009 38.5N 074.7W 739 5.0 5.6 1.6 5.6 28/07 16.1 NW 35.0 07/10 1015.1<br />
44011 41.1N 066.6W 734 5.0 5.0 2.9 7.6 16/16 15.8 NW 36.5 16/12 1011.2<br />
44013 42.4N 070.7W 734 3.0 2.7 1.3 4.2 07/11 14.6 NW 32.6 07/07 1010.9<br />
44014 36.6N 074.8W 742 7.9 9.4 1.8 4.7 27/15 1015.0<br />
44025 40.3N 073.2W 738 4.3 5.2 1.5 5.3 04/12 16.5 W 33.6 04/10 1013.3<br />
45002 45.3N 086.4W 350 2.5 2.9 1.0 2.7 21/17 15.1 S 31.3 21/16 1018.0<br />
45006 47.3N 089.9W 33 4.4 1.3 0.6 1.1 31/00 10.7 E 19.4 30/23 1006.9<br />
45007 42.7N 087.0W 506 2.7 3.4 0.8 2.5 22/05 12.1 N 27.2 18/01 1020.8<br />
46001 56.3N 148.2W 738 1.3 3.1 3.1 7.5 19/04 998.2<br />
46005 46.1N 131.0W 740 6.4 7.6 4.4 10.0 17/12 1009.5<br />
46006 40.8N 137.5W 379 8.5 10.2 4.1 9.1 29/00 18.1 W 34.6 02/17 1016.6<br />
46011 34.9N 120.9W 744 10.8 11.4 3.1 6.6 30/13 13.4 NW 27.4 04/23 1016.7<br />
46012 37.4N 122.7W 735 10.0 10.7 2.9 5.0 04/02 15.7 NW 30.5 27/05 1016.8<br />
46013 38.2N 123.3W 738 9.7 10.5 3.3 6.9 30/04 13.1 NW 30.3 27/02 1017.4<br />
Continued on Page 89
Continued from Page 88<br />
Buoy Climatological Data Summary<br />
MEAN MEAN MEAN SIG MAX SIG MAX SIG SCALAR MEAN PREV MAX MAX MEAN<br />
BUOY LAT LONG OBS AIR TP SEA TP WAVE HT WAVE HT WAVE HT WIND SPEED WIND WIND WIND PRESS<br />
(C) (C) (M) (M) (DA/HR) (KNOTS) (DIR) (KTS) (DA/HR) (MB)<br />
46014 39.2N 124.0W 744 9.1 3.6 7.3 30/01 12.1 NW 32.1 24/13 1017.4<br />
46022 40.7N 124.5W 744 8.9 9.9 3.7 7.6 30/01 13.1 SE 36.5 02/23 1016.1<br />
46023 34.7N 121.0W 741 10.7 11.7 3.0 6.1 30/16 15.9 NW 34.8 19/13 1017.6<br />
46025 33.8N 119.1W 743 12.4 13.7 1.5 3.1 31/10 8.2 W 28.6 31/22 1016.7<br />
46027 41.8N 124.4W 735 8.6 9.7 3.7 8.2 30/00 12.5 S 35.6 30/18 1015.5<br />
46028 35.7N 121.9W 744 10.4 11.7 3.3 6.7 30/14 14.6 NW 31.9 27/03 1016.9<br />
46029 46.1N 124.5W 744 7.6 8.9 3.8 12.8 03/07 15.5 S 46.2 03/04 1011.3<br />
46030 40.4N 124.5W 697 9.0 10.0 14.4 SE 35.9 02/23 1016.8<br />
46035 56.9N 177.8W 715 -2.0 1.5 3.8 8.9 22/09 19.9 SE 47.0 18/00 999.8<br />
46042 36.7N 122.4W 744 10.2 11.3 3.3 6.3 30/07 13.4 NW 30.1 27/06 1017.3<br />
46050 44.6N 124.5W 744 8.1 9.4 3.9 14.1 03/06 15.8 S 44.9 03/03 1013.4<br />
46053 34.2N 119.8W 743 11.7 12.2 1.7 3.1 01/20 11.0 W 30.3 31/02 1016.1<br />
46054 34.3N 120.4W 731 10.9 11.5 2.9 5.0 30/15 16.8 NW 36.7 26/23 1016.1<br />
46059 38.0N 130.0W 739 11.9 4.1 7.7 29/17 15.6 NW 31.3 02/16<br />
46060 60.6N 146.8W 1450 1.0 4.0 0.9 2.5 19/08 12.3 E 32.6 20/22 1001.5<br />
46061 60.2N 146.8W 1487 1.3 4.0 1.9 6.1 19/16 14.9 E 40.2 19/13 1000.1<br />
46062 35.1N 121.0W 729 10.6 11.2 3.1 6.4 30/13 13.8 NW 29.1 27/01 1016.6<br />
46063 34.2N 120.7W 740 10.9 11.3 3.1 5.6 26/07 14.9 NW 29.1 04/13 1016.1<br />
51001 23.4N 162.3W 744 22.6 24.0 2.9 6.2 21/08 16.2 E 25.7 20/07 1020.2<br />
51002 17.2N 157.8W 741 23.5 24.4 2.8 4.3 21/21 17.7 NE 24.4 21/22 1016.9<br />
51003 19.2N 160.7W 742 23.8 24.8 2.7 4.8 21/09 14.5 E 25.2 21/00 1017.4<br />
51004 17.4N 152.5W 710 23.2<br />
April 1999<br />
41001 34.7N 072.6W 720 18.5 20.6 2.3 5.6 16/12 16.5 SW 33.2 12/05 1015.0<br />
41002 32.3N 075.2W 720 20.6 21.8 2.0 5.4 30/14 14.6 SW 29.7 30/00 1016.0<br />
41004 32.5N 079.1W 720 20.1 21.3 1.4 5.1 30/23 14.4 SW 38.9 30/23 1014.9<br />
41008 31.4N 080.9W 720 19.5 0.9 2.3 25/14 11.4 S 29.1 30/23 1015.7<br />
41009 28.5N 080.2W 1440 22.8 23.6 1.0 2.7 01/06 10.5 S 24.9 17/15 1017.0<br />
41010 28.9N 078.6W 1440 23.0 24.5 1.3 3.1 01/01 11.2 S 25.3 17/18 1017.5<br />
42001 25.9N 089.6W 626 23.6 1.0 3.0 17/18 11.5 SE 26.8 16/14 1015.9<br />
42002 25.9N 093.6W 719 23.4 24.0 1.4 2.7 16/00 15.1 SE 27.0 16/09 1014.1<br />
42003 25.9N 085.9W 720 24.4 26.5 1.0 3.0 17/11 11.1 E 35.8 17/10 1016.0<br />
42007 30.1N 088.8W 719 21.7 22.4 0.6 1.7 15/07 11.5 S 24.1 15/06 1016.3<br />
42019 27.9N 095.4W 705 22.5 22.5 1.4 2.9 22/03 12.4 SE 29.3 03/18 1012.9<br />
42020 26.9N 096.7W 705 22.7 22.7 12.7 SE 29.7 15/13 1012.0<br />
42035 29.2N 094.4W 720 21.7 22.1 1.0 2.2 03/20 11.5 SE 30.5 03/20 1014.7<br />
42036 28.5N 084.5W 720 21.4 22.0 0.8 2.2 01/00 8.5 SE 28.6 28/19 1016.5<br />
42039 28.8N 086.0W 720 21.9 22.7 0.9 3.2 01/00 9.1 SE 24.1 30/22 1017.5<br />
42040 29.2N 088.3W 720 22.1 23.0 0.9 2.3 15/23 10.4 SE 24.3 16/11 1016.0<br />
44004 38.5N 070.7W 720 11.9 13.4 2.0 4.3 10/08 14.4 W 29.9 21/03 1014.1<br />
44005 42.9N 068.9W 720 5.6 4.8 1.3 3.5 05/03 11.3 NW 29.1 05/02 1011.5<br />
44007 43.5N 070.1W 720 6.4 0.6 1.7 07/04 10.0 NW 25.6 04/12 1012.2<br />
44008 40.5N 069.4W 707 6.7 6.0 1.6 3.7 05/13 12.2 N 26.2 10/13 1012.6<br />
44009 38.5N 074.7W 720 9.3 8.5 1.1 2.7 10/04 10.5 SW 28.0 10/01 1014.6<br />
44011 41.1N 066.6W 716 5.7 5.1 2.0 5.4 05/05 13.1 SW 29.9 12/17 1011.0<br />
44013 42.4N 070.7W 720 7.2 5.6 0.7 2.2 05/10 9.9 NW 24.9 05/03 1011.5<br />
44014 36.6N 074.8W 717 11.1 9.4 1.4 3.9 30/15 12.1 SW 29.5 30/13 1014.3<br />
44025 40.3N 073.2W 705 8.2 7.6 1.0 2.1 16/21 11.0 SW 23.3 24/06 1013.5<br />
45002 45.3N 086.4W 720 4.3 3.2 0.6 2.4 01/03 10.7 NE 26.4 04/05 1016.4<br />
45003 45.4N 082.8W 541 3.9 2.8 0.4 2.5 11/16 9.4 NE 28.4 11/15 1017.2<br />
45004 47.6N 086.5W 720 3.0 2.3 0.6 3.1 04/04 9.9 N 29.9 04/04 1018.0<br />
45005 41.7N 082.4W 97 8.3 7.8 1.0 2.1 28/11 15.2 NE 23.5 28/01 1020.6<br />
45006 47.3N 089.9W 719 2.7 1.6 0.7 3.6 04/04 10.5 NE 29.9 03/23 1018.0<br />
45007 42.7N 087.0W 720 5.3 4.0 0.6 3.0 23/14 9.7 NE 29.7 23/12 1014.5<br />
45008 44.3N 082.4W 271 4.1 2.6 0.4 2.7 23/13 9.6 NE 25.8 23/11 1021.3<br />
46001 56.3N 148.2W 719 3.1 4.2 3.2 9.0 02/15 1008.4<br />
46005 46.1N 131.0W 719 7.2 7.8 2.6 10.0 05/07 1022.2<br />
46006 40.8N 137.5W 589 9.4 10.2 2.2 5.5 08/21 14.0 NW 28.8 07/16 1026.3<br />
46011 34.9N 120.9W 720 11.1 11.6 2.6 6.6 04/02 13.6 NW 35.8 04/02 1016.3<br />
46012 37.4N 122.7W 714 9.9 10.0 2.3 5.0 03/16 13.3 NW 37.5 03/23 1016.7<br />
46013 38.2N 123.3W 717 9.7 9.7 2.8 6.4 06/07 16.8 NW 37.5 03/23 1017.2<br />
46014 39.2N 124.0W 719 9.4 2.7 7.3 06/02 15.2 NW 36.1 04/01 1018.5<br />
46022 40.7N 124.5W 718 9.2 9.7 2.7 7.7 06/02 14.3 N 33.4 23/03 1019.1<br />
46023 34.7N 121.0W 719 10.9 11.8 2.6 6.6 04/06 16.0 NW 40.6 04/02 1017.3<br />
46025 33.8N 119.1W 719 12.3 13.4 1.4 3.7 28/23 9.7 W 36.5 04/03 1015.9<br />
46026 37.8N 122.8W 437 10.1 9.9 2.0 4.2 29/02 14.5 NW 32.8 22/12 1017.5<br />
46027 41.8N 124.4W 704 9.0 9.1 2.4 6.7 05/23 14.2 NW 33.6 29/23 1019.0<br />
46028 35.7N 121.9W 720 10.6 11.7 2.9 7.7 04/02 15.7 NW 35.2 04/01 1016.5<br />
46029 46.1N 124.5W 720 8.4 9.6 2.3 7.0 05/16 12.5 NW 32.4 10/06 1019.9<br />
46030 40.4N 124.5W 292 9.1 8.7 16.0 N 33.8 22/10 1019.0<br />
46035 56.9N 177.8W 696 -.9 1.4 2.5 6.4 05/06 17.4 W 38.9 04/08 1010.4<br />
46042 36.7N 122.4W 72 9.9 11.0 3.0 6.2 03/23 17.5 NW 35.8 03/22 1014.4<br />
46050 44.6N 124.5W 711 8.9 2.4 7.9 03/23 13.4 N 34.2 10/09 1020.4<br />
46053 34.2N 119.8W 720 11.5 12.1 1.5 3.1 28/21 12.3 W 32.4 28/21 1015.5<br />
46054 34.3N 120.4W 693 10.9 11.2 2.4 5.8 04/04 16.6 NW 38.1 04/03 1015.7<br />
46059 38.0N 130.0W 720 11.9 2.7 9.1 05/23 15.2 N 31.1 08/23<br />
46060 60.6N 146.8W 1374 3.4 4.6 0.7 2.2 01/05 10.2 E 32.4 01/05 1010.7<br />
46061 60.2N 146.8W 1429 3.5 4.6 1.6 5.4 01/10 13.2 E 34.0 01/05 1009.6<br />
46062 35.1N 121.0W 702 10.8<br />
August 1999 89
Meteorological Services—Observations<br />
U.S. Port Meteorological<br />
Officers<br />
Headquarters<br />
Vincent Zegowitz<br />
<strong>Voluntary</strong> <strong>Observing</strong> <strong>Ship</strong>s <strong>Program</strong><br />
Leader<br />
National Weather Service, <strong>NOAA</strong><br />
1325 East-West Hwy., Room 14112<br />
Silver Spring, MD 20910<br />
Tel: 301-713-1677 Ext. 129<br />
Fax: 301-713-1598<br />
E-mail: vincent.zegowitz@noaa.gov<br />
Martin S. Baron<br />
VOS Assistant <strong>Program</strong> Leader<br />
National Weather Service, <strong>NOAA</strong><br />
1325 East-West Hwy., Room 14108<br />
Silver Spring, MD 20910<br />
Tel: 301-713-1677 Ext. 134<br />
Fax: 301-713-1598<br />
E-mail: martin.baron@noaa.gov<br />
Tim Rulon<br />
Communications <strong>Program</strong> Manager<br />
National Weather Service, <strong>NOAA</strong><br />
1325 East-West Hwy., Room 14114<br />
Silver Spring, MD 20910<br />
Tel: 301-713-1677 Ext. 128<br />
Fax: 301-713-1598<br />
E-mail: timothy.rulon@noaa.gov<br />
marine.weather@noaa.gov<br />
Mary Ann Burke, Editor<br />
Mariners Weather Log<br />
6959 Exeter Court, #101<br />
Frederick, MD 21703<br />
Tel and Fax: 715-663-7835<br />
E-mail: wvrs@earthlink.net<br />
Atlantic Ports<br />
Robert Drummond, PMO<br />
National Weather Service, <strong>NOAA</strong><br />
2550 Eisenhower Blvd, No. 312<br />
P.O. Box 165504<br />
Port Everglades, FL 33316<br />
Tel: 954-463-4271<br />
Fax: 954-462-8963<br />
E-mail: robert.drummond@noaa.gov<br />
Lawrence Cain, PMO<br />
National Weather Service, <strong>NOAA</strong><br />
13701 Fang Rd.<br />
Jacksonville, FL 32218<br />
Tel: 904-741-5186<br />
E-mail: larry.cain@noaa.gov<br />
90 Mariners Weather Log<br />
Peter Gibino, PMO, Norfolk<br />
NWS-<strong>NOAA</strong><br />
200 World Trade Center<br />
Norfolk, VA 23510<br />
Tel: 757-441-3415<br />
Fax: 757-441-6051<br />
E-mail: peter.gibino@noaa.gov<br />
James Saunders, PMO<br />
National Weather Service, <strong>NOAA</strong><br />
Maritime Center I, Suite 287<br />
2200 Broening Hwy.<br />
Baltimore, MD 21224-6623<br />
Tel: 410-633-4709<br />
Fax: 410-633-4713<br />
E-mail: james.saunders@noaa.gov<br />
PMO, New Jersey<br />
National Weather Service, <strong>NOAA</strong><br />
110 Lower Main Street, Suite 201<br />
South Amboy, NJ 08879-1367<br />
Tel: 732-316-5409<br />
Fax: 732-316-6543<br />
Tim Kenefick, PMO, New York<br />
National Weather Service, <strong>NOAA</strong><br />
110 Lower Main Street, Suite 201<br />
South Amboy, NJ 08879-1367<br />
Tel: 732-316-5409<br />
Fax: 732-316-7643<br />
E-mail: timothy.kenefick@noaa.gov<br />
Great Lakes Ports<br />
Tim Seeley, PMO<br />
National Weather Service, <strong>NOAA</strong><br />
333 West University Dr.<br />
Romeoville, IL 60441<br />
Tel: 815-834-0600 Ext. 269<br />
Fax: 815-834-0645<br />
E-mail: tim.seeley@noaa.gov<br />
George Smith, PMO<br />
National Weather Service, <strong>NOAA</strong><br />
Hopkins International Airport<br />
Federal Facilities Bldg.<br />
Cleveland, OH 44135<br />
Tel: 216-265-2374<br />
Fax: 216-265-2371<br />
E-mail: George.E.Smith@noaa.gov<br />
Gulf of Mexico Ports<br />
John Warrelmann, PMO<br />
National Weather Service, <strong>NOAA</strong><br />
Int’l Airport, Moisant Field<br />
Box 20026<br />
New Orleans, LA 70141<br />
Tel: 504-589-4839<br />
E-mail: john.warrelmann@noaa.gov<br />
Meteorological Services<br />
James Nelson, PMO<br />
National Weather Service, <strong>NOAA</strong><br />
Houston Area Weather Office<br />
1620 Gill Road<br />
Dickinson, TX 77539<br />
Tel: 281-534-2640 x.277<br />
Fax: 281-337-3798<br />
E-mail: jim.nelson@noaa.gov<br />
Pacific Ports<br />
Derek Lee Loy<br />
Ocean Services <strong>Program</strong> Coordinator<br />
NWS Pacific Region HQ<br />
Grosvenor Center, Mauka Tower<br />
737 Bishop Street, Suite 2200<br />
Honolulu, HI 96813-3213<br />
Tel: 808-532-6439<br />
Fax: 808-532-5569<br />
E-mail: derek.leeloy@noaa.gov<br />
Robert Webster, PMO<br />
National Weather Service, <strong>NOAA</strong><br />
501 West Ocean Blvd., Room 4480<br />
Long Beach, CA 90802-4213<br />
Tel: 562-980-4090<br />
Fax: 562-980-4089<br />
Telex: 7402731/BOBW UC<br />
E-mail: bob.webster@noaa.gov<br />
Robert Novak, PMO<br />
National Weather Service, <strong>NOAA</strong><br />
1301 Clay St., Suite 1190N<br />
Oakland, CA 94612-5217<br />
Tel: 510-637-2960<br />
Fax: 510-637-2961<br />
Telex: 7402795/WPMO UC<br />
E-mail: w-wr-oak@noaa.gov<br />
Patrick Brandow, PMO<br />
National Weather Service, <strong>NOAA</strong><br />
7600 Sand Point Way, N.E.<br />
Seattle, WA 98115-0070<br />
Tel: 206-526-6100<br />
Fax: 206-526-4571 or 6094<br />
Telex: 7608403/SEA UC<br />
E-mail: pat.brandow@noaa.gov<br />
Gary Ennen<br />
National Weather Service, <strong>NOAA</strong><br />
600 Sandy Hook St., Suite 1<br />
Kodiak, AK 99615<br />
Tel: 907-487-2102<br />
Fax: 907-487-9730<br />
E-mail: w-ar-adq@noaa.gov<br />
Lynn Chrystal, OIC<br />
National Weather Service, <strong>NOAA</strong><br />
Continued on Page 91
Meteorological Services<br />
Continued from Page 90<br />
Box 427<br />
Valdez, AK 99686<br />
Tel: 907-835-4505<br />
Fax: 907-835-4598<br />
E-mail: w-ar-adz@noaa.gov<br />
Greg Matzen, Marine <strong>Program</strong> Mgr.<br />
W/AR1x2 Alaska Region<br />
National Weather Service<br />
222 West 7th Avenue #23<br />
Anchorage, AK 99513-7575<br />
Tel: 907-271-3507<br />
E-mail: greg.matzen@noaa.gov<br />
SEAS Field<br />
Representatives<br />
Mr. Robert Decker<br />
Seas Logistics<br />
7600 Sand Point Way N.E.<br />
Seattle, WA 98115<br />
Tel: 206-526-4280<br />
Fax: 206-525-4281<br />
E-mail: bob.decker@noaa.gov<br />
Mr. Steven Cook<br />
<strong>NOAA</strong>-AOML<br />
United States GOOS Center<br />
4301 Rickenbacker Causeway<br />
Miami, FL 33149<br />
Tel: 305-361-4501<br />
Fax: 305-361-4366<br />
E-mail: cook@aoml.noaa.gov<br />
Mr. Robert Benway<br />
National Marine Fisheries Service<br />
28 Tarzwell Dr.<br />
Narragansett, RI 02882<br />
Tel: 401-782-3295<br />
Fax: 401-782-3201<br />
E-mail: rbenway@whsun1.wh.whoi.edu<br />
Mr. Jim Farrington<br />
SEAS Logistics/ A.M.C.<br />
439 WestWork St.<br />
Norfolk, VA 23510<br />
Tel: 757-441-3062<br />
Fax: 757-441-6495<br />
E-mail: farrington@aoml.noaa.gov<br />
Mr. Craig Engler<br />
Atlantic Oceanographic & Met. Lab.<br />
4301 Rickenbacker Causeway<br />
Miami, FL 33149<br />
Tel: 305-361-4439<br />
Fax: 305-361-4366<br />
Telex: 744 7600 MCI<br />
E-mail: engler@aoml.noaa.gov<br />
NIMA Fleet Liaison<br />
Tom Hunter, Fleet Liaison Officer<br />
ATTN: GIMM (MS D-44)<br />
4600 Sangamore Road<br />
Bethesda, MD 20816-5003<br />
Tel: 301-227-3120<br />
Fax: 301-227-4211<br />
E-mail: huntert@nima.mil<br />
U.S. Coast Guard AMVER<br />
Center<br />
Richard T. Kenney<br />
AMVER Maritime Relations Officer<br />
United States Coast Guard<br />
Battery Park Building<br />
New York, NY 10004<br />
Tel: 212-668-7764<br />
Fax: 212-668-7684<br />
Telex: 127594 AMVERNYK<br />
E-mail: rkenney@batteryny.uscg.mil<br />
Other Port Meteorological<br />
Officers<br />
Australia<br />
Headquarters<br />
Tony Baxter<br />
Bureau of Meteorology<br />
150 Lonsdale Street, 7th Floor<br />
Melbourne, VIC 3000<br />
Tel: +613 96694651<br />
Fax: +613 96694168<br />
Melbourne<br />
Michael T. Hills, PMA<br />
Victoria Regional Office<br />
Bureau of Meteorology, 26th Floor<br />
150 Lonsdale Street<br />
Melbourne, VIC 3000<br />
Tel: +613 66694982<br />
Fax: +613 96632059<br />
Fremantle<br />
Captain Alan H. Pickles, PMA<br />
WA Regional Office<br />
1100 Hay Street, 5th Floor<br />
West Perth WA 6005<br />
Tel: +619 3356670<br />
Fax: +619 2632297<br />
Sydney<br />
Captain E.E. (Taffy) Rowlands, PMA<br />
NSW Regional Office<br />
Bureau of Meteorology, Level 15<br />
300 Elizabeth Street<br />
Sydney NSW 2000<br />
Tel:+612 92961547<br />
Fax: +612 92961589<br />
Telex: AA24640<br />
Meteorological Services<br />
Canada<br />
Randy Sheppard, PMO<br />
Environment Canada<br />
1496 Bedford Highway, Bedford<br />
(Halifax) Nova Scotia B4A 1E5<br />
902-426-6703<br />
E-mail: randy.sheppard@ec.gc.ca<br />
Jack Cossar, PMO<br />
Environment Canada<br />
Bldg. 303, Pleasantville<br />
P.O. Box 21130, Postal Station “B”<br />
St. John’s, Newfoundland A1A 5B2<br />
Tel: 709-772-4798<br />
E-mail: jack.cossar@ec.gc.ca<br />
Michael Riley, PMO<br />
Environment Canada<br />
Pacific and Yukon Region<br />
Suite 700, 1200 W. 73rd Avenue<br />
Vancouver, British Columbia V6P 6H9<br />
Tel: 604-664-9136<br />
Fax: 604-664-9195<br />
E-mail: Mike.Riley@ec.gc.ca<br />
Ron Fordyce, Supt. Marine Data Unit<br />
Rick Shukster, PMO<br />
Roland Kleer, PMO<br />
Environment Canada<br />
Port Meteorological Office<br />
100 East Port Blvd.<br />
Hamilton, Ontario L8H 7S4<br />
Tel: 905-312-0900<br />
Fax: 905-312-0730<br />
E-mail: ron.fordyce@ec.gc.ca<br />
China<br />
YU Zhaoguo<br />
Shanghai Meteorological Bureau<br />
166 Puxi Road<br />
Shanghai, China<br />
Denmark<br />
Commander Lutz O. R. Niegsch<br />
PMO, Danish Meteorological Inst.<br />
Lyngbyvej 100, DK-2100<br />
Copenhagen, Denmark<br />
Tel: +45 39157500<br />
Fax: +45 39157300<br />
United Kingdom<br />
Headquarters<br />
Capt. E. J. O’Sullivan<br />
Marine Observations Manager<br />
Met. Office - Observations <strong>Voluntary</strong> (Marine)<br />
Scott Building<br />
Eastern Road<br />
Bracknell, Berkshire RG12 2PW<br />
Tel: +44-1344 855654<br />
Fax: +44-1344 855921<br />
Telex: 849801 WEABKA G<br />
Continued on Page 92<br />
August 1999 91
Meteorological Services<br />
Continued from Page 91<br />
Bristol Channel<br />
Captain Austin P. Maytham, PMO<br />
P.O. Box 278, Companies House<br />
CrownWay, Cardiff CF14 3UZ<br />
Tel: + 44 029 2202 142223<br />
Fax: +44 029 2022 5295<br />
East England<br />
Captain John Steel, PMO<br />
Customs Building, Albert Dock<br />
Hull HU1 2DP<br />
Tel: +44 01482 320158<br />
Fax: +44 01482 328957<br />
Northeast England<br />
Captain Gordon Young, PMO<br />
Able House, Billingham Reach Ind. Estate<br />
Billingham, Cleveland TS23 lPX<br />
Tel: +44 0642 560993<br />
Fax:+44 0642 562170<br />
Northwest England<br />
Colin B. Attfield, PMO<br />
Room 331, Royal Liver Building<br />
Liverpool L3 1JH<br />
Tel:+44 0151 236 6565<br />
Fax: +44 0151 227 4762<br />
Scotland and Northern Ireland<br />
Captain Peter J. Barratt, PMO<br />
Navy Buildings, Eldon Street<br />
Greenock, Strathclyde PA16 7SL<br />
Tel: +44 01475 724700<br />
Fax: +44 01475 892879<br />
Southeast England<br />
Captain Harry H. Gale, PMO<br />
Trident House, 21 Berth, Tilbury Dock<br />
Tilbury, Essex RM18 7HL<br />
Tel: +44 01385 859970<br />
Fax: +44 01375 859972<br />
Southwest England<br />
Captain James M. Roe, PMO<br />
8 Viceroy House, Mountbatten Business Centre<br />
Millbrook Road East<br />
Southampton SO15 lHY<br />
Tel: +44 023 8022 0632<br />
Fax: +44 023 8033 7341<br />
France<br />
Yann Prigent, PMO<br />
Station Mét., Noveau Semaphore<br />
Quai des Abeilles, Le Havre<br />
Tel: +33 35422106<br />
Fax: +33 35413119<br />
P. Coulon<br />
Station Météorologique<br />
92 Mariners Weather Log<br />
de Marseille-Port<br />
12 rue Sainte Cassien<br />
13002 Marseille<br />
Tel: +33 91914651 Ext. 336<br />
Germany<br />
Henning Hesse, PMO<br />
Wetterwarte, An der neuen Schleuse<br />
Bremerhaven<br />
Tel: +49 47172220<br />
Fax: +49 47176647<br />
Jurgen Guhne, PMO<br />
Deutscher Wetterdienst<br />
Seewetteramt<br />
Bernhard Nocht-Strasse 76<br />
20359 Hamburg<br />
Tel: 040 3190 8826<br />
Greece<br />
George E. Kassimidis, PMO<br />
Port Office, Piraeus<br />
Tel: +301 921116<br />
Fax: +3019628952<br />
Hong Kong<br />
C. F. Wong, PMO<br />
Hong Kong Observatory<br />
Unit 2613, 26/F, Miramar Tower<br />
14/F Ocean Centre<br />
1 Kimberly Road<br />
Kowloon, Hong Kong<br />
Tel: +852 2926 3100<br />
Fax: +852 2375 7555<br />
Israel<br />
Hani Arbel, PMO<br />
Haifa Port<br />
Tel: 972 4 8664427<br />
Aharon Ofir, PMO<br />
Marine Department<br />
Ashdod Port<br />
Tel: 972 8 8524956<br />
Japan<br />
Headquarters<br />
Marine Met. Div., Marine Dept.<br />
Japan Meteorological Agency<br />
1-34 Otemachi, Chiyoda-ku<br />
Tokyo, 100 Japan<br />
Fax: 03-3211-6908<br />
Port Meteorological Officer<br />
Kobe Marine Observatory<br />
14-1, Nakayamatedori-7-chome<br />
Chuo-ku, Kobe, 650 Japan<br />
Fax: 078-361-4472<br />
Meteorological Services<br />
Port Meteorological Officer<br />
Nagoya Local Meteorological Obs.<br />
2-18, Hiyori-cho, Chikusa-ku<br />
Nagoya, 464 Japan<br />
Fax: 052-762-1242<br />
Port Meteorological Officer<br />
Yokohama Local Met. Observatory<br />
99 Yamate-cho, Naka-ku,<br />
Yokohama, 231 Japan<br />
Fax: 045-622-3520<br />
Kenya<br />
Ali J. Mafimbo, PMO<br />
PO Box 98512<br />
Mombasa, Kenya<br />
Tel: +254 1125685<br />
Fax: +254 11433440<br />
Malaysia<br />
NG Kim Lai<br />
Assistant Meteorological Officer<br />
Malaysian Meteorological Service<br />
Jalan Sultan, 46667 Petaling<br />
Selangor, Malaysia<br />
Mauritius<br />
Mr. S Ragoonaden<br />
Meteorological Services<br />
St. Paul Road, Vacoas, Mauritius<br />
Tel: +230 6861031<br />
Fax: +230 6861033<br />
Netherlands<br />
John W. Schaap, PMO<br />
KNMI/PMO-Office<br />
Wilhelminalaan 10, PO Box 201<br />
3730 AE De Bilt, Netherlands<br />
Tel: +3130 2206391<br />
Fax: +3130 210849<br />
E-mail: schaap@knmi.nl<br />
New Zealand<br />
Julie Fletcher, MMO<br />
MetService New Zealand Ltd.<br />
P.O. Box 722<br />
Wellington, New Zealand<br />
Tel: +644 4700789<br />
Fax: +644 4700772<br />
Norway<br />
Tor Inge Mathiesen, PMO<br />
Norwegian Meteorological Institute<br />
Allegaten 70, N-5007<br />
Bergen, Norway<br />
Continued on Page 93
Meteorological Services<br />
Continued from Page 92<br />
Tel: +475 55236600<br />
Fax: +475 55236703<br />
Poland<br />
Jozef Kowalewski,PMO<br />
Institute of Meteorology and Water Mgt.<br />
Maritime Branch<br />
ul.Waszyngtona 42, 81-342 Gdynia Poland<br />
Tel: +4858 6205221<br />
Fax: +4858 6207101<br />
E-mail: kowalews@stratus/imgw.gdynia.pl<br />
Saudi Arabia<br />
Mahmud Rajkhan, PMO<br />
National Met. Environment Centre<br />
Eddah<br />
Tel:+ 9662 6834444 Ext. 325<br />
Singapore<br />
Edmund Lee Mun San, PMO<br />
Meteorological Service, PO Box 8<br />
Singapore Changi Airport<br />
Singapore 9181<br />
Tel: +65 5457198<br />
Fax: +65 5457192<br />
Meteorological Services - Forecasts<br />
Headquarters<br />
Marine Weather Services <strong>Program</strong> Manager<br />
National Weather Service<br />
1325 East-West Highway, Room 14126<br />
Silver Spring, MD 20910<br />
Tel: 301-713-1677 x. 126<br />
Fax: 301-713-1598<br />
E-mail: laura.cook@noaa.gov<br />
Richard May<br />
Assistant Marine Weather Services<br />
<strong>Program</strong> Manager<br />
National Weather Service<br />
1325 East-West Highway, Room 14124<br />
Silver Spring, MD 20910<br />
Tel: 301-713-1677 x. 127<br />
Fax: 301-713-1598<br />
E-mail: richard.may@noaa.gov<br />
U.S. NWS Offices<br />
Atlantic & Eastern Pacific<br />
Offshore & High Seas<br />
David Feit<br />
National Centers for Environmental<br />
Prediction<br />
Marine Prediction Center<br />
Washington, DC 20233<br />
Tel: 301-763-8442<br />
Fax: 301-763-8085<br />
Tropics<br />
Chris Burr<br />
National Centers for Environmental<br />
Prediction<br />
Tropical Prediction Center<br />
11691 Southwest 17th Street<br />
Miami, FL 33165<br />
Tel: 305-229-4433<br />
Fax: 305-553-1264<br />
E-mail: burr@nhc.noaa.gov<br />
Central Pacific High Seas<br />
Tim Craig<br />
National Weather Service Forecast Office<br />
2525 Correa Road, Suite 250<br />
Honolulu, HI 96822-2219<br />
Tel: 808-973-5280<br />
Fax: 808-973-5281<br />
E-mail: timothy.craig@noaa.gov<br />
Alaska High Seas<br />
Dave Percy<br />
National Weather Service<br />
6930 Sand Lake Road<br />
Anchorage, AK 99502-1845<br />
Tel: 907-266-5106<br />
Fax: 907-266-5188<br />
Meteorological Services<br />
South Africa<br />
C. Sydney Marais, PMO<br />
c/o Weather Office<br />
Capt Town International Airport 7525<br />
Tel: + 27219340450 Ext. 213<br />
Fax: +27219343296<br />
Gus McKay, PMO<br />
Meteorological Office<br />
Durban International Airpot 4029<br />
Tel: +2731422960<br />
Fax: +2731426830<br />
Sweden<br />
Morgan Zinderland<br />
SMHI<br />
S-601 76 Norrköping, Sweden<br />
Coastal Atlantic<br />
John W. Cannon<br />
National Weather Service Forecast Office<br />
P.O. Box 1208<br />
Gray, ME 04039<br />
Tel: 207-688-3216<br />
E-mail: john.w.cannon@noaa.gov<br />
Mike Fitzsimmons<br />
National Weather Service Office<br />
810 Maine Street<br />
Caribou, ME 04736<br />
Tel: 207-498-2869<br />
Fax: 207-498-6378<br />
E-mail: mikefitzsimmons@noaa.gov<br />
Tom Fair/Frank Nocera<br />
National Weather Service Forecast Office<br />
445 Myles Standish Blvd.<br />
Taunton, MA 02780<br />
Tel: 508-823-1900<br />
E-mail: thomas.fair@noaa.gov;<br />
frank.nocera@noaa.gov<br />
Ingrid Amberger<br />
National Weather Service Forecast Office<br />
175 Brookhaven Avenue<br />
Building NWS #1<br />
Upton, NY 11973<br />
Tel: 516-924-0499 (0227)<br />
E-mail: ingrid.amberger@noaa.gov<br />
Continued on Page 94<br />
August 1999 93
Meteorological Services<br />
Continued from Page 93<br />
James A. Eberwine<br />
National Weather Service Forecast Office<br />
Philadelphia<br />
732 Woodlane Road<br />
Mount Holly, NJ 08060<br />
Tel: 609-261-6600 ext. 238<br />
E-mail: james.eberwine@noaa.gov<br />
Dewey Walston<br />
National Weather Service Forecast Office<br />
44087 Weather Service Road<br />
Sterling, VA 20166<br />
Tel: 703-260-0107<br />
E-mail: dewey.walston@noaa.gov<br />
Brian Cullen<br />
National Weather Service Office<br />
10009 General Mahone Hwy.<br />
Wakefield, VA 23888-2742<br />
Tel: 804-899-4200 ext. 231<br />
E-mail: brian.cullen@noaa.gov<br />
Robert Frederick<br />
National Weather Service Office<br />
53 Roberts Road<br />
Newport, NC 28570<br />
Tel: 919-223-5737<br />
E-mail: robert.frederick@noaa.gov<br />
Doug Hoehler<br />
National Weather Service Forecast Office<br />
2015 Gardner Road<br />
Wilmington, NC 28405<br />
Tel: 910-762-4289<br />
E-mail: douglas.hoehler@noaa.gov<br />
John F. Townsend<br />
National Weather Service Office<br />
5777 South Aviation Avenue<br />
<strong>Charles</strong>ton, SC 29406-6162<br />
Tel: 803-744-0303 ext. 6 (forecaster)<br />
803-744-0303 ext. 2 (marine weather<br />
recording)<br />
Kevin Woodworth<br />
National Weather Service Office<br />
5777 S. Aviation Avenue<br />
<strong>Charles</strong>ton, SC 29406<br />
Tel: 843-744-0211<br />
Fax: 843-747-5405<br />
E-mail: kevin.woodworth@noaa.gov<br />
Andrew Shashy<br />
National Weather Service Forecast Office<br />
13701 Fang Road<br />
Jacksonville, FL 32218<br />
Tel: 904-741-5186<br />
Randy Lascody<br />
National Weather Service Office<br />
421 Croton Road<br />
94 Mariners Weather Log<br />
Melbourne, FL 32935<br />
Tel: 407-254-6083<br />
Michael O’Brien<br />
National Weather Service Forecast Office<br />
11691 Southwest 17 Street<br />
Miami, FL 33165-2149<br />
Tel: 305-229-4525<br />
Great Lakes<br />
Daron Boyce, Senior Marine Forecaster<br />
National Weather Service Forecast Office<br />
Hopkins International Airport<br />
Cleveland, OH 44135<br />
Tel: 216-265-2370<br />
Fax: 216-265-2371<br />
Tom Paone<br />
National Weather Service Forecast Office<br />
587 Aero Drive<br />
Buffalo, NY 14225<br />
Tel: 716-565-0204 (M-F 7am-5pm)<br />
Tracy Packingham<br />
National Weather Service Office<br />
5027 Miller Trunk Hwy.<br />
Duluth, MN 55811-1442<br />
Tel: 218-729-0651<br />
E-mail: tracy.packingham@noaa.gov<br />
Dave Guenther<br />
National Weather Service Office<br />
112 Airport Drive S.<br />
Negaunee, MI 49866<br />
Tel: 906-475-5782 ext. 676<br />
E-mail: dave.gunther@noaa.gov<br />
Terry Egger<br />
National Weather Service Office<br />
2485 S. Pointe Road<br />
Green Bay, WI 54313-5522<br />
Tel: 920-494-5845<br />
E-mail: teriegger@noaa.gov<br />
Robert McMahon<br />
National Weather Service Forecast Office<br />
Milwaukee<br />
N3533 Hardscrabble Road<br />
Dousman, WI 53118-9409<br />
Tel: 414-297-3243<br />
Fax: 414-965-4296<br />
E-mail: robert.mcmahon@noaa.gov<br />
Amy Seeley<br />
National Weather Service Forecast Office<br />
333 West University Drive<br />
Romeoville, IL 60446<br />
Tel: 815-834-0673 ext. 269<br />
E-mail: amy.seeley@noaa.gov<br />
Bob Dukesherer<br />
National Weather Service Office<br />
4899 S. Complex Drive, S.E.<br />
Grand Rapids, MI 49512-4034<br />
Meteorological Services<br />
Tel: 616-956-7180 or 949-0643<br />
E-mail: bob.dukesherer@noaa.gov<br />
John Boris<br />
National Weather Service Office<br />
8800 Passenheim Hill Road<br />
Gaylord, MI 49735-9454<br />
Tel: 517-731-3384<br />
E-mail: john.boris@noaa.gov<br />
Bill Hosman<br />
National Weather Service Forecast Office 9200<br />
White Lake Road<br />
White Lake, MI 48386-1126<br />
Tel: 248-625-3309<br />
Fax: 248-625-4834<br />
E-mail: jeff.boyne@noaa.gov<br />
Coastal Gulf of Mexico<br />
Constantine Pashos<br />
National Weather Service Forecast Office<br />
2090 Airport Road<br />
New Braunfels, TX 78130<br />
Tel: 210-606-3600<br />
Len Bucklin<br />
National Weather Service Forecast Office<br />
62300 Airport Road<br />
Slidell, LA 70460-5243<br />
Tel: 504-522-7330<br />
Steve Pfaff, Marine Focal Point<br />
National Weather Service Forecast Office<br />
300 Pinson Drive<br />
Corpus Christi, TX 78406<br />
Tel: 512-289-0959<br />
Fax: 512-289-7823<br />
Rick Gravitt<br />
National Weather Service Office<br />
500 Airport Blvd., #115<br />
Lake <strong>Charles</strong>, LA 70607<br />
Tel: 318-477-3422<br />
Fax: 318-474-8705<br />
E-mail: richard.gravitt@noaa.gov<br />
Eric Esbensen<br />
National Weather Service Office<br />
8400 Airport Blvd., Building 11<br />
Mobile, AL 36608<br />
Tel: 334-633-6443<br />
Fax: 334-607-9773<br />
Paul Yura<br />
National Weather Service Office<br />
20 South Vermillion<br />
Brownsville, TX 78521<br />
Brian Kyle<br />
National Weather Service Office<br />
Houston<br />
1620 Gill Road<br />
Dickenson, TX 77539<br />
Continued on Page 95
Meteorological Services<br />
Continued from Page 94<br />
Tel: 281-337-5074<br />
Fax: 281-337-3798<br />
Greg Mollere, Marine Focal Point<br />
National Weather Service Forecast Office<br />
3300 Capital Circle SW, Suite 227<br />
Tallahassee, FL 32310<br />
Tel: 904-942-8999<br />
Fax: 904-942-9396<br />
Dan Sobien<br />
National Weather Service Office<br />
Tampa Bay<br />
2525 14th Avenue SE<br />
Ruskin, FL 33570<br />
Tel: 813-645-2323<br />
Fax: 813-641-2619<br />
Scott Stripling, Marine Focal Point<br />
National Weather Service Office<br />
Carr. 190 #4000<br />
Carolina, Puerto Rico 00979<br />
Tel: 787-253-4586<br />
Fax: 787-253-7802<br />
E-mail: scott.stripling@noaa.gov<br />
Coastal Pacific<br />
William D. Burton<br />
National Weather Service Forecast Office<br />
Bin C15700<br />
7600 Sand Point Way NE<br />
Seattle, WA 98115<br />
Tel: 206-526-6095 ext. 231<br />
Fax: 206-526-6094<br />
Stephen R. Starmer<br />
National Weather Service Forecast Office<br />
5241 NE 122nd Avenue<br />
Portland, OR 97230-1089<br />
Tel: 503-326 2340 ext. 231<br />
Fax: 503-326-2598<br />
Rick Holtz<br />
National Weather Service Office<br />
4003 Cirrus Drive<br />
Medford, OR 97504<br />
Tel: 503-776-4303<br />
Fax: 503-776-4344<br />
E-mail: rick.holtz@noaa.gov<br />
Jeff Osiensky<br />
National Weather Service Office<br />
300 Startare Drive<br />
Eureka, CA 95501<br />
Tel: 707-443-5610<br />
Fax: 707-443-6195<br />
Jeff Kopps<br />
National Weather Service Forecast Office<br />
21 Grace Hopper Avenue, Stop 5<br />
Monterey, CA 93943-5505<br />
Tel: 408-656-1717<br />
Fax: 408-656-1747<br />
Chris Jacobsen<br />
National Weather Service Forecast Office<br />
520 North Elevar Street<br />
Meteorological Services<br />
Oxnard, CA 93030<br />
Tel: 805-988-6615<br />
Fax: 805-988-6613<br />
Don Whitlow<br />
National Weather Service Office<br />
11440 West Bernardo Ct., Suite 230<br />
San Diego, CA 92127-1643<br />
Tel: 619-675-8700<br />
Fax: 619-675-8712<br />
Andrew Brewington<br />
National Weather Service Forecast Office<br />
6930 Sand Lake Road<br />
Anchorage, AK 95502-1845<br />
Tel: 907-266-5105<br />
Dave Hefner<br />
National Weather Service Forecast Office<br />
Intl. Arctic Research Ctr. Bldg./UAF<br />
P.O. Box 757345<br />
Fairbanks, AK 99701-6266<br />
Tel: 907-458-3700<br />
Fax: 907-450-3737<br />
Robert Kanan<br />
National Weather Service Forecast Office<br />
8500 Mendenhall Loop Road<br />
Juneau, AK 99801<br />
Tel and Fax: 907-790-6827<br />
Tom Tarlton<br />
Guam<br />
Tel: 011-671-632-1010<br />
E-mail: thomas.tarlton@noaa.govh<br />
(MWL) at $12.00 ($15.00 foreign) per year (3 issues).<br />
August 1999 95
U.S. Department of Commerce<br />
National Oceanic and Atmospheric Administration 40<br />
1315 East-West Highway<br />
Distribution Unit<br />
Silver Spring, MD 20910<br />
Attn: Mariners Weather Log<br />
Address Correction Requested Special<br />
OFFICIAL BUSINESS Standard Rate<br />
PENALTY FOR PRIVATE USE $300<br />
In this Issue:<br />
Hurricane Avoidance Using the “34-Knot Wind Radius” and<br />
“1-2-3” Rules ....................................................................................................................4<br />
Great Lakes Wrecks—The Roy A. Jodrey ......................................................................10<br />
Waves Beneath the Sea ...................................................................................................... 11<br />
Marine Debris: Sources and Sinks in the Ocean Environment ....................................22