724_Final Report.pdf - North Pacific Research Board
724_Final Report.pdf - North Pacific Research Board
724_Final Report.pdf - North Pacific Research Board
You also want an ePaper? Increase the reach of your titles
YUMPU automatically turns print PDFs into web optimized ePapers that Google loves.
The diets of captive eiders were estimated using the QFASA model developed by Iverson et al.<br />
(2004). QFASA estimates the diet by estimating the weighted the mixture of FA signatures of diet items<br />
that most closely resemble that of the eider’s adipose tissue after accounting for metabolism effects, and<br />
then uses the relative fat content of each diet item to translate the signature mix into a diet estimate.<br />
Calculated CCs were also used in the model to account for eider lipid metabolism.<br />
Results<br />
Qualitative separation of diet items and eider biopsies<br />
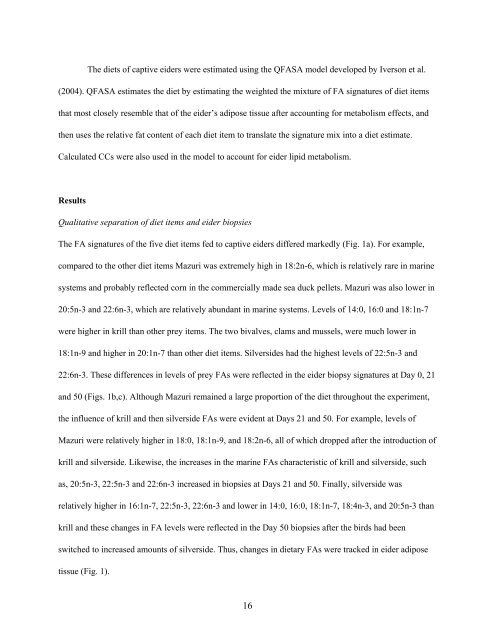
The FA signatures of the five diet items fed to captive eiders differed markedly (Fig. 1a). For example,<br />
compared to the other diet items Mazuri was extremely high in 18:2n-6, which is relatively rare in marine<br />
systems and probably reflected corn in the commercially made sea duck pellets. Mazuri was also lower in<br />
20:5n-3 and 22:6n-3, which are relatively abundant in marine systems. Levels of 14:0, 16:0 and 18:1n-7<br />
were higher in krill than other prey items. The two bivalves, clams and mussels, were much lower in<br />
18:1n-9 and higher in 20:1n-7 than other diet items. Silversides had the highest levels of 22:5n-3 and<br />
22:6n-3. These differences in levels of prey FAs were reflected in the eider biopsy signatures at Day 0, 21<br />
and 50 (Figs. 1b,c). Although Mazuri remained a large proportion of the diet throughout the experiment,<br />
the influence of krill and then silverside FAs were evident at Days 21 and 50. For example, levels of<br />
Mazuri were relatively higher in 18:0, 18:1n-9, and 18:2n-6, all of which dropped after the introduction of<br />
krill and silverside. Likewise, the increases in the marine FAs characteristic of krill and silverside, such<br />
as, 20:5n-3, 22:5n-3 and 22:6n-3 increased in biopsies at Days 21 and 50. <strong>Final</strong>ly, silverside was<br />
relatively higher in 16:1n-7, 22:5n-3, 22:6n-3 and lower in 14:0, 16:0, 18:1n-7, 18:4n-3, and 20:5n-3 than<br />
krill and these changes in FA levels were reflected in the Day 50 biopsies after the birds had been<br />
switched to increased amounts of silverside. Thus, changes in dietary FAs were tracked in eider adipose<br />
tissue (Fig. 1).<br />
16


