724_Final Report.pdf - North Pacific Research Board
724_Final Report.pdf - North Pacific Research Board
724_Final Report.pdf - North Pacific Research Board

Create successful ePaper yourself
Turn your PDF publications into a flip-book with our unique Google optimized e-Paper software.
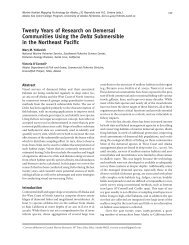
Table 2. Sum of the squared errors (SSE) for 7 of 27 fatty acid (FA) subsets for Diets 1, 2 and 3 for spectacled and Steller’s eiders. SSE = (actual<br />
proportion of diet item – model estimate of diet item) 2 summed across all diet items. SSE for Diets 1, 2 and 3 separately. Total = sum of SSE of<br />
Diets 1, 2 and 3. Dietary and Extended Dietary FA subsets are from Iverson et al. (2004). Values in bold italicized print indicate the lowest SSE.<br />
Test 18 (Reduced A) and test 21 (Reduced B) FA subsets had the lowest overall SSE for spectacled and Steller’s eiders, respectively, and were<br />
determined to be the subsets that give the best overall model estimates of diet. See Appendix 1 for FAs included in each subset.<br />
Diet 1 Diet 2 Diet 3 Total<br />
FA subset spectacled Steller's spectacled Steller's spectacled Steller's spectacled Steller's<br />
Extended Dietary 0.00008 0.00003 0.29729 0.44574 0.16514 0.22901 0.46251 0.67478<br />
test13 0.00018 0.00001 0.31072 0.48584 0.17783 0.24764 0.48873 0.73350<br />
Dietary 0.00055 0.00027 0.16345 0.15921 0.17475 0.15286 0.33875 0.31234<br />
test17 0.00054 0.00039 0.16258 0.15927 0.17276 0.15154 0.33588 0.31121<br />
test18 (Reduced A) 0.00070 0.00040 0.15881 0.13921 0.17627 0.15590 0.33578 0.29550<br />
test21 (Reduced B) 0.00080 0.00053 0.15889 0.13954 0.17739 0.15539 0.33709 0.29546<br />
test23 0.00098 0.00052 0.15878 0.13949 0.17940 0.15574 0.33916 0.29575<br />
32