Evaluation of prey for the spider Dicymbium brevisetosum
Evaluation of prey for the spider Dicymbium brevisetosum
Evaluation of prey for the spider Dicymbium brevisetosum

Create successful ePaper yourself
Turn your PDF publications into a flip-book with our unique Google optimized e-Paper software.
8 stands in <strong>the</strong> region <strong>of</strong> <strong>the</strong> Flemish Ardens, <strong>the</strong> <strong>spider</strong> fauna was determined (<strong>for</strong> a graduate <strong>the</strong>sis) <strong>for</strong> <strong>the</strong><br />
whole year cycle (VAN WAESBERGHE, 1998). Due to <strong>the</strong> large sorting ef<strong>for</strong>t, we can only present <strong>the</strong>se preliminary<br />
results. In a future contribution, <strong>the</strong> results <strong>of</strong> <strong>the</strong> analysis <strong>of</strong> <strong>the</strong> complete data will be displayed. For determination<br />
<strong>of</strong> species we used LOCKET, MILLIDGE (1951, 1953), LOCKET et al. (1974) and ROBERTS (1987, 1998).<br />
Fur<strong>the</strong>rmore, some parameters <strong>of</strong> <strong>the</strong> soil and litter layer were measured: acidity (pH), electrical conductivity,<br />
weight (DS) and <strong>the</strong> concentration <strong>of</strong> several mineral elements (Ca, N, S, P, Mg and K). Values <strong>for</strong> <strong>the</strong>se parameters<br />
are shown in Table 3.<br />
Ordinations and classifications were done with <strong>the</strong> programmes PC-ORD (MCCUNE, MEFFORD, 1995) and<br />
CANOCO <strong>for</strong> Windows. Statistical tests were per<strong>for</strong>med with <strong>the</strong> program STATISTICA.<br />
o 50<br />
47<br />
#o<br />
46<br />
o<br />
32#<br />
o<br />
48<br />
o 45 o<br />
o<br />
49<br />
Results and discussion<br />
41<br />
o<br />
42<br />
o<br />
35<br />
o<br />
36<br />
8<br />
o 40<br />
43 o o o<br />
21<br />
33<br />
o<br />
5<br />
o<br />
37<br />
o<br />
22<br />
o<br />
38<br />
o 39<br />
o 7<br />
44 o<br />
15<br />
o<br />
14 16<br />
o o 18<br />
17<br />
9<br />
z 10<br />
z 1<br />
2<br />
3<br />
z z<br />
23<br />
28 z<br />
29 z<br />
30<br />
24 z 31<br />
z<br />
25<br />
o<br />
27 z<br />
# z<br />
26<br />
The <strong>spider</strong>s captured during May 1997 were determined <strong>for</strong> all 50 <strong>for</strong>est stands (see<br />
Table 2). This revealed 9677 adult individuals belonging to 161 species. The complete year<br />
cycle <strong>of</strong> <strong>the</strong> 8 <strong>for</strong>est stands in <strong>the</strong> Flemish Ardens revealed 8 217 adult individuals belonging<br />
to 118 species (VAN WAESBERGHE, 1998). 45 species, which have been determined <strong>for</strong><br />
<strong>the</strong> 50 <strong>for</strong>est stands and <strong>the</strong> 8 stands <strong>of</strong> <strong>the</strong> Flemish Ardens, belong to <strong>the</strong> Red List <strong>of</strong><br />
<strong>spider</strong>s <strong>of</strong> Flanders (MAELFAIT et al., 1998).<br />
The species used in <strong>the</strong> analysis were <strong>the</strong> most abundant ones. In <strong>the</strong> case <strong>of</strong> <strong>the</strong> 50 <strong>for</strong>est<br />
stands we took 50 individuals <strong>for</strong> analyses. This is equivalent to one capture in every plot<br />
during <strong>the</strong> month <strong>of</strong> May 1997. We have 30 species that fulfil this condition. The quantitative<br />
data <strong>of</strong> <strong>the</strong>se most abundant species were trans<strong>for</strong>med to percentage distributions per<br />
species over <strong>the</strong> 50 <strong>for</strong>est stands as a measure <strong>of</strong> habitat preference (within <strong>the</strong> available<br />
data). Such a trans<strong>for</strong>mation ensures that each species (used in <strong>the</strong> analysis) receives an<br />
equal weight. This explains why less abundant species (with strong random variation in<br />
numbers, and <strong>of</strong>ten also possible accidental immigrants from o<strong>the</strong>r environments) are not<br />
used in <strong>the</strong> analysis. The results are used in an indirect gradient-analysis (DCA= Detrended<br />
o<br />
6<br />
11<br />
z<br />
4<br />
o<br />
13 o 12<br />
o 20<br />
o<br />
19<br />
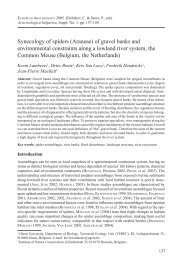
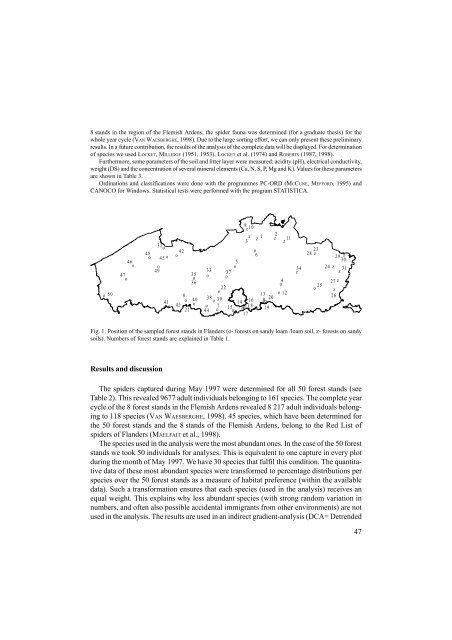
Fig. 1. Position <strong>of</strong> <strong>the</strong> sampled <strong>for</strong>est stands in Flanders (o- <strong>for</strong>ests on sandy loam /loam soil, z- <strong>for</strong>ests on sandy<br />
soils). Numbers <strong>of</strong> <strong>for</strong>est stands are explained in Table 1.<br />
34<br />
z<br />
o<br />
47