Maquette (re) 3.3 (Page 2) - Millipore
Maquette (re) 3.3 (Page 2) - Millipore
Maquette (re) 3.3 (Page 2) - Millipore

You also want an ePaper? Increase the reach of your titles
YUMPU automatically turns print PDFs into web optimized ePapers that Google loves.
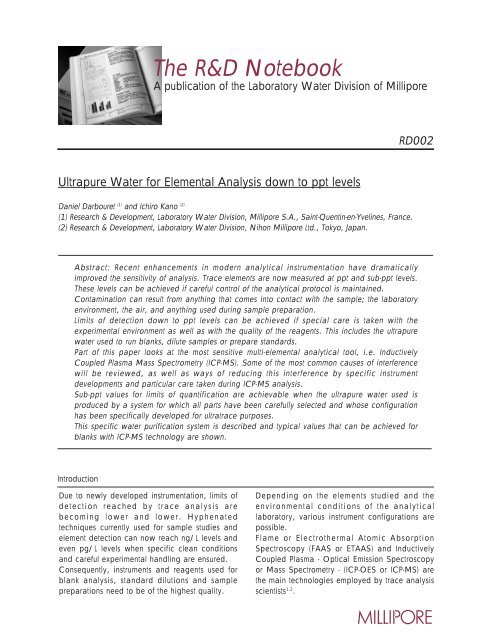
The R&D Notebook<br />
Ultrapu<strong>re</strong> Water for Elemental Analysis down to ppt levels<br />
Daniel Darbou<strong>re</strong>t (1) and Ichiro Kano (2)<br />
(1) Research & Development, Laboratory Water Division, Millipo<strong>re</strong> S.A., Saint-Quentin-en-Yvelines, France.<br />
(2) Research & Development, Laboratory Water Division, Nihon Millipo<strong>re</strong> Ltd., Tokyo, Japan.<br />
RD002<br />
Abstract: Recent enhancements in modern analytical instrumentation have dramatically<br />
improved the sensitivity of analysis. Trace elements a<strong>re</strong> now measu<strong>re</strong>d at ppt and sub-ppt levels.<br />
These levels can be achieved if ca<strong>re</strong>ful control of the analytical protocol is maintained.<br />
Contamination can <strong>re</strong>sult from anything that comes into contact with the sample; the laboratory<br />
environment, the air, and anything used during sample p<strong>re</strong>paration.<br />
Limits of detection down to ppt levels can be achieved if special ca<strong>re</strong> is taken with the<br />
experimental environment as well as with the quality of the <strong>re</strong>agents. This includes the ultrapu<strong>re</strong><br />
water used to run blanks, dilute samples or p<strong>re</strong>pa<strong>re</strong> standards.<br />
Part of this paper looks at the most sensitive multi-elemental analytical tool, i.e. Inductively<br />
Coupled Plasma Mass Spectrometry (ICP-MS). Some of the most common causes of interfe<strong>re</strong>nce<br />
will be <strong>re</strong>viewed, as well as ways of <strong>re</strong>ducing this interfe<strong>re</strong>nce by specific instrument<br />
developments and particular ca<strong>re</strong> taken during ICP-MS analysis.<br />
Sub-ppt values for limits of quantification a<strong>re</strong> achievable when the ultrapu<strong>re</strong> water used is<br />
produced by a system for which all parts have been ca<strong>re</strong>fully selected and whose configuration<br />
has been specifically developed for ultratrace purposes.<br />
This specific water purification system is described and typical values that can be achieved for<br />
blanks with ICP-MS technology a<strong>re</strong> shown.<br />
Introduction<br />
Due to newly developed instrumentation, limits of<br />
detection <strong>re</strong>ached by trace analysis a<strong>re</strong><br />
becoming lower and lower. Hyphenated<br />
techniques cur<strong>re</strong>ntly used for sample studies and<br />
element detection can now <strong>re</strong>ach ng/L levels and<br />
even pg/L levels when specific clean conditions<br />
and ca<strong>re</strong>ful experimental handling a<strong>re</strong> ensu<strong>re</strong>d.<br />
Consequently, instruments and <strong>re</strong>agents used for<br />
blank analysis, standard dilutions and sample<br />
p<strong>re</strong>parations need to be of the highest quality.<br />
A publication of the Laboratory Water Division of Millipo<strong>re</strong><br />
Depending on the elements studied and the<br />
environmental conditions of the analytical<br />
laboratory, various instrument configurations a<strong>re</strong><br />
possible.<br />
Flame or Electrothermal Atomic Absorption<br />
Spectroscopy (FAAS or ETAAS) and Inductively<br />
Coupled Plasma - Optical Emission Spectroscopy<br />
or Mass Spectrometry - (ICP-OES or ICP-MS) a<strong>re</strong><br />
the main technologies employed by trace analysis<br />
scientists 1,2 .
2<br />
Materials and Methods<br />
The Analytical instrument<br />
ICP-MS, choice tool for ultratrace analysis.<br />
Although technical advances a<strong>re</strong> improving the<br />
sensitivity and detection limits of most analytical<br />
techniques, instrumental limitations, such as difficulties<br />
in performing multi-elemental simultaneous studies, still<br />
<strong>re</strong>main in advanced analytical technologies 3 . This is<br />
why, in many applications, ICP-MS is often<br />
conside<strong>re</strong>d as the ideal instrument to perform fast,<br />
multi trace-elemental analyses 4 . This technology<br />
allows fast, qualitative analysis of unknown samples,<br />
and quantitative, multi-elemental analysis down to ppt<br />
(ng/L) and even ppq (pg/L) levels. Application fields<br />
whe<strong>re</strong> this instrument is a key tool a<strong>re</strong> quite varied:<br />
they include the medical a<strong>re</strong>a 5 , whe<strong>re</strong> heavy metals<br />
have a significant impact on health; the<br />
environmental field, with metal traceability 6 ; the<br />
nuclear world, with the ability to perform isotope<br />
ratio sc<strong>re</strong>enings and detect speciation; and the<br />
microelectronics industry, with ultratrace analysis in<br />
various high purity chemicals, including ultrapu<strong>re</strong><br />
water 7,8,9 . Major softwa<strong>re</strong> development comes with<br />
ICP-MS instruments. However, this method still<br />
<strong>re</strong>qui<strong>re</strong>s skill and specific experimental conditions in<br />
acquiring and interp<strong>re</strong>ting data. The actual detection<br />
limits depend on the element, the matrix, the sample<br />
p<strong>re</strong>paration and the condition of the instrument.<br />
P<strong>re</strong>cise method protocols and experimental<br />
conditions a<strong>re</strong> developed to perform some specific<br />
element determinations 10 .<br />
Interfe<strong>re</strong>nce and contamination<br />
Most of the experimental optimization includes the<br />
special ca<strong>re</strong> needed to minimize contamination. It<br />
follows that blank optimization, necessary to the<br />
newly targeted sub-ppt limits of detection, <strong>re</strong>qui<strong>re</strong>s<br />
the <strong>re</strong>finement of sampling, processing and analytical<br />
techniques. For example, cur<strong>re</strong>nt analytical<br />
capabilities have often exceeded the capacity to<br />
collect both uncontaminated and <strong>re</strong>p<strong>re</strong>sentative<br />
environmental samples 11 .<br />
The accurate measu<strong>re</strong>ment of trace elements using<br />
ICP-MS with sub-ppt detection limits is achievable if<br />
one takes into account the possible limitations due to<br />
instrumental or experimental contamination and<br />
interfe<strong>re</strong>nce.<br />
Instrumental interfe<strong>re</strong>nce<br />
The R&D Notebook: Ultrapu<strong>re</strong> Water for Elemental Analysis down to ppt levels<br />
As far as the instrument itself is concerned, spectral<br />
interfe<strong>re</strong>nce, occurring when unwanted ions possess<br />
the same nominal m/z value as an analyte ion of<br />
inte<strong>re</strong>st (see Table 1), is one of the g<strong>re</strong>atest obstacles<br />
to ICP-MS analysis 12 .<br />
Two categories can be distinguished:<br />
* Background polyatomic interfe<strong>re</strong>nce coming from<br />
plasma gas, water from the sample aerosol and<br />
air in the plasma (For example 40 Ar 16 O and 56 Fe or<br />
40 Ar 35 Cl and 75 As).<br />
* Isobaric interfe<strong>re</strong>nce, due to elements p<strong>re</strong>senting<br />
isotopes of the same m/z ratio (example of 64 Zn<br />
and 64 Ni).<br />
Although most elemental ions a<strong>re</strong> singly charged<br />
within the plasma, doubly charged atomic ions<br />
can also cause interfe<strong>re</strong>nce (example of 138 Ba ++<br />
and 69 Ga).<br />
For isobaric interfe<strong>re</strong>nce, cor<strong>re</strong>ctions on peak<br />
intensity (I) can be applied taking natural isotopic<br />
abundance (a) into account and using <strong>re</strong>sults on<br />
other isotopes to establish the cor<strong>re</strong>ction.<br />
For example, for 64 Zn and 64 Ni interfe<strong>re</strong>nce, the<br />
calculation will be:<br />
I64 Zn (cor.) = I64 Zn(mes.) - (a64 Ni/a60 Ni)*I60 Ni<br />
Various experimental method and instrument<br />
developments have been dedicated to add<strong>re</strong>ssing<br />
the problems posed by polyatomic ion interfe<strong>re</strong>nce,<br />
such as the ShieldTorch that changes plasma<br />
conditions to significantly attenuate ionization thus<br />
<strong>re</strong>ducing the formation of polyatomic ions 13 .Analysis<br />
by less powe<strong>re</strong>d plasma allows the <strong>re</strong>duction of<br />
specific spectroscopic interfe<strong>re</strong>nce. Only species with<br />
an ionization potential below 8eV will undergo<br />
complete dissociation. This “cold plasma” analysis is<br />
often used for elements such as 23 Na, 39 K, 40 Ca and<br />
56 Fe 14 .<br />
Other interfe<strong>re</strong>nce is inhe<strong>re</strong>nt to the instrument used.<br />
First of all, matrix effects can lead to a signal drift<br />
due to a modification of the surface of the skimmer<br />
cone of the ICP-MS, (interface between the torch and<br />
the mass spectrograph). This <strong>re</strong>sults in a change in<br />
the ionization characteristics inside the plasma torch,<br />
which modifies the system sensitivity. Finally, some<br />
memory effects of specific elements, such as Mercury<br />
(Hg), Iodine (I) and Boron (B) will <strong>re</strong>qui<strong>re</strong> appropriate
atomic ion potential interfe<strong>re</strong>nce<br />
39 + K<br />
40 + Ca<br />
56 + Fe<br />
63 + Cu<br />
63 + Ni (radioactive isotope)<br />
74 + Ge<br />
75 + As<br />
89 + Y<br />
99 + Tc (radioactive isotope)<br />
106 + Pd<br />
+121 + Sb<br />
127 + I<br />
114 + Cd<br />
129 + I (radioactive isotope)<br />
133 + Cs<br />
138 + Ba<br />
139 + La<br />
141 + Pr<br />
187 + Re<br />
238 + Pu (radioactive isotope)<br />
Table 1: Some atomic ions and potential interfe<strong>re</strong>nce<br />
38 Ar 1 H +<br />
40 Ar +<br />
40 16 + Ar O<br />
62 1 + Ni H<br />
63 + Cu<br />
74 + Se<br />
40 35 + Ar Cl<br />
40 49 + Ar Ti<br />
99 + Ru<br />
106 + Cd<br />
105 16 + Pd O<br />
110 16 1 + Cd O H<br />
114 + Sn<br />
129 + Xe<br />
116 16 1 + Cd O H<br />
124 14 + Te N<br />
122 16 1 + Sn O H<br />
124 16 1 + Sn O H<br />
187 + Os<br />
238 + U<br />
rinsing solutions. In addition to these instrumental<br />
limitations, the way the experiment is performed, the<br />
quality of the <strong>re</strong>agents used and the environmental<br />
conditions while performing the analysis a<strong>re</strong> of key<br />
importance.<br />
The Water Purification System<br />
Blank levels of a given element a<strong>re</strong> affected by such<br />
factors as the purity of sample-t<strong>re</strong>ating solutions,<br />
container purity and the general analytical<br />
environment. Among the various <strong>re</strong>agents used during<br />
the key steps of blank, standards and sample<br />
p<strong>re</strong>paration, is ultrapu<strong>re</strong> water. Investigations a<strong>re</strong><br />
often performed on the background obtained while<br />
aspirating air, pu<strong>re</strong> acid or ultrapu<strong>re</strong> water. Ultrapu<strong>re</strong><br />
water such as that produced by a Milli-Q ® system,<br />
causes less spectral interfe<strong>re</strong>nce than high quality<br />
nitric acid. Although this acid is purified by subboiling,<br />
the trace element concentrations a<strong>re</strong> still<br />
above those of ultrapu<strong>re</strong> water 15 . It is clear that<br />
18.2MΩ.cm is no longer a “quality certification”<br />
value. Studies concerning ultratrace analysis show<br />
that blank optimization is only achievable when<br />
ultrapu<strong>re</strong> water with sub-ppt level contamination for<br />
most of the elements is used. Contamination risks a<strong>re</strong><br />
g<strong>re</strong>atly inc<strong>re</strong>ased when the ultrapu<strong>re</strong> water is sto<strong>re</strong>d.<br />
Results clearly indicate that the quality of high purity<br />
water degrades with storage time 16 . In addition to<br />
clean air, the laboratory needs an ultrapu<strong>re</strong> water<br />
supply, and the analytical instrument, or at least the<br />
sample p<strong>re</strong>paration station, should be located close<br />
to the water outlet.<br />
The P<strong>re</strong>t<strong>re</strong>atment System<br />
Production of high quality ultrapu<strong>re</strong> water <strong>re</strong>qui<strong>re</strong>s a<br />
combination of technologies to process tap water to<br />
ultrapu<strong>re</strong> water. Water is first purified through a system<br />
including <strong>re</strong>verse osmosis and electrodeionization<br />
(EDI). This EDI technology is a key step in the<br />
production of ion-f<strong>re</strong>e water. The EDI module, whe<strong>re</strong> a<br />
di<strong>re</strong>ct cur<strong>re</strong>nt voltage is applied to the <strong>re</strong>sin-containing<br />
cells, maintains consistent water quality with no<br />
significant fluctuations due to changes in feed water<br />
ion concentration. The high <strong>re</strong>sistivity water produced,<br />
p<strong>re</strong>sents a low ionic challenge to ultrapu<strong>re</strong> polishing<br />
<strong>re</strong>sins. The hydrolysis and ion <strong>re</strong>moval in the EDI<br />
module <strong>re</strong>sult in a steady-state operation of the <strong>re</strong>sin<br />
without exhaustion or the need for <strong>re</strong>generation. A<br />
mo<strong>re</strong> complete description of this RO/EDI t<strong>re</strong>atment,<br />
performed in a system called Elix ® , has been p<strong>re</strong>viously<br />
published 17 . This purified water is then processed in a<br />
polishing system whe<strong>re</strong> additional technologies<br />
produce the ultrapu<strong>re</strong> water suited to ultratrace<br />
analysis. Elix water is sto<strong>re</strong>d in an intermediate<br />
<strong>re</strong>servoir to provide an adequate flow rate to feed<br />
ultrapu<strong>re</strong> water systems. Numerous tests we<strong>re</strong><br />
performed to select the right materials of construction,<br />
to define the <strong>re</strong>servoir design and finally to limit water<br />
degradation during storage. As a <strong>re</strong>sult of these tests,<br />
polyethylene with low extractable levels was selected<br />
for the container; a blowmolding process was chosen<br />
to ensu<strong>re</strong> smooth and <strong>re</strong>gular inner surfaces for the<br />
conical <strong>re</strong>servoir and a vent filter containing activated<br />
carbon and soda lime was developed 18 .<br />
The Ultrapu<strong>re</strong> Water Polishing System<br />
The ultrapu<strong>re</strong> water system uses high quality ionexchange<br />
mixed bed <strong>re</strong>sin in a pu<strong>re</strong> natural<br />
polypropylene housing selected for its low leaching<br />
characteristics.<br />
The best ultrapu<strong>re</strong> water to optimize blanks and<br />
p<strong>re</strong>pa<strong>re</strong> standards is obtained by adding UV photooxidation<br />
technology within the water system.<br />
A 185/254 nm UV lamp placed upst<strong>re</strong>am of the<br />
polishing packs ensu<strong>re</strong>s the destruction of organics,<br />
including those with trapped metals. The <strong>re</strong>leased<br />
elements can then be <strong>re</strong>tained by the ion exchange<br />
<strong>re</strong>sins. A <strong>re</strong>sin for the specific <strong>re</strong>moval of boron is<br />
included in the first purification pack.<br />
Additionally, an accurate <strong>re</strong>sistivity meter is placed<br />
The R&D Notebook: Ultrapu<strong>re</strong> Water for Elemental Analysis down to ppt levels<br />
3
4<br />
upst<strong>re</strong>am of the final polishing cartridge that contains<br />
mixed-bed <strong>re</strong>sins (Quantum IX) in order to monitor the<br />
very first ionic <strong>re</strong>lease from the first purification pack (Q-<br />
Gard B1). Final filtration is ensu<strong>re</strong>d through a 0.1 µm<br />
filter, containing a membrane specifically designed for<br />
critical ultratrace applications. This membrane is made<br />
of ultra high molecular weight polyethylene (UHMWPE<br />
filter). The specific membrane charged structu<strong>re</strong><br />
<strong>re</strong>moves colloidal traces .<br />
The flow schematic of this water purification system<br />
called Milli-Q Element is shown in figu<strong>re</strong> 1.<br />
UV lamp <strong>re</strong>sistivity cell Mixed bed <strong>re</strong>sins<br />
pump boron <strong>re</strong>moval<br />
<strong>re</strong>sin<br />
Millipak<br />
Automatic<br />
footswitch<br />
valve<br />
To laminar<br />
flow hood<br />
Figu<strong>re</strong> 1: Flow schematic of the Milli-Q Element water purification system for<br />
ultratrace analysis.<br />
To be able to collect the ultrapu<strong>re</strong> water di<strong>re</strong>ctly under<br />
a laminar hood, with ease and limited contamination<br />
risks, a th<strong>re</strong>e-meter distance can separate the main<br />
system cabinet and the point of use. The delivery of<br />
water is ensu<strong>re</strong>d via an automatic footswitch solenoid<br />
valve.<br />
Analytical Method<br />
Experimental Requi<strong>re</strong>ments<br />
Q-Gard B1 Quantum IX<br />
UHMWPE filter<br />
Sample and/or laboratory contamination can affect the<br />
accuracy of trace metal analysis. Special ca<strong>re</strong> must be<br />
taken with the experimental environment, this includes the<br />
quality of the <strong>re</strong>agent used 19 . Mo<strong>re</strong>over, most of the<br />
contamination can <strong>re</strong>sult from anything that comes into<br />
contact with the sample, including glasswa<strong>re</strong>, the<br />
laboratory environment, the air, and anything used<br />
during sample p<strong>re</strong>paration. Even cleanroom gloves can<br />
p<strong>re</strong>sent significant metal contamination 20 .<br />
P<strong>re</strong>cise washing protocols a<strong>re</strong> thus established in order to<br />
<strong>re</strong>move any contamination coming from the various<br />
containers used to p<strong>re</strong>pa<strong>re</strong> samples and standards. High<br />
quality plastic bottles, mainly polyethylene (PE),<br />
perfluoroalkoxy (PFA) or fluorinated ethylenepropylene<br />
(FEP) a<strong>re</strong> used throughout all sampling and analysis<br />
procedu<strong>re</strong>s. Several acid and ultrapu<strong>re</strong> water washing<br />
steps should be performed prior to running the<br />
Sample p<strong>re</strong>paration<br />
Maximum p<strong>re</strong>cautions should be taken in order to<br />
avoid contamination from the environment, the<br />
<strong>re</strong>agents and the containers used. Cleanroom<br />
laboratories or laminar hoods a<strong>re</strong> the most popular<br />
ways to minimize external effects.<br />
While p<strong>re</strong>paring standards and samples, it is<br />
essential to avoid contact between the solutions and<br />
the outside environment. The use of a polyethylene<br />
cover to protect the sampling bottle, p<strong>re</strong>vents<br />
particulate contamination while loading the sample<br />
into the analyzer (see figu<strong>re</strong> 2).<br />
od 6mm<br />
id 4mm tube<br />
The R&D Notebook: Ultrapu<strong>re</strong> Water for Elemental Analysis down to ppt levels<br />
experiment in order to avoid further leaching from the<br />
vials 21 . The impact of contamination coming from the<br />
various vials, or sample adsorption on the walls of such<br />
containers, have led scientists performing ultratrace<br />
analysis to develop cleaning steps for materials 22 . The<br />
procedu<strong>re</strong> followed by scientists working in the<br />
Glaciology field is given he<strong>re</strong>after as an example 23 :“LDPE<br />
bottles for storage of samples and plastic tools we<strong>re</strong> acid<br />
cleaned in the class 100 environment [...]. Briefly, items<br />
we<strong>re</strong> cleaned as follows: rough rinse with tap water to<br />
<strong>re</strong>move dust; deg<strong>re</strong>ase with chloroform and rinsing with<br />
ultrapu<strong>re</strong> water; immersion in a first acid bath,<br />
(HNO3/ultrapu<strong>re</strong> water 1/3, 50°C, 2 weeks),and<br />
rinsing with ultrapu<strong>re</strong> water; immersion in a second acid<br />
bath (HNO3/ultrapu<strong>re</strong>water 1/1000, 50°C, two<br />
weeks) and rinsing with ultrapu<strong>re</strong> water; immersion in a<br />
third acid bath (HNO3/ultrapu<strong>re</strong> water 1/1000, 50°C,<br />
two weeks); finally, bottles a<strong>re</strong> rinsed several times with<br />
ultrapu<strong>re</strong> water, filled with a diluted ultrapu<strong>re</strong> HNO3 f<strong>re</strong>sh<br />
solution and sto<strong>re</strong>d inside double polyethylene acid<br />
clean bags”.<br />
Washing steps a<strong>re</strong> even mo<strong>re</strong> important in the<br />
Microelectronics industry, whe<strong>re</strong> efficient rinsing protocols<br />
should be employed after wafer-cleaning steps 24 .<br />
PE cover<br />
sample bottle<br />
Figu<strong>re</strong> 2: Schematic of “clean” sample introduction.<br />
sampling tube to analyzer<br />
Standard p<strong>re</strong>parations <strong>re</strong>qui<strong>re</strong> several dilutions of<br />
commercially available solutions. Only ppm
concentration levels a<strong>re</strong> available due to storage<br />
degradation of diluted solutions. Standard and<br />
sample p<strong>re</strong>parations should be run simultaneously in<br />
order to get similar contamination effects, if any.<br />
Advances in analytical equipment now allow<br />
simultaneous multi-elemental analysis that in turn<br />
<strong>re</strong>qui<strong>re</strong>s multi-elemental standard solutions. The<br />
analysis of fifteen elements at one time means the<br />
need for 15 solutions. This operation in itself entails<br />
some risks of contamination. The purity of standard<br />
solutions needs to be high, because sometimes<br />
standard solutions of a given element can be polluted<br />
by other elements, for instance, by poor handling<br />
techniques. In addition, some incor<strong>re</strong>ct mixtu<strong>re</strong>s of<br />
one to another may cause chemical <strong>re</strong>actions that<br />
<strong>re</strong>sult in p<strong>re</strong>cipitation. Mixed standard solutions a<strong>re</strong><br />
now available and <strong>re</strong>duce such risks.<br />
The multi-element solution used as a standard was<br />
SPEX (Cat. N° XSTC-331). It contains 28 elements<br />
and was used to perform the various calibration<br />
curves.<br />
Acidification of the diluted standard solution,<br />
sometimes of blank water and sample water, a<strong>re</strong><br />
indispensable to stabilize the elements in the solution.<br />
Nitric acid is commonly used for this purpose and has<br />
less influence on the analyzer as far as system<br />
interfe<strong>re</strong>nce is concerned. Many grades of nitric acid<br />
a<strong>re</strong> found in the catalogues of laboratory suppliers,<br />
the purity of some of the higher grade ones being<br />
certified by documents that can assist in<br />
contamination control. Because nitric acid has the<br />
ability to oxidize and dissolve chemicals, it tends to<br />
get much mo<strong>re</strong> polluted than standard solutions.<br />
Ultrapu<strong>re</strong> grade nitric acid (Kanto Kagaku) was used<br />
for acidification of standard solutions and dilutions.<br />
All sampling bottles have to be f<strong>re</strong>e of chemical<br />
extractables. As p<strong>re</strong>viously described, well-established<br />
cleaning protocols a<strong>re</strong> checked with a p<strong>re</strong>liminary<br />
extraction test on bottles. When samples a<strong>re</strong> kept<br />
acidified, the same nitric acid concentration is used to<br />
perform extractable tests. The adsorption phenomenon<br />
on the bottle walls should also be taken into account.<br />
For this study, all sampling bottles a<strong>re</strong> washed with<br />
successive ultrapu<strong>re</strong> water and nitric acid baths.<br />
ICP-MS conditions<br />
Simultaneous multi-elemental analysis <strong>re</strong>qui<strong>re</strong>s a single<br />
tuning setting that is adapted to all elements. Lower<br />
plasma power and ShieldTorch we<strong>re</strong> employed to<br />
<strong>re</strong>duce the production of mass interfe<strong>re</strong>nce ions, such<br />
as Ar, ArH or ArO. To see the sensitivity and linearity<br />
of the signal gain on each element, a p<strong>re</strong>liminary<br />
calibration curve was p<strong>re</strong>pa<strong>re</strong>d with standard additions<br />
at 20, 40 and 60 ppt (see figu<strong>re</strong> 3). Each element has<br />
a diffe<strong>re</strong>nt sensitivity that depends on the ionization<br />
efficiency in the plasma torch. Elements that have<br />
higher ionization potential tend to be less sensitive. In<br />
addition, lower plasma power limits ionization<br />
capacity. In some cases, this signal loss can be<br />
compensated by longer signal accumulation time on<br />
given elements.<br />
A good linearity was obtained up to 60 ppt<br />
concentration. No signal saturation at detector was<br />
observed in this range.<br />
signal, count<br />
35000<br />
30000<br />
25000<br />
20000<br />
15000<br />
10000<br />
5000<br />
0<br />
0 20 40<br />
concentration, ppt<br />
Figu<strong>re</strong> 3: ICP-MS calibration curves<br />
Data p<strong>re</strong>sented in the <strong>re</strong>sults a<strong>re</strong> obtained with cold<br />
plasma conditions in order to get information on ions<br />
that a<strong>re</strong> difficult to measu<strong>re</strong>. The ICP-MS configuration<br />
used is indicated in table 2.<br />
RF power (W) 600<br />
PF matching (V) 2.3<br />
sampling position (mm) 14.3<br />
torch horizontal position (mm) 0<br />
torch vertical position (mm) 0<br />
carrier gas flow (L/min) 1.19<br />
blend gas flow (L/min) 0.4<br />
peristaltic pump (rpm) 0.3<br />
spray chamber temp. (C) 0<br />
plasma torch quartz<br />
spray chamber quartz<br />
shield plate applied<br />
nebulizer quartz, co-axial type<br />
sampling tube PFA, id 0.15mm<br />
drawing electrode 1(V) -80<br />
drawing electrode 2 (V) -19<br />
einzel lens 1,3 (V) -80<br />
einzel lens 2 (V) -4<br />
omega vias (V) -100<br />
omega lens (+) (V) -8<br />
omega lens (-) (V) 3<br />
quadrupole focus (V) -2<br />
alternate electrode (V) 20<br />
AMU gain 115<br />
AMU offset 175<br />
mass axis gain 0.999<br />
mass axis offset 0<br />
plate vias (V) -10<br />
pole vias (V) -10<br />
discriminator (mV) 13<br />
EM voltage (V) -1700<br />
EM final stage (V) -278<br />
Table 2: HP 4500 ICP-MS conditions<br />
The R&D Notebook: Ultrapu<strong>re</strong> Water for Elemental Analysis down to ppt levels<br />
Na<br />
Li<br />
Al<br />
Fe<br />
Pb<br />
60 80<br />
5
6<br />
Results and Discussion<br />
P<strong>re</strong>liminary Study<br />
ICP-MS analysis with no element-specific optimization<br />
is performed on ultrapu<strong>re</strong> water and counts a<strong>re</strong><br />
<strong>re</strong>corded to get an idea of the achievable blanks.<br />
The addition of 10 ppt standards of the studied<br />
elements gives information on the achievable<br />
quantification limits (see table 3).<br />
The high counts generated for 40 Ca clearly show the<br />
interfe<strong>re</strong>nce due to 40 Ar and confirm that specific<br />
conditions must be applied to the ICP-MS instrument<br />
in order to perform sensitive and accurate calcium<br />
determinations.<br />
blank water + 10 ppt<br />
Element count %RSD count %RSD<br />
7Li 96.7 4.7 31500 1.0<br />
23Na 8390 3.1 92100 2.9<br />
24Mg 1840 4.7 16200 1.2<br />
27Al 710 2.7 20100 3.0<br />
39K 11800 1.1 20500 4.8<br />
40Ca 15200 3.9 16000 5.4<br />
44Ca 970 5.2 1560 2.6<br />
53Cr 293 7.1 943 5.8<br />
55Mn 3890 2.1 15800 3.8<br />
56Fe 1140 2.8 6310 6.3<br />
59Co 3680 4.1 10200 1.9<br />
60Ni 197 7.8 1820 5.8<br />
63Cu 360 4.2 4500 4.3<br />
Table 3: HP4500 ICP-MS data counts for ultrapu<strong>re</strong> water blanks and 10 ppt<br />
spikes with Relative Standard Deviation (RSD).<br />
Elemental analysis of Milli-Q ® Element water<br />
A significant number of experiments we<strong>re</strong> performed<br />
with a Milli-Q ® Element system fed by an Elix ® ‚ system.<br />
Results, indicated in ppt, a<strong>re</strong> shown in table 4. In<br />
each case, the limit of detection (DL) is taken as 3<br />
times the standard deviation of ten <strong>re</strong>plicates of a<br />
blank (Milli-Q SP ICP-MS water, Nihon Millipo<strong>re</strong> Ltd.,<br />
Japan), the limit of quantification (QL) being <strong>3.3</strong>3<br />
times this limit of detection (or 10σ).Values a<strong>re</strong> given<br />
for ultrapu<strong>re</strong> water samples, even when these a<strong>re</strong><br />
under limits of quantification.<br />
BEC cor<strong>re</strong>sponds to the Blank Equivalent<br />
Concentration calculated using linear calibration<br />
curves obtained with 0,50 and 100 ppt standard<br />
solutions for each element (figu<strong>re</strong> 4). Extrapolation to<br />
the x-axis (y=0) gives the BEC value and is a good<br />
indication of the level of contamination. The standard<br />
count<br />
40000<br />
30000<br />
20000<br />
10000<br />
count<br />
40000<br />
30000<br />
20000<br />
10000<br />
20000<br />
15000<br />
10000<br />
5000<br />
The R&D Notebook: Ultrapu<strong>re</strong> Water for Elemental Analysis down to ppt levels<br />
curve obtained for Ca clearly shows the limitation for<br />
this ion (due to instrumentation and experimental<br />
conditions). On the other hand, the good Fe <strong>re</strong>sults<br />
confirm the interfe<strong>re</strong>nce elimination with the chosen<br />
ICP-MS conditions as indicated in Material and<br />
Methods.<br />
count<br />
Li<br />
y = 355,2x + 45,81<br />
2 R =1<br />
0<br />
0 50 100 150<br />
ppt<br />
Na<br />
y = 359,6x + 544,4<br />
2 R = 0,9996<br />
0<br />
0 50 100 150<br />
ppt<br />
Ca<br />
y = 152,9x + 932,1<br />
2 R =0,9890<br />
0<br />
0 50 100 150<br />
ppt
count<br />
8000<br />
6000<br />
4000<br />
2000<br />
Fe<br />
y = 81,07x + 10,26<br />
2 R = 0,9998<br />
0<br />
0 50 100 150<br />
ppt<br />
Figu<strong>re</strong> 4: Some calibration curves<br />
As shown in table 4, very good <strong>re</strong>sults a<strong>re</strong> obtained<br />
in terms of low levels of elemental contamination. The<br />
ultrapu<strong>re</strong> water produced by a system combining all<br />
the advanced water purification technologies and<br />
used in a specifically clean and controlled<br />
environment, allows sub-ppt levels to be <strong>re</strong>ached for<br />
most elements.<br />
Element DL QL BEC Elix Ultrapu<strong>re</strong> Water<br />
3σ 10σ water<br />
7Li 0.008 0.027 0.13 0.34 0.034<br />
23Na 0.055 0.184 1.5 545.5 0.32<br />
24Mg 0.213 0.709 0.34 0.99 < QL (0.34)<br />
27Al 0.111 0.371 0.039 9.9 < QL(0.18)<br />
39K 0.247 0.825 5.9 36.2 5.2<br />
40Ca 1.369 4.563 6.1 12.14 6.8<br />
52 Cr 0.055 0.183 0.12 0.29 < QL(0.082)<br />
55 Mn 0.193 0.643 0.69 0.51 < QL(0.4)<br />
56 Fe 0.03 0.101 0.13 1.1 0.46<br />
59 Co 0.212 0.708 0.67 0.32 < QL(0.5)<br />
58 Ni 0.129 0.428 0.21 0.69 0.5<br />
63 Cu 0.032 0.106 0.53 1.38 < QL (0.067)<br />
64Zn 0.722 2.407 2.4 34.58 4.4<br />
208Pb 0.066 0.221 0.13 1.15 0.94<br />
Table 4: ICP-MS Blank quantification of some elements with ultrapu<strong>re</strong> water produced by the Milli-Q ® Element water purification system (all values in ppt).<br />
Conclusion and perspectives<br />
Taking the environmental field as an example, over the<br />
past 10 years, <strong>re</strong>ported background dissolved trace<br />
element concentrations have declined from tens of ppb<br />
(µg/L) ) through single digit ppb, to the ppt (ng/L) range.<br />
This in fact does not <strong>re</strong>flect improved water quality, but<br />
rather, <strong>re</strong>duction in contamination introduced during<br />
sampling, processing and analysis.<br />
These improved instrumental and experimental<br />
procedu<strong>re</strong>s highlight the impact of minute contamination.<br />
Consequently, the use of very high quality ultrapu<strong>re</strong> water<br />
is <strong>re</strong>qui<strong>re</strong>d to p<strong>re</strong>pa<strong>re</strong> blanks and standards, perform<br />
critical cleaning and run high sensitivity analyses.<br />
Being able to modulate the polishing cartridge<br />
composition according to the application allows blank<br />
optimization for trace analysis of a specific element such<br />
as boron. Other developments can also be gea<strong>re</strong>d to<br />
specific needs, such as the focus on Silica 25 for example.<br />
Additional added featu<strong>re</strong>s, such as the ability to operate<br />
the system with a footswitch, ensu<strong>re</strong> minimum cross<br />
contamination by other users and facilitate operation<br />
under a laminar hood.<br />
The combination of these diffe<strong>re</strong>nt advancements in<br />
instrumental and purification technologies has <strong>re</strong>sulted in<br />
a system that produces ultrapu<strong>re</strong> water suitable for<br />
ultratrace analysis at the sub-ppt levels.<br />
The R&D Notebook: Ultrapu<strong>re</strong> Water for Elemental Analysis down to ppt levels<br />
7
8<br />
Refe<strong>re</strong>nces<br />
1 Jackson K.W., Guoru C. “Atomic Absorption, Atomic Emission, and Flame Emission Spectrometry”, Analytical Chemistry 68 (12),<br />
pp 231R-256R (June 1996)<br />
2 Olesik J.W. “Fundamental Research in ICP-OES and ICP-MS”, Analytical Chemistry News & Featu<strong>re</strong>s (August 1996)<br />
3 Hoenig, M.; Cilissen, A. “Performances and Practical Applications of Simultaneous Multi-Element Electrothermal Atomic Absorption<br />
Spectrometry the Case of the SIMAA 6000”, Spectrochimica Acta, PART B 1715, (1997)<br />
4 Newman, A. ”Elements of ICP-MS”, Analytical Chemistry News & Featu<strong>re</strong>s, pp. 46A-51A (January 1996)<br />
5 Kawabata, K.; Takahashi, H.; Endo, G.; Inoue, Y. “Determination of Arsenic Species by Inductively Coupled Plasma Mass Spectrometry<br />
with Ion Chromatography”, Applied Organometallic Chemistry 8, pp. 245-248 (1994)<br />
6 Hurley, J.P.; Shafer, M.M.; Cowell, S.E.; Overdier, J.T.; Hughes P.E.; Armstrong, D.E. “Trace Metal Assessment of Lake Michigan Tributaries Using<br />
Low-Level Techniques”, Environmental Science & Technology 30 (6), pp. 2093-2098 (1996)<br />
7 Kawabata, K.; Kishi, Y.; Kawagushi, O.; Watanabe, Y.;Inoue, Y. “Determination of Ra<strong>re</strong>-Earth Elements by Inductively Coupled Plasma<br />
Mass Spectrometry with Ion Chromatography”, Analytical Chemistry 63(19), pp. 2137-2140 (October 1991)<br />
8 Kishi, Y.; Gomez, J.; Potter, D. “The Determination of Impurities in Sulfuric Acid by ICP-MS”, HP Application Note 5964-0142E,<br />
(May 1995)<br />
9 Yamanaka, K.; Gomez, J.; Kishi, Y.; Potter, D. “The Determination of Impurities in Nitric Acid and Hydrofluoric Acid by ICP-MS”,<br />
HP Application Note 5964-0142E, (May 1995)<br />
10 Woller, A.; Garraud, H.; Martin, F.; Donard, O.F.X.; Fodor, P. “Determination of Total Mercury in Sediments by Microwave-Assisted<br />
Digestion-Flow Injection-Inductively Coupled Plasma Mass Spectrometry”, Journal of Analytical Atomic Spectrometry 12, pp. 53-56<br />
(January 1997)<br />
11 Horowitz, A.J. “Some Thoughts on Problems Associated With Various Sampling Media for Environmental Monitoring”, The Analyst 122,<br />
pp.1193-1200 (November 1997)<br />
12 Milgram, K.E.; White, F.M.; Goodner, K.L.; Watson, C.H.; Koppenaal, D.W.; Barinaga, C.J.; Smith, B.H.; Winefordner, J.D.,<br />
Marshall, A.G. “High-Resolution Inductively Coupled Plasma Fourier Transform Ion Cyclotron Resonance Mass Spectrometry”,<br />
Analytical Chemistry 69(18), pp. 3714-3721 (September 1997)<br />
13 Sakata, K.; Kawabata, K. “Reduction of Polyatomic Ions in Inductively Coupled Plasma Mass Spectrometry”, Spectrochimica Acta 49B(10),<br />
pp. 1027-1038 (1994)<br />
14 Tanner, S.D.; Paul, M.; Be<strong>re</strong>s, S.A.; Denoyer, E.R. “The Application of Cold Plasma Conditions for the Determination of Trace Levels of Fe,<br />
Ca, K, Na, and Li by ICP-MS” Atomic Spectroscopy<br />
15 Probst, T.U “Studies on the long-term stabilities of the background of radionuclides in inductively coupled plasma mass spectrometry<br />
(ICP-MS); A <strong>re</strong>view of radionuclide determination by ICP-MS”, F<strong>re</strong>senius journal of Analytical Chemistry 354, pp. 782-787 (January 1996)<br />
16 Gabler, R.; Hegde, R.; Hughes, D. “Degradation of High-Purity Water on Storage”, Journal of Liquid Chromatography 6(13),<br />
pp. 2565-2570 (1983)<br />
17 Stewart, B.M., Darbou<strong>re</strong>t D. “Advancements in the production of ultrapu<strong>re</strong> water for ICP-MS metals analysis”, American Laboratory News<br />
30 (9), pp 36-38 (April 1998)<br />
18 Darbou<strong>re</strong>t, D.; Kano, I.; Youf, E.; Stewart, B.M. “Optimizing storage of High Purity Water” Millipo<strong>re</strong> Laboratory Water Division :<br />
R&D Notebook RD001 , (June 1998)<br />
19 Kocherlakota, N.; Lamothe, D.; Obenauf, R., Noonan, J. “Standard Requi<strong>re</strong>ments for ppt Analysis of Trace Metals”, American Environmental<br />
Lab (November December 1995)<br />
20 Hartzell, A.; Rose, J.; Liu, D.; McPherson, P.; O’Shaughnessy, M.; Seeley, C.; Burt, R. “Cor<strong>re</strong>lating extraction and Contaminate-transfer Test<br />
Results for Cleanroom Gloves” Microcontamination , pp 69-78 (October 1996)<br />
21 Kammin, W.R.; Cull, S.; Knox, R.; Ross, J.; McIntosh, M., Thomson, D. “Labwa<strong>re</strong> Cleaning Protocols for the Determination of Low-Level<br />
Metals by ICP-MS”, American Environmental Lab pp. 5 -7 (November December 1995)<br />
22 Takenaka, M.; Hayashi, M.; Suzuki, I., Yamada, Y.; Takamatsu, K.; Kageyama, M. “Evaluation of a Mirror-Polishing Technique for<br />
Fluorocarbon Polymer Surfaces for Reduction of Contamination from Containers Used in Ultratrace Analysis”, Analytical Chemistry 69(5),<br />
pp. 972-976 (March 1997)<br />
23 Barbante, C.; Bellomi, T.; Mezzadri, G.; Cescon, P.; Scarponi, G.; Mo<strong>re</strong>l, C.; Jay, S.; Van de Velde, K.; Ferrari, C.; Boutron, C.F. “Di<strong>re</strong>ct<br />
Determination of Heavy Metals at Picogram per Gram Levels in G<strong>re</strong>enland and Antarctic Snow by Double Focusing Inductively Coupled Plasma Mass<br />
Spectrometry”, Journal of Analytical Atomic Spectrometry 12 , pp 925-931 (September 1997)<br />
24 Small, R.J.; Peterson, M.L.; Robles, A.; Kempa, D.; Knittel, J. “Using a Buffe<strong>re</strong>d Rinse Solution to Minimize Metal Contamination after Wafer Cleaning”,<br />
MICRO, pp. 61-67 (January 1998)<br />
25 Chu, T.; Balasz, M.K. “Determination of Total Silica at ppb Levels in High-Purity Water by Th<strong>re</strong>e Diffe<strong>re</strong>nt Analytical Techniques”, ULTRAPURE WATER<br />
(February 1994)<br />
Lit.No. RD002. Printed in France, 12/98. Copyright © 1998,<br />
Millipo<strong>re</strong> Corporation or an affiliated Company, Bedford, MA, U.S.A. Millipo<strong>re</strong> is a <strong>re</strong>giste<strong>re</strong>d trademark of Millipo<strong>re</strong> Corporation or an affiliated company.<br />
Milli-Q, Elix, Milli-Q Element, Millipak, Quantum and Q-Gard a<strong>re</strong> trademarks of Millipo<strong>re</strong> Corporation or an affiliated company.<br />
HP 4500 and ShieldTorch a<strong>re</strong> trademarls of Hewlett Packard Co., Wilmington, Del.<br />
The R&D Notebook: Ultrapu<strong>re</strong> Water for Elemental Analysis down to ppt levels<br />
Editonic - RCS Versailles : 93B02403 - Tél. : 01 30 48 91 00