WEALTH, DISPOSABLE INCOME AND CONSUMPTION - Economics
WEALTH, DISPOSABLE INCOME AND CONSUMPTION - Economics
WEALTH, DISPOSABLE INCOME AND CONSUMPTION - Economics

Create successful ePaper yourself
Turn your PDF publications into a flip-book with our unique Google optimized e-Paper software.
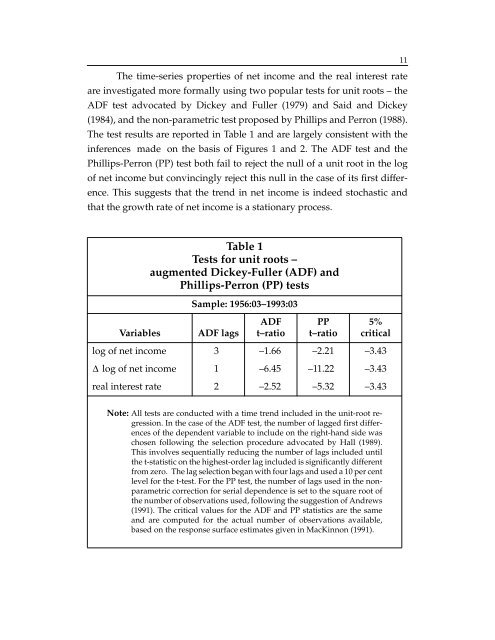
The time-series properties of net income and the real interest rate<br />
are investigated more formally using two popular tests for unit roots – the<br />
ADF test advocated by Dickey and Fuller (1979) and Said and Dickey<br />
(1984), and the non-parametric test proposed by Phillips and Perron (1988).<br />
The test results are reported in Table 1 and are largely consistent with the<br />
inferences made on the basis of Figures 1 and 2. The ADF test and the<br />
Phillips-Perron (PP) test both fail to reject the null of a unit root in the log<br />
of net income but convincingly reject this null in the case of its first difference.<br />
This suggests that the trend in net income is indeed stochastic and<br />
that the growth rate of net income is a stationary process.<br />
Table 1<br />
Tests for unit roots –<br />
augmented Dickey-Fuller (ADF) and<br />
Phillips-Perron (PP) tests<br />
Variables ADF lags<br />
Sample: 1956:03–1993:03<br />
ADF<br />
t–ratio<br />
PP<br />
t–ratio<br />
5%<br />
critical<br />
log of net income 3 –1.66 –2.21 –3.43<br />
Δ<br />
log of net income 1 –6.45 –11.22 –3.43<br />
real interest rate 2 –2.52 –5.32 –3.43<br />
Note: All tests are conducted with a time trend included in the unit-root regression.<br />
In the case of the ADF test, the number of lagged first differences<br />
of the dependent variable to include on the right-hand side was<br />
chosen following the selection procedure advocated by Hall (1989).<br />
This involves sequentially reducing the number of lags included until<br />
the t-statistic on the highest-order lag included is significantly different<br />
from zero. The lag selection began with four lags and used a 10 per cent<br />
level for the t-test. For the PP test, the number of lags used in the nonparametric<br />
correction for serial dependence is set to the square root of<br />
the number of observations used, following the suggestion of Andrews<br />
(1991). The critical values for the ADF and PP statistics are the same<br />
and are computed for the actual number of observations available,<br />
based on the response surface estimates given in MacKinnon (1991).<br />
11